Project
GNF SymAtlas + NCI-60 cancer cell lines, human (Su, 2004; Ross, 2000)
Navigation
Downloads
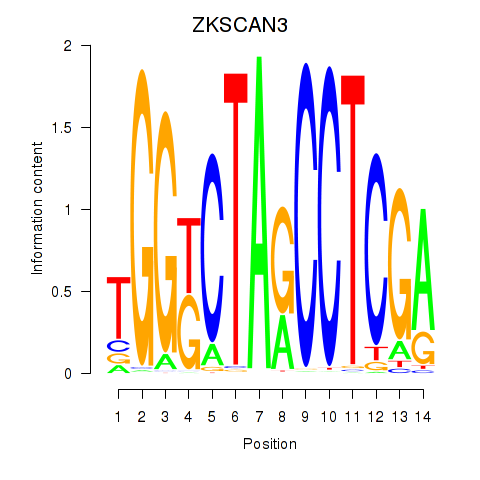
Results for ZKSCAN3
Z-value: 0.41
Motif logo
Transcription factors associated with ZKSCAN3
| Gene Symbol | Gene ID | Gene Info |
|---|---|---|
|
ZKSCAN3
|
ENSG00000189298.14 | ZKSCAN3 |
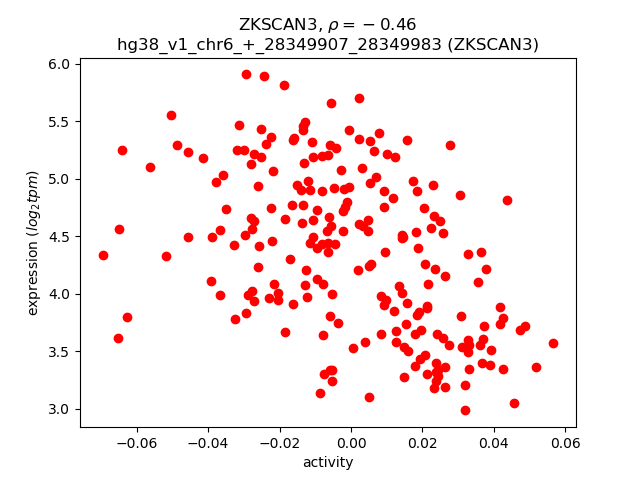
Activity-expression correlation:
| Gene | Promoter | Pearson corr. coef. | P-value | Plot |
|---|---|---|---|---|
| ZKSCAN3 | hg38_v1_chr6_+_28349907_28349983 | -0.46 | 1.0e-12 | Click! |
Activity profile of ZKSCAN3 motif
Sorted Z-values of ZKSCAN3 motif
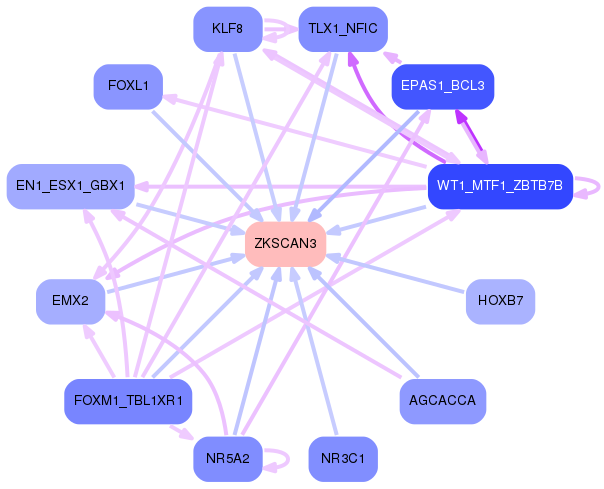
Network of associatons between targets according to the STRING database.

First level regulatory network of ZKSCAN3
| Promoter | Score | Transcript | Gene | Gene Info |
|---|---|---|---|---|
| chr15_-_72231583 | 11.96 |
ENST00000566809.1
ENST00000567087.5 ENST00000569050.1 ENST00000568883.5 |
PKM
|
pyruvate kinase M1/2 |
| chr15_-_72231113 | 11.33 |
ENST00000565154.6
ENST00000565184.6 ENST00000335181.10 |
PKM
|
pyruvate kinase M1/2 |
| chr1_-_19484635 | 8.65 |
ENST00000433834.5
|
CAPZB
|
capping actin protein of muscle Z-line subunit beta |
| chr11_-_64246190 | 6.17 |
ENST00000392210.6
|
PPP1R14B
|
protein phosphatase 1 regulatory inhibitor subunit 14B |
| chr11_-_64245816 | 6.01 |
ENST00000542235.1
|
PPP1R14B
|
protein phosphatase 1 regulatory inhibitor subunit 14B |
| chr2_+_190880834 | 5.41 |
ENST00000338435.8
|
GLS
|
glutaminase |
| chr16_-_28495519 | 4.87 |
ENST00000569430.7
|
CLN3
|
CLN3 lysosomal/endosomal transmembrane protein, battenin |
| chr6_-_31540536 | 4.62 |
ENST00000376177.6
|
DDX39B
|
DExD-box helicase 39B |
| chr17_+_38752731 | 4.49 |
ENST00000619426.5
ENST00000610434.4 |
PSMB3
|
proteasome 20S subunit beta 3 |
| chr15_-_41332487 | 4.46 |
ENST00000560640.1
ENST00000220514.8 |
OIP5
|
Opa interacting protein 5 |
| chr19_-_2328573 | 4.02 |
ENST00000587502.2
ENST00000252622.15 ENST00000585409.2 |
LSM7
|
LSM7 homolog, U6 small nuclear RNA and mRNA degradation associated |
| chr14_-_106130061 | 3.51 |
ENST00000390602.3
|
IGHV3-13
|
immunoglobulin heavy variable 3-13 |
| chr12_+_71754834 | 3.47 |
ENST00000261263.5
|
RAB21
|
RAB21, member RAS oncogene family |
| chr1_-_19485502 | 3.46 |
ENST00000264203.7
ENST00000375144.6 ENST00000674432.1 ENST00000264202.8 |
CAPZB
|
capping actin protein of muscle Z-line subunit beta |
| chr14_-_106675544 | 3.00 |
ENST00000390632.2
|
IGHV3-66
|
immunoglobulin heavy variable 3-66 |
| chr1_-_19485468 | 2.98 |
ENST00000375142.5
|
CAPZB
|
capping actin protein of muscle Z-line subunit beta |
| chr22_+_49918733 | 2.79 |
ENST00000407217.7
ENST00000403427.3 |
CRELD2
|
cysteine rich with EGF like domains 2 |
| chr20_-_59042748 | 2.69 |
ENST00000355937.9
ENST00000371033.9 |
PRELID3B
|
PRELI domain containing 3B |
| chr14_-_106389858 | 2.65 |
ENST00000390617.2
|
IGHV3-35
|
immunoglobulin heavy variable 3-35 (non-functional) |
| chr7_+_155298561 | 2.55 |
ENST00000476756.1
|
INSIG1
|
insulin induced gene 1 |
| chr1_+_93448108 | 2.42 |
ENST00000271234.13
ENST00000260506.12 |
FNBP1L
|
formin binding protein 1 like |
| chr14_-_106593319 | 2.22 |
ENST00000390627.3
|
IGHV3-53
|
immunoglobulin heavy variable 3-53 |
| chr12_+_109098118 | 2.19 |
ENST00000336865.6
|
UNG
|
uracil DNA glycosylase |
| chr1_+_93448155 | 2.17 |
ENST00000370253.6
|
FNBP1L
|
formin binding protein 1 like |
| chr22_+_49918626 | 1.99 |
ENST00000328268.9
ENST00000404488.7 |
CRELD2
|
cysteine rich with EGF like domains 2 |
| chr6_+_32968557 | 1.86 |
ENST00000374825.9
|
BRD2
|
bromodomain containing 2 |
| chr1_+_226062704 | 1.59 |
ENST00000366814.3
ENST00000366815.10 ENST00000655399.1 ENST00000667897.1 |
H3-3A
|
H3.3 histone A |
| chr6_+_42929430 | 1.04 |
ENST00000372836.5
|
CNPY3
|
canopy FGF signaling regulator 3 |
| chr7_-_151210488 | 0.51 |
ENST00000644661.2
|
H2BE1
|
H2B.E variant histone 1 |
| chr10_+_122163426 | 0.51 |
ENST00000360561.7
|
TACC2
|
transforming acidic coiled-coil containing protein 2 |
| chr15_+_74318553 | 0.43 |
ENST00000558821.5
ENST00000268082.4 |
CCDC33
|
coiled-coil domain containing 33 |
| chr17_+_34270213 | 0.10 |
ENST00000378569.2
ENST00000394627.5 ENST00000394630.3 |
CCL7
|
C-C motif chemokine ligand 7 |
| chr2_+_190880809 | 0.03 |
ENST00000320717.8
|
GLS
|
glutaminase |
Gene Ontology Analysis
Gene overrepresentation in biological process category:
| Log-likelihood per target | Total log-likelihood | Term | Description |
|---|---|---|---|
| 2.9 | 23.3 | GO:0042866 | pyruvate biosynthetic process(GO:0042866) |
| 2.2 | 15.1 | GO:0051490 | negative regulation of filopodium assembly(GO:0051490) |
| 1.6 | 4.9 | GO:0035752 | lysosomal lumen pH elevation(GO:0035752) |
| 0.9 | 5.4 | GO:0006543 | glutamine catabolic process(GO:0006543) |
| 0.8 | 2.5 | GO:1901301 | regulation of cargo loading into COPII-coated vesicle(GO:1901301) |
| 0.5 | 4.6 | GO:2000002 | negative regulation of DNA damage checkpoint(GO:2000002) |
| 0.3 | 4.6 | GO:0030050 | vesicle transport along actin filament(GO:0030050) |
| 0.2 | 3.5 | GO:2000643 | positive regulation of early endosome to late endosome transport(GO:2000643) |
| 0.2 | 2.2 | GO:0045008 | depyrimidination(GO:0045008) |
| 0.1 | 4.5 | GO:0061641 | chromatin remodeling at centromere(GO:0031055) CENP-A containing nucleosome assembly(GO:0034080) CENP-A containing chromatin organization(GO:0061641) |
| 0.1 | 4.0 | GO:0043928 | exonucleolytic nuclear-transcribed mRNA catabolic process involved in deadenylation-dependent decay(GO:0043928) |
| 0.1 | 11.4 | GO:0006958 | complement activation, classical pathway(GO:0006958) |
| 0.0 | 4.5 | GO:0006521 | regulation of cellular amino acid metabolic process(GO:0006521) |
| 0.0 | 2.7 | GO:0015914 | phospholipid transport(GO:0015914) |
| 0.0 | 1.9 | GO:0006334 | nucleosome assembly(GO:0006334) |
| 0.0 | 0.1 | GO:2000503 | positive regulation of natural killer cell chemotaxis(GO:2000503) |
Gene overrepresentation in cellular component category:
| Log-likelihood per target | Total log-likelihood | Term | Description |
|---|---|---|---|
| 1.3 | 15.1 | GO:0071203 | F-actin capping protein complex(GO:0008290) WASH complex(GO:0071203) |
| 0.7 | 8.6 | GO:0005688 | U6 snRNP(GO:0005688) |
| 0.6 | 2.5 | GO:0032937 | SREBP-SCAP-Insig complex(GO:0032937) |
| 0.4 | 3.5 | GO:0098559 | cytoplasmic side of early endosome membrane(GO:0098559) |
| 0.3 | 4.5 | GO:0019774 | proteasome core complex, beta-subunit complex(GO:0019774) |
| 0.2 | 4.5 | GO:0010369 | chromocenter(GO:0010369) |
| 0.1 | 5.6 | GO:0042571 | immunoglobulin complex, circulating(GO:0042571) |
| 0.1 | 23.3 | GO:0101002 | ficolin-1-rich granule(GO:0101002) ficolin-1-rich granule lumen(GO:1904813) |
| 0.1 | 4.9 | GO:0005776 | autophagosome(GO:0005776) |
| 0.0 | 3.5 | GO:0072562 | blood microparticle(GO:0072562) |
| 0.0 | 4.6 | GO:0005938 | cell cortex(GO:0005938) |
Gene overrepresentation in molecular function category:
| Log-likelihood per target | Total log-likelihood | Term | Description |
|---|---|---|---|
| 5.8 | 23.3 | GO:0004743 | pyruvate kinase activity(GO:0004743) |
| 0.9 | 5.4 | GO:0004359 | glutaminase activity(GO:0004359) |
| 0.9 | 2.7 | GO:1990050 | phosphatidic acid transporter activity(GO:1990050) |
| 0.5 | 4.6 | GO:0030621 | U4 snRNA binding(GO:0030621) |
| 0.3 | 4.0 | GO:0017070 | U6 snRNA binding(GO:0017070) |
| 0.2 | 12.2 | GO:0004864 | protein phosphatase inhibitor activity(GO:0004864) |
| 0.2 | 2.2 | GO:0004844 | uracil DNA N-glycosylase activity(GO:0004844) deaminated base DNA N-glycosylase activity(GO:0097506) |
| 0.2 | 4.5 | GO:0004298 | threonine-type endopeptidase activity(GO:0004298) threonine-type peptidase activity(GO:0070003) |
| 0.1 | 5.6 | GO:0034987 | immunoglobulin receptor binding(GO:0034987) |
| 0.1 | 15.1 | GO:0051015 | actin filament binding(GO:0051015) |
| 0.0 | 1.9 | GO:0070577 | lysine-acetylated histone binding(GO:0070577) |
| 0.0 | 3.5 | GO:0019003 | GDP binding(GO:0019003) |
| 0.0 | 4.9 | GO:0051082 | unfolded protein binding(GO:0051082) |
| 0.0 | 5.3 | GO:0003823 | antigen binding(GO:0003823) |
| 0.0 | 0.1 | GO:0031726 | CCR1 chemokine receptor binding(GO:0031726) |
Gene overrepresentation in curated gene sets: canonical pathways category:
| Log-likelihood per target | Total log-likelihood | Term | Description |
|---|---|---|---|
| 0.1 | 12.2 | PID ILK PATHWAY | Integrin-linked kinase signaling |
| 0.0 | 4.8 | NABA ECM GLYCOPROTEINS | Genes encoding structural ECM glycoproteins |
| 0.0 | 1.9 | PID RB 1PATHWAY | Regulation of retinoblastoma protein |
Gene overrepresentation in curated gene sets: REACTOME pathways category:
| Log-likelihood per target | Total log-likelihood | Term | Description |
|---|---|---|---|
| 0.2 | 5.4 | REACTOME AMINO ACID SYNTHESIS AND INTERCONVERSION TRANSAMINATION | Genes involved in Amino acid synthesis and interconversion (transamination) |
| 0.2 | 4.5 | REACTOME DEPOSITION OF NEW CENPA CONTAINING NUCLEOSOMES AT THE CENTROMERE | Genes involved in Deposition of New CENPA-containing Nucleosomes at the Centromere |
| 0.1 | 1.0 | REACTOME TRAFFICKING AND PROCESSING OF ENDOSOMAL TLR | Genes involved in Trafficking and processing of endosomal TLR |
| 0.1 | 4.5 | REACTOME CROSS PRESENTATION OF SOLUBLE EXOGENOUS ANTIGENS ENDOSOMES | Genes involved in Cross-presentation of soluble exogenous antigens (endosomes) |