Project
GNF SymAtlas + NCI-60 cancer cell lines, human (Su, 2004; Ross, 2000)
Navigation
Downloads
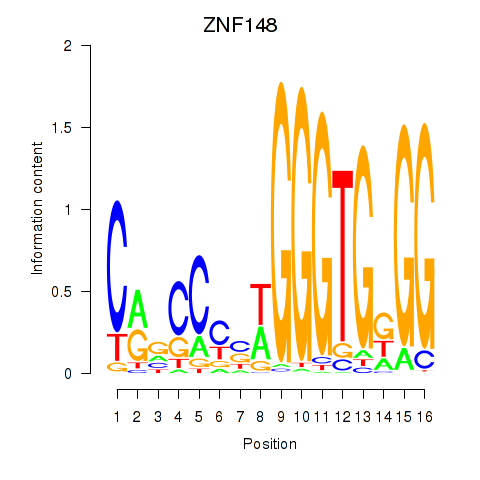
Results for ZNF148
Z-value: 1.05
Motif logo
Transcription factors associated with ZNF148
| Gene Symbol | Gene ID | Gene Info |
|---|---|---|
|
ZNF148
|
ENSG00000163848.20 | ZNF148 |
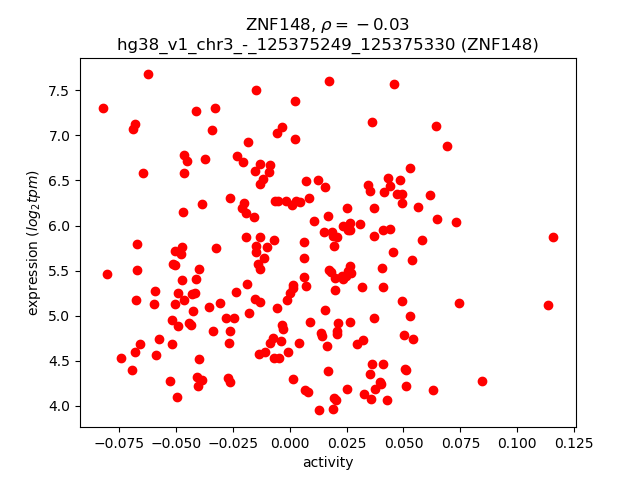
Activity-expression correlation:
| Gene | Promoter | Pearson corr. coef. | P-value | Plot |
|---|---|---|---|---|
| ZNF148 | hg38_v1_chr3_-_125375249_125375330 | -0.03 | 7.1e-01 | Click! |
Activity profile of ZNF148 motif
Sorted Z-values of ZNF148 motif
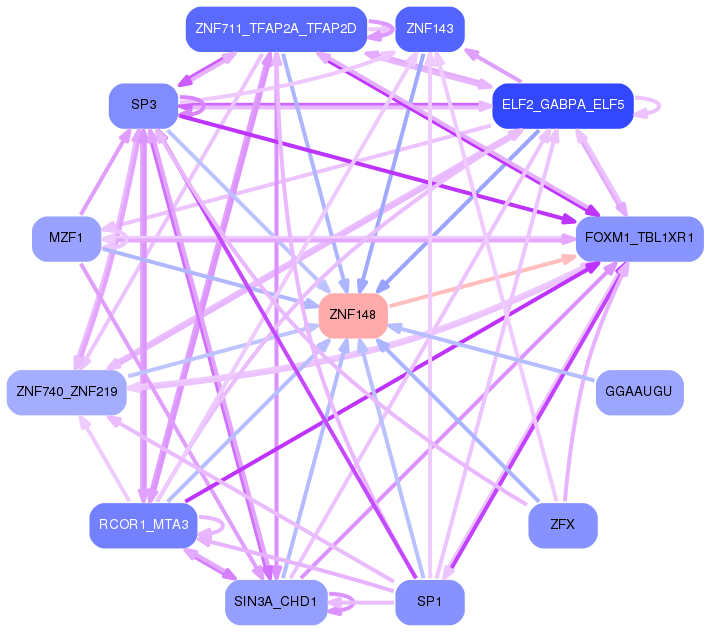
Network of associatons between targets according to the STRING database.

First level regulatory network of ZNF148
Gene Ontology Analysis
Gene overrepresentation in biological process category:
| Log-likelihood per target | Total log-likelihood | Term | Description |
|---|---|---|---|
| 4.1 | 16.6 | GO:0002541 | activation of plasma proteins involved in acute inflammatory response(GO:0002541) |
| 4.1 | 12.3 | GO:0070650 | endoplasmic reticulum polarization(GO:0061163) actin filament bundle retrograde transport(GO:0061573) actin filament bundle distribution(GO:0070650) |
| 2.9 | 14.7 | GO:0099590 | neurotransmitter receptor internalization(GO:0099590) |
| 2.8 | 17.0 | GO:0048549 | positive regulation of pinocytosis(GO:0048549) |
| 2.7 | 27.0 | GO:0071787 | endoplasmic reticulum tubular network assembly(GO:0071787) |
| 2.7 | 26.9 | GO:0010756 | positive regulation of plasminogen activation(GO:0010756) |
| 2.6 | 7.9 | GO:2000097 | chronological cell aging(GO:0001300) regulation of smooth muscle cell-matrix adhesion(GO:2000097) |
| 2.3 | 16.3 | GO:0030421 | defecation(GO:0030421) |
| 2.3 | 6.9 | GO:2001045 | negative regulation of integrin-mediated signaling pathway(GO:2001045) |
| 2.3 | 20.6 | GO:2000582 | regulation of ATP-dependent microtubule motor activity, plus-end-directed(GO:2000580) positive regulation of ATP-dependent microtubule motor activity, plus-end-directed(GO:2000582) |
| 1.7 | 5.0 | GO:0042938 | dipeptide transport(GO:0042938) |
| 1.7 | 8.4 | GO:0035900 | response to isolation stress(GO:0035900) |
| 1.7 | 5.0 | GO:0036071 | N-glycan fucosylation(GO:0036071) |
| 1.6 | 8.2 | GO:0061107 | seminal vesicle development(GO:0061107) |
| 1.6 | 17.9 | GO:0000056 | ribosomal small subunit export from nucleus(GO:0000056) |
| 1.6 | 4.8 | GO:0042822 | pyridoxal phosphate metabolic process(GO:0042822) pyridoxal phosphate biosynthetic process(GO:0042823) |
| 1.5 | 7.6 | GO:1902766 | skeletal muscle satellite cell migration(GO:1902766) |
| 1.4 | 5.8 | GO:1904154 | positive regulation of retrograde protein transport, ER to cytosol(GO:1904154) |
| 1.4 | 4.3 | GO:0006842 | tricarboxylic acid transport(GO:0006842) citrate transport(GO:0015746) |
| 1.4 | 5.5 | GO:0048627 | myoblast development(GO:0048627) |
| 1.3 | 4.0 | GO:1904247 | positive regulation of polynucleotide adenylyltransferase activity(GO:1904247) |
| 1.2 | 11.2 | GO:0060744 | thelarche(GO:0042695) mammary gland branching involved in thelarche(GO:0060744) |
| 1.2 | 4.9 | GO:2001247 | positive regulation of phosphatidylcholine biosynthetic process(GO:2001247) |
| 1.2 | 7.3 | GO:0061302 | smooth muscle cell-matrix adhesion(GO:0061302) |
| 1.2 | 4.8 | GO:0008588 | release of cytoplasmic sequestered NF-kappaB(GO:0008588) |
| 1.2 | 4.8 | GO:1900138 | negative regulation of phospholipase A2 activity(GO:1900138) |
| 1.2 | 8.2 | GO:0097577 | intracellular sequestering of iron ion(GO:0006880) sequestering of iron ion(GO:0097577) |
| 1.1 | 1.1 | GO:0075509 | receptor-mediated endocytosis of virus by host cell(GO:0019065) endocytosis involved in viral entry into host cell(GO:0075509) |
| 1.0 | 4.0 | GO:1902463 | protein localization to cell leading edge(GO:1902463) |
| 1.0 | 2.9 | GO:1903233 | regulation of calcium ion-dependent exocytosis of neurotransmitter(GO:1903233) |
| 0.9 | 11.9 | GO:0032471 | negative regulation of endoplasmic reticulum calcium ion concentration(GO:0032471) |
| 0.9 | 2.8 | GO:1904760 | peptidyl-serine ADP-ribosylation(GO:0018312) myofibroblast differentiation(GO:0036446) mitochondrial DNA repair(GO:0043504) regulation of myofibroblast differentiation(GO:1904760) |
| 0.9 | 2.7 | GO:1903422 | negative regulation of synaptic vesicle recycling(GO:1903422) negative regulation of membrane invagination(GO:1905154) |
| 0.9 | 5.3 | GO:0010731 | protein glutathionylation(GO:0010731) regulation of protein glutathionylation(GO:0010732) negative regulation of protein glutathionylation(GO:0010734) |
| 0.8 | 6.8 | GO:0033211 | adiponectin-activated signaling pathway(GO:0033211) |
| 0.8 | 2.5 | GO:0003408 | optic cup formation involved in camera-type eye development(GO:0003408) |
| 0.8 | 4.6 | GO:0003350 | pulmonary myocardium development(GO:0003350) |
| 0.8 | 3.8 | GO:0044806 | G-quadruplex DNA unwinding(GO:0044806) |
| 0.8 | 4.6 | GO:1990034 | calcium ion export from cell(GO:1990034) |
| 0.7 | 9.0 | GO:2000781 | positive regulation of double-strand break repair(GO:2000781) |
| 0.7 | 7.6 | GO:1904263 | positive regulation of TORC1 signaling(GO:1904263) |
| 0.6 | 11.7 | GO:0030388 | fructose 1,6-bisphosphate metabolic process(GO:0030388) |
| 0.6 | 9.0 | GO:0061162 | establishment of monopolar cell polarity(GO:0061162) establishment or maintenance of monopolar cell polarity(GO:0061339) |
| 0.6 | 1.8 | GO:0035793 | cell migration involved in kidney development(GO:0035787) cell migration involved in metanephros development(GO:0035788) metanephric mesenchymal cell migration(GO:0035789) positive regulation of metanephric mesenchymal cell migration by platelet-derived growth factor receptor-beta signaling pathway(GO:0035793) negative regulation of phospholipid biosynthetic process(GO:0071072) regulation of metanephric mesenchymal cell migration by platelet-derived growth factor receptor-beta signaling pathway(GO:1900238) regulation of metanephric mesenchymal cell migration(GO:2000589) positive regulation of metanephric mesenchymal cell migration(GO:2000591) |
| 0.6 | 2.9 | GO:0097240 | meiotic telomere tethering at nuclear periphery(GO:0044821) meiotic attachment of telomere to nuclear envelope(GO:0070197) chromosome attachment to the nuclear envelope(GO:0097240) |
| 0.6 | 9.2 | GO:0040032 | post-embryonic body morphogenesis(GO:0040032) |
| 0.5 | 2.7 | GO:0042360 | vitamin E metabolic process(GO:0042360) |
| 0.5 | 2.7 | GO:0014886 | transition between slow and fast fiber(GO:0014886) |
| 0.5 | 2.7 | GO:0010701 | positive regulation of norepinephrine secretion(GO:0010701) |
| 0.5 | 1.6 | GO:0061289 | cell-cell signaling involved in kidney development(GO:0060995) Wnt signaling pathway involved in kidney development(GO:0061289) canonical Wnt signaling pathway involved in metanephric kidney development(GO:0061290) cell-cell signaling involved in metanephros development(GO:0072204) |
| 0.5 | 3.2 | GO:0097428 | protein maturation by iron-sulfur cluster transfer(GO:0097428) |
| 0.5 | 1.6 | GO:1901355 | response to rapamycin(GO:1901355) |
| 0.5 | 1.5 | GO:1903644 | regulation of chaperone-mediated protein folding(GO:1903644) |
| 0.5 | 2.5 | GO:1904501 | glial cell fate determination(GO:0007403) canonical Wnt signaling pathway involved in positive regulation of cardiac outflow tract cell proliferation(GO:0061324) regulation of chromatin-mediated maintenance of transcription(GO:1904499) positive regulation of chromatin-mediated maintenance of transcription(GO:1904501) regulation of euchromatin binding(GO:1904793) |
| 0.5 | 1.5 | GO:1901253 | negative regulation of intracellular transport of viral material(GO:1901253) |
| 0.5 | 2.9 | GO:0010643 | cell communication by chemical coupling(GO:0010643) |
| 0.5 | 5.0 | GO:0016127 | cholesterol catabolic process(GO:0006707) sterol catabolic process(GO:0016127) |
| 0.4 | 9.4 | GO:1904714 | regulation of chaperone-mediated autophagy(GO:1904714) |
| 0.4 | 2.2 | GO:0090258 | negative regulation of mitochondrial fission(GO:0090258) |
| 0.4 | 4.2 | GO:0061732 | mitochondrial acetyl-CoA biosynthetic process from pyruvate(GO:0061732) |
| 0.4 | 1.7 | GO:0034472 | snRNA 3'-end processing(GO:0034472) |
| 0.4 | 1.2 | GO:0098974 | postsynaptic actin cytoskeleton organization(GO:0098974) |
| 0.4 | 4.5 | GO:0007144 | female meiosis I(GO:0007144) |
| 0.4 | 9.4 | GO:0051639 | actin filament network formation(GO:0051639) |
| 0.4 | 1.2 | GO:0010040 | response to iron(II) ion(GO:0010040) |
| 0.4 | 12.4 | GO:0021680 | cerebellar Purkinje cell layer development(GO:0021680) |
| 0.4 | 2.3 | GO:0033489 | cholesterol biosynthetic process via desmosterol(GO:0033489) cholesterol biosynthetic process via lathosterol(GO:0033490) |
| 0.4 | 3.4 | GO:0034723 | DNA replication-dependent nucleosome assembly(GO:0006335) DNA replication-dependent nucleosome organization(GO:0034723) |
| 0.4 | 4.8 | GO:0006516 | glycoprotein catabolic process(GO:0006516) |
| 0.4 | 9.7 | GO:0007216 | G-protein coupled glutamate receptor signaling pathway(GO:0007216) |
| 0.4 | 7.1 | GO:0032060 | bleb assembly(GO:0032060) |
| 0.4 | 4.2 | GO:0014052 | regulation of gamma-aminobutyric acid secretion(GO:0014052) |
| 0.3 | 16.1 | GO:0070534 | protein K63-linked ubiquitination(GO:0070534) |
| 0.3 | 2.8 | GO:0031947 | negative regulation of glucocorticoid metabolic process(GO:0031944) negative regulation of glucocorticoid biosynthetic process(GO:0031947) negative regulation of steroid hormone biosynthetic process(GO:0090032) |
| 0.3 | 2.1 | GO:0035583 | sequestering of TGFbeta in extracellular matrix(GO:0035583) |
| 0.3 | 1.2 | GO:0061073 | ciliary body morphogenesis(GO:0061073) |
| 0.3 | 5.0 | GO:0003322 | pancreatic A cell development(GO:0003322) |
| 0.3 | 2.1 | GO:0060160 | negative regulation of dopamine receptor signaling pathway(GO:0060160) |
| 0.3 | 1.5 | GO:0006432 | phenylalanyl-tRNA aminoacylation(GO:0006432) |
| 0.3 | 0.6 | GO:0031125 | rRNA 3'-end processing(GO:0031125) |
| 0.3 | 10.1 | GO:0000717 | nucleotide-excision repair, DNA duplex unwinding(GO:0000717) |
| 0.3 | 7.9 | GO:0031581 | hemidesmosome assembly(GO:0031581) |
| 0.3 | 4.6 | GO:0030497 | fatty acid elongation(GO:0030497) very long-chain fatty acid biosynthetic process(GO:0042761) |
| 0.3 | 7.0 | GO:0061157 | mRNA destabilization(GO:0061157) |
| 0.2 | 3.5 | GO:0071803 | positive regulation of podosome assembly(GO:0071803) |
| 0.2 | 5.4 | GO:0007084 | mitotic nuclear envelope reassembly(GO:0007084) |
| 0.2 | 5.1 | GO:0007250 | activation of NF-kappaB-inducing kinase activity(GO:0007250) |
| 0.2 | 49.6 | GO:0043488 | regulation of mRNA stability(GO:0043488) |
| 0.2 | 4.4 | GO:0001765 | membrane raft assembly(GO:0001765) |
| 0.2 | 10.3 | GO:0030262 | apoptotic nuclear changes(GO:0030262) |
| 0.2 | 2.0 | GO:0038110 | interleukin-2-mediated signaling pathway(GO:0038110) |
| 0.2 | 5.0 | GO:0046475 | glycerophospholipid catabolic process(GO:0046475) |
| 0.2 | 2.8 | GO:0002862 | negative regulation of inflammatory response to antigenic stimulus(GO:0002862) |
| 0.2 | 0.6 | GO:0019859 | purine nucleobase catabolic process(GO:0006145) pyrimidine nucleobase catabolic process(GO:0006208) thymine catabolic process(GO:0006210) beta-alanine metabolic process(GO:0019482) thymine metabolic process(GO:0019859) |
| 0.2 | 7.1 | GO:1900273 | positive regulation of long-term synaptic potentiation(GO:1900273) |
| 0.2 | 1.8 | GO:0010915 | regulation of very-low-density lipoprotein particle clearance(GO:0010915) negative regulation of very-low-density lipoprotein particle clearance(GO:0010916) |
| 0.2 | 0.6 | GO:1901874 | negative regulation of post-translational protein modification(GO:1901874) |
| 0.2 | 3.9 | GO:0046602 | regulation of mitotic centrosome separation(GO:0046602) |
| 0.2 | 1.9 | GO:0001731 | formation of translation preinitiation complex(GO:0001731) |
| 0.2 | 0.6 | GO:0070256 | negative regulation of circadian sleep/wake cycle, non-REM sleep(GO:0042323) negative regulation of mucus secretion(GO:0070256) |
| 0.2 | 1.3 | GO:1990592 | protein ufmylation(GO:0071569) protein polyufmylation(GO:1990564) protein K69-linked ufmylation(GO:1990592) |
| 0.2 | 6.6 | GO:0006099 | tricarboxylic acid cycle(GO:0006099) |
| 0.2 | 1.1 | GO:0097338 | response to clozapine(GO:0097338) |
| 0.2 | 0.6 | GO:1905000 | regulation of membrane repolarization during atrial cardiac muscle cell action potential(GO:1905000) |
| 0.2 | 34.0 | GO:0030705 | cytoskeleton-dependent intracellular transport(GO:0030705) |
| 0.2 | 9.0 | GO:0071377 | cellular response to glucagon stimulus(GO:0071377) |
| 0.2 | 0.7 | GO:0030472 | mitotic spindle organization in nucleus(GO:0030472) |
| 0.2 | 1.4 | GO:0071286 | cellular response to magnesium ion(GO:0071286) |
| 0.2 | 9.6 | GO:0018279 | protein N-linked glycosylation via asparagine(GO:0018279) |
| 0.2 | 2.6 | GO:0051597 | response to methylmercury(GO:0051597) |
| 0.2 | 3.3 | GO:0006123 | mitochondrial electron transport, cytochrome c to oxygen(GO:0006123) |
| 0.2 | 6.7 | GO:0043001 | Golgi to plasma membrane protein transport(GO:0043001) |
| 0.2 | 2.2 | GO:0007016 | cytoskeletal anchoring at plasma membrane(GO:0007016) |
| 0.2 | 1.8 | GO:0051798 | positive regulation of hair follicle development(GO:0051798) |
| 0.2 | 0.9 | GO:0031133 | regulation of axon diameter(GO:0031133) |
| 0.1 | 5.5 | GO:0035640 | exploration behavior(GO:0035640) |
| 0.1 | 14.4 | GO:0006334 | nucleosome assembly(GO:0006334) |
| 0.1 | 1.3 | GO:0060013 | righting reflex(GO:0060013) |
| 0.1 | 0.6 | GO:0030047 | actin modification(GO:0030047) |
| 0.1 | 1.8 | GO:0034138 | toll-like receptor 3 signaling pathway(GO:0034138) |
| 0.1 | 6.0 | GO:0045104 | intermediate filament cytoskeleton organization(GO:0045104) |
| 0.1 | 0.7 | GO:1903377 | negative regulation of oxidative stress-induced neuron intrinsic apoptotic signaling pathway(GO:1903377) |
| 0.1 | 0.6 | GO:2000042 | negative regulation of double-strand break repair via homologous recombination(GO:2000042) |
| 0.1 | 5.2 | GO:0060325 | face morphogenesis(GO:0060325) |
| 0.1 | 1.3 | GO:0030213 | hyaluronan biosynthetic process(GO:0030213) |
| 0.1 | 4.4 | GO:0046856 | phosphatidylinositol dephosphorylation(GO:0046856) |
| 0.1 | 1.6 | GO:0034244 | negative regulation of transcription elongation from RNA polymerase II promoter(GO:0034244) |
| 0.1 | 2.5 | GO:0036152 | phosphatidylethanolamine acyl-chain remodeling(GO:0036152) |
| 0.1 | 2.0 | GO:0035338 | long-chain fatty-acyl-CoA biosynthetic process(GO:0035338) |
| 0.1 | 1.7 | GO:0051873 | killing by host of symbiont cells(GO:0051873) |
| 0.1 | 0.7 | GO:0009212 | acrosome assembly(GO:0001675) dTTP biosynthetic process(GO:0006235) pyrimidine deoxyribonucleoside triphosphate biosynthetic process(GO:0009212) |
| 0.1 | 8.3 | GO:0070527 | platelet aggregation(GO:0070527) |
| 0.1 | 4.4 | GO:0007190 | activation of adenylate cyclase activity(GO:0007190) |
| 0.1 | 0.9 | GO:0043951 | negative regulation of cAMP-mediated signaling(GO:0043951) |
| 0.1 | 1.9 | GO:0034315 | regulation of Arp2/3 complex-mediated actin nucleation(GO:0034315) |
| 0.1 | 1.3 | GO:0070327 | thyroid hormone transport(GO:0070327) |
| 0.1 | 0.7 | GO:0032534 | regulation of microvillus assembly(GO:0032534) |
| 0.1 | 3.8 | GO:0051693 | actin filament capping(GO:0051693) |
| 0.1 | 4.5 | GO:0019835 | cytolysis(GO:0019835) |
| 0.1 | 6.1 | GO:0006501 | C-terminal protein lipidation(GO:0006501) |
| 0.1 | 0.8 | GO:0007023 | post-chaperonin tubulin folding pathway(GO:0007023) |
| 0.1 | 0.2 | GO:0060392 | negative regulation of SMAD protein import into nucleus(GO:0060392) |
| 0.1 | 0.5 | GO:0051012 | microtubule sliding(GO:0051012) |
| 0.1 | 2.9 | GO:0019933 | cAMP-mediated signaling(GO:0019933) |
| 0.1 | 0.8 | GO:0031274 | positive regulation of pseudopodium assembly(GO:0031274) |
| 0.1 | 1.6 | GO:0042921 | glucocorticoid receptor signaling pathway(GO:0042921) |
| 0.1 | 0.3 | GO:0070269 | pyroptosis(GO:0070269) |
| 0.1 | 0.3 | GO:0000055 | ribosomal large subunit export from nucleus(GO:0000055) |
| 0.1 | 1.6 | GO:0048268 | clathrin coat assembly(GO:0048268) |
| 0.1 | 1.6 | GO:0033344 | cholesterol efflux(GO:0033344) |
| 0.1 | 0.5 | GO:0090267 | positive regulation of mitotic cell cycle spindle assembly checkpoint(GO:0090267) |
| 0.1 | 0.9 | GO:0010990 | regulation of SMAD protein complex assembly(GO:0010990) |
| 0.1 | 0.2 | GO:0035048 | splicing factor protein import into nucleus(GO:0035048) |
| 0.1 | 0.6 | GO:0014894 | response to muscle inactivity involved in regulation of muscle adaptation(GO:0014877) response to denervation involved in regulation of muscle adaptation(GO:0014894) |
| 0.1 | 1.5 | GO:0070328 | acylglycerol homeostasis(GO:0055090) triglyceride homeostasis(GO:0070328) |
| 0.1 | 1.2 | GO:2000675 | negative regulation of type B pancreatic cell apoptotic process(GO:2000675) |
| 0.1 | 1.4 | GO:0045624 | positive regulation of T-helper cell differentiation(GO:0045624) |
| 0.1 | 13.0 | GO:0007266 | Rho protein signal transduction(GO:0007266) |
| 0.1 | 1.3 | GO:0030208 | dermatan sulfate biosynthetic process(GO:0030208) |
| 0.1 | 3.2 | GO:0015914 | phospholipid transport(GO:0015914) |
| 0.1 | 1.8 | GO:0007158 | neuron cell-cell adhesion(GO:0007158) |
| 0.0 | 0.1 | GO:0001732 | formation of cytoplasmic translation initiation complex(GO:0001732) |
| 0.0 | 1.5 | GO:0006783 | heme biosynthetic process(GO:0006783) |
| 0.0 | 0.4 | GO:0038145 | macrophage colony-stimulating factor signaling pathway(GO:0038145) |
| 0.0 | 0.2 | GO:0021759 | globus pallidus development(GO:0021759) |
| 0.0 | 0.8 | GO:0050966 | detection of mechanical stimulus involved in sensory perception of pain(GO:0050966) |
| 0.0 | 1.7 | GO:0008333 | endosome to lysosome transport(GO:0008333) |
| 0.0 | 2.4 | GO:0006879 | cellular iron ion homeostasis(GO:0006879) |
| 0.0 | 1.8 | GO:0015804 | neutral amino acid transport(GO:0015804) |
| 0.0 | 2.8 | GO:0043966 | histone H3 acetylation(GO:0043966) |
| 0.0 | 2.7 | GO:0006636 | unsaturated fatty acid biosynthetic process(GO:0006636) |
| 0.0 | 1.1 | GO:0031640 | killing of cells of other organism(GO:0031640) disruption of cells of other organism(GO:0044364) |
| 0.0 | 1.1 | GO:0032094 | response to food(GO:0032094) |
| 0.0 | 4.0 | GO:0048024 | regulation of mRNA splicing, via spliceosome(GO:0048024) |
| 0.0 | 1.2 | GO:0032786 | positive regulation of DNA-templated transcription, elongation(GO:0032786) |
| 0.0 | 0.2 | GO:1904754 | positive regulation of vascular associated smooth muscle cell migration(GO:1904754) |
| 0.0 | 0.3 | GO:2000427 | positive regulation of apoptotic cell clearance(GO:2000427) |
| 0.0 | 1.7 | GO:0061178 | regulation of insulin secretion involved in cellular response to glucose stimulus(GO:0061178) |
| 0.0 | 0.6 | GO:0030539 | male genitalia development(GO:0030539) |
| 0.0 | 0.9 | GO:0043278 | response to isoquinoline alkaloid(GO:0014072) response to morphine(GO:0043278) |
| 0.0 | 0.6 | GO:0043153 | entrainment of circadian clock by photoperiod(GO:0043153) |
| 0.0 | 0.7 | GO:0006853 | carnitine shuttle(GO:0006853) |
| 0.0 | 0.3 | GO:0090161 | Golgi ribbon formation(GO:0090161) |
| 0.0 | 0.3 | GO:0036010 | protein localization to endosome(GO:0036010) |
| 0.0 | 1.9 | GO:0009154 | purine ribonucleotide catabolic process(GO:0009154) |
| 0.0 | 1.3 | GO:0035666 | TRIF-dependent toll-like receptor signaling pathway(GO:0035666) |
| 0.0 | 0.1 | GO:0010755 | regulation of plasminogen activation(GO:0010755) negative regulation of plasminogen activation(GO:0010757) |
| 0.0 | 0.4 | GO:0090656 | t-circle formation(GO:0090656) |
| 0.0 | 0.5 | GO:0015937 | coenzyme A biosynthetic process(GO:0015937) |
| 0.0 | 0.3 | GO:0006828 | manganese ion transport(GO:0006828) |
| 0.0 | 0.5 | GO:0061099 | negative regulation of protein tyrosine kinase activity(GO:0061099) |
| 0.0 | 0.1 | GO:0072553 | terminal button organization(GO:0072553) |
| 0.0 | 0.4 | GO:0006296 | nucleotide-excision repair, DNA incision, 5'-to lesion(GO:0006296) |
| 0.0 | 0.3 | GO:0006337 | nucleosome disassembly(GO:0006337) |
| 0.0 | 2.1 | GO:0002576 | platelet degranulation(GO:0002576) |
| 0.0 | 0.2 | GO:0021511 | spinal cord patterning(GO:0021511) |
Gene overrepresentation in cellular component category:
| Log-likelihood per target | Total log-likelihood | Term | Description |
|---|---|---|---|
| 3.4 | 26.9 | GO:0000015 | phosphopyruvate hydratase complex(GO:0000015) |
| 2.7 | 10.7 | GO:0071942 | XPC complex(GO:0071942) |
| 2.3 | 9.2 | GO:0070032 | synaptobrevin 2-SNAP-25-syntaxin-1a-complexin I complex(GO:0070032) |
| 2.1 | 8.2 | GO:0070288 | intracellular ferritin complex(GO:0008043) ferritin complex(GO:0070288) |
| 1.6 | 4.8 | GO:0045323 | interleukin-1 receptor complex(GO:0045323) |
| 1.4 | 8.2 | GO:0031232 | extrinsic component of external side of plasma membrane(GO:0031232) |
| 1.2 | 5.8 | GO:0032449 | CBM complex(GO:0032449) |
| 1.1 | 17.9 | GO:0005642 | annulate lamellae(GO:0005642) |
| 1.0 | 6.8 | GO:0005956 | protein kinase CK2 complex(GO:0005956) |
| 1.0 | 5.8 | GO:0005784 | Sec61 translocon complex(GO:0005784) translocon complex(GO:0071256) |
| 0.9 | 17.0 | GO:0033643 | host cell part(GO:0033643) |
| 0.9 | 10.2 | GO:0019773 | proteasome core complex, alpha-subunit complex(GO:0019773) |
| 0.8 | 21.0 | GO:0005868 | cytoplasmic dynein complex(GO:0005868) |
| 0.8 | 7.1 | GO:0044327 | dendritic spine head(GO:0044327) |
| 0.7 | 10.6 | GO:0016600 | flotillin complex(GO:0016600) |
| 0.6 | 12.2 | GO:0000812 | Swr1 complex(GO:0000812) |
| 0.6 | 3.7 | GO:1990131 | EGO complex(GO:0034448) Gtr1-Gtr2 GTPase complex(GO:1990131) |
| 0.6 | 14.3 | GO:0044295 | axonal growth cone(GO:0044295) |
| 0.6 | 1.7 | GO:0048237 | rough endoplasmic reticulum lumen(GO:0048237) |
| 0.6 | 40.0 | GO:0005881 | cytoplasmic microtubule(GO:0005881) |
| 0.5 | 2.2 | GO:0045298 | tubulin complex(GO:0045298) |
| 0.5 | 2.7 | GO:0048787 | presynaptic active zone membrane(GO:0048787) |
| 0.5 | 8.1 | GO:0005890 | sodium:potassium-exchanging ATPase complex(GO:0005890) |
| 0.5 | 5.5 | GO:0031371 | ubiquitin conjugating enzyme complex(GO:0031371) |
| 0.5 | 16.6 | GO:0031233 | intrinsic component of external side of plasma membrane(GO:0031233) |
| 0.5 | 4.0 | GO:0061700 | GATOR2 complex(GO:0061700) |
| 0.5 | 1.5 | GO:0009328 | phenylalanine-tRNA ligase complex(GO:0009328) |
| 0.4 | 4.0 | GO:0031595 | nuclear proteasome complex(GO:0031595) |
| 0.4 | 8.2 | GO:0036020 | endolysosome membrane(GO:0036020) |
| 0.4 | 4.0 | GO:0032593 | insulin-responsive compartment(GO:0032593) |
| 0.3 | 6.6 | GO:0032591 | dendritic spine membrane(GO:0032591) |
| 0.3 | 4.2 | GO:0045254 | pyruvate dehydrogenase complex(GO:0045254) |
| 0.3 | 5.9 | GO:0008091 | spectrin(GO:0008091) |
| 0.3 | 29.3 | GO:0032580 | Golgi cisterna membrane(GO:0032580) |
| 0.3 | 5.0 | GO:0030285 | integral component of synaptic vesicle membrane(GO:0030285) intrinsic component of synaptic vesicle membrane(GO:0098563) |
| 0.3 | 18.1 | GO:0012507 | ER to Golgi transport vesicle membrane(GO:0012507) |
| 0.3 | 3.4 | GO:0008290 | F-actin capping protein complex(GO:0008290) Flemming body(GO:0090543) |
| 0.3 | 4.0 | GO:0042405 | nuclear inclusion body(GO:0042405) |
| 0.3 | 5.9 | GO:0030056 | hemidesmosome(GO:0030056) |
| 0.3 | 3.3 | GO:0005751 | mitochondrial respiratory chain complex IV(GO:0005751) |
| 0.2 | 1.7 | GO:0016589 | NURF complex(GO:0016589) |
| 0.2 | 1.2 | GO:0005826 | actomyosin contractile ring(GO:0005826) myosin II filament(GO:0097513) |
| 0.2 | 16.8 | GO:0005834 | heterotrimeric G-protein complex(GO:0005834) |
| 0.2 | 7.1 | GO:0043218 | compact myelin(GO:0043218) |
| 0.2 | 11.7 | GO:0031430 | M band(GO:0031430) |
| 0.2 | 1.6 | GO:0032021 | NELF complex(GO:0032021) |
| 0.2 | 2.9 | GO:0034993 | microtubule organizing center attachment site(GO:0034992) LINC complex(GO:0034993) |
| 0.2 | 0.9 | GO:0002189 | ribose phosphate diphosphokinase complex(GO:0002189) |
| 0.2 | 1.6 | GO:0031931 | TORC1 complex(GO:0031931) |
| 0.2 | 2.6 | GO:0031083 | BLOC-1 complex(GO:0031083) |
| 0.2 | 2.9 | GO:0097470 | ribbon synapse(GO:0097470) |
| 0.2 | 2.0 | GO:0043256 | laminin complex(GO:0043256) |
| 0.2 | 6.1 | GO:0000159 | protein phosphatase type 2A complex(GO:0000159) |
| 0.1 | 2.8 | GO:0005671 | Ada2/Gcn5/Ada3 transcription activator complex(GO:0005671) |
| 0.1 | 6.0 | GO:0045095 | keratin filament(GO:0045095) |
| 0.1 | 13.2 | GO:0001750 | photoreceptor outer segment(GO:0001750) |
| 0.1 | 9.7 | GO:0005637 | nuclear inner membrane(GO:0005637) |
| 0.1 | 2.3 | GO:0005640 | nuclear outer membrane(GO:0005640) |
| 0.1 | 0.6 | GO:0031523 | Myb complex(GO:0031523) |
| 0.1 | 4.8 | GO:0090544 | BAF-type complex(GO:0090544) |
| 0.1 | 2.3 | GO:0005686 | U2 snRNP(GO:0005686) |
| 0.1 | 2.1 | GO:0043205 | microfibril(GO:0001527) fibril(GO:0043205) |
| 0.1 | 5.8 | GO:0005871 | kinesin complex(GO:0005871) |
| 0.1 | 9.5 | GO:0005811 | lipid particle(GO:0005811) |
| 0.1 | 7.7 | GO:0005882 | intermediate filament(GO:0005882) |
| 0.1 | 15.4 | GO:0030176 | integral component of endoplasmic reticulum membrane(GO:0030176) |
| 0.1 | 2.9 | GO:0005921 | gap junction(GO:0005921) |
| 0.1 | 10.5 | GO:0031902 | late endosome membrane(GO:0031902) |
| 0.1 | 10.0 | GO:0071013 | catalytic step 2 spliceosome(GO:0071013) |
| 0.1 | 0.5 | GO:0035032 | phosphatidylinositol 3-kinase complex, class III(GO:0035032) |
| 0.1 | 1.5 | GO:0016281 | eukaryotic translation initiation factor 4F complex(GO:0016281) |
| 0.1 | 0.7 | GO:0042382 | paraspeckles(GO:0042382) |
| 0.1 | 0.4 | GO:0043625 | delta DNA polymerase complex(GO:0043625) |
| 0.1 | 0.7 | GO:0005672 | transcription factor TFIIA complex(GO:0005672) |
| 0.1 | 8.3 | GO:0032587 | ruffle membrane(GO:0032587) |
| 0.1 | 2.0 | GO:0032420 | stereocilium(GO:0032420) |
| 0.1 | 6.8 | GO:0031093 | platelet alpha granule lumen(GO:0031093) |
| 0.1 | 5.8 | GO:0042734 | presynaptic membrane(GO:0042734) |
| 0.1 | 4.3 | GO:0035580 | specific granule lumen(GO:0035580) |
| 0.1 | 8.7 | GO:0019897 | extrinsic component of plasma membrane(GO:0019897) |
| 0.1 | 3.6 | GO:0005902 | microvillus(GO:0005902) |
| 0.1 | 0.4 | GO:0016942 | insulin-like growth factor binding protein complex(GO:0016942) growth factor complex(GO:0036454) |
| 0.1 | 5.2 | GO:0032432 | actin filament bundle(GO:0032432) |
| 0.1 | 6.2 | GO:0005796 | Golgi lumen(GO:0005796) |
| 0.1 | 1.1 | GO:0005952 | cAMP-dependent protein kinase complex(GO:0005952) |
| 0.1 | 1.1 | GO:0031089 | platelet dense granule lumen(GO:0031089) |
| 0.1 | 2.2 | GO:0045178 | basal part of cell(GO:0045178) |
| 0.0 | 3.5 | GO:0030864 | cortical actin cytoskeleton(GO:0030864) |
| 0.0 | 0.7 | GO:0031588 | nucleotide-activated protein kinase complex(GO:0031588) |
| 0.0 | 1.2 | GO:0030863 | cortical cytoskeleton(GO:0030863) |
| 0.0 | 4.1 | GO:0005903 | brush border(GO:0005903) |
| 0.0 | 3.7 | GO:0005802 | trans-Golgi network(GO:0005802) |
| 0.0 | 26.2 | GO:0000139 | Golgi membrane(GO:0000139) |
| 0.0 | 2.2 | GO:0031463 | Cul3-RING ubiquitin ligase complex(GO:0031463) |
| 0.0 | 4.6 | GO:0031225 | anchored component of membrane(GO:0031225) |
| 0.0 | 1.5 | GO:0016592 | mediator complex(GO:0016592) |
| 0.0 | 0.1 | GO:0097136 | Bcl-2 family protein complex(GO:0097136) |
| 0.0 | 1.4 | GO:0019005 | SCF ubiquitin ligase complex(GO:0019005) |
| 0.0 | 0.4 | GO:0031092 | platelet alpha granule membrane(GO:0031092) |
| 0.0 | 2.6 | GO:0005758 | mitochondrial intermembrane space(GO:0005758) |
| 0.0 | 0.6 | GO:0035861 | site of double-strand break(GO:0035861) |
| 0.0 | 0.4 | GO:0048786 | presynaptic active zone(GO:0048786) |
| 0.0 | 2.3 | GO:0005814 | centriole(GO:0005814) |
| 0.0 | 6.1 | GO:0045177 | apical part of cell(GO:0045177) |
| 0.0 | 1.4 | GO:0031901 | early endosome membrane(GO:0031901) |
| 0.0 | 7.9 | GO:0005759 | mitochondrial matrix(GO:0005759) |
| 0.0 | 0.1 | GO:0071541 | eukaryotic translation initiation factor 3 complex, eIF3m(GO:0071541) |
| 0.0 | 0.7 | GO:0015030 | Cajal body(GO:0015030) |
| 0.0 | 1.6 | GO:0000784 | nuclear chromosome, telomeric region(GO:0000784) |
Gene overrepresentation in molecular function category:
| Log-likelihood per target | Total log-likelihood | Term | Description |
|---|---|---|---|
| 3.4 | 26.9 | GO:0004634 | phosphopyruvate hydratase activity(GO:0004634) |
| 3.1 | 12.4 | GO:0004461 | lactose synthase activity(GO:0004461) |
| 1.8 | 5.3 | GO:0001641 | group II metabotropic glutamate receptor activity(GO:0001641) |
| 1.7 | 5.0 | GO:0046921 | glycoprotein 6-alpha-L-fucosyltransferase activity(GO:0008424) alpha-(1->6)-fucosyltransferase activity(GO:0046921) |
| 1.6 | 4.8 | GO:0031403 | lithium ion binding(GO:0031403) |
| 1.4 | 4.3 | GO:0015142 | citrate transmembrane transporter activity(GO:0015137) tricarboxylic acid transmembrane transporter activity(GO:0015142) |
| 1.4 | 10.9 | GO:0005094 | Rho GDP-dissociation inhibitor activity(GO:0005094) |
| 1.2 | 7.3 | GO:0038062 | protein tyrosine kinase collagen receptor activity(GO:0038062) |
| 1.2 | 6.0 | GO:1990254 | keratin filament binding(GO:1990254) |
| 1.2 | 17.9 | GO:0005049 | nuclear export signal receptor activity(GO:0005049) |
| 1.1 | 4.6 | GO:0004466 | long-chain-acyl-CoA dehydrogenase activity(GO:0004466) |
| 1.1 | 11.7 | GO:0004332 | fructose-bisphosphate aldolase activity(GO:0004332) |
| 1.0 | 8.2 | GO:0004322 | ferroxidase activity(GO:0004322) oxidoreductase activity, oxidizing metal ions, oxygen as acceptor(GO:0016724) |
| 0.9 | 6.6 | GO:0046912 | transferase activity, transferring acyl groups, acyl groups converted into alkyl on transfer(GO:0046912) |
| 0.9 | 19.6 | GO:0032036 | myosin heavy chain binding(GO:0032036) |
| 0.9 | 25.4 | GO:0008574 | ATP-dependent microtubule motor activity, plus-end-directed(GO:0008574) |
| 0.7 | 2.2 | GO:0099609 | microtubule lateral binding(GO:0099609) |
| 0.7 | 31.1 | GO:0048027 | mRNA 5'-UTR binding(GO:0048027) |
| 0.6 | 6.6 | GO:1990247 | N6-methyladenosine-containing RNA binding(GO:1990247) |
| 0.5 | 4.2 | GO:0034604 | pyruvate dehydrogenase activity(GO:0004738) pyruvate dehydrogenase [NAD(P)+] activity(GO:0034603) pyruvate dehydrogenase (NAD+) activity(GO:0034604) |
| 0.5 | 5.0 | GO:0004064 | arylesterase activity(GO:0004064) |
| 0.5 | 8.6 | GO:0008179 | adenylate cyclase binding(GO:0008179) |
| 0.5 | 3.3 | GO:0003810 | protein-glutamine gamma-glutamyltransferase activity(GO:0003810) |
| 0.5 | 4.6 | GO:0042731 | inositol-polyphosphate 5-phosphatase activity(GO:0004445) PH domain binding(GO:0042731) |
| 0.4 | 10.1 | GO:0051429 | corticotropin-releasing hormone receptor binding(GO:0051429) corticotropin-releasing hormone receptor 1 binding(GO:0051430) |
| 0.4 | 1.7 | GO:0035473 | lipase binding(GO:0035473) very-low-density lipoprotein particle receptor binding(GO:0070326) |
| 0.4 | 1.2 | GO:0098973 | structural constituent of synapse(GO:0098918) structural constituent of postsynaptic actin cytoskeleton(GO:0098973) |
| 0.4 | 1.2 | GO:0030350 | iron-responsive element binding(GO:0030350) |
| 0.4 | 10.2 | GO:0070003 | threonine-type endopeptidase activity(GO:0004298) threonine-type peptidase activity(GO:0070003) |
| 0.4 | 2.1 | GO:0000293 | ferric-chelate reductase activity(GO:0000293) |
| 0.4 | 16.7 | GO:0061631 | ubiquitin conjugating enzyme activity(GO:0061631) |
| 0.3 | 4.2 | GO:0038132 | neuregulin binding(GO:0038132) |
| 0.3 | 2.8 | GO:0003910 | DNA ligase (ATP) activity(GO:0003910) |
| 0.3 | 3.7 | GO:0032051 | clathrin light chain binding(GO:0032051) |
| 0.3 | 4.4 | GO:1990239 | steroid hormone binding(GO:1990239) |
| 0.3 | 9.0 | GO:0017166 | vinculin binding(GO:0017166) |
| 0.3 | 1.9 | GO:0071074 | eukaryotic initiation factor eIF2 binding(GO:0071074) |
| 0.3 | 2.1 | GO:0030023 | extracellular matrix constituent conferring elasticity(GO:0030023) |
| 0.3 | 4.8 | GO:0005149 | interleukin-1 receptor binding(GO:0005149) |
| 0.3 | 49.4 | GO:0005200 | structural constituent of cytoskeleton(GO:0005200) |
| 0.3 | 1.5 | GO:0004826 | phenylalanine-tRNA ligase activity(GO:0004826) |
| 0.3 | 5.5 | GO:0097602 | cullin family protein binding(GO:0097602) |
| 0.3 | 16.2 | GO:0019212 | phosphatase inhibitor activity(GO:0019212) |
| 0.3 | 7.0 | GO:0102391 | decanoate--CoA ligase activity(GO:0102391) |
| 0.3 | 7.4 | GO:0070300 | phosphatidic acid binding(GO:0070300) |
| 0.3 | 2.5 | GO:0047144 | 2-acylglycerol-3-phosphate O-acyltransferase activity(GO:0047144) |
| 0.3 | 1.4 | GO:0048763 | calcium-induced calcium release activity(GO:0048763) |
| 0.3 | 2.7 | GO:0001162 | RNA polymerase II intronic transcription regulatory region sequence-specific DNA binding(GO:0001162) |
| 0.2 | 15.1 | GO:0005544 | calcium-dependent phospholipid binding(GO:0005544) |
| 0.2 | 3.7 | GO:0030215 | semaphorin receptor binding(GO:0030215) |
| 0.2 | 4.4 | GO:0035256 | G-protein coupled glutamate receptor binding(GO:0035256) |
| 0.2 | 7.7 | GO:0042605 | peptide antigen binding(GO:0042605) |
| 0.2 | 4.1 | GO:0043495 | protein anchor(GO:0043495) |
| 0.2 | 9.9 | GO:0005484 | SNAP receptor activity(GO:0005484) |
| 0.2 | 2.6 | GO:0016634 | oxidoreductase activity, acting on the CH-CH group of donors, oxygen as acceptor(GO:0016634) |
| 0.2 | 5.4 | GO:0042288 | MHC class I protein binding(GO:0042288) |
| 0.2 | 0.9 | GO:0004749 | ribose phosphate diphosphokinase activity(GO:0004749) |
| 0.2 | 5.4 | GO:0048156 | tau protein binding(GO:0048156) |
| 0.2 | 11.8 | GO:0031593 | polyubiquitin binding(GO:0031593) |
| 0.2 | 4.2 | GO:0035615 | clathrin adaptor activity(GO:0035615) endocytic adaptor activity(GO:0098748) |
| 0.2 | 3.2 | GO:0008198 | ferrous iron binding(GO:0008198) |
| 0.2 | 5.0 | GO:0004622 | lysophospholipase activity(GO:0004622) |
| 0.2 | 14.6 | GO:0019003 | GDP binding(GO:0019003) |
| 0.2 | 30.2 | GO:0002020 | protease binding(GO:0002020) |
| 0.2 | 9.0 | GO:0019894 | kinesin binding(GO:0019894) |
| 0.2 | 5.8 | GO:0030159 | receptor signaling complex scaffold activity(GO:0030159) |
| 0.2 | 0.3 | GO:0000035 | acyl binding(GO:0000035) |
| 0.2 | 2.9 | GO:0005522 | profilin binding(GO:0005522) |
| 0.2 | 1.3 | GO:0015349 | thyroid hormone transmembrane transporter activity(GO:0015349) |
| 0.2 | 6.6 | GO:0050699 | WW domain binding(GO:0050699) |
| 0.2 | 2.0 | GO:0005131 | growth hormone receptor binding(GO:0005131) |
| 0.2 | 0.6 | GO:0019797 | procollagen-proline 3-dioxygenase activity(GO:0019797) |
| 0.2 | 0.5 | GO:0030292 | protein tyrosine kinase inhibitor activity(GO:0030292) |
| 0.1 | 1.5 | GO:1990825 | sequence-specific mRNA binding(GO:1990825) |
| 0.1 | 5.0 | GO:0008395 | steroid hydroxylase activity(GO:0008395) |
| 0.1 | 0.7 | GO:0008160 | protein tyrosine phosphatase activator activity(GO:0008160) |
| 0.1 | 4.7 | GO:0003785 | actin monomer binding(GO:0003785) |
| 0.1 | 2.5 | GO:0045294 | alpha-catenin binding(GO:0045294) |
| 0.1 | 7.5 | GO:0005154 | epidermal growth factor receptor binding(GO:0005154) |
| 0.1 | 3.2 | GO:0034236 | protein kinase A catalytic subunit binding(GO:0034236) |
| 0.1 | 0.6 | GO:0061649 | ubiquitinated histone binding(GO:0061649) |
| 0.1 | 0.4 | GO:0005011 | macrophage colony-stimulating factor receptor activity(GO:0005011) |
| 0.1 | 8.9 | GO:0048365 | Rac GTPase binding(GO:0048365) |
| 0.1 | 1.2 | GO:0010859 | calcium-dependent cysteine-type endopeptidase inhibitor activity(GO:0010859) |
| 0.1 | 1.8 | GO:0005161 | platelet-derived growth factor receptor binding(GO:0005161) |
| 0.1 | 2.2 | GO:0031210 | phosphatidylcholine binding(GO:0031210) |
| 0.1 | 0.6 | GO:0032795 | heterotrimeric G-protein binding(GO:0032795) |
| 0.1 | 3.3 | GO:0004129 | cytochrome-c oxidase activity(GO:0004129) heme-copper terminal oxidase activity(GO:0015002) oxidoreductase activity, acting on a heme group of donors, oxygen as acceptor(GO:0016676) |
| 0.1 | 1.7 | GO:0043395 | heparan sulfate proteoglycan binding(GO:0043395) |
| 0.1 | 8.2 | GO:0004867 | serine-type endopeptidase inhibitor activity(GO:0004867) |
| 0.1 | 6.1 | GO:0031491 | nucleosome binding(GO:0031491) |
| 0.1 | 3.0 | GO:0016628 | oxidoreductase activity, acting on the CH-CH group of donors, NAD or NADP as acceptor(GO:0016628) |
| 0.1 | 11.3 | GO:0005496 | steroid binding(GO:0005496) |
| 0.1 | 1.3 | GO:0043225 | anion transmembrane-transporting ATPase activity(GO:0043225) |
| 0.1 | 0.4 | GO:0070051 | fibrinogen binding(GO:0070051) |
| 0.1 | 0.5 | GO:0004594 | pantothenate kinase activity(GO:0004594) |
| 0.1 | 1.5 | GO:0042809 | vitamin D receptor binding(GO:0042809) |
| 0.1 | 2.0 | GO:0030506 | ankyrin binding(GO:0030506) |
| 0.1 | 1.4 | GO:0044548 | S100 protein binding(GO:0044548) |
| 0.1 | 2.3 | GO:0070577 | lysine-acetylated histone binding(GO:0070577) |
| 0.1 | 0.1 | GO:0098808 | mRNA cap binding(GO:0098808) |
| 0.1 | 1.4 | GO:0017049 | GTP-Rho binding(GO:0017049) |
| 0.1 | 0.7 | GO:0008603 | cAMP-dependent protein kinase regulator activity(GO:0008603) |
| 0.1 | 4.0 | GO:0070063 | RNA polymerase binding(GO:0070063) |
| 0.1 | 6.4 | GO:0003730 | mRNA 3'-UTR binding(GO:0003730) |
| 0.1 | 0.4 | GO:0008309 | double-stranded DNA exodeoxyribonuclease activity(GO:0008309) |
| 0.1 | 4.7 | GO:0001540 | beta-amyloid binding(GO:0001540) |
| 0.1 | 17.3 | GO:0008017 | microtubule binding(GO:0008017) |
| 0.1 | 0.6 | GO:0043426 | MRF binding(GO:0043426) |
| 0.1 | 3.0 | GO:0004683 | calmodulin-dependent protein kinase activity(GO:0004683) |
| 0.1 | 0.1 | GO:0030305 | heparanase activity(GO:0030305) |
| 0.1 | 10.7 | GO:0008083 | growth factor activity(GO:0008083) |
| 0.1 | 6.1 | GO:0043021 | ribonucleoprotein complex binding(GO:0043021) |
| 0.1 | 18.4 | GO:0005096 | GTPase activator activity(GO:0005096) |
| 0.1 | 2.5 | GO:0030331 | estrogen receptor binding(GO:0030331) |
| 0.1 | 0.3 | GO:0008429 | phosphatidylethanolamine binding(GO:0008429) |
| 0.0 | 1.8 | GO:0005044 | scavenger receptor activity(GO:0005044) |
| 0.0 | 8.0 | GO:0003924 | GTPase activity(GO:0003924) |
| 0.0 | 1.8 | GO:0030552 | cAMP binding(GO:0030552) |
| 0.0 | 6.0 | GO:0005516 | calmodulin binding(GO:0005516) |
| 0.0 | 0.4 | GO:0031994 | insulin-like growth factor I binding(GO:0031994) |
| 0.0 | 5.0 | GO:0044325 | ion channel binding(GO:0044325) |
| 0.0 | 1.0 | GO:0001671 | ATPase activator activity(GO:0001671) |
| 0.0 | 1.8 | GO:0035035 | histone acetyltransferase binding(GO:0035035) |
| 0.0 | 0.3 | GO:0015279 | store-operated calcium channel activity(GO:0015279) |
| 0.0 | 0.7 | GO:0052629 | phosphatidylinositol-3,5-bisphosphate 3-phosphatase activity(GO:0052629) |
| 0.0 | 7.0 | GO:0008022 | protein C-terminus binding(GO:0008022) |
| 0.0 | 1.4 | GO:0003743 | translation initiation factor activity(GO:0003743) |
| 0.0 | 0.8 | GO:0000175 | 3'-5'-exoribonuclease activity(GO:0000175) |
| 0.0 | 0.7 | GO:0019905 | syntaxin binding(GO:0019905) |
| 0.0 | 2.5 | GO:0004725 | protein tyrosine phosphatase activity(GO:0004725) |
| 0.0 | 0.4 | GO:0003887 | DNA-directed DNA polymerase activity(GO:0003887) |
| 0.0 | 2.1 | GO:0051015 | actin filament binding(GO:0051015) |
Gene overrepresentation in curated gene sets: canonical pathways category:
| Log-likelihood per target | Total log-likelihood | Term | Description |
|---|---|---|---|
| 0.8 | 17.9 | PID RANBP2 PATHWAY | Sumoylation by RanBP2 regulates transcriptional repression |
| 0.6 | 8.4 | PID TCR RAS PATHWAY | Ras signaling in the CD4+ TCR pathway |
| 0.5 | 46.0 | ST DIFFERENTIATION PATHWAY IN PC12 CELLS | Differentiation Pathway in PC12 Cells; this is a specific case of PAC1 Receptor Pathway. |
| 0.3 | 6.2 | PID INTEGRIN4 PATHWAY | Alpha6 beta4 integrin-ligand interactions |
| 0.3 | 4.5 | SA G2 AND M PHASES | Cdc25 activates the cdc2/cyclin B complex to induce the G2/M transition. |
| 0.3 | 11.8 | PID NECTIN PATHWAY | Nectin adhesion pathway |
| 0.3 | 1.4 | PID PDGFRA PATHWAY | PDGFR-alpha signaling pathway |
| 0.3 | 6.5 | PID ERBB NETWORK PATHWAY | ErbB receptor signaling network |
| 0.2 | 2.8 | ST GRANULE CELL SURVIVAL PATHWAY | Granule Cell Survival Pathway is a specific case of more general PAC1 Receptor Pathway. |
| 0.2 | 7.6 | PID PRL SIGNALING EVENTS PATHWAY | Signaling events mediated by PRL |
| 0.2 | 16.4 | PID DELTA NP63 PATHWAY | Validated transcriptional targets of deltaNp63 isoforms |
| 0.2 | 18.5 | PID NOTCH PATHWAY | Notch signaling pathway |
| 0.2 | 2.0 | ST IL 13 PATHWAY | Interleukin 13 (IL-13) Pathway |
| 0.2 | 3.9 | PID A6B1 A6B4 INTEGRIN PATHWAY | a6b1 and a6b4 Integrin signaling |
| 0.2 | 8.0 | PID HIF2PATHWAY | HIF-2-alpha transcription factor network |
| 0.2 | 8.2 | PID INTEGRIN3 PATHWAY | Beta3 integrin cell surface interactions |
| 0.2 | 6.0 | PID FOXM1 PATHWAY | FOXM1 transcription factor network |
| 0.1 | 5.7 | PID RAS PATHWAY | Regulation of Ras family activation |
| 0.1 | 9.8 | SIG INSULIN RECEPTOR PATHWAY IN CARDIAC MYOCYTES | Genes related to the insulin receptor pathway |
| 0.1 | 9.0 | PID RHOA REG PATHWAY | Regulation of RhoA activity |
| 0.1 | 3.9 | PID REELIN PATHWAY | Reelin signaling pathway |
| 0.1 | 8.3 | PID RAC1 REG PATHWAY | Regulation of RAC1 activity |
| 0.1 | 3.9 | PID SYNDECAN 4 PATHWAY | Syndecan-4-mediated signaling events |
| 0.1 | 2.4 | PID INTEGRIN A9B1 PATHWAY | Alpha9 beta1 integrin signaling events |
| 0.1 | 1.9 | PID ARF 3PATHWAY | Arf1 pathway |
| 0.1 | 5.3 | PID ARF6 TRAFFICKING PATHWAY | Arf6 trafficking events |
| 0.1 | 2.6 | PID DNA PK PATHWAY | DNA-PK pathway in nonhomologous end joining |
| 0.1 | 4.2 | PID AJDISS 2PATHWAY | Posttranslational regulation of adherens junction stability and dissassembly |
| 0.1 | 14.5 | NABA ECM AFFILIATED | Genes encoding proteins affiliated structurally or functionally to extracellular matrix proteins |
| 0.1 | 6.4 | PID AP1 PATHWAY | AP-1 transcription factor network |
| 0.1 | 6.3 | PID ERA GENOMIC PATHWAY | Validated nuclear estrogen receptor alpha network |
| 0.1 | 3.8 | SIG REGULATION OF THE ACTIN CYTOSKELETON BY RHO GTPASES | Genes related to regulation of the actin cytoskeleton |
| 0.0 | 3.1 | PID CDC42 PATHWAY | CDC42 signaling events |
| 0.0 | 1.3 | PID ATM PATHWAY | ATM pathway |
| 0.0 | 1.8 | PID CERAMIDE PATHWAY | Ceramide signaling pathway |
| 0.0 | 0.7 | PID CIRCADIAN PATHWAY | Circadian rhythm pathway |
| 0.0 | 2.1 | PID MTOR 4PATHWAY | mTOR signaling pathway |
| 0.0 | 1.3 | PID ERBB1 INTERNALIZATION PATHWAY | Internalization of ErbB1 |
| 0.0 | 0.5 | PID S1P S1P2 PATHWAY | S1P2 pathway |
| 0.0 | 5.5 | NABA ECM REGULATORS | Genes encoding enzymes and their regulators involved in the remodeling of the extracellular matrix |
| 0.0 | 1.6 | PID CASPASE PATHWAY | Caspase cascade in apoptosis |
| 0.0 | 1.6 | PID CMYB PATHWAY | C-MYB transcription factor network |
| 0.0 | 0.1 | SA PROGRAMMED CELL DEATH | Programmed cell death, or apoptosis, eliminates damaged or unneeded cells. |
Gene overrepresentation in curated gene sets: REACTOME pathways category:
| Log-likelihood per target | Total log-likelihood | Term | Description |
|---|---|---|---|
| 1.2 | 33.6 | REACTOME POST CHAPERONIN TUBULIN FOLDING PATHWAY | Genes involved in Post-chaperonin tubulin folding pathway |
| 0.8 | 22.5 | REACTOME CYCLIN A B1 ASSOCIATED EVENTS DURING G2 M TRANSITION | Genes involved in Cyclin A/B1 associated events during G2/M transition |
| 0.7 | 8.4 | REACTOME RAF MAP KINASE CASCADE | Genes involved in RAF/MAP kinase cascade |
| 0.7 | 38.6 | REACTOME GLYCOLYSIS | Genes involved in Glycolysis |
| 0.6 | 13.6 | REACTOME ACTIVATION OF BH3 ONLY PROTEINS | Genes involved in Activation of BH3-only proteins |
| 0.6 | 17.4 | REACTOME N GLYCAN ANTENNAE ELONGATION IN THE MEDIAL TRANS GOLGI | Genes involved in N-glycan antennae elongation in the medial/trans-Golgi |
| 0.5 | 18.1 | REACTOME PROSTACYCLIN SIGNALLING THROUGH PROSTACYCLIN RECEPTOR | Genes involved in Prostacyclin signalling through prostacyclin receptor |
| 0.5 | 12.5 | REACTOME PROTEOLYTIC CLEAVAGE OF SNARE COMPLEX PROTEINS | Genes involved in Proteolytic cleavage of SNARE complex proteins |
| 0.4 | 10.5 | REACTOME TRANSPORT TO THE GOLGI AND SUBSEQUENT MODIFICATION | Genes involved in Transport to the Golgi and subsequent modification |
| 0.4 | 5.0 | REACTOME SYNTHESIS OF BILE ACIDS AND BILE SALTS VIA 24 HYDROXYCHOLESTEROL | Genes involved in Synthesis of bile acids and bile salts via 24-hydroxycholesterol |
| 0.4 | 7.9 | REACTOME SEMA3A PLEXIN REPULSION SIGNALING BY INHIBITING INTEGRIN ADHESION | Genes involved in SEMA3A-Plexin repulsion signaling by inhibiting Integrin adhesion |
| 0.3 | 16.3 | REACTOME FORMATION OF FIBRIN CLOT CLOTTING CASCADE | Genes involved in Formation of Fibrin Clot (Clotting Cascade) |
| 0.3 | 13.8 | REACTOME FATTY ACYL COA BIOSYNTHESIS | Genes involved in Fatty Acyl-CoA Biosynthesis |
| 0.3 | 10.1 | REACTOME FORMATION OF INCISION COMPLEX IN GG NER | Genes involved in Formation of incision complex in GG-NER |
| 0.3 | 11.5 | REACTOME SIGNALING BY NODAL | Genes involved in Signaling by NODAL |
| 0.3 | 8.2 | REACTOME RETROGRADE NEUROTROPHIN SIGNALLING | Genes involved in Retrograde neurotrophin signalling |
| 0.3 | 5.3 | REACTOME CLASS C 3 METABOTROPIC GLUTAMATE PHEROMONE RECEPTORS | Genes involved in Class C/3 (Metabotropic glutamate/pheromone receptors) |
| 0.3 | 4.2 | REACTOME REGULATION OF PYRUVATE DEHYDROGENASE PDH COMPLEX | Genes involved in Regulation of pyruvate dehydrogenase (PDH) complex |
| 0.2 | 6.6 | REACTOME CITRIC ACID CYCLE TCA CYCLE | Genes involved in Citric acid cycle (TCA cycle) |
| 0.2 | 10.0 | REACTOME SEMA4D INDUCED CELL MIGRATION AND GROWTH CONE COLLAPSE | Genes involved in Sema4D induced cell migration and growth-cone collapse |
| 0.2 | 3.6 | REACTOME REVERSIBLE HYDRATION OF CARBON DIOXIDE | Genes involved in Reversible Hydration of Carbon Dioxide |
| 0.2 | 7.6 | REACTOME CASPASE MEDIATED CLEAVAGE OF CYTOSKELETAL PROTEINS | Genes involved in Caspase-mediated cleavage of cytoskeletal proteins |
| 0.2 | 11.2 | REACTOME SIGNALING BY ROBO RECEPTOR | Genes involved in Signaling by Robo receptor |
| 0.2 | 5.5 | REACTOME HS GAG DEGRADATION | Genes involved in HS-GAG degradation |
| 0.2 | 10.6 | REACTOME IRON UPTAKE AND TRANSPORT | Genes involved in Iron uptake and transport |
| 0.2 | 14.2 | REACTOME CROSS PRESENTATION OF SOLUBLE EXOGENOUS ANTIGENS ENDOSOMES | Genes involved in Cross-presentation of soluble exogenous antigens (endosomes) |
| 0.2 | 5.0 | REACTOME SYNTHESIS SECRETION AND INACTIVATION OF GLP1 | Genes involved in Synthesis, Secretion, and Inactivation of Glucagon-like Peptide-1 (GLP-1) |
| 0.2 | 4.0 | REACTOME PROCESSING OF INTRONLESS PRE MRNAS | Genes involved in Processing of Intronless Pre-mRNAs |
| 0.2 | 7.7 | REACTOME ADHERENS JUNCTIONS INTERACTIONS | Genes involved in Adherens junctions interactions |
| 0.2 | 1.5 | REACTOME CYTOSOLIC TRNA AMINOACYLATION | Genes involved in Cytosolic tRNA aminoacylation |
| 0.2 | 6.0 | REACTOME RAP1 SIGNALLING | Genes involved in Rap1 signalling |
| 0.2 | 4.2 | REACTOME KINESINS | Genes involved in Kinesins |
| 0.1 | 2.8 | REACTOME P2Y RECEPTORS | Genes involved in P2Y receptors |
| 0.1 | 26.1 | REACTOME DIABETES PATHWAYS | Genes involved in Diabetes pathways |
| 0.1 | 7.1 | REACTOME BMAL1 CLOCK NPAS2 ACTIVATES CIRCADIAN EXPRESSION | Genes involved in BMAL1:CLOCK/NPAS2 Activates Circadian Expression |
| 0.1 | 4.1 | REACTOME DOWNREGULATION OF TGF BETA RECEPTOR SIGNALING | Genes involved in Downregulation of TGF-beta receptor signaling |
| 0.1 | 2.7 | REACTOME HDL MEDIATED LIPID TRANSPORT | Genes involved in HDL-mediated lipid transport |
| 0.1 | 5.4 | REACTOME BASIGIN INTERACTIONS | Genes involved in Basigin interactions |
| 0.1 | 2.5 | REACTOME ACYL CHAIN REMODELLING OF PE | Genes involved in Acyl chain remodelling of PE |
| 0.1 | 2.6 | REACTOME METABOLISM OF PORPHYRINS | Genes involved in Metabolism of porphyrins |
| 0.1 | 6.9 | REACTOME NUCLEAR SIGNALING BY ERBB4 | Genes involved in Nuclear signaling by ERBB4 |
| 0.1 | 2.0 | REACTOME REGULATION OF IFNG SIGNALING | Genes involved in Regulation of IFNG signaling |
| 0.1 | 17.5 | REACTOME ANTIGEN PROCESSING UBIQUITINATION PROTEASOME DEGRADATION | Genes involved in Antigen processing: Ubiquitination & Proteasome degradation |
| 0.1 | 1.5 | REACTOME MTORC1 MEDIATED SIGNALLING | Genes involved in mTORC1-mediated signalling |
| 0.1 | 0.6 | REACTOME NUCLEOTIDE LIKE PURINERGIC RECEPTORS | Genes involved in Nucleotide-like (purinergic) receptors |
| 0.1 | 2.3 | REACTOME CHOLESTEROL BIOSYNTHESIS | Genes involved in Cholesterol biosynthesis |
| 0.1 | 1.4 | REACTOME REGULATION OF INSULIN SECRETION BY GLUCAGON LIKE PEPTIDE1 | Genes involved in Regulation of Insulin Secretion by Glucagon-like Peptide-1 |
| 0.1 | 1.1 | REACTOME EGFR DOWNREGULATION | Genes involved in EGFR downregulation |
| 0.1 | 2.3 | REACTOME MRNA SPLICING MINOR PATHWAY | Genes involved in mRNA Splicing - Minor Pathway |
| 0.1 | 1.3 | REACTOME HYALURONAN METABOLISM | Genes involved in Hyaluronan metabolism |
| 0.1 | 1.2 | REACTOME PREFOLDIN MEDIATED TRANSFER OF SUBSTRATE TO CCT TRIC | Genes involved in Prefoldin mediated transfer of substrate to CCT/TriC |
| 0.1 | 1.5 | REACTOME MRNA 3 END PROCESSING | Genes involved in mRNA 3'-end processing |
| 0.0 | 3.7 | REACTOME METABOLISM OF VITAMINS AND COFACTORS | Genes involved in Metabolism of vitamins and cofactors |
| 0.0 | 0.4 | REACTOME GRB2 SOS PROVIDES LINKAGE TO MAPK SIGNALING FOR INTERGRINS | Genes involved in GRB2:SOS provides linkage to MAPK signaling for Intergrins |
| 0.0 | 0.6 | REACTOME PYRIMIDINE CATABOLISM | Genes involved in Pyrimidine catabolism |
| 0.0 | 3.3 | REACTOME RESPIRATORY ELECTRON TRANSPORT | Genes involved in Respiratory electron transport |
| 0.0 | 2.0 | REACTOME APOPTOTIC CLEAVAGE OF CELLULAR PROTEINS | Genes involved in Apoptotic cleavage of cellular proteins |
| 0.0 | 3.5 | REACTOME MITOTIC PROMETAPHASE | Genes involved in Mitotic Prometaphase |
| 0.0 | 0.7 | REACTOME REGULATION OF RHEB GTPASE ACTIVITY BY AMPK | Genes involved in Regulation of Rheb GTPase activity by AMPK |
| 0.0 | 0.8 | REACTOME INHIBITION OF INSULIN SECRETION BY ADRENALINE NORADRENALINE | Genes involved in Inhibition of Insulin Secretion by Adrenaline/Noradrenaline |
| 0.0 | 2.6 | REACTOME MRNA SPLICING | Genes involved in mRNA Splicing |
| 0.0 | 0.4 | REACTOME REMOVAL OF THE FLAP INTERMEDIATE FROM THE C STRAND | Genes involved in Removal of the Flap Intermediate from the C-strand |
| 0.0 | 5.5 | REACTOME SIGNALING BY RHO GTPASES | Genes involved in Signaling by Rho GTPases |
| 0.0 | 0.6 | REACTOME HOMOLOGOUS RECOMBINATION REPAIR OF REPLICATION INDEPENDENT DOUBLE STRAND BREAKS | Genes involved in Homologous recombination repair of replication-independent double-strand breaks |
| 0.0 | 5.2 | REACTOME NONSENSE MEDIATED DECAY ENHANCED BY THE EXON JUNCTION COMPLEX | Genes involved in Nonsense Mediated Decay Enhanced by the Exon Junction Complex |
| 0.0 | 1.8 | REACTOME PI METABOLISM | Genes involved in PI Metabolism |
| 0.0 | 0.7 | REACTOME NETRIN1 SIGNALING | Genes involved in Netrin-1 signaling |
| 0.0 | 1.8 | REACTOME RESPONSE TO ELEVATED PLATELET CYTOSOLIC CA2 | Genes involved in Response to elevated platelet cytosolic Ca2+ |
| 0.0 | 0.3 | REACTOME METABOLISM OF POLYAMINES | Genes involved in Metabolism of polyamines |