Project
GNF SymAtlas + NCI-60 cancer cell lines, human (Su, 2004; Ross, 2000)
Navigation
Downloads
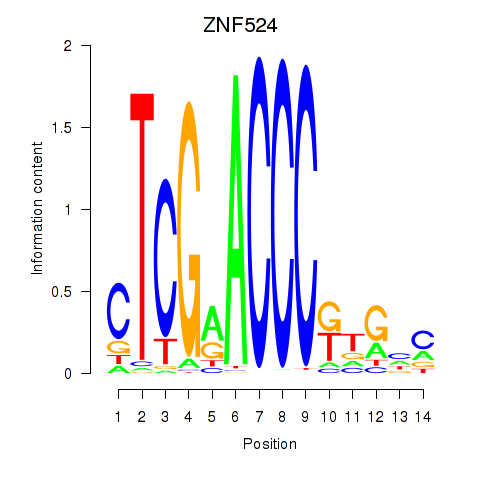
Results for ZNF524
Z-value: 1.04
Motif logo
Transcription factors associated with ZNF524
| Gene Symbol | Gene ID | Gene Info |
|---|---|---|
|
ZNF524
|
ENSG00000171443.7 | ZNF524 |
Activity profile of ZNF524 motif
Sorted Z-values of ZNF524 motif
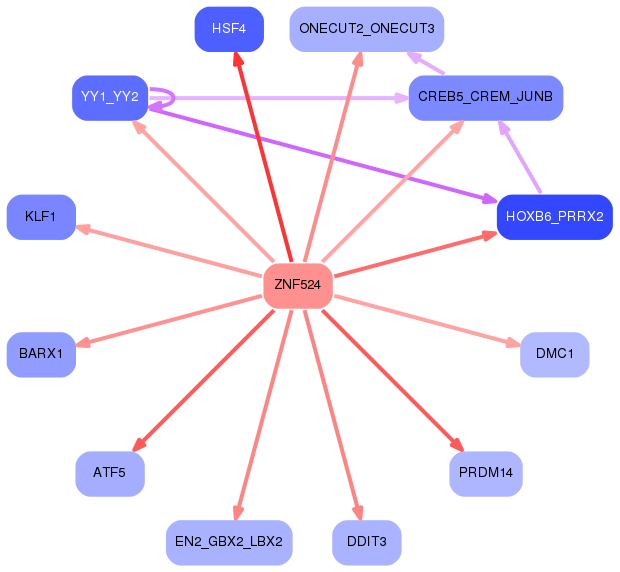
Network of associatons between targets according to the STRING database.

First level regulatory network of ZNF524
Gene Ontology Analysis
Gene overrepresentation in biological process category:
| Log-likelihood per target | Total log-likelihood | Term | Description |
|---|---|---|---|
| 4.1 | 20.6 | GO:1902612 | regulation of anti-Mullerian hormone signaling pathway(GO:1902612) negative regulation of anti-Mullerian hormone signaling pathway(GO:1902613) anti-Mullerian hormone signaling pathway(GO:1990262) |
| 4.1 | 16.4 | GO:0006542 | glutamine biosynthetic process(GO:0006542) |
| 3.4 | 10.1 | GO:0002416 | IgG immunoglobulin transcytosis in epithelial cells mediated by FcRn immunoglobulin receptor(GO:0002416) |
| 3.3 | 13.3 | GO:0019072 | viral genome packaging(GO:0019072) viral RNA genome packaging(GO:0019074) |
| 3.1 | 12.5 | GO:0018230 | peptidyl-L-cysteine S-palmitoylation(GO:0018230) peptidyl-S-diacylglycerol-L-cysteine biosynthetic process from peptidyl-cysteine(GO:0018231) |
| 2.8 | 8.5 | GO:1904692 | positive regulation of type B pancreatic cell proliferation(GO:1904692) |
| 1.9 | 13.2 | GO:0034587 | piRNA metabolic process(GO:0034587) |
| 1.8 | 5.3 | GO:0046271 | phenylpropanoid catabolic process(GO:0046271) |
| 1.8 | 5.3 | GO:1903526 | negative regulation of membrane tubulation(GO:1903526) |
| 1.7 | 5.2 | GO:0006683 | galactosylceramide catabolic process(GO:0006683) |
| 1.7 | 5.1 | GO:1904397 | negative regulation of neuromuscular junction development(GO:1904397) |
| 1.7 | 8.4 | GO:1901350 | cell-cell signaling involved in cell-cell junction organization(GO:1901350) |
| 1.5 | 4.6 | GO:0035720 | intraciliary anterograde transport(GO:0035720) |
| 1.5 | 4.6 | GO:1901420 | negative regulation of response to alcohol(GO:1901420) |
| 1.5 | 3.0 | GO:2001034 | positive regulation of double-strand break repair via nonhomologous end joining(GO:2001034) |
| 1.4 | 9.9 | GO:0030421 | defecation(GO:0030421) |
| 1.4 | 5.6 | GO:0035627 | ceramide transport(GO:0035627) |
| 1.4 | 4.2 | GO:0061304 | retinal blood vessel morphogenesis(GO:0061304) |
| 1.3 | 4.0 | GO:1903383 | neuron intrinsic apoptotic signaling pathway in response to hydrogen peroxide(GO:0036482) positive regulation of mitochondrial electron transport, NADH to ubiquinone(GO:1902958) regulation of hydrogen peroxide-induced neuron intrinsic apoptotic signaling pathway(GO:1903383) negative regulation of hydrogen peroxide-induced neuron intrinsic apoptotic signaling pathway(GO:1903384) |
| 1.3 | 6.5 | GO:0038161 | prolactin signaling pathway(GO:0038161) |
| 1.3 | 3.8 | GO:0010133 | proline catabolic process to glutamate(GO:0010133) |
| 1.2 | 8.7 | GO:0070212 | protein poly-ADP-ribosylation(GO:0070212) |
| 1.2 | 17.1 | GO:0015074 | DNA integration(GO:0015074) |
| 1.2 | 3.7 | GO:0030451 | regulation of complement activation, alternative pathway(GO:0030451) negative regulation of complement activation, alternative pathway(GO:0045957) |
| 1.2 | 3.6 | GO:0006421 | asparaginyl-tRNA aminoacylation(GO:0006421) |
| 1.2 | 3.6 | GO:0061591 | calcium activated phospholipid scrambling(GO:0061588) calcium activated phosphatidylcholine scrambling(GO:0061590) calcium activated galactosylceramide scrambling(GO:0061591) |
| 1.2 | 3.5 | GO:1903465 | vacuolar phosphate transport(GO:0007037) positive regulation of mitotic cell cycle DNA replication(GO:1903465) positive regulation of parathyroid hormone secretion(GO:2000830) |
| 1.1 | 3.4 | GO:0007199 | G-protein coupled receptor signaling pathway coupled to cGMP nucleotide second messenger(GO:0007199) response to muscle activity involved in regulation of muscle adaptation(GO:0014873) |
| 1.1 | 3.4 | GO:0021555 | midbrain-hindbrain boundary morphogenesis(GO:0021555) |
| 1.1 | 2.3 | GO:0019249 | lactate biosynthetic process(GO:0019249) |
| 1.1 | 3.4 | GO:0019482 | beta-alanine metabolic process(GO:0019482) |
| 1.1 | 5.5 | GO:1902093 | positive regulation of sperm motility(GO:1902093) |
| 1.1 | 11.0 | GO:0033629 | negative regulation of cell adhesion mediated by integrin(GO:0033629) |
| 1.1 | 9.6 | GO:0006531 | aspartate metabolic process(GO:0006531) |
| 1.0 | 5.2 | GO:0035106 | operant conditioning(GO:0035106) |
| 1.0 | 4.1 | GO:0002357 | defense response to tumor cell(GO:0002357) |
| 1.0 | 3.0 | GO:0031550 | positive regulation of brain-derived neurotrophic factor receptor signaling pathway(GO:0031550) |
| 0.9 | 11.4 | GO:0001955 | blood vessel maturation(GO:0001955) |
| 0.9 | 2.8 | GO:0098507 | polynucleotide 5' dephosphorylation(GO:0098507) |
| 0.9 | 1.8 | GO:0021592 | fourth ventricle development(GO:0021592) third ventricle development(GO:0021678) |
| 0.9 | 2.7 | GO:0019605 | benzoate metabolic process(GO:0018874) butyrate metabolic process(GO:0019605) |
| 0.9 | 3.6 | GO:0006627 | protein processing involved in protein targeting to mitochondrion(GO:0006627) |
| 0.9 | 7.0 | GO:0000160 | phosphorelay signal transduction system(GO:0000160) |
| 0.9 | 2.6 | GO:1990918 | meiotic DNA double-strand break processing(GO:0000706) double-strand break repair involved in meiotic recombination(GO:1990918) |
| 0.9 | 4.3 | GO:0032849 | positive regulation of cellular pH reduction(GO:0032849) |
| 0.9 | 2.6 | GO:0002086 | diaphragm contraction(GO:0002086) |
| 0.9 | 6.0 | GO:0019343 | cysteine biosynthetic process via cystathionine(GO:0019343) |
| 0.8 | 2.5 | GO:0001978 | regulation of systemic arterial blood pressure by carotid sinus baroreceptor feedback(GO:0001978) baroreceptor response to increased systemic arterial blood pressure(GO:0001983) |
| 0.8 | 4.2 | GO:0060800 | regulation of cell differentiation involved in embryonic placenta development(GO:0060800) |
| 0.8 | 1.7 | GO:0032972 | regulation of muscle filament sliding speed(GO:0032972) |
| 0.8 | 1.7 | GO:0036515 | serotonergic neuron axon guidance(GO:0036515) |
| 0.8 | 3.3 | GO:0035625 | negative regulation of epinephrine secretion(GO:0032811) epidermal growth factor-activated receptor transactivation by G-protein coupled receptor signaling pathway(GO:0035625) |
| 0.8 | 1.6 | GO:0036091 | positive regulation of transcription from RNA polymerase II promoter in response to oxidative stress(GO:0036091) |
| 0.8 | 5.7 | GO:0032466 | negative regulation of cytokinesis(GO:0032466) |
| 0.8 | 3.2 | GO:0033693 | neurofilament bundle assembly(GO:0033693) |
| 0.8 | 3.2 | GO:0045065 | cytotoxic T cell differentiation(GO:0045065) |
| 0.8 | 7.8 | GO:0001766 | membrane raft polarization(GO:0001766) membrane raft distribution(GO:0031580) |
| 0.8 | 8.5 | GO:0010499 | proteasomal ubiquitin-independent protein catabolic process(GO:0010499) |
| 0.8 | 3.9 | GO:0045906 | negative regulation of vasoconstriction(GO:0045906) |
| 0.8 | 1.5 | GO:0061047 | foregut regionalization(GO:0060423) lung field specification(GO:0060424) primary lung bud formation(GO:0060431) lung induction(GO:0060492) positive regulation of branching involved in lung morphogenesis(GO:0061047) |
| 0.8 | 1.5 | GO:1902623 | negative regulation of granulocyte chemotaxis(GO:0071623) negative regulation of neutrophil chemotaxis(GO:0090024) negative regulation of neutrophil migration(GO:1902623) |
| 0.8 | 1.5 | GO:0006145 | purine nucleobase catabolic process(GO:0006145) |
| 0.8 | 2.3 | GO:0006711 | estrogen catabolic process(GO:0006711) |
| 0.8 | 3.0 | GO:1904640 | response to methionine(GO:1904640) |
| 0.8 | 1.5 | GO:0010700 | negative regulation of norepinephrine secretion(GO:0010700) |
| 0.7 | 3.7 | GO:0093001 | glycolysis from storage polysaccharide through glucose-1-phosphate(GO:0093001) |
| 0.7 | 4.4 | GO:0006398 | mRNA 3'-end processing by stem-loop binding and cleavage(GO:0006398) |
| 0.7 | 1.5 | GO:0000965 | mitochondrial RNA 3'-end processing(GO:0000965) |
| 0.7 | 9.3 | GO:0033617 | mitochondrial respiratory chain complex IV assembly(GO:0033617) |
| 0.7 | 2.1 | GO:2000048 | negative regulation of cell-cell adhesion mediated by cadherin(GO:2000048) |
| 0.7 | 9.0 | GO:0021891 | olfactory bulb interneuron development(GO:0021891) |
| 0.7 | 2.1 | GO:0036089 | cleavage furrow formation(GO:0036089) establishment of meiotic spindle localization(GO:0051295) |
| 0.7 | 1.4 | GO:0071603 | endothelial cell-cell adhesion(GO:0071603) |
| 0.7 | 2.0 | GO:0051939 | gamma-aminobutyric acid import(GO:0051939) |
| 0.7 | 4.7 | GO:0010961 | cellular magnesium ion homeostasis(GO:0010961) |
| 0.7 | 8.7 | GO:0010668 | ectodermal cell differentiation(GO:0010668) |
| 0.7 | 2.7 | GO:1990414 | replication-born double-strand break repair via sister chromatid exchange(GO:1990414) |
| 0.7 | 4.0 | GO:0006540 | glutamate decarboxylation to succinate(GO:0006540) |
| 0.7 | 7.2 | GO:0010756 | positive regulation of plasminogen activation(GO:0010756) |
| 0.6 | 7.0 | GO:2000427 | positive regulation of apoptotic cell clearance(GO:2000427) |
| 0.6 | 1.9 | GO:0045897 | positive regulation of transcription during mitosis(GO:0045897) |
| 0.6 | 3.7 | GO:0006001 | fructose catabolic process(GO:0006001) fructose catabolic process to hydroxyacetone phosphate and glyceraldehyde-3-phosphate(GO:0061624) |
| 0.6 | 4.3 | GO:0006489 | dolichyl diphosphate biosynthetic process(GO:0006489) dolichyl diphosphate metabolic process(GO:0046465) |
| 0.6 | 5.4 | GO:0032790 | ribosome disassembly(GO:0032790) |
| 0.6 | 1.8 | GO:0038155 | interleukin-23-mediated signaling pathway(GO:0038155) |
| 0.6 | 1.8 | GO:1904491 | protein localization to ciliary transition zone(GO:1904491) |
| 0.6 | 1.8 | GO:1902595 | regulation of DNA replication origin binding(GO:1902595) |
| 0.6 | 5.2 | GO:0060158 | phospholipase C-activating dopamine receptor signaling pathway(GO:0060158) |
| 0.6 | 1.7 | GO:0045631 | regulation of auditory receptor cell differentiation(GO:0045607) regulation of mechanoreceptor differentiation(GO:0045631) regulation of inner ear receptor cell differentiation(GO:2000980) |
| 0.6 | 2.8 | GO:0015742 | alpha-ketoglutarate transport(GO:0015742) |
| 0.5 | 3.3 | GO:0042780 | tRNA 3'-end processing(GO:0042780) |
| 0.5 | 7.7 | GO:0034242 | negative regulation of syncytium formation by plasma membrane fusion(GO:0034242) |
| 0.5 | 2.2 | GO:2000314 | fibroblast growth factor receptor signaling pathway involved in neural plate anterior/posterior pattern formation(GO:0060825) regulation of neural crest formation(GO:0090299) negative regulation of neural crest formation(GO:0090301) regulation of fibroblast growth factor receptor signaling pathway involved in neural plate anterior/posterior pattern formation(GO:2000313) negative regulation of fibroblast growth factor receptor signaling pathway involved in neural plate anterior/posterior pattern formation(GO:2000314) |
| 0.5 | 1.6 | GO:0072100 | apoptotic process involved in endocardial cushion morphogenesis(GO:0003277) intermediate mesoderm development(GO:0048389) intermediate mesoderm morphogenesis(GO:0048390) intermediate mesoderm formation(GO:0048391) intermediate mesodermal cell differentiation(GO:0048392) regulation of cardiac muscle fiber development(GO:0055018) positive regulation of cardiac muscle fiber development(GO:0055020) bud dilation involved in lung branching(GO:0060503) regulation of transcription from RNA polymerase II promoter involved in kidney development(GO:0060994) BMP signaling pathway involved in ureter morphogenesis(GO:0061149) renal system segmentation(GO:0061150) BMP signaling pathway involved in renal system segmentation(GO:0061151) pulmonary artery endothelial tube morphogenesis(GO:0061155) regulation of transcription from RNA polymerase II promoter involved in mesonephros development(GO:0061216) pattern specification involved in mesonephros development(GO:0061227) BMP signaling pathway involved in nephric duct formation(GO:0071893) negative regulation of branch elongation involved in ureteric bud branching(GO:0072096) negative regulation of branch elongation involved in ureteric bud branching by BMP signaling pathway(GO:0072097) anterior/posterior pattern specification involved in kidney development(GO:0072098) anterior/posterior pattern specification involved in ureteric bud development(GO:0072099) specification of ureteric bud anterior/posterior symmetry(GO:0072100) specification of ureteric bud anterior/posterior symmetry by BMP signaling pathway(GO:0072101) ureter epithelial cell differentiation(GO:0072192) negative regulation of mesenchymal cell proliferation involved in ureter development(GO:0072200) positive regulation of cell proliferation involved in outflow tract morphogenesis(GO:1901964) cardiac jelly development(GO:1905072) regulation of metanephric S-shaped body morphogenesis(GO:2000004) negative regulation of metanephric S-shaped body morphogenesis(GO:2000005) regulation of metanephric comma-shaped body morphogenesis(GO:2000006) negative regulation of metanephric comma-shaped body morphogenesis(GO:2000007) negative regulation of cell proliferation involved in heart morphogenesis(GO:2000137) |
| 0.5 | 3.2 | GO:0060370 | susceptibility to T cell mediated cytotoxicity(GO:0060370) |
| 0.5 | 2.6 | GO:0042796 | snRNA transcription from RNA polymerase III promoter(GO:0042796) |
| 0.5 | 10.3 | GO:0033169 | histone H3-K9 demethylation(GO:0033169) |
| 0.5 | 1.5 | GO:1905232 | cellular response to L-glutamate(GO:1905232) |
| 0.5 | 2.5 | GO:0061762 | CAMKK-AMPK signaling cascade(GO:0061762) |
| 0.5 | 2.5 | GO:0007056 | spindle assembly involved in female meiosis(GO:0007056) |
| 0.5 | 0.5 | GO:0048242 | regulation of epinephrine secretion(GO:0014060) epinephrine secretion(GO:0048242) |
| 0.5 | 1.5 | GO:0003180 | aortic valve development(GO:0003176) aortic valve morphogenesis(GO:0003180) |
| 0.5 | 2.9 | GO:0022027 | interkinetic nuclear migration(GO:0022027) |
| 0.5 | 9.1 | GO:0003351 | epithelial cilium movement(GO:0003351) |
| 0.5 | 3.8 | GO:0051121 | hepoxilin metabolic process(GO:0051121) hepoxilin biosynthetic process(GO:0051122) |
| 0.5 | 6.2 | GO:1900029 | positive regulation of ruffle assembly(GO:1900029) |
| 0.5 | 1.4 | GO:0038193 | thromboxane A2 signaling pathway(GO:0038193) |
| 0.5 | 8.8 | GO:0042424 | catechol-containing compound catabolic process(GO:0019614) catecholamine catabolic process(GO:0042424) |
| 0.5 | 5.0 | GO:1904262 | negative regulation of TORC1 signaling(GO:1904262) |
| 0.4 | 2.7 | GO:0046599 | regulation of centriole replication(GO:0046599) |
| 0.4 | 2.6 | GO:0032431 | diacylglycerol biosynthetic process(GO:0006651) activation of phospholipase A2 activity(GO:0032431) |
| 0.4 | 2.2 | GO:0086045 | membrane depolarization during AV node cell action potential(GO:0086045) |
| 0.4 | 3.5 | GO:0003190 | atrioventricular valve formation(GO:0003190) |
| 0.4 | 1.7 | GO:2000393 | negative regulation of lamellipodium morphogenesis(GO:2000393) |
| 0.4 | 8.1 | GO:0046337 | phosphatidylethanolamine metabolic process(GO:0046337) |
| 0.4 | 3.4 | GO:0007144 | female meiosis I(GO:0007144) |
| 0.4 | 8.4 | GO:0044458 | motile cilium assembly(GO:0044458) |
| 0.4 | 2.9 | GO:0014050 | negative regulation of glutamate secretion(GO:0014050) |
| 0.4 | 1.3 | GO:0044789 | modulation by host of viral release from host cell(GO:0044789) positive regulation by host of viral release from host cell(GO:0044791) |
| 0.4 | 1.2 | GO:0006565 | L-serine catabolic process(GO:0006565) |
| 0.4 | 0.8 | GO:0060535 | trachea cartilage morphogenesis(GO:0060535) |
| 0.4 | 1.2 | GO:0032887 | regulation of spindle elongation(GO:0032887) regulation of mitotic spindle elongation(GO:0032888) anastral spindle assembly(GO:0055048) protein localization to spindle pole body(GO:0071988) regulation of protein localization to spindle pole body(GO:1902363) positive regulation of protein localization to spindle pole body(GO:1902365) positive regulation of mitotic spindle elongation(GO:1902846) |
| 0.4 | 1.2 | GO:0035359 | negative regulation of peroxisome proliferator activated receptor signaling pathway(GO:0035359) |
| 0.4 | 2.0 | GO:0071442 | positive regulation of histone H3-K14 acetylation(GO:0071442) |
| 0.4 | 1.2 | GO:0042560 | folic acid-containing compound catabolic process(GO:0009397) pteridine-containing compound catabolic process(GO:0042560) |
| 0.4 | 2.3 | GO:0006710 | androgen catabolic process(GO:0006710) |
| 0.4 | 2.3 | GO:0006021 | inositol biosynthetic process(GO:0006021) |
| 0.4 | 1.2 | GO:0070317 | negative regulation of G0 to G1 transition(GO:0070317) |
| 0.4 | 1.5 | GO:0009956 | radial pattern formation(GO:0009956) |
| 0.4 | 1.9 | GO:1904207 | regulation of chemokine (C-C motif) ligand 2 secretion(GO:1904207) positive regulation of chemokine (C-C motif) ligand 2 secretion(GO:1904209) |
| 0.4 | 3.7 | GO:1901525 | negative regulation of macromitophagy(GO:1901525) |
| 0.4 | 1.5 | GO:0060480 | lung goblet cell differentiation(GO:0060480) |
| 0.4 | 1.1 | GO:0071169 | establishment of protein localization to chromatin(GO:0071169) |
| 0.4 | 3.7 | GO:0006707 | cholesterol catabolic process(GO:0006707) sterol catabolic process(GO:0016127) |
| 0.4 | 2.2 | GO:0018343 | protein farnesylation(GO:0018343) |
| 0.4 | 2.2 | GO:0042713 | sperm ejaculation(GO:0042713) |
| 0.4 | 1.8 | GO:0046167 | glycerol-3-phosphate biosynthetic process(GO:0046167) |
| 0.4 | 1.1 | GO:2000053 | regulation of Wnt signaling pathway involved in dorsal/ventral axis specification(GO:2000053) |
| 0.3 | 1.4 | GO:1990086 | lens fiber cell apoptotic process(GO:1990086) |
| 0.3 | 1.7 | GO:0032902 | nerve growth factor production(GO:0032902) |
| 0.3 | 1.0 | GO:0021999 | neural plate anterior/posterior regionalization(GO:0021999) |
| 0.3 | 3.1 | GO:0070475 | rRNA base methylation(GO:0070475) |
| 0.3 | 2.0 | GO:0043654 | recognition of apoptotic cell(GO:0043654) |
| 0.3 | 2.7 | GO:1900748 | positive regulation of vascular endothelial growth factor signaling pathway(GO:1900748) |
| 0.3 | 5.7 | GO:0090360 | platelet-derived growth factor production(GO:0090360) regulation of platelet-derived growth factor production(GO:0090361) |
| 0.3 | 3.7 | GO:0021942 | radial glia guided migration of Purkinje cell(GO:0021942) |
| 0.3 | 0.3 | GO:0045950 | negative regulation of mitotic recombination(GO:0045950) |
| 0.3 | 1.6 | GO:0035973 | aggrephagy(GO:0035973) |
| 0.3 | 3.9 | GO:0003406 | retinal pigment epithelium development(GO:0003406) |
| 0.3 | 1.6 | GO:0030259 | lipid glycosylation(GO:0030259) |
| 0.3 | 0.6 | GO:0032242 | regulation of nucleoside transport(GO:0032242) |
| 0.3 | 3.2 | GO:1903546 | protein localization to photoreceptor outer segment(GO:1903546) |
| 0.3 | 4.8 | GO:0016576 | histone dephosphorylation(GO:0016576) |
| 0.3 | 0.6 | GO:2001274 | negative regulation of glucose import in response to insulin stimulus(GO:2001274) |
| 0.3 | 1.9 | GO:1902474 | positive regulation of protein localization to synapse(GO:1902474) |
| 0.3 | 3.4 | GO:0014029 | neural crest formation(GO:0014029) |
| 0.3 | 4.3 | GO:0031284 | positive regulation of guanylate cyclase activity(GO:0031284) |
| 0.3 | 0.9 | GO:0090675 | intermicrovillar adhesion(GO:0090675) |
| 0.3 | 2.4 | GO:1902412 | regulation of mitotic cytokinesis(GO:1902412) |
| 0.3 | 9.0 | GO:0034204 | lipid translocation(GO:0034204) phospholipid translocation(GO:0045332) |
| 0.3 | 1.5 | GO:0021590 | cerebellum maturation(GO:0021590) cerebellar cortex maturation(GO:0021699) |
| 0.3 | 5.1 | GO:0006706 | steroid catabolic process(GO:0006706) |
| 0.3 | 1.2 | GO:2001169 | regulation of ATP biosynthetic process(GO:2001169) positive regulation of ATP biosynthetic process(GO:2001171) |
| 0.3 | 1.5 | GO:0006990 | positive regulation of transcription from RNA polymerase II promoter involved in unfolded protein response(GO:0006990) |
| 0.3 | 0.9 | GO:0015888 | thiamine transport(GO:0015888) thiamine transmembrane transport(GO:0071934) |
| 0.3 | 0.6 | GO:0098989 | NMDA selective glutamate receptor signaling pathway(GO:0098989) |
| 0.3 | 0.9 | GO:0098759 | response to interleukin-8(GO:0098758) cellular response to interleukin-8(GO:0098759) |
| 0.3 | 5.5 | GO:0003215 | cardiac right ventricle morphogenesis(GO:0003215) |
| 0.3 | 2.3 | GO:0007506 | gonadal mesoderm development(GO:0007506) |
| 0.3 | 0.6 | GO:0001880 | Mullerian duct regression(GO:0001880) |
| 0.3 | 1.7 | GO:0016554 | cytidine to uridine editing(GO:0016554) |
| 0.3 | 0.9 | GO:0051040 | regulation of calcium-independent cell-cell adhesion(GO:0051040) |
| 0.3 | 10.6 | GO:0007140 | male meiosis(GO:0007140) |
| 0.3 | 3.3 | GO:1900227 | positive regulation of NLRP3 inflammasome complex assembly(GO:1900227) |
| 0.3 | 1.9 | GO:1904098 | regulation of protein O-linked glycosylation(GO:1904098) positive regulation of protein O-linked glycosylation(GO:1904100) |
| 0.3 | 0.8 | GO:0002876 | positive regulation of chronic inflammatory response to antigenic stimulus(GO:0002876) |
| 0.3 | 1.6 | GO:0071105 | response to interleukin-11(GO:0071105) |
| 0.3 | 4.9 | GO:0010826 | negative regulation of centrosome duplication(GO:0010826) |
| 0.3 | 1.9 | GO:0033210 | leptin-mediated signaling pathway(GO:0033210) |
| 0.3 | 2.4 | GO:0090045 | positive regulation of deacetylase activity(GO:0090045) regulation of histone deacetylase activity(GO:1901725) positive regulation of histone deacetylase activity(GO:1901727) |
| 0.3 | 4.1 | GO:0007220 | Notch receptor processing(GO:0007220) |
| 0.3 | 6.2 | GO:0060856 | establishment of blood-brain barrier(GO:0060856) |
| 0.3 | 1.6 | GO:0034350 | regulation of glial cell apoptotic process(GO:0034350) negative regulation of glial cell apoptotic process(GO:0034351) |
| 0.3 | 4.0 | GO:0001976 | neurological system process involved in regulation of systemic arterial blood pressure(GO:0001976) |
| 0.3 | 2.9 | GO:0044341 | sodium-dependent phosphate transport(GO:0044341) |
| 0.3 | 1.6 | GO:0051573 | negative regulation of histone H3-K9 methylation(GO:0051573) |
| 0.3 | 0.8 | GO:0042418 | epinephrine biosynthetic process(GO:0042418) |
| 0.3 | 1.3 | GO:0008063 | Toll signaling pathway(GO:0008063) |
| 0.3 | 4.1 | GO:0048681 | negative regulation of axon regeneration(GO:0048681) |
| 0.3 | 1.8 | GO:0060907 | positive regulation of macrophage cytokine production(GO:0060907) |
| 0.3 | 6.5 | GO:1902259 | regulation of delayed rectifier potassium channel activity(GO:1902259) |
| 0.2 | 1.2 | GO:0009635 | response to herbicide(GO:0009635) |
| 0.2 | 1.7 | GO:0018344 | protein geranylgeranylation(GO:0018344) |
| 0.2 | 4.9 | GO:0019371 | cyclooxygenase pathway(GO:0019371) |
| 0.2 | 3.9 | GO:0061577 | calcium ion transmembrane transport via high voltage-gated calcium channel(GO:0061577) |
| 0.2 | 1.5 | GO:0006287 | base-excision repair, gap-filling(GO:0006287) |
| 0.2 | 1.9 | GO:2001137 | positive regulation of endocytic recycling(GO:2001137) |
| 0.2 | 4.0 | GO:0070208 | protein heterotrimerization(GO:0070208) |
| 0.2 | 1.4 | GO:0070829 | response to vitamin B2(GO:0033274) heterochromatin maintenance(GO:0070829) |
| 0.2 | 1.9 | GO:0030579 | ubiquitin-dependent SMAD protein catabolic process(GO:0030579) |
| 0.2 | 0.9 | GO:1903371 | regulation of endoplasmic reticulum tubular network organization(GO:1903371) |
| 0.2 | 2.3 | GO:0014043 | negative regulation of neuron maturation(GO:0014043) |
| 0.2 | 2.9 | GO:2001199 | negative regulation of dendritic cell differentiation(GO:2001199) |
| 0.2 | 7.9 | GO:0034080 | chromatin remodeling at centromere(GO:0031055) CENP-A containing nucleosome assembly(GO:0034080) CENP-A containing chromatin organization(GO:0061641) |
| 0.2 | 2.0 | GO:0090043 | regulation of tubulin deacetylation(GO:0090043) |
| 0.2 | 2.4 | GO:0055089 | fatty acid homeostasis(GO:0055089) |
| 0.2 | 2.6 | GO:0016191 | synaptic vesicle uncoating(GO:0016191) |
| 0.2 | 1.5 | GO:0051490 | negative regulation of filopodium assembly(GO:0051490) |
| 0.2 | 0.9 | GO:1900244 | positive regulation of synaptic vesicle endocytosis(GO:1900244) positive regulation of synaptic vesicle recycling(GO:1903423) |
| 0.2 | 0.6 | GO:0010166 | wax biosynthetic process(GO:0010025) wax metabolic process(GO:0010166) |
| 0.2 | 1.0 | GO:1900175 | sequestering of BMP in extracellular matrix(GO:0035582) regulation of nodal signaling pathway involved in determination of left/right asymmetry(GO:1900145) regulation of nodal signaling pathway involved in determination of lateral mesoderm left/right asymmetry(GO:1900175) |
| 0.2 | 2.1 | GO:1900028 | negative regulation of ruffle assembly(GO:1900028) |
| 0.2 | 2.7 | GO:0021796 | cerebral cortex regionalization(GO:0021796) |
| 0.2 | 8.9 | GO:0048791 | calcium ion-regulated exocytosis of neurotransmitter(GO:0048791) |
| 0.2 | 0.2 | GO:0098917 | retrograde trans-synaptic signaling(GO:0098917) |
| 0.2 | 0.4 | GO:0090290 | positive regulation of osteoclast proliferation(GO:0090290) |
| 0.2 | 3.0 | GO:0090286 | cytoskeletal anchoring at nuclear membrane(GO:0090286) |
| 0.2 | 3.0 | GO:0045821 | positive regulation of glycolytic process(GO:0045821) |
| 0.2 | 2.0 | GO:0006390 | transcription from mitochondrial promoter(GO:0006390) |
| 0.2 | 1.8 | GO:0018026 | peptidyl-lysine monomethylation(GO:0018026) |
| 0.2 | 7.6 | GO:0060216 | definitive hemopoiesis(GO:0060216) |
| 0.2 | 2.0 | GO:1901409 | positive regulation of phosphorylation of RNA polymerase II C-terminal domain(GO:1901409) |
| 0.2 | 0.8 | GO:0006701 | progesterone biosynthetic process(GO:0006701) |
| 0.2 | 2.6 | GO:0030299 | intestinal cholesterol absorption(GO:0030299) intestinal lipid absorption(GO:0098856) |
| 0.2 | 3.9 | GO:0060732 | positive regulation of inositol phosphate biosynthetic process(GO:0060732) |
| 0.2 | 1.2 | GO:0036109 | alpha-linolenic acid metabolic process(GO:0036109) |
| 0.2 | 1.0 | GO:0032383 | regulation of intracellular lipid transport(GO:0032377) regulation of intracellular sterol transport(GO:0032380) regulation of intracellular cholesterol transport(GO:0032383) |
| 0.2 | 4.3 | GO:0030220 | platelet formation(GO:0030220) |
| 0.2 | 2.7 | GO:0042136 | neurotransmitter biosynthetic process(GO:0042136) |
| 0.2 | 5.0 | GO:0001580 | detection of chemical stimulus involved in sensory perception of bitter taste(GO:0001580) |
| 0.2 | 0.6 | GO:0072709 | cellular response to sorbitol(GO:0072709) |
| 0.2 | 5.9 | GO:2000785 | regulation of autophagosome assembly(GO:2000785) |
| 0.2 | 1.3 | GO:0032218 | riboflavin transport(GO:0032218) |
| 0.2 | 0.9 | GO:0031017 | transformation of host cell by virus(GO:0019087) exocrine pancreas development(GO:0031017) |
| 0.2 | 5.7 | GO:0045746 | negative regulation of Notch signaling pathway(GO:0045746) |
| 0.2 | 7.5 | GO:0042461 | photoreceptor cell development(GO:0042461) |
| 0.2 | 3.8 | GO:0033540 | fatty acid beta-oxidation using acyl-CoA oxidase(GO:0033540) |
| 0.2 | 1.1 | GO:1903232 | melanosome assembly(GO:1903232) |
| 0.2 | 1.1 | GO:2000346 | negative regulation of hepatocyte proliferation(GO:2000346) |
| 0.2 | 1.1 | GO:0002760 | positive regulation of antimicrobial peptide production(GO:0002225) positive regulation of antimicrobial humoral response(GO:0002760) positive regulation of antibacterial peptide production(GO:0002803) |
| 0.2 | 3.4 | GO:1904706 | negative regulation of vascular smooth muscle cell proliferation(GO:1904706) |
| 0.2 | 1.8 | GO:0051005 | negative regulation of lipoprotein lipase activity(GO:0051005) |
| 0.2 | 1.4 | GO:0034625 | fatty acid elongation, saturated fatty acid(GO:0019367) fatty acid elongation, unsaturated fatty acid(GO:0019368) fatty acid elongation, monounsaturated fatty acid(GO:0034625) fatty acid elongation, polyunsaturated fatty acid(GO:0034626) |
| 0.2 | 0.5 | GO:0006842 | tricarboxylic acid transport(GO:0006842) citrate transport(GO:0015746) |
| 0.2 | 0.5 | GO:0010936 | negative regulation of macrophage cytokine production(GO:0010936) |
| 0.2 | 4.5 | GO:0007202 | activation of phospholipase C activity(GO:0007202) |
| 0.2 | 5.2 | GO:0097503 | sialylation(GO:0097503) |
| 0.2 | 1.0 | GO:0034196 | acylglycerol transport(GO:0034196) triglyceride transport(GO:0034197) |
| 0.2 | 11.8 | GO:0045652 | regulation of megakaryocyte differentiation(GO:0045652) |
| 0.2 | 2.4 | GO:0090331 | negative regulation of platelet aggregation(GO:0090331) |
| 0.2 | 1.5 | GO:0000414 | regulation of histone H3-K36 methylation(GO:0000414) |
| 0.2 | 1.6 | GO:0070166 | enamel mineralization(GO:0070166) |
| 0.2 | 2.8 | GO:0006957 | complement activation, alternative pathway(GO:0006957) |
| 0.2 | 0.5 | GO:0090107 | regulation of high-density lipoprotein particle assembly(GO:0090107) |
| 0.2 | 7.3 | GO:0097120 | receptor localization to synapse(GO:0097120) |
| 0.2 | 0.5 | GO:2000342 | negative regulation of chemokine (C-X-C motif) ligand 2 production(GO:2000342) |
| 0.2 | 0.5 | GO:0018282 | metal incorporation into metallo-sulfur cluster(GO:0018282) iron incorporation into metallo-sulfur cluster(GO:0018283) |
| 0.2 | 2.6 | GO:0007196 | adenylate cyclase-inhibiting G-protein coupled glutamate receptor signaling pathway(GO:0007196) |
| 0.2 | 3.0 | GO:0030277 | maintenance of gastrointestinal epithelium(GO:0030277) |
| 0.2 | 1.9 | GO:0019530 | taurine metabolic process(GO:0019530) |
| 0.2 | 0.5 | GO:0042823 | pyridoxal phosphate metabolic process(GO:0042822) pyridoxal phosphate biosynthetic process(GO:0042823) |
| 0.2 | 0.8 | GO:0034154 | toll-like receptor 7 signaling pathway(GO:0034154) |
| 0.2 | 1.4 | GO:0006600 | creatine metabolic process(GO:0006600) |
| 0.2 | 4.8 | GO:0043567 | regulation of insulin-like growth factor receptor signaling pathway(GO:0043567) |
| 0.2 | 4.0 | GO:0031581 | hemidesmosome assembly(GO:0031581) |
| 0.2 | 5.1 | GO:0043949 | regulation of cAMP-mediated signaling(GO:0043949) |
| 0.2 | 0.3 | GO:0034635 | glutathione transport(GO:0034635) tripeptide transport(GO:0042939) |
| 0.1 | 1.0 | GO:0036343 | psychomotor behavior(GO:0036343) |
| 0.1 | 1.9 | GO:0010804 | negative regulation of tumor necrosis factor-mediated signaling pathway(GO:0010804) |
| 0.1 | 2.0 | GO:1901642 | nucleoside transmembrane transport(GO:1901642) |
| 0.1 | 1.1 | GO:0035414 | negative regulation of catenin import into nucleus(GO:0035414) |
| 0.1 | 3.3 | GO:0060706 | cell differentiation involved in embryonic placenta development(GO:0060706) |
| 0.1 | 3.5 | GO:1904659 | hexose transmembrane transport(GO:0035428) glucose transmembrane transport(GO:1904659) |
| 0.1 | 1.1 | GO:0021892 | cerebral cortex GABAergic interneuron differentiation(GO:0021892) cerebral cortex GABAergic interneuron development(GO:0021894) |
| 0.1 | 2.4 | GO:0006285 | base-excision repair, AP site formation(GO:0006285) |
| 0.1 | 1.1 | GO:0060124 | positive regulation of growth hormone secretion(GO:0060124) |
| 0.1 | 1.7 | GO:0015986 | energy coupled proton transport, down electrochemical gradient(GO:0015985) ATP synthesis coupled proton transport(GO:0015986) |
| 0.1 | 0.8 | GO:0048243 | norepinephrine secretion(GO:0048243) |
| 0.1 | 0.1 | GO:0010730 | negative regulation of hydrogen peroxide biosynthetic process(GO:0010730) |
| 0.1 | 1.0 | GO:0045905 | translational frameshifting(GO:0006452) positive regulation of translational termination(GO:0045905) |
| 0.1 | 0.8 | GO:0032483 | regulation of Rab protein signal transduction(GO:0032483) |
| 0.1 | 2.0 | GO:0040032 | post-embryonic body morphogenesis(GO:0040032) |
| 0.1 | 3.1 | GO:0051567 | histone H3-K9 methylation(GO:0051567) |
| 0.1 | 1.5 | GO:0060689 | cell differentiation involved in salivary gland development(GO:0060689) |
| 0.1 | 2.0 | GO:0033147 | negative regulation of intracellular estrogen receptor signaling pathway(GO:0033147) |
| 0.1 | 2.3 | GO:0019432 | triglyceride biosynthetic process(GO:0019432) |
| 0.1 | 0.4 | GO:0007500 | mesodermal cell fate determination(GO:0007500) |
| 0.1 | 1.9 | GO:0019372 | lipoxygenase pathway(GO:0019372) |
| 0.1 | 2.8 | GO:0009650 | UV protection(GO:0009650) |
| 0.1 | 2.3 | GO:0006693 | prostanoid metabolic process(GO:0006692) prostaglandin metabolic process(GO:0006693) |
| 0.1 | 5.8 | GO:0032728 | positive regulation of interferon-beta production(GO:0032728) |
| 0.1 | 2.2 | GO:0010842 | retina layer formation(GO:0010842) |
| 0.1 | 0.8 | GO:0061082 | myeloid leukocyte cytokine production(GO:0061082) |
| 0.1 | 0.8 | GO:0090037 | positive regulation of protein kinase C signaling(GO:0090037) |
| 0.1 | 0.5 | GO:0097350 | neutrophil clearance(GO:0097350) |
| 0.1 | 1.7 | GO:0061436 | establishment of skin barrier(GO:0061436) |
| 0.1 | 2.5 | GO:0007184 | SMAD protein import into nucleus(GO:0007184) |
| 0.1 | 1.6 | GO:0021819 | layer formation in cerebral cortex(GO:0021819) |
| 0.1 | 4.6 | GO:0007190 | activation of adenylate cyclase activity(GO:0007190) |
| 0.1 | 2.1 | GO:0021516 | dorsal spinal cord development(GO:0021516) |
| 0.1 | 7.1 | GO:0007585 | respiratory gaseous exchange(GO:0007585) |
| 0.1 | 0.8 | GO:1904627 | dedifferentiation(GO:0043696) cell dedifferentiation(GO:0043697) response to phorbol 13-acetate 12-myristate(GO:1904627) cellular response to phorbol 13-acetate 12-myristate(GO:1904628) |
| 0.1 | 1.7 | GO:0071985 | multivesicular body sorting pathway(GO:0071985) |
| 0.1 | 0.5 | GO:0031914 | negative regulation of synaptic plasticity(GO:0031914) |
| 0.1 | 0.5 | GO:2000310 | regulation of N-methyl-D-aspartate selective glutamate receptor activity(GO:2000310) |
| 0.1 | 4.1 | GO:0035272 | exocrine system development(GO:0035272) |
| 0.1 | 1.3 | GO:1902074 | response to salt(GO:1902074) |
| 0.1 | 0.6 | GO:0051958 | methotrexate transport(GO:0051958) reduced folate transmembrane transport(GO:0098838) |
| 0.1 | 0.6 | GO:1901523 | leukotriene catabolic process(GO:0036100) leukotriene B4 catabolic process(GO:0036101) leukotriene B4 metabolic process(GO:0036102) icosanoid catabolic process(GO:1901523) fatty acid derivative catabolic process(GO:1901569) |
| 0.1 | 1.2 | GO:0046838 | phosphorylated carbohydrate dephosphorylation(GO:0046838) inositol phosphate dephosphorylation(GO:0046855) |
| 0.1 | 2.4 | GO:0060384 | innervation(GO:0060384) |
| 0.1 | 1.6 | GO:0090023 | positive regulation of neutrophil chemotaxis(GO:0090023) |
| 0.1 | 0.6 | GO:0015680 | intracellular copper ion transport(GO:0015680) |
| 0.1 | 2.4 | GO:0071392 | cellular response to estradiol stimulus(GO:0071392) |
| 0.1 | 1.2 | GO:0031293 | membrane protein intracellular domain proteolysis(GO:0031293) |
| 0.1 | 1.2 | GO:0044331 | cell-cell adhesion mediated by cadherin(GO:0044331) |
| 0.1 | 0.2 | GO:1903238 | positive regulation of leukocyte tethering or rolling(GO:1903238) |
| 0.1 | 0.5 | GO:0098902 | regulation of membrane depolarization during action potential(GO:0098902) |
| 0.1 | 2.2 | GO:0060008 | Sertoli cell differentiation(GO:0060008) |
| 0.1 | 1.4 | GO:0051683 | establishment of Golgi localization(GO:0051683) |
| 0.1 | 1.7 | GO:0031297 | replication fork processing(GO:0031297) |
| 0.1 | 1.2 | GO:0002138 | retinoic acid biosynthetic process(GO:0002138) |
| 0.1 | 0.6 | GO:0045144 | meiotic sister chromatid segregation(GO:0045144) |
| 0.1 | 0.9 | GO:0036010 | protein localization to endosome(GO:0036010) |
| 0.1 | 1.8 | GO:0099514 | anterograde synaptic vesicle transport(GO:0048490) synaptic vesicle cytoskeletal transport(GO:0099514) synaptic vesicle transport along microtubule(GO:0099517) |
| 0.1 | 0.7 | GO:0045618 | positive regulation of keratinocyte differentiation(GO:0045618) |
| 0.1 | 0.3 | GO:0002904 | positive regulation of B cell apoptotic process(GO:0002904) |
| 0.1 | 2.9 | GO:0034694 | response to prostaglandin(GO:0034694) |
| 0.1 | 1.6 | GO:0016254 | preassembly of GPI anchor in ER membrane(GO:0016254) |
| 0.1 | 0.2 | GO:0050904 | diapedesis(GO:0050904) |
| 0.1 | 1.6 | GO:0006972 | hyperosmotic response(GO:0006972) |
| 0.1 | 0.4 | GO:0097461 | ferric iron import into cell(GO:0097461) ferric iron import across plasma membrane(GO:0098706) |
| 0.1 | 0.6 | GO:0006384 | transcription initiation from RNA polymerase III promoter(GO:0006384) |
| 0.1 | 0.4 | GO:0016078 | tRNA catabolic process(GO:0016078) |
| 0.1 | 0.1 | GO:1902490 | regulation of sperm capacitation(GO:1902490) |
| 0.1 | 0.7 | GO:0042355 | fucose catabolic process(GO:0019317) L-fucose metabolic process(GO:0042354) L-fucose catabolic process(GO:0042355) |
| 0.1 | 2.5 | GO:0071108 | protein K48-linked deubiquitination(GO:0071108) |
| 0.1 | 0.4 | GO:2000576 | positive regulation of microtubule motor activity(GO:2000576) |
| 0.1 | 2.6 | GO:0010862 | positive regulation of pathway-restricted SMAD protein phosphorylation(GO:0010862) |
| 0.1 | 2.7 | GO:0007339 | binding of sperm to zona pellucida(GO:0007339) |
| 0.1 | 0.5 | GO:1901223 | negative regulation of NIK/NF-kappaB signaling(GO:1901223) |
| 0.1 | 0.2 | GO:0051835 | positive regulation of synapse structural plasticity(GO:0051835) |
| 0.1 | 0.8 | GO:0032926 | negative regulation of activin receptor signaling pathway(GO:0032926) |
| 0.1 | 1.5 | GO:0046135 | pyrimidine nucleoside catabolic process(GO:0046135) |
| 0.1 | 3.3 | GO:0043268 | positive regulation of potassium ion transport(GO:0043268) |
| 0.1 | 0.6 | GO:0003417 | growth plate cartilage development(GO:0003417) |
| 0.1 | 0.8 | GO:0010603 | regulation of cytoplasmic mRNA processing body assembly(GO:0010603) |
| 0.1 | 1.4 | GO:0007129 | synapsis(GO:0007129) |
| 0.1 | 0.8 | GO:0034380 | high-density lipoprotein particle assembly(GO:0034380) |
| 0.1 | 1.0 | GO:0003334 | keratinocyte development(GO:0003334) |
| 0.1 | 0.7 | GO:0048245 | eosinophil chemotaxis(GO:0048245) |
| 0.1 | 1.6 | GO:0015914 | phospholipid transport(GO:0015914) |
| 0.1 | 2.9 | GO:1901385 | regulation of voltage-gated calcium channel activity(GO:1901385) |
| 0.1 | 0.5 | GO:0034058 | endosomal vesicle fusion(GO:0034058) |
| 0.1 | 0.5 | GO:0098915 | membrane repolarization during atrial cardiac muscle cell action potential(GO:0098914) membrane repolarization during ventricular cardiac muscle cell action potential(GO:0098915) |
| 0.1 | 2.5 | GO:0046473 | phosphatidic acid metabolic process(GO:0046473) |
| 0.1 | 3.3 | GO:0042472 | inner ear morphogenesis(GO:0042472) |
| 0.1 | 1.1 | GO:0045747 | positive regulation of Notch signaling pathway(GO:0045747) |
| 0.1 | 1.0 | GO:1903861 | regulation of dendrite extension(GO:1903859) positive regulation of dendrite extension(GO:1903861) |
| 0.1 | 0.5 | GO:0030213 | hyaluronan biosynthetic process(GO:0030213) |
| 0.1 | 1.5 | GO:0032011 | ARF protein signal transduction(GO:0032011) |
| 0.1 | 1.6 | GO:0060325 | face morphogenesis(GO:0060325) |
| 0.1 | 0.3 | GO:0006307 | DNA dealkylation involved in DNA repair(GO:0006307) |
| 0.0 | 0.9 | GO:0006853 | carnitine shuttle(GO:0006853) |
| 0.0 | 0.7 | GO:0051457 | maintenance of protein location in nucleus(GO:0051457) |
| 0.0 | 2.4 | GO:0050918 | positive chemotaxis(GO:0050918) |
| 0.0 | 0.5 | GO:0035095 | behavioral response to nicotine(GO:0035095) |
| 0.0 | 0.7 | GO:0007250 | activation of NF-kappaB-inducing kinase activity(GO:0007250) |
| 0.0 | 0.7 | GO:0031167 | rRNA methylation(GO:0031167) |
| 0.0 | 4.8 | GO:0090630 | activation of GTPase activity(GO:0090630) |
| 0.0 | 0.2 | GO:0035721 | intraciliary retrograde transport(GO:0035721) |
| 0.0 | 0.8 | GO:0019800 | peptide cross-linking via chondroitin 4-sulfate glycosaminoglycan(GO:0019800) |
| 0.0 | 0.9 | GO:0036258 | multivesicular body organization(GO:0036257) multivesicular body assembly(GO:0036258) |
| 0.0 | 1.0 | GO:0050909 | sensory perception of taste(GO:0050909) |
| 0.0 | 0.1 | GO:0045163 | clustering of voltage-gated potassium channels(GO:0045163) |
| 0.0 | 0.6 | GO:0001829 | trophectodermal cell differentiation(GO:0001829) |
| 0.0 | 0.1 | GO:0061739 | protein lipidation involved in autophagosome assembly(GO:0061739) |
| 0.0 | 1.8 | GO:0046785 | microtubule polymerization(GO:0046785) |
| 0.0 | 0.4 | GO:0031987 | locomotion involved in locomotory behavior(GO:0031987) |
| 0.0 | 1.3 | GO:0035235 | ionotropic glutamate receptor signaling pathway(GO:0035235) |
| 0.0 | 0.6 | GO:0032780 | negative regulation of ATPase activity(GO:0032780) |
| 0.0 | 1.2 | GO:0015012 | heparan sulfate proteoglycan biosynthetic process(GO:0015012) |
| 0.0 | 0.9 | GO:2001257 | regulation of cation channel activity(GO:2001257) |
| 0.0 | 2.0 | GO:0043647 | inositol phosphate metabolic process(GO:0043647) |
| 0.0 | 0.8 | GO:1904380 | endoplasmic reticulum mannose trimming(GO:1904380) |
| 0.0 | 0.9 | GO:0050771 | negative regulation of axonogenesis(GO:0050771) |
| 0.0 | 0.5 | GO:0006488 | dolichol-linked oligosaccharide biosynthetic process(GO:0006488) |
| 0.0 | 0.3 | GO:0032202 | telomere assembly(GO:0032202) |
| 0.0 | 0.3 | GO:0000389 | mRNA 3'-splice site recognition(GO:0000389) |
| 0.0 | 2.8 | GO:0006968 | cellular defense response(GO:0006968) |
| 0.0 | 0.8 | GO:0071294 | cellular response to zinc ion(GO:0071294) |
| 0.0 | 0.5 | GO:0006450 | regulation of translational fidelity(GO:0006450) |
| 0.0 | 1.1 | GO:0007189 | adenylate cyclase-activating G-protein coupled receptor signaling pathway(GO:0007189) |
| 0.0 | 0.2 | GO:0007635 | chemosensory behavior(GO:0007635) |
| 0.0 | 3.9 | GO:0060348 | bone development(GO:0060348) |
| 0.0 | 2.5 | GO:1903779 | regulation of cardiac conduction(GO:1903779) |
| 0.0 | 1.9 | GO:0051865 | protein autoubiquitination(GO:0051865) |
| 0.0 | 1.1 | GO:0014003 | oligodendrocyte development(GO:0014003) |
| 0.0 | 4.4 | GO:0007156 | homophilic cell adhesion via plasma membrane adhesion molecules(GO:0007156) |
| 0.0 | 1.0 | GO:0019433 | bile acid and bile salt transport(GO:0015721) triglyceride catabolic process(GO:0019433) |
| 0.0 | 2.1 | GO:0071158 | positive regulation of cell cycle arrest(GO:0071158) |
| 0.0 | 1.5 | GO:1902475 | L-alpha-amino acid transmembrane transport(GO:1902475) |
| 0.0 | 0.1 | GO:0018201 | N-terminal peptidyl-glycine N-myristoylation(GO:0018008) peptidyl-glycine modification(GO:0018201) |
| 0.0 | 0.2 | GO:1902187 | negative regulation of viral release from host cell(GO:1902187) |
| 0.0 | 1.6 | GO:0048010 | vascular endothelial growth factor receptor signaling pathway(GO:0048010) |
| 0.0 | 0.6 | GO:0003382 | epithelial cell morphogenesis(GO:0003382) |
| 0.0 | 2.2 | GO:0070268 | cornification(GO:0070268) |
| 0.0 | 5.9 | GO:0097485 | neuron projection guidance(GO:0097485) |
| 0.0 | 1.0 | GO:0032233 | positive regulation of actin filament bundle assembly(GO:0032233) |
| 0.0 | 0.1 | GO:0090394 | negative regulation of excitatory postsynaptic potential(GO:0090394) |
| 0.0 | 0.8 | GO:0030815 | negative regulation of cAMP metabolic process(GO:0030815) |
| 0.0 | 0.6 | GO:0048268 | clathrin coat assembly(GO:0048268) |
| 0.0 | 2.0 | GO:0007098 | centrosome cycle(GO:0007098) |
| 0.0 | 1.1 | GO:0007266 | Rho protein signal transduction(GO:0007266) |
| 0.0 | 3.1 | GO:0060271 | cilium morphogenesis(GO:0060271) |
| 0.0 | 0.9 | GO:0050829 | defense response to Gram-negative bacterium(GO:0050829) |
| 0.0 | 2.5 | GO:0035023 | regulation of Rho protein signal transduction(GO:0035023) |
| 0.0 | 0.2 | GO:0035970 | peptidyl-threonine dephosphorylation(GO:0035970) |
| 0.0 | 0.2 | GO:0001514 | selenocysteine incorporation(GO:0001514) translational readthrough(GO:0006451) |
| 0.0 | 0.3 | GO:0007340 | acrosome reaction(GO:0007340) |
| 0.0 | 0.4 | GO:0030488 | tRNA methylation(GO:0030488) |
| 0.0 | 0.4 | GO:0014047 | glutamate secretion(GO:0014047) |
| 0.0 | 0.1 | GO:0034472 | snRNA 3'-end processing(GO:0034472) |
| 0.0 | 1.7 | GO:0046718 | viral entry into host cell(GO:0046718) |
| 0.0 | 0.7 | GO:0001523 | retinoid metabolic process(GO:0001523) |
| 0.0 | 0.3 | GO:0030513 | positive regulation of BMP signaling pathway(GO:0030513) |
| 0.0 | 1.5 | GO:0050911 | detection of chemical stimulus involved in sensory perception of smell(GO:0050911) |
| 0.0 | 0.1 | GO:0035999 | tetrahydrofolate interconversion(GO:0035999) |
| 0.0 | 0.3 | GO:0002209 | behavioral fear response(GO:0001662) behavioral defense response(GO:0002209) fear response(GO:0042596) |
Gene overrepresentation in cellular component category:
| Log-likelihood per target | Total log-likelihood | Term | Description |
|---|---|---|---|
| 1.7 | 5.0 | GO:0097224 | sperm connecting piece(GO:0097224) |
| 1.2 | 3.5 | GO:1990622 | CHOP-ATF3 complex(GO:1990622) |
| 1.0 | 6.2 | GO:1990584 | cardiac Troponin complex(GO:1990584) |
| 0.9 | 3.7 | GO:0033596 | TSC1-TSC2 complex(GO:0033596) |
| 0.9 | 6.3 | GO:0005610 | laminin-5 complex(GO:0005610) |
| 0.8 | 7.6 | GO:0070652 | HAUS complex(GO:0070652) |
| 0.8 | 10.0 | GO:0060077 | inhibitory synapse(GO:0060077) |
| 0.8 | 7.7 | GO:0035686 | sperm fibrous sheath(GO:0035686) |
| 0.7 | 2.2 | GO:0034991 | nuclear meiotic cohesin complex(GO:0034991) |
| 0.7 | 2.9 | GO:0070695 | FHF complex(GO:0070695) |
| 0.7 | 6.6 | GO:0033391 | chromatoid body(GO:0033391) |
| 0.7 | 2.1 | GO:0036398 | TCR signalosome(GO:0036398) |
| 0.7 | 17.4 | GO:0097386 | glial cell projection(GO:0097386) |
| 0.7 | 4.7 | GO:0098560 | cytoplasmic side of late endosome membrane(GO:0098560) |
| 0.7 | 2.0 | GO:0016938 | kinesin I complex(GO:0016938) |
| 0.7 | 2.6 | GO:0035363 | histone locus body(GO:0035363) |
| 0.7 | 4.6 | GO:0030991 | intraciliary transport particle A(GO:0030991) |
| 0.7 | 7.8 | GO:0042788 | polysomal ribosome(GO:0042788) |
| 0.6 | 4.5 | GO:1990130 | Iml1 complex(GO:1990130) |
| 0.6 | 3.7 | GO:0005945 | 6-phosphofructokinase complex(GO:0005945) |
| 0.6 | 2.4 | GO:0032777 | Piccolo NuA4 histone acetyltransferase complex(GO:0032777) |
| 0.6 | 1.8 | GO:0072536 | interleukin-23 receptor complex(GO:0072536) |
| 0.6 | 2.9 | GO:0001652 | granular component(GO:0001652) |
| 0.6 | 3.3 | GO:1990357 | terminal web(GO:1990357) |
| 0.5 | 2.7 | GO:0045160 | myosin I complex(GO:0045160) |
| 0.5 | 1.6 | GO:0032279 | asymmetric synapse(GO:0032279) neuron to neuron synapse(GO:0098984) |
| 0.5 | 1.6 | GO:1990597 | AIP1-IRE1 complex(GO:1990597) |
| 0.5 | 4.8 | GO:0030897 | HOPS complex(GO:0030897) |
| 0.5 | 2.1 | GO:0030895 | apolipoprotein B mRNA editing enzyme complex(GO:0030895) |
| 0.5 | 4.2 | GO:0005587 | collagen type IV trimer(GO:0005587) |
| 0.5 | 4.6 | GO:0005672 | transcription factor TFIIA complex(GO:0005672) |
| 0.5 | 3.4 | GO:1990745 | EARP complex(GO:1990745) |
| 0.5 | 7.8 | GO:0010369 | chromocenter(GO:0010369) |
| 0.5 | 4.1 | GO:0070765 | gamma-secretase complex(GO:0070765) |
| 0.4 | 2.6 | GO:0032311 | angiogenin-PRI complex(GO:0032311) |
| 0.4 | 1.7 | GO:0005968 | Rab-protein geranylgeranyltransferase complex(GO:0005968) |
| 0.4 | 5.0 | GO:0097427 | microtubule bundle(GO:0097427) |
| 0.4 | 7.6 | GO:0043205 | microfibril(GO:0001527) fibril(GO:0043205) |
| 0.4 | 1.8 | GO:0097513 | myosin II filament(GO:0097513) |
| 0.4 | 1.1 | GO:0017071 | intracellular cyclic nucleotide activated cation channel complex(GO:0017071) |
| 0.4 | 2.5 | GO:0072687 | meiotic spindle(GO:0072687) |
| 0.4 | 1.1 | GO:0032426 | stereocilium tip(GO:0032426) |
| 0.4 | 5.3 | GO:0030478 | actin cap(GO:0030478) |
| 0.3 | 2.8 | GO:0005579 | membrane attack complex(GO:0005579) |
| 0.3 | 1.6 | GO:1990589 | ATF4-CREB1 transcription factor complex(GO:1990589) |
| 0.3 | 1.9 | GO:0033269 | internode region of axon(GO:0033269) |
| 0.3 | 2.1 | GO:0032021 | NELF complex(GO:0032021) |
| 0.3 | 5.7 | GO:0036038 | MKS complex(GO:0036038) |
| 0.3 | 9.3 | GO:0005921 | gap junction(GO:0005921) |
| 0.3 | 19.0 | GO:0045171 | intercellular bridge(GO:0045171) |
| 0.3 | 4.2 | GO:0005883 | neurofilament(GO:0005883) |
| 0.3 | 1.6 | GO:0032584 | growth cone membrane(GO:0032584) |
| 0.3 | 6.0 | GO:0042599 | lamellar body(GO:0042599) |
| 0.3 | 3.1 | GO:0016461 | unconventional myosin complex(GO:0016461) |
| 0.3 | 3.3 | GO:0002199 | zona pellucida receptor complex(GO:0002199) |
| 0.3 | 1.8 | GO:0035869 | ciliary transition zone(GO:0035869) |
| 0.3 | 8.1 | GO:0034451 | centriolar satellite(GO:0034451) |
| 0.2 | 11.4 | GO:0016460 | myosin II complex(GO:0016460) |
| 0.2 | 0.9 | GO:0005899 | insulin receptor complex(GO:0005899) |
| 0.2 | 2.0 | GO:0001520 | outer dense fiber(GO:0001520) |
| 0.2 | 0.9 | GO:0001939 | female pronucleus(GO:0001939) |
| 0.2 | 5.7 | GO:0032391 | photoreceptor connecting cilium(GO:0032391) |
| 0.2 | 2.2 | GO:0042584 | chromaffin granule membrane(GO:0042584) |
| 0.2 | 0.9 | GO:0042272 | nuclear RNA export factor complex(GO:0042272) |
| 0.2 | 4.1 | GO:0005671 | Ada2/Gcn5/Ada3 transcription activator complex(GO:0005671) |
| 0.2 | 0.6 | GO:0033565 | ESCRT-0 complex(GO:0033565) |
| 0.2 | 2.7 | GO:0000800 | lateral element(GO:0000800) |
| 0.2 | 3.3 | GO:0031083 | BLOC-1 complex(GO:0031083) |
| 0.2 | 0.6 | GO:0031251 | PAN complex(GO:0031251) |
| 0.2 | 3.0 | GO:0005721 | pericentric heterochromatin(GO:0005721) |
| 0.2 | 2.4 | GO:0005577 | fibrinogen complex(GO:0005577) |
| 0.2 | 3.9 | GO:1990454 | L-type voltage-gated calcium channel complex(GO:1990454) |
| 0.2 | 5.3 | GO:0000795 | synaptonemal complex(GO:0000795) |
| 0.2 | 1.6 | GO:0031088 | platelet dense granule membrane(GO:0031088) |
| 0.2 | 2.0 | GO:0008024 | cyclin/CDK positive transcription elongation factor complex(GO:0008024) |
| 0.2 | 2.0 | GO:0005915 | zonula adherens(GO:0005915) |
| 0.2 | 4.0 | GO:0044295 | axonal growth cone(GO:0044295) |
| 0.2 | 1.9 | GO:0033588 | Elongator holoenzyme complex(GO:0033588) |
| 0.2 | 1.7 | GO:0000220 | vacuolar proton-transporting V-type ATPase, V0 domain(GO:0000220) |
| 0.2 | 2.6 | GO:0008074 | guanylate cyclase complex, soluble(GO:0008074) |
| 0.2 | 10.6 | GO:0031463 | Cul3-RING ubiquitin ligase complex(GO:0031463) |
| 0.2 | 1.1 | GO:0000110 | nucleotide-excision repair factor 1 complex(GO:0000110) |
| 0.2 | 1.5 | GO:0030123 | AP-3 adaptor complex(GO:0030123) |
| 0.2 | 0.8 | GO:0071458 | integral component of cytoplasmic side of endoplasmic reticulum membrane(GO:0071458) |
| 0.2 | 0.9 | GO:0044214 | spanning component of plasma membrane(GO:0044214) spanning component of membrane(GO:0089717) |
| 0.1 | 1.1 | GO:0030688 | preribosome, small subunit precursor(GO:0030688) |
| 0.1 | 4.2 | GO:0044322 | endoplasmic reticulum quality control compartment(GO:0044322) |
| 0.1 | 0.6 | GO:0000818 | nuclear MIS12/MIND complex(GO:0000818) |
| 0.1 | 11.5 | GO:0005581 | collagen trimer(GO:0005581) |
| 0.1 | 1.1 | GO:0000322 | storage vacuole(GO:0000322) |
| 0.1 | 1.6 | GO:0043240 | Fanconi anaemia nuclear complex(GO:0043240) |
| 0.1 | 0.5 | GO:0016013 | syntrophin complex(GO:0016013) |
| 0.1 | 4.9 | GO:0009925 | basal plasma membrane(GO:0009925) |
| 0.1 | 0.8 | GO:0032009 | early phagosome(GO:0032009) |
| 0.1 | 6.5 | GO:0031904 | endosome lumen(GO:0031904) |
| 0.1 | 1.1 | GO:0016342 | catenin complex(GO:0016342) |
| 0.1 | 0.9 | GO:0042406 | extrinsic component of endoplasmic reticulum membrane(GO:0042406) |
| 0.1 | 4.9 | GO:0000159 | protein phosphatase type 2A complex(GO:0000159) |
| 0.1 | 1.1 | GO:0000813 | ESCRT I complex(GO:0000813) |
| 0.1 | 3.3 | GO:0031093 | platelet alpha granule lumen(GO:0031093) |
| 0.1 | 2.4 | GO:0032809 | neuronal cell body membrane(GO:0032809) cell body membrane(GO:0044298) |
| 0.1 | 4.9 | GO:0034364 | high-density lipoprotein particle(GO:0034364) |
| 0.1 | 16.9 | GO:0034705 | voltage-gated potassium channel complex(GO:0008076) potassium channel complex(GO:0034705) |
| 0.1 | 21.7 | GO:0072562 | blood microparticle(GO:0072562) |
| 0.1 | 5.4 | GO:0005891 | voltage-gated calcium channel complex(GO:0005891) |
| 0.1 | 1.0 | GO:0043190 | ATP-binding cassette (ABC) transporter complex(GO:0043190) |
| 0.1 | 1.3 | GO:0017146 | NMDA selective glutamate receptor complex(GO:0017146) |
| 0.1 | 3.2 | GO:0042101 | T cell receptor complex(GO:0042101) |
| 0.1 | 1.0 | GO:0046581 | intercellular canaliculus(GO:0046581) |
| 0.1 | 11.0 | GO:0005796 | Golgi lumen(GO:0005796) |
| 0.1 | 12.4 | GO:0043679 | axon terminus(GO:0043679) |
| 0.1 | 5.9 | GO:0005834 | heterotrimeric G-protein complex(GO:0005834) |
| 0.1 | 1.5 | GO:1990909 | Wnt signalosome(GO:1990909) |
| 0.1 | 3.2 | GO:0031527 | filopodium membrane(GO:0031527) |
| 0.1 | 1.1 | GO:0030008 | TRAPP complex(GO:0030008) |
| 0.1 | 5.3 | GO:0031526 | brush border membrane(GO:0031526) |
| 0.1 | 2.5 | GO:0030057 | desmosome(GO:0030057) |
| 0.1 | 0.3 | GO:0008622 | epsilon DNA polymerase complex(GO:0008622) |
| 0.1 | 0.9 | GO:0005638 | lamin filament(GO:0005638) |
| 0.1 | 0.8 | GO:0005845 | mRNA cap binding complex(GO:0005845) |
| 0.1 | 2.9 | GO:0071565 | nBAF complex(GO:0071565) |
| 0.1 | 7.6 | GO:0005913 | cell-cell adherens junction(GO:0005913) |
| 0.1 | 2.1 | GO:0030669 | clathrin-coated endocytic vesicle membrane(GO:0030669) |
| 0.1 | 2.6 | GO:0001917 | photoreceptor inner segment(GO:0001917) |
| 0.1 | 1.4 | GO:0031095 | platelet dense tubular network membrane(GO:0031095) |
| 0.1 | 4.0 | GO:0005782 | peroxisomal matrix(GO:0005782) microbody lumen(GO:0031907) |
| 0.1 | 0.2 | GO:0043196 | varicosity(GO:0043196) |
| 0.1 | 1.1 | GO:0035631 | CD40 receptor complex(GO:0035631) |
| 0.1 | 1.2 | GO:0090665 | dystrophin-associated glycoprotein complex(GO:0016010) glycoprotein complex(GO:0090665) |
| 0.1 | 1.2 | GO:0000177 | cytoplasmic exosome (RNase complex)(GO:0000177) |
| 0.1 | 9.6 | GO:0055037 | recycling endosome(GO:0055037) |
| 0.1 | 3.3 | GO:0005902 | microvillus(GO:0005902) |
| 0.1 | 0.4 | GO:0070545 | PeBoW complex(GO:0070545) |
| 0.1 | 0.8 | GO:0097381 | photoreceptor disc membrane(GO:0097381) |
| 0.1 | 12.5 | GO:0016323 | basolateral plasma membrane(GO:0016323) |
| 0.1 | 0.2 | GO:0005873 | plus-end kinesin complex(GO:0005873) |
| 0.1 | 71.8 | GO:0005615 | extracellular space(GO:0005615) |
| 0.1 | 1.4 | GO:0031264 | death-inducing signaling complex(GO:0031264) |
| 0.0 | 6.2 | GO:0032587 | ruffle membrane(GO:0032587) |
| 0.0 | 0.3 | GO:0070187 | telosome(GO:0070187) |
| 0.0 | 11.0 | GO:0098793 | presynapse(GO:0098793) |
| 0.0 | 1.3 | GO:0030119 | AP-type membrane coat adaptor complex(GO:0030119) |
| 0.0 | 0.9 | GO:0034045 | pre-autophagosomal structure membrane(GO:0034045) |
| 0.0 | 5.2 | GO:0005578 | proteinaceous extracellular matrix(GO:0005578) |
| 0.0 | 1.4 | GO:0008023 | transcription elongation factor complex(GO:0008023) |
| 0.0 | 2.4 | GO:0031901 | early endosome membrane(GO:0031901) |
| 0.0 | 0.8 | GO:0005892 | acetylcholine-gated channel complex(GO:0005892) |
| 0.0 | 0.6 | GO:0071141 | SMAD protein complex(GO:0071141) |
| 0.0 | 4.4 | GO:0043235 | receptor complex(GO:0043235) |
| 0.0 | 1.5 | GO:0034707 | chloride channel complex(GO:0034707) |
| 0.0 | 0.3 | GO:0043218 | compact myelin(GO:0043218) |
| 0.0 | 1.7 | GO:0030018 | Z disc(GO:0030018) |
| 0.0 | 1.3 | GO:0005814 | centriole(GO:0005814) |
| 0.0 | 0.5 | GO:0035580 | specific granule lumen(GO:0035580) |
Gene overrepresentation in molecular function category:
| Log-likelihood per target | Total log-likelihood | Term | Description |
|---|---|---|---|
| 4.5 | 18.2 | GO:0097001 | ceramide binding(GO:0097001) |
| 4.1 | 16.4 | GO:0004356 | glutamate-ammonia ligase activity(GO:0004356) ammonia ligase activity(GO:0016211) acid-ammonia (or amide) ligase activity(GO:0016880) |
| 2.5 | 10.1 | GO:0019770 | IgG receptor activity(GO:0019770) |
| 1.7 | 5.2 | GO:0016497 | substance K receptor activity(GO:0016497) |
| 1.7 | 5.2 | GO:0004336 | galactosylceramidase activity(GO:0004336) |
| 1.7 | 6.6 | GO:0004667 | prostaglandin-D synthase activity(GO:0004667) |
| 1.6 | 6.5 | GO:0004925 | prolactin receptor activity(GO:0004925) |
| 1.5 | 4.6 | GO:0001665 | alpha-N-acetylgalactosaminide alpha-2,6-sialyltransferase activity(GO:0001665) |
| 1.5 | 13.1 | GO:0004565 | beta-galactosidase activity(GO:0004565) |
| 1.3 | 5.3 | GO:0046573 | lactonohydrolase activity(GO:0046573) acyl-L-homoserine-lactone lactonohydrolase activity(GO:0102007) |
| 1.3 | 5.2 | GO:0004306 | ethanolamine-phosphate cytidylyltransferase activity(GO:0004306) |
| 1.2 | 3.7 | GO:0061609 | fructose-1-phosphate aldolase activity(GO:0061609) |
| 1.2 | 3.7 | GO:0004877 | complement component C4b receptor activity(GO:0001861) complement component C3b receptor activity(GO:0004877) |
| 1.2 | 3.6 | GO:0004144 | diacylglycerol O-acyltransferase activity(GO:0004144) |
| 1.1 | 3.3 | GO:0004938 | alpha2-adrenergic receptor activity(GO:0004938) alpha-2C adrenergic receptor binding(GO:0031696) |
| 1.1 | 3.2 | GO:0019166 | trans-2-enoyl-CoA reductase (NADPH) activity(GO:0019166) |
| 1.0 | 6.2 | GO:0030172 | troponin C binding(GO:0030172) |
| 1.0 | 7.0 | GO:0000155 | phosphorelay sensor kinase activity(GO:0000155) |
| 1.0 | 8.8 | GO:0016206 | catechol O-methyltransferase activity(GO:0016206) |
| 0.9 | 2.8 | GO:0004651 | polynucleotide 5'-phosphatase activity(GO:0004651) |
| 0.9 | 2.7 | GO:0008431 | vitamin E binding(GO:0008431) |
| 0.9 | 2.6 | GO:0004382 | guanosine-diphosphatase activity(GO:0004382) |
| 0.9 | 2.6 | GO:0008294 | calcium- and calmodulin-responsive adenylate cyclase activity(GO:0008294) |
| 0.9 | 3.4 | GO:0032408 | MutLbeta complex binding(GO:0032406) MutSbeta complex binding(GO:0032408) |
| 0.8 | 9.7 | GO:0019911 | structural constituent of myelin sheath(GO:0019911) |
| 0.8 | 4.0 | GO:0008048 | calcium sensitive guanylate cyclase activator activity(GO:0008048) |
| 0.8 | 4.0 | GO:0004351 | glutamate decarboxylase activity(GO:0004351) |
| 0.8 | 3.9 | GO:0004991 | parathyroid hormone receptor activity(GO:0004991) |
| 0.8 | 9.3 | GO:0004075 | biotin carboxylase activity(GO:0004075) |
| 0.8 | 3.1 | GO:0016972 | flavin-linked sulfhydryl oxidase activity(GO:0016971) thiol oxidase activity(GO:0016972) |
| 0.8 | 3.8 | GO:0051120 | hepoxilin A3 synthase activity(GO:0051120) |
| 0.8 | 3.0 | GO:0005169 | neurotrophin TRKB receptor binding(GO:0005169) |
| 0.7 | 3.6 | GO:0048248 | CXCR3 chemokine receptor binding(GO:0048248) |
| 0.7 | 2.2 | GO:0086059 | voltage-gated calcium channel activity involved SA node cell action potential(GO:0086059) |
| 0.7 | 2.1 | GO:0017153 | sodium:dicarboxylate symporter activity(GO:0017153) |
| 0.7 | 2.1 | GO:0004967 | glucagon receptor activity(GO:0004967) |
| 0.7 | 2.8 | GO:0047708 | biotinidase activity(GO:0047708) |
| 0.7 | 3.4 | GO:0070097 | delta-catenin binding(GO:0070097) |
| 0.7 | 2.7 | GO:0004102 | choline O-acetyltransferase activity(GO:0004102) |
| 0.7 | 13.9 | GO:0004185 | serine-type carboxypeptidase activity(GO:0004185) |
| 0.7 | 5.3 | GO:0016433 | rRNA (adenine) methyltransferase activity(GO:0016433) |
| 0.7 | 2.0 | GO:0032093 | SAM domain binding(GO:0032093) |
| 0.7 | 2.6 | GO:0000702 | oxidized base lesion DNA N-glycosylase activity(GO:0000702) |
| 0.6 | 2.6 | GO:0032450 | maltose alpha-glucosidase activity(GO:0032450) |
| 0.6 | 1.9 | GO:0098809 | oxidoreductase activity, acting on other nitrogenous compounds as donors, cytochrome as acceptor(GO:0016662) nitrite reductase (NO-forming) activity(GO:0050421) carbon monoxide binding(GO:0070025) nitrite reductase activity(GO:0098809) |
| 0.6 | 2.5 | GO:0031716 | calcitonin receptor binding(GO:0031716) |
| 0.6 | 1.9 | GO:0052816 | medium-chain acyl-CoA hydrolase activity(GO:0052815) long-chain acyl-CoA hydrolase activity(GO:0052816) |
| 0.6 | 3.6 | GO:0031708 | endothelin B receptor binding(GO:0031708) |
| 0.6 | 4.2 | GO:0030023 | extracellular matrix constituent conferring elasticity(GO:0030023) |
| 0.6 | 1.8 | GO:0042020 | interleukin-23 binding(GO:0042019) interleukin-23 receptor activity(GO:0042020) |
| 0.6 | 2.4 | GO:0000309 | nicotinamide-nucleotide adenylyltransferase activity(GO:0000309) |
| 0.6 | 2.9 | GO:0015319 | sodium:inorganic phosphate symporter activity(GO:0015319) |
| 0.6 | 4.1 | GO:0047045 | testosterone 17-beta-dehydrogenase (NADP+) activity(GO:0047045) |
| 0.6 | 3.3 | GO:0004468 | lysine N-acetyltransferase activity, acting on acetyl phosphate as donor(GO:0004468) |
| 0.5 | 2.2 | GO:0015222 | serotonin transmembrane transporter activity(GO:0015222) |
| 0.5 | 1.6 | GO:0005174 | CD40 receptor binding(GO:0005174) |
| 0.5 | 1.5 | GO:0004878 | complement component C5a receptor activity(GO:0004878) |
| 0.5 | 5.0 | GO:0032027 | myosin light chain binding(GO:0032027) |
| 0.5 | 1.0 | GO:0004122 | cystathionine beta-synthase activity(GO:0004122) |
| 0.5 | 2.9 | GO:0008310 | single-stranded DNA 3'-5' exodeoxyribonuclease activity(GO:0008310) |
| 0.5 | 2.9 | GO:0043023 | ribosomal large subunit binding(GO:0043023) |
| 0.5 | 8.6 | GO:0004089 | carbonate dehydratase activity(GO:0004089) |
| 0.5 | 5.7 | GO:0031995 | insulin-like growth factor II binding(GO:0031995) |
| 0.5 | 9.9 | GO:0032036 | myosin heavy chain binding(GO:0032036) |
| 0.5 | 3.7 | GO:0003872 | 6-phosphofructokinase activity(GO:0003872) |
| 0.5 | 1.4 | GO:0004960 | thromboxane receptor activity(GO:0004960) thromboxane A2 receptor activity(GO:0004961) |
| 0.5 | 2.7 | GO:0016361 | activin receptor activity, type I(GO:0016361) |
| 0.4 | 1.8 | GO:0035033 | histone deacetylase regulator activity(GO:0035033) |
| 0.4 | 1.3 | GO:0001601 | peptide YY receptor activity(GO:0001601) |
| 0.4 | 1.7 | GO:0016434 | rRNA (cytosine) methyltransferase activity(GO:0016434) |
| 0.4 | 2.5 | GO:0016807 | cysteine-type carboxypeptidase activity(GO:0016807) cysteine-type exopeptidase activity(GO:0070004) |
| 0.4 | 1.2 | GO:0001641 | group II metabotropic glutamate receptor activity(GO:0001641) |
| 0.4 | 1.6 | GO:0098988 | adenylate cyclase inhibiting G-protein coupled glutamate receptor activity(GO:0001640) serine binding(GO:0070905) G-protein coupled glutamate receptor activity(GO:0098988) |
| 0.4 | 1.2 | GO:0003917 | DNA topoisomerase type I activity(GO:0003917) |
| 0.4 | 2.0 | GO:0004999 | vasoactive intestinal polypeptide receptor activity(GO:0004999) |
| 0.4 | 1.2 | GO:0050405 | [hydroxymethylglutaryl-CoA reductase (NADPH)] kinase activity(GO:0047322) [acetyl-CoA carboxylase] kinase activity(GO:0050405) |
| 0.4 | 0.8 | GO:0031893 | vasopressin receptor binding(GO:0031893) |
| 0.4 | 1.9 | GO:0047066 | phospholipid-hydroperoxide glutathione peroxidase activity(GO:0047066) |
| 0.4 | 1.5 | GO:0004031 | aldehyde oxidase activity(GO:0004031) |
| 0.4 | 1.9 | GO:0060002 | plus-end directed microfilament motor activity(GO:0060002) |
| 0.4 | 1.1 | GO:0010521 | telomerase inhibitor activity(GO:0010521) |
| 0.4 | 5.6 | GO:0008140 | cAMP response element binding protein binding(GO:0008140) |
| 0.4 | 7.7 | GO:0008327 | methyl-CpG binding(GO:0008327) |
| 0.4 | 8.5 | GO:0042813 | Wnt-activated receptor activity(GO:0042813) |
| 0.4 | 1.8 | GO:0004370 | glycerol kinase activity(GO:0004370) |
| 0.3 | 1.7 | GO:0004663 | Rab geranylgeranyltransferase activity(GO:0004663) |
| 0.3 | 8.7 | GO:0070403 | NAD+ binding(GO:0070403) |
| 0.3 | 1.4 | GO:0031728 | CCR3 chemokine receptor binding(GO:0031728) |
| 0.3 | 1.0 | GO:0017129 | triglyceride binding(GO:0017129) |
| 0.3 | 1.0 | GO:0030343 | vitamin D3 25-hydroxylase activity(GO:0030343) vitamin D 25-hydroxylase activity(GO:0070643) |
| 0.3 | 2.9 | GO:0047499 | calcium-independent phospholipase A2 activity(GO:0047499) |
| 0.3 | 0.9 | GO:0031731 | CCR6 chemokine receptor binding(GO:0031731) |
| 0.3 | 2.1 | GO:0008440 | inositol-1,4,5-trisphosphate 3-kinase activity(GO:0008440) |
| 0.3 | 1.8 | GO:0016402 | pristanoyl-CoA oxidase activity(GO:0016402) |
| 0.3 | 8.0 | GO:0004012 | phospholipid-translocating ATPase activity(GO:0004012) |
| 0.3 | 3.5 | GO:0005007 | fibroblast growth factor-activated receptor activity(GO:0005007) |
| 0.3 | 1.2 | GO:0004768 | stearoyl-CoA 9-desaturase activity(GO:0004768) acyl-CoA desaturase activity(GO:0016215) |
| 0.3 | 0.9 | GO:0015403 | thiamine transmembrane transporter activity(GO:0015234) thiamine uptake transmembrane transporter activity(GO:0015403) |
| 0.3 | 0.9 | GO:0019959 | interleukin-8 binding(GO:0019959) |
| 0.3 | 2.6 | GO:0016889 | endodeoxyribonuclease activity, producing 3'-phosphomonoesters(GO:0016889) |
| 0.3 | 4.6 | GO:0000150 | recombinase activity(GO:0000150) |
| 0.3 | 1.4 | GO:0046899 | nucleoside triphosphate adenylate kinase activity(GO:0046899) |
| 0.3 | 1.7 | GO:0003998 | acylphosphatase activity(GO:0003998) |
| 0.3 | 6.5 | GO:0005251 | delayed rectifier potassium channel activity(GO:0005251) |
| 0.3 | 2.0 | GO:0047035 | testosterone dehydrogenase (NAD+) activity(GO:0047035) |
| 0.3 | 2.7 | GO:0004321 | fatty-acyl-CoA synthase activity(GO:0004321) |
| 0.3 | 7.1 | GO:0005527 | macrolide binding(GO:0005527) FK506 binding(GO:0005528) |
| 0.3 | 3.1 | GO:0008020 | G-protein coupled photoreceptor activity(GO:0008020) |
| 0.3 | 2.3 | GO:0055131 | C3HC4-type RING finger domain binding(GO:0055131) |
| 0.3 | 2.0 | GO:0015185 | gamma-aminobutyric acid:sodium symporter activity(GO:0005332) gamma-aminobutyric acid transmembrane transporter activity(GO:0015185) |
| 0.2 | 1.2 | GO:0016841 | ammonia-lyase activity(GO:0016841) |
| 0.2 | 4.6 | GO:0030898 | actin-dependent ATPase activity(GO:0030898) |
| 0.2 | 1.4 | GO:0004489 | methylenetetrahydrofolate reductase (NAD(P)H) activity(GO:0004489) |
| 0.2 | 3.6 | GO:0005229 | intracellular calcium activated chloride channel activity(GO:0005229) |
| 0.2 | 7.5 | GO:0030676 | Rac guanyl-nucleotide exchange factor activity(GO:0030676) |
| 0.2 | 3.3 | GO:0017034 | Rap guanyl-nucleotide exchange factor activity(GO:0017034) |
| 0.2 | 0.7 | GO:0032089 | NACHT domain binding(GO:0032089) |
| 0.2 | 2.0 | GO:0043533 | inositol 1,3,4,5 tetrakisphosphate binding(GO:0043533) |
| 0.2 | 1.1 | GO:0001010 | transcription factor activity, sequence-specific DNA binding transcription factor recruiting(GO:0001010) |
| 0.2 | 0.7 | GO:0070984 | SET domain binding(GO:0070984) |
| 0.2 | 1.1 | GO:0005222 | intracellular cAMP activated cation channel activity(GO:0005222) |
| 0.2 | 2.0 | GO:0097322 | 7SK snRNA binding(GO:0097322) |
| 0.2 | 3.1 | GO:0016846 | carbon-sulfur lyase activity(GO:0016846) |
| 0.2 | 6.8 | GO:0008331 | high voltage-gated calcium channel activity(GO:0008331) |
| 0.2 | 0.6 | GO:0016426 | tRNA (adenine) methyltransferase activity(GO:0016426) |
| 0.2 | 0.6 | GO:0080019 | fatty-acyl-CoA reductase (alcohol-forming) activity(GO:0080019) |
| 0.2 | 2.7 | GO:0048185 | activin binding(GO:0048185) |
| 0.2 | 0.6 | GO:0005457 | GDP-fucose transmembrane transporter activity(GO:0005457) purine nucleotide-sugar transmembrane transporter activity(GO:0036080) |
| 0.2 | 0.6 | GO:0042806 | fucose binding(GO:0042806) |
| 0.2 | 1.8 | GO:0008429 | phosphatidylethanolamine binding(GO:0008429) |
| 0.2 | 8.6 | GO:0000049 | tRNA binding(GO:0000049) |
| 0.2 | 0.6 | GO:0052870 | tocopherol omega-hydroxylase activity(GO:0052870) alpha-tocopherol omega-hydroxylase activity(GO:0052871) 20-hydroxy-leukotriene B4 omega oxidase activity(GO:0097258) 20-aldehyde-leukotriene B4 20-monooxygenase activity(GO:0097259) |
| 0.2 | 1.0 | GO:0003886 | DNA (cytosine-5-)-methyltransferase activity(GO:0003886) |
| 0.2 | 5.0 | GO:0004029 | aldehyde dehydrogenase (NAD) activity(GO:0004029) |
| 0.2 | 0.8 | GO:0098770 | FBXO family protein binding(GO:0098770) |
| 0.2 | 5.4 | GO:0098641 | cadherin binding involved in cell-cell adhesion(GO:0098641) |
| 0.2 | 1.3 | GO:0032217 | riboflavin transporter activity(GO:0032217) |
| 0.2 | 3.7 | GO:0008239 | dipeptidyl-peptidase activity(GO:0008239) |
| 0.2 | 1.6 | GO:0008526 | phosphatidylinositol transporter activity(GO:0008526) |
| 0.2 | 0.2 | GO:0071837 | HMG box domain binding(GO:0071837) |
| 0.2 | 1.6 | GO:0051575 | 5'-deoxyribose-5-phosphate lyase activity(GO:0051575) |
| 0.2 | 1.9 | GO:0016918 | retinal binding(GO:0016918) |
| 0.2 | 1.6 | GO:0047144 | 2-acylglycerol-3-phosphate O-acyltransferase activity(GO:0047144) |
| 0.2 | 1.4 | GO:0004111 | creatine kinase activity(GO:0004111) |
| 0.2 | 3.8 | GO:0030275 | LRR domain binding(GO:0030275) |
| 0.2 | 14.9 | GO:0005089 | Rho guanyl-nucleotide exchange factor activity(GO:0005089) |
| 0.2 | 3.7 | GO:0008395 | steroid hydroxylase activity(GO:0008395) |
| 0.2 | 1.5 | GO:0031685 | adenosine receptor binding(GO:0031685) |
| 0.2 | 1.5 | GO:0046975 | histone methyltransferase activity (H3-K36 specific)(GO:0046975) |
| 0.2 | 0.8 | GO:0018685 | alkane 1-monooxygenase activity(GO:0018685) |
| 0.2 | 0.5 | GO:0086089 | voltage-gated potassium channel activity involved in atrial cardiac muscle cell action potential repolarization(GO:0086089) |
| 0.2 | 1.6 | GO:0045236 | CXCR chemokine receptor binding(GO:0045236) |
| 0.2 | 3.0 | GO:0032454 | histone demethylase activity (H3-K9 specific)(GO:0032454) |
| 0.2 | 1.7 | GO:0048406 | nerve growth factor binding(GO:0048406) |
| 0.2 | 0.5 | GO:0031403 | lithium ion binding(GO:0031403) |
| 0.1 | 1.2 | GO:0003726 | double-stranded RNA adenosine deaminase activity(GO:0003726) |
| 0.1 | 0.4 | GO:0004874 | aryl hydrocarbon receptor activity(GO:0004874) |
| 0.1 | 1.6 | GO:0039706 | co-receptor binding(GO:0039706) |
| 0.1 | 1.4 | GO:0004415 | hyalurononglucosaminidase activity(GO:0004415) |
| 0.1 | 3.3 | GO:0031005 | filamin binding(GO:0031005) |
| 0.1 | 3.6 | GO:0031489 | myosin V binding(GO:0031489) |
| 0.1 | 1.5 | GO:0032051 | clathrin light chain binding(GO:0032051) |
| 0.1 | 0.5 | GO:0047288 | monosialoganglioside sialyltransferase activity(GO:0047288) |
| 0.1 | 1.1 | GO:0045159 | myosin II binding(GO:0045159) |
| 0.1 | 1.1 | GO:0001733 | galactosylceramide sulfotransferase activity(GO:0001733) galactose 3-O-sulfotransferase activity(GO:0050694) |
| 0.1 | 4.0 | GO:0005035 | tumor necrosis factor-activated receptor activity(GO:0005031) death receptor activity(GO:0005035) |
| 0.1 | 1.3 | GO:0004972 | NMDA glutamate receptor activity(GO:0004972) |
| 0.1 | 0.8 | GO:0017060 | 3-galactosyl-N-acetylglucosaminide 4-alpha-L-fucosyltransferase activity(GO:0017060) |
| 0.1 | 4.1 | GO:0005001 | transmembrane receptor protein tyrosine phosphatase activity(GO:0005001) transmembrane receptor protein phosphatase activity(GO:0019198) |
| 0.1 | 3.5 | GO:0005355 | glucose transmembrane transporter activity(GO:0005355) |
| 0.1 | 2.2 | GO:0070330 | aromatase activity(GO:0070330) |
| 0.1 | 1.4 | GO:0070915 | lysophosphatidic acid receptor activity(GO:0070915) |
| 0.1 | 1.2 | GO:0004445 | inositol-polyphosphate 5-phosphatase activity(GO:0004445) PH domain binding(GO:0042731) |
| 0.1 | 3.8 | GO:0001972 | retinoic acid binding(GO:0001972) |
| 0.1 | 5.6 | GO:0015026 | coreceptor activity(GO:0015026) |
| 0.1 | 1.0 | GO:0016015 | morphogen activity(GO:0016015) |
| 0.1 | 1.5 | GO:0004016 | adenylate cyclase activity(GO:0004016) |
| 0.1 | 3.2 | GO:0051959 | dynein light intermediate chain binding(GO:0051959) |
| 0.1 | 2.4 | GO:0050811 | GABA receptor binding(GO:0050811) |
| 0.1 | 0.8 | GO:0042500 | aspartic endopeptidase activity, intramembrane cleaving(GO:0042500) |
| 0.1 | 2.4 | GO:0008191 | metalloendopeptidase inhibitor activity(GO:0008191) |
| 0.1 | 5.0 | GO:0004683 | calmodulin-dependent protein kinase activity(GO:0004683) |
| 0.1 | 1.4 | GO:0001730 | 2'-5'-oligoadenylate synthetase activity(GO:0001730) |
| 0.1 | 2.5 | GO:0004859 | phospholipase inhibitor activity(GO:0004859) |
| 0.1 | 1.5 | GO:0008253 | 5'-nucleotidase activity(GO:0008253) |
| 0.1 | 0.4 | GO:0042030 | ATPase inhibitor activity(GO:0042030) |
| 0.1 | 0.3 | GO:0047757 | chondroitin-glucuronate 5-epimerase activity(GO:0047757) |
| 0.1 | 2.4 | GO:0005545 | 1-phosphatidylinositol binding(GO:0005545) |
| 0.1 | 0.6 | GO:0015350 | reduced folate carrier activity(GO:0008518) methotrexate transporter activity(GO:0015350) |
| 0.1 | 0.3 | GO:0015235 | cobalamin transporter activity(GO:0015235) |
| 0.1 | 5.6 | GO:0005544 | calcium-dependent phospholipid binding(GO:0005544) |
| 0.1 | 0.8 | GO:0005021 | vascular endothelial growth factor-activated receptor activity(GO:0005021) |
| 0.1 | 2.1 | GO:0043395 | heparan sulfate proteoglycan binding(GO:0043395) |
| 0.1 | 2.9 | GO:0001848 | complement binding(GO:0001848) |
| 0.1 | 1.5 | GO:0017151 | DEAD/H-box RNA helicase binding(GO:0017151) |
| 0.1 | 0.4 | GO:0052851 | cupric reductase activity(GO:0008823) ferric-chelate reductase (NADPH) activity(GO:0052851) |
| 0.1 | 1.5 | GO:0034450 | ubiquitin-ubiquitin ligase activity(GO:0034450) |
| 0.1 | 1.4 | GO:0035612 | AP-2 adaptor complex binding(GO:0035612) |
| 0.1 | 0.5 | GO:0002161 | aminoacyl-tRNA editing activity(GO:0002161) |
| 0.1 | 1.7 | GO:0004535 | poly(A)-specific ribonuclease activity(GO:0004535) |
| 0.1 | 2.3 | GO:0005109 | frizzled binding(GO:0005109) |
| 0.1 | 1.3 | GO:0003993 | acid phosphatase activity(GO:0003993) |
| 0.1 | 1.1 | GO:0015266 | protein channel activity(GO:0015266) |
| 0.1 | 2.0 | GO:0051429 | corticotropin-releasing hormone receptor binding(GO:0051429) corticotropin-releasing hormone receptor 1 binding(GO:0051430) |
| 0.1 | 1.0 | GO:0051920 | peroxiredoxin activity(GO:0051920) |
| 0.1 | 1.0 | GO:0032052 | bile acid binding(GO:0032052) |
| 0.1 | 2.9 | GO:0005104 | fibroblast growth factor receptor binding(GO:0005104) |
| 0.1 | 3.7 | GO:0030507 | spectrin binding(GO:0030507) |
| 0.1 | 1.3 | GO:0036041 | long-chain fatty acid binding(GO:0036041) |
| 0.1 | 1.3 | GO:0031996 | thioesterase binding(GO:0031996) |
| 0.1 | 3.2 | GO:0043539 | protein serine/threonine kinase activator activity(GO:0043539) |
| 0.1 | 0.6 | GO:0016406 | carnitine O-acyltransferase activity(GO:0016406) |
| 0.1 | 0.9 | GO:0004679 | AMP-activated protein kinase activity(GO:0004679) |
| 0.1 | 1.7 | GO:0042056 | chemoattractant activity(GO:0042056) |
| 0.1 | 2.8 | GO:0005310 | dicarboxylic acid transmembrane transporter activity(GO:0005310) |
| 0.1 | 3.9 | GO:0005158 | insulin receptor binding(GO:0005158) |
| 0.1 | 0.8 | GO:0004300 | enoyl-CoA hydratase activity(GO:0004300) |
| 0.1 | 12.1 | GO:0017137 | Rab GTPase binding(GO:0017137) |
| 0.1 | 1.0 | GO:0015280 | ligand-gated sodium channel activity(GO:0015280) |
| 0.1 | 2.1 | GO:0046965 | retinoid X receptor binding(GO:0046965) |
| 0.1 | 0.7 | GO:0050700 | CARD domain binding(GO:0050700) |
| 0.1 | 1.8 | GO:0001530 | lipopolysaccharide binding(GO:0001530) |
| 0.1 | 1.6 | GO:0000062 | fatty-acyl-CoA binding(GO:0000062) |
| 0.1 | 0.3 | GO:0061769 | ribosylnicotinamide kinase activity(GO:0050262) ribosylnicotinate kinase activity(GO:0061769) |
| 0.1 | 0.6 | GO:0004017 | adenylate kinase activity(GO:0004017) |
| 0.1 | 12.6 | GO:0008083 | growth factor activity(GO:0008083) |
| 0.1 | 1.7 | GO:0046961 | ATPase activity, coupled to transmembrane movement of ions, rotational mechanism(GO:0044769) proton-transporting ATPase activity, rotational mechanism(GO:0046961) |
| 0.1 | 0.1 | GO:0005549 | odorant binding(GO:0005549) |
| 0.1 | 6.4 | GO:0005201 | extracellular matrix structural constituent(GO:0005201) |
| 0.1 | 0.9 | GO:0034483 | heparan sulfate sulfotransferase activity(GO:0034483) |
| 0.1 | 1.3 | GO:0002162 | dystroglycan binding(GO:0002162) |
| 0.1 | 0.8 | GO:0051378 | amine binding(GO:0043176) serotonin binding(GO:0051378) |
| 0.1 | 2.6 | GO:0004115 | 3',5'-cyclic-AMP phosphodiesterase activity(GO:0004115) |
| 0.1 | 1.5 | GO:0016628 | oxidoreductase activity, acting on the CH-CH group of donors, NAD or NADP as acceptor(GO:0016628) |
| 0.1 | 1.5 | GO:0033130 | acetylcholine receptor binding(GO:0033130) |
| 0.1 | 12.0 | GO:0005516 | calmodulin binding(GO:0005516) |
| 0.1 | 0.7 | GO:0004065 | arylsulfatase activity(GO:0004065) |
| 0.1 | 7.3 | GO:0001191 | transcriptional repressor activity, RNA polymerase II transcription factor binding(GO:0001191) |
| 0.1 | 2.5 | GO:0019894 | kinesin binding(GO:0019894) |
| 0.1 | 1.0 | GO:0003746 | translation elongation factor activity(GO:0003746) |
| 0.1 | 1.0 | GO:0051371 | muscle alpha-actinin binding(GO:0051371) |
| 0.1 | 0.9 | GO:0070742 | C2H2 zinc finger domain binding(GO:0070742) |
| 0.1 | 4.5 | GO:0005249 | voltage-gated potassium channel activity(GO:0005249) |
| 0.1 | 2.3 | GO:0050681 | androgen receptor binding(GO:0050681) |
| 0.1 | 1.4 | GO:1990841 | promoter-specific chromatin binding(GO:1990841) |
| 0.0 | 11.4 | GO:0005096 | GTPase activator activity(GO:0005096) |
| 0.0 | 1.5 | GO:0046875 | ephrin receptor binding(GO:0046875) |
| 0.0 | 1.6 | GO:0005086 | ARF guanyl-nucleotide exchange factor activity(GO:0005086) |
| 0.0 | 1.3 | GO:0008066 | glutamate receptor activity(GO:0008066) |
| 0.0 | 4.2 | GO:0002039 | p53 binding(GO:0002039) |
| 0.0 | 1.5 | GO:0008188 | neuropeptide receptor activity(GO:0008188) |
| 0.0 | 0.8 | GO:0035325 | Toll-like receptor binding(GO:0035325) |
| 0.0 | 3.3 | GO:0008307 | structural constituent of muscle(GO:0008307) |
| 0.0 | 9.6 | GO:0005085 | guanyl-nucleotide exchange factor activity(GO:0005085) |
| 0.0 | 2.0 | GO:0008139 | nuclear localization sequence binding(GO:0008139) |
| 0.0 | 0.9 | GO:0017127 | cholesterol transporter activity(GO:0017127) |
| 0.0 | 0.4 | GO:0031821 | G-protein coupled serotonin receptor binding(GO:0031821) |
| 0.0 | 1.8 | GO:0005044 | scavenger receptor activity(GO:0005044) |
| 0.0 | 0.2 | GO:0004427 | inorganic diphosphatase activity(GO:0004427) |
| 0.0 | 2.1 | GO:0048306 | calcium-dependent protein binding(GO:0048306) |
| 0.0 | 2.1 | GO:0035064 | methylated histone binding(GO:0035064) |
| 0.0 | 0.1 | GO:0030272 | 5-formyltetrahydrofolate cyclo-ligase activity(GO:0030272) |
| 0.0 | 1.4 | GO:0015485 | cholesterol binding(GO:0015485) |
| 0.0 | 4.3 | GO:0004896 | cytokine receptor activity(GO:0004896) |
| 0.0 | 0.4 | GO:0043225 | anion transmembrane-transporting ATPase activity(GO:0043225) |
| 0.0 | 2.2 | GO:0070491 | repressing transcription factor binding(GO:0070491) |
| 0.0 | 3.2 | GO:0016811 | hydrolase activity, acting on carbon-nitrogen (but not peptide) bonds, in linear amides(GO:0016811) |
| 0.0 | 2.0 | GO:0004693 | cyclin-dependent protein serine/threonine kinase activity(GO:0004693) |
| 0.0 | 1.3 | GO:0004385 | guanylate kinase activity(GO:0004385) |
| 0.0 | 0.3 | GO:0051011 | microtubule minus-end binding(GO:0051011) |
| 0.0 | 0.4 | GO:0016783 | sulfurtransferase activity(GO:0016783) |
| 0.0 | 0.2 | GO:0004499 | N,N-dimethylaniline monooxygenase activity(GO:0004499) |
| 0.0 | 8.0 | GO:0008236 | serine-type peptidase activity(GO:0008236) |
| 0.0 | 1.2 | GO:0097110 | scaffold protein binding(GO:0097110) |
| 0.0 | 1.5 | GO:0031490 | chromatin DNA binding(GO:0031490) |
| 0.0 | 0.3 | GO:0003691 | double-stranded telomeric DNA binding(GO:0003691) |
| 0.0 | 0.2 | GO:1904264 | ubiquitin protein ligase activity involved in ERAD pathway(GO:1904264) |
| 0.0 | 0.8 | GO:0022848 | acetylcholine-gated cation channel activity(GO:0022848) |
| 0.0 | 2.3 | GO:0008013 | beta-catenin binding(GO:0008013) |
| 0.0 | 0.8 | GO:0097200 | cysteine-type endopeptidase activity involved in execution phase of apoptosis(GO:0097200) |
| 0.0 | 0.1 | GO:0004379 | glycylpeptide N-tetradecanoyltransferase activity(GO:0004379) myristoyltransferase activity(GO:0019107) |
| 0.0 | 36.0 | GO:0001071 | nucleic acid binding transcription factor activity(GO:0001071) transcription factor activity, sequence-specific DNA binding(GO:0003700) |
| 0.0 | 0.4 | GO:0031683 | G-protein beta/gamma-subunit complex binding(GO:0031683) |
| 0.0 | 0.5 | GO:0005184 | neuropeptide hormone activity(GO:0005184) |
| 0.0 | 0.4 | GO:0000030 | mannosyltransferase activity(GO:0000030) |
| 0.0 | 1.8 | GO:0005125 | cytokine activity(GO:0005125) |
| 0.0 | 1.5 | GO:0004984 | olfactory receptor activity(GO:0004984) |
| 0.0 | 0.6 | GO:0051539 | 4 iron, 4 sulfur cluster binding(GO:0051539) |
| 0.0 | 0.3 | GO:0003887 | DNA-directed DNA polymerase activity(GO:0003887) |
| 0.0 | 0.2 | GO:0005154 | epidermal growth factor receptor binding(GO:0005154) |
| 0.0 | 0.5 | GO:0004714 | transmembrane receptor protein tyrosine kinase activity(GO:0004714) |
| 0.0 | 0.8 | GO:0004712 | protein serine/threonine/tyrosine kinase activity(GO:0004712) |
| 0.0 | 0.6 | GO:0005179 | hormone activity(GO:0005179) |
Gene overrepresentation in curated gene sets: canonical pathways category:
| Log-likelihood per target | Total log-likelihood | Term | Description |
|---|---|---|---|
| 0.4 | 17.3 | NABA BASEMENT MEMBRANES | Genes encoding structural components of basement membranes |
| 0.3 | 2.1 | PID EPHA2 FWD PATHWAY | EPHA2 forward signaling |
| 0.3 | 15.6 | ST WNT BETA CATENIN PATHWAY | Wnt/beta-catenin Pathway |
| 0.3 | 0.9 | PID IL8 CXCR1 PATHWAY | IL8- and CXCR1-mediated signaling events |
| 0.3 | 1.6 | PID FRA PATHWAY | Validated transcriptional targets of AP1 family members Fra1 and Fra2 |
| 0.3 | 15.4 | PID NEPHRIN NEPH1 PATHWAY | Nephrin/Neph1 signaling in the kidney podocyte |
| 0.2 | 7.5 | PID WNT SIGNALING PATHWAY | Wnt signaling network |
| 0.2 | 9.9 | PID PRL SIGNALING EVENTS PATHWAY | Signaling events mediated by PRL |
| 0.2 | 12.7 | PID SYNDECAN 4 PATHWAY | Syndecan-4-mediated signaling events |
| 0.2 | 0.8 | PID VEGF VEGFR PATHWAY | VEGF and VEGFR signaling network |
| 0.2 | 4.7 | ST G ALPHA S PATHWAY | G alpha s Pathway |
| 0.2 | 1.3 | PID SYNDECAN 2 PATHWAY | Syndecan-2-mediated signaling events |
| 0.2 | 4.1 | PID SYNDECAN 3 PATHWAY | Syndecan-3-mediated signaling events |
| 0.2 | 30.3 | NABA ECM AFFILIATED | Genes encoding proteins affiliated structurally or functionally to extracellular matrix proteins |
| 0.2 | 4.0 | PID CONE PATHWAY | Visual signal transduction: Cones |
| 0.2 | 5.7 | PID S1P S1P2 PATHWAY | S1P2 pathway |
| 0.2 | 0.3 | PID S1P S1P1 PATHWAY | S1P1 pathway |
| 0.1 | 2.6 | PID LPA4 PATHWAY | LPA4-mediated signaling events |
| 0.1 | 4.7 | SIG CD40PATHWAYMAP | Genes related to CD40 signaling |
| 0.1 | 23.5 | NABA ECM GLYCOPROTEINS | Genes encoding structural ECM glycoproteins |
| 0.1 | 7.8 | PID ERBB4 PATHWAY | ErbB4 signaling events |
| 0.1 | 8.9 | PID ILK PATHWAY | Integrin-linked kinase signaling |
| 0.1 | 2.3 | PID CIRCADIAN PATHWAY | Circadian rhythm pathway |
| 0.1 | 3.4 | PID VEGFR1 PATHWAY | VEGFR1 specific signals |
| 0.1 | 2.1 | PID TCR CALCIUM PATHWAY | Calcium signaling in the CD4+ TCR pathway |
| 0.1 | 2.8 | ST MYOCYTE AD PATHWAY | Myocyte Adrenergic Pathway is a specific case of the generalized Adrenergic Pathway. |
| 0.1 | 1.1 | PID TXA2PATHWAY | Thromboxane A2 receptor signaling |
| 0.1 | 3.3 | PID ALK1 PATHWAY | ALK1 signaling events |
| 0.1 | 1.7 | PID HIF1A PATHWAY | Hypoxic and oxygen homeostasis regulation of HIF-1-alpha |
| 0.1 | 2.1 | PID RET PATHWAY | Signaling events regulated by Ret tyrosine kinase |
| 0.1 | 3.6 | PID ENDOTHELIN PATHWAY | Endothelins |
| 0.1 | 1.1 | PID RHODOPSIN PATHWAY | Visual signal transduction: Rods |
| 0.1 | 31.6 | NABA SECRETED FACTORS | Genes encoding secreted soluble factors |
| 0.1 | 5.0 | PID P38 ALPHA BETA DOWNSTREAM PATHWAY | Signaling mediated by p38-alpha and p38-beta |
| 0.1 | 1.9 | PID NECTIN PATHWAY | Nectin adhesion pathway |
| 0.1 | 1.4 | SA REG CASCADE OF CYCLIN EXPR | Expression of cyclins regulates progression through the cell cycle by activating cyclin-dependent kinases. |
| 0.1 | 1.9 | PID INSULIN PATHWAY | Insulin Pathway |
| 0.1 | 1.6 | SIG IL4RECEPTOR IN B LYPHOCYTES | Genes related to IL4 rceptor signaling in B lymphocytes |
| 0.1 | 5.9 | PID RB 1PATHWAY | Regulation of retinoblastoma protein |
| 0.1 | 6.2 | PID MYC REPRESS PATHWAY | Validated targets of C-MYC transcriptional repression |
| 0.1 | 3.9 | PID TGFBR PATHWAY | TGF-beta receptor signaling |
| 0.1 | 1.4 | PID IL3 PATHWAY | IL3-mediated signaling events |
| 0.1 | 2.1 | PID MET PATHWAY | Signaling events mediated by Hepatocyte Growth Factor Receptor (c-Met) |
| 0.1 | 2.6 | PID HES HEY PATHWAY | Notch-mediated HES/HEY network |
| 0.1 | 2.8 | PID CDC42 REG PATHWAY | Regulation of CDC42 activity |
| 0.0 | 2.5 | PID P53 REGULATION PATHWAY | p53 pathway |
| 0.0 | 1.9 | PID FCER1 PATHWAY | Fc-epsilon receptor I signaling in mast cells |
| 0.0 | 2.3 | PID TNF PATHWAY | TNF receptor signaling pathway |
| 0.0 | 0.5 | ST GA12 PATHWAY | G alpha 12 Pathway |
| 0.0 | 0.6 | PID P38 GAMMA DELTA PATHWAY | Signaling mediated by p38-gamma and p38-delta |
| 0.0 | 0.7 | ST GA13 PATHWAY | G alpha 13 Pathway |
| 0.0 | 2.4 | PID RHOA REG PATHWAY | Regulation of RhoA activity |
| 0.0 | 0.2 | PID INTEGRIN3 PATHWAY | Beta3 integrin cell surface interactions |
| 0.0 | 1.5 | PID HNF3A PATHWAY | FOXA1 transcription factor network |
| 0.0 | 1.2 | PID CD8 TCR DOWNSTREAM PATHWAY | Downstream signaling in naïve CD8+ T cells |
| 0.0 | 2.2 | PID P73PATHWAY | p73 transcription factor network |
| 0.0 | 0.6 | PID IL2 1PATHWAY | IL2-mediated signaling events |
| 0.0 | 0.5 | PID NETRIN PATHWAY | Netrin-mediated signaling events |
| 0.0 | 5.9 | NABA MATRISOME ASSOCIATED | Ensemble of genes encoding ECM-associated proteins including ECM-affilaited proteins, ECM regulators and secreted factors |
| 0.0 | 0.8 | NABA PROTEOGLYCANS | Genes encoding proteoglycans |
| 0.0 | 0.4 | PID RXR VDR PATHWAY | RXR and RAR heterodimerization with other nuclear receptor |
Gene overrepresentation in curated gene sets: REACTOME pathways category:
| Log-likelihood per target | Total log-likelihood | Term | Description |
|---|---|---|---|
| 0.8 | 1.6 | REACTOME ACYL CHAIN REMODELLING OF PI | Genes involved in Acyl chain remodelling of PI |
| 0.5 | 8.6 | REACTOME REVERSIBLE HYDRATION OF CARBON DIOXIDE | Genes involved in Reversible Hydration of Carbon Dioxide |
| 0.4 | 8.4 | REACTOME APOPTOTIC CLEAVAGE OF CELL ADHESION PROTEINS | Genes involved in Apoptotic cleavage of cell adhesion proteins |
| 0.4 | 5.2 | REACTOME ACTIVATION OF CHAPERONE GENES BY ATF6 ALPHA | Genes involved in Activation of Chaperone Genes by ATF6-alpha |
| 0.4 | 7.6 | REACTOME INHIBITION OF INSULIN SECRETION BY ADRENALINE NORADRENALINE | Genes involved in Inhibition of Insulin Secretion by Adrenaline/Noradrenaline |
| 0.3 | 1.4 | REACTOME THROMBOXANE SIGNALLING THROUGH TP RECEPTOR | Genes involved in Thromboxane signalling through TP receptor |
| 0.3 | 9.2 | REACTOME AMINO ACID SYNTHESIS AND INTERCONVERSION TRANSAMINATION | Genes involved in Amino acid synthesis and interconversion (transamination) |
| 0.3 | 5.2 | REACTOME SYNTHESIS OF PE | Genes involved in Synthesis of PE |
| 0.3 | 4.9 | REACTOME PYRIMIDINE CATABOLISM | Genes involved in Pyrimidine catabolism |
| 0.3 | 4.1 | REACTOME SIGNALING BY NOTCH3 | Genes involved in Signaling by NOTCH3 |
| 0.3 | 3.7 | REACTOME SYNTHESIS OF BILE ACIDS AND BILE SALTS VIA 24 HYDROXYCHOLESTEROL | Genes involved in Synthesis of bile acids and bile salts via 24-hydroxycholesterol |
| 0.3 | 5.8 | REACTOME REGULATION OF RHEB GTPASE ACTIVITY BY AMPK | Genes involved in Regulation of Rheb GTPase activity by AMPK |
| 0.3 | 1.2 | REACTOME ALPHA LINOLENIC ACID ALA METABOLISM | Genes involved in alpha-linolenic acid (ALA) metabolism |
| 0.3 | 16.8 | REACTOME VOLTAGE GATED POTASSIUM CHANNELS | Genes involved in Voltage gated Potassium channels |
| 0.3 | 4.3 | REACTOME SYNTHESIS OF SUBSTRATES IN N GLYCAN BIOSYTHESIS | Genes involved in Synthesis of substrates in N-glycan biosythesis |
| 0.3 | 4.1 | REACTOME MITOCHONDRIAL TRNA AMINOACYLATION | Genes involved in Mitochondrial tRNA aminoacylation |
| 0.3 | 1.5 | REACTOME ADP SIGNALLING THROUGH P2RY1 | Genes involved in ADP signalling through P2Y purinoceptor 1 |
| 0.2 | 3.7 | REACTOME GLYCOLYSIS | Genes involved in Glycolysis |
| 0.2 | 6.5 | REACTOME PROLACTIN RECEPTOR SIGNALING | Genes involved in Prolactin receptor signaling |
| 0.2 | 4.4 | REACTOME PROCESSING OF INTRONLESS PRE MRNAS | Genes involved in Processing of Intronless Pre-mRNAs |
| 0.2 | 4.3 | REACTOME BASE FREE SUGAR PHOSPHATE REMOVAL VIA THE SINGLE NUCLEOTIDE REPLACEMENT PATHWAY | Genes involved in Base-free sugar-phosphate removal via the single-nucleotide replacement pathway |
| 0.2 | 2.1 | REACTOME REGULATION OF AMPK ACTIVITY VIA LKB1 | Genes involved in Regulation of AMPK activity via LKB1 |
| 0.2 | 4.2 | REACTOME CLASS C 3 METABOTROPIC GLUTAMATE PHEROMONE RECEPTORS | Genes involved in Class C/3 (Metabotropic glutamate/pheromone receptors) |
| 0.2 | 13.2 | REACTOME GLUCONEOGENESIS | Genes involved in Gluconeogenesis |
| 0.2 | 2.9 | REACTOME RECYCLING OF BILE ACIDS AND SALTS | Genes involved in Recycling of bile acids and salts |
| 0.2 | 4.6 | REACTOME TERMINATION OF O GLYCAN BIOSYNTHESIS | Genes involved in Termination of O-glycan biosynthesis |
| 0.2 | 10.8 | REACTOME ION TRANSPORT BY P TYPE ATPASES | Genes involved in Ion transport by P-type ATPases |
| 0.2 | 2.6 | REACTOME ADENYLATE CYCLASE ACTIVATING PATHWAY | Genes involved in Adenylate cyclase activating pathway |
| 0.2 | 10.6 | REACTOME SMOOTH MUSCLE CONTRACTION | Genes involved in Smooth Muscle Contraction |
| 0.2 | 12.8 | REACTOME COLLAGEN FORMATION | Genes involved in Collagen formation |
| 0.2 | 4.8 | REACTOME REGULATION OF INSULIN LIKE GROWTH FACTOR IGF ACTIVITY BY INSULIN LIKE GROWTH FACTOR BINDING PROTEINS IGFBPS | Genes involved in Regulation of Insulin-like Growth Factor (IGF) Activity by Insulin-like Growth Factor Binding Proteins (IGFBPs) |
| 0.2 | 2.3 | REACTOME REGULATION OF INSULIN SECRETION BY ACETYLCHOLINE | Genes involved in Regulation of Insulin Secretion by Acetylcholine |
| 0.2 | 3.7 | REACTOME SIGNALING BY ACTIVATED POINT MUTANTS OF FGFR1 | Genes involved in Signaling by activated point mutants of FGFR1 |
| 0.2 | 2.9 | REACTOME INHIBITION OF REPLICATION INITIATION OF DAMAGED DNA BY RB1 E2F1 | Genes involved in Inhibition of replication initiation of damaged DNA by RB1/E2F1 |
| 0.2 | 2.4 | REACTOME P130CAS LINKAGE TO MAPK SIGNALING FOR INTEGRINS | Genes involved in p130Cas linkage to MAPK signaling for integrins |
| 0.2 | 1.2 | REACTOME MEMBRANE BINDING AND TARGETTING OF GAG PROTEINS | Genes involved in Membrane binding and targetting of GAG proteins |
| 0.2 | 0.5 | REACTOME ACTIVATION OF CHAPERONES BY ATF6 ALPHA | Genes involved in Activation of Chaperones by ATF6-alpha |
| 0.2 | 1.8 | REACTOME NRIF SIGNALS CELL DEATH FROM THE NUCLEUS | Genes involved in NRIF signals cell death from the nucleus |
| 0.2 | 5.3 | REACTOME DCC MEDIATED ATTRACTIVE SIGNALING | Genes involved in DCC mediated attractive signaling |
| 0.1 | 3.0 | REACTOME SIGNAL ATTENUATION | Genes involved in Signal attenuation |
| 0.1 | 2.7 | REACTOME SYNTHESIS OF PC | Genes involved in Synthesis of PC |
| 0.1 | 2.1 | REACTOME BILE SALT AND ORGANIC ANION SLC TRANSPORTERS | Genes involved in Bile salt and organic anion SLC transporters |
| 0.1 | 2.9 | REACTOME ACYL CHAIN REMODELLING OF PE | Genes involved in Acyl chain remodelling of PE |
| 0.1 | 15.9 | REACTOME CLASS B 2 SECRETIN FAMILY RECEPTORS | Genes involved in Class B/2 (Secretin family receptors) |
| 0.1 | 2.4 | REACTOME BMAL1 CLOCK NPAS2 ACTIVATES CIRCADIAN EXPRESSION | Genes involved in BMAL1:CLOCK/NPAS2 Activates Circadian Expression |
| 0.1 | 3.0 | REACTOME PEROXISOMAL LIPID METABOLISM | Genes involved in Peroxisomal lipid metabolism |
| 0.1 | 1.8 | REACTOME SIGNAL REGULATORY PROTEIN SIRP FAMILY INTERACTIONS | Genes involved in Signal regulatory protein (SIRP) family interactions |
| 0.1 | 4.3 | REACTOME GABA SYNTHESIS RELEASE REUPTAKE AND DEGRADATION | Genes involved in GABA synthesis, release, reuptake and degradation |
| 0.1 | 1.9 | REACTOME TGF BETA RECEPTOR SIGNALING IN EMT EPITHELIAL TO MESENCHYMAL TRANSITION | Genes involved in TGF-beta receptor signaling in EMT (epithelial to mesenchymal transition) |
| 0.1 | 2.5 | REACTOME DOWNREGULATION OF TGF BETA RECEPTOR SIGNALING | Genes involved in Downregulation of TGF-beta receptor signaling |
| 0.1 | 5.8 | REACTOME NRAGE SIGNALS DEATH THROUGH JNK | Genes involved in NRAGE signals death through JNK |
| 0.1 | 3.0 | REACTOME EXTRINSIC PATHWAY FOR APOPTOSIS | Genes involved in Extrinsic Pathway for Apoptosis |
| 0.1 | 3.4 | REACTOME MEIOTIC RECOMBINATION | Genes involved in Meiotic Recombination |
| 0.1 | 0.9 | REACTOME BETA DEFENSINS | Genes involved in Beta defensins |
| 0.1 | 2.3 | REACTOME GLUCURONIDATION | Genes involved in Glucuronidation |
| 0.1 | 3.0 | REACTOME ADHERENS JUNCTIONS INTERACTIONS | Genes involved in Adherens junctions interactions |
| 0.1 | 38.3 | REACTOME GENERIC TRANSCRIPTION PATHWAY | Genes involved in Generic Transcription Pathway |
| 0.1 | 3.6 | REACTOME COMPLEMENT CASCADE | Genes involved in Complement cascade |
| 0.1 | 2.6 | REACTOME RNA POL III TRANSCRIPTION INITIATION FROM TYPE 3 PROMOTER | Genes involved in RNA Polymerase III Transcription Initiation From Type 3 Promoter |
| 0.1 | 4.6 | REACTOME CYTOCHROME P450 ARRANGED BY SUBSTRATE TYPE | Genes involved in Cytochrome P450 - arranged by substrate type |
| 0.1 | 15.5 | REACTOME PEPTIDE LIGAND BINDING RECEPTORS | Genes involved in Peptide ligand-binding receptors |
| 0.1 | 1.3 | REACTOME OXYGEN DEPENDENT PROLINE HYDROXYLATION OF HYPOXIA INDUCIBLE FACTOR ALPHA | Genes involved in Oxygen-dependent Proline Hydroxylation of Hypoxia-inducible Factor Alpha |
| 0.1 | 0.6 | REACTOME PACKAGING OF TELOMERE ENDS | Genes involved in Packaging Of Telomere Ends |
| 0.1 | 1.6 | REACTOME SYNTHESIS OF GLYCOSYLPHOSPHATIDYLINOSITOL GPI | Genes involved in Synthesis of glycosylphosphatidylinositol (GPI) |
| 0.1 | 2.4 | REACTOME GABA A RECEPTOR ACTIVATION | Genes involved in GABA A receptor activation |
| 0.1 | 3.1 | REACTOME REGULATION OF BETA CELL DEVELOPMENT | Genes involved in Regulation of beta-cell development |
| 0.1 | 1.6 | REACTOME SIGNALING BY BMP | Genes involved in Signaling by BMP |
| 0.1 | 0.8 | REACTOME DAG AND IP3 SIGNALING | Genes involved in DAG and IP3 signaling |
| 0.1 | 0.8 | REACTOME TRAFFICKING AND PROCESSING OF ENDOSOMAL TLR | Genes involved in Trafficking and processing of endosomal TLR |
| 0.1 | 0.4 | REACTOME REGULATION OF HYPOXIA INDUCIBLE FACTOR HIF BY OXYGEN | Genes involved in Regulation of Hypoxia-inducible Factor (HIF) by Oxygen |
| 0.1 | 3.2 | REACTOME STRIATED MUSCLE CONTRACTION | Genes involved in Striated Muscle Contraction |
| 0.1 | 1.0 | REACTOME SYNTHESIS SECRETION AND INACTIVATION OF GLP1 | Genes involved in Synthesis, Secretion, and Inactivation of Glucagon-like Peptide-1 (GLP-1) |
| 0.1 | 1.2 | REACTOME MRNA DECAY BY 5 TO 3 EXORIBONUCLEASE | Genes involved in mRNA Decay by 5' to 3' Exoribonuclease |
| 0.1 | 2.1 | REACTOME G1 PHASE | Genes involved in G1 Phase |
| 0.1 | 0.8 | REACTOME SEROTONIN RECEPTORS | Genes involved in Serotonin receptors |
| 0.1 | 0.8 | REACTOME VEGF LIGAND RECEPTOR INTERACTIONS | Genes involved in VEGF ligand-receptor interactions |
| 0.1 | 1.3 | REACTOME RAS ACTIVATION UOPN CA2 INFUX THROUGH NMDA RECEPTOR | Genes involved in Ras activation uopn Ca2+ infux through NMDA receptor |
| 0.1 | 1.0 | REACTOME GAP JUNCTION ASSEMBLY | Genes involved in Gap junction assembly |
| 0.1 | 0.5 | REACTOME ROLE OF DCC IN REGULATING APOPTOSIS | Genes involved in Role of DCC in regulating apoptosis |
| 0.1 | 1.2 | REACTOME G0 AND EARLY G1 | Genes involved in G0 and Early G1 |
| 0.1 | 1.0 | REACTOME HDL MEDIATED LIPID TRANSPORT | Genes involved in HDL-mediated lipid transport |
| 0.0 | 1.7 | REACTOME CELL CELL JUNCTION ORGANIZATION | Genes involved in Cell-cell junction organization |
| 0.0 | 1.3 | REACTOME ACTIVATION OF KAINATE RECEPTORS UPON GLUTAMATE BINDING | Genes involved in Activation of Kainate Receptors upon glutamate binding |
| 0.0 | 1.7 | REACTOME TRANSCRIPTIONAL REGULATION OF WHITE ADIPOCYTE DIFFERENTIATION | Genes involved in Transcriptional Regulation of White Adipocyte Differentiation |
| 0.0 | 1.5 | REACTOME TRANSPORT OF VITAMINS NUCLEOSIDES AND RELATED MOLECULES | Genes involved in Transport of vitamins, nucleosides, and related molecules |
| 0.0 | 1.0 | REACTOME TIE2 SIGNALING | Genes involved in Tie2 Signaling |
| 0.0 | 1.4 | REACTOME EXTRACELLULAR MATRIX ORGANIZATION | Genes involved in Extracellular matrix organization |
| 0.0 | 1.4 | REACTOME ABC FAMILY PROTEINS MEDIATED TRANSPORT | Genes involved in ABC-family proteins mediated transport |
| 0.0 | 0.8 | REACTOME AMINE DERIVED HORMONES | Genes involved in Amine-derived hormones |
| 0.0 | 1.1 | REACTOME EGFR DOWNREGULATION | Genes involved in EGFR downregulation |
| 0.0 | 0.5 | REACTOME INTEGRIN ALPHAIIB BETA3 SIGNALING | Genes involved in Integrin alphaIIb beta3 signaling |
| 0.0 | 0.5 | REACTOME BIOSYNTHESIS OF THE N GLYCAN PRECURSOR DOLICHOL LIPID LINKED OLIGOSACCHARIDE LLO AND TRANSFER TO A NASCENT PROTEIN | Genes involved in Biosynthesis of the N-glycan precursor (dolichol lipid-linked oligosaccharide, LLO) and transfer to a nascent protein |
| 0.0 | 0.5 | REACTOME CELL SURFACE INTERACTIONS AT THE VASCULAR WALL | Genes involved in Cell surface interactions at the vascular wall |
| 0.0 | 0.7 | REACTOME HIGHLY CALCIUM PERMEABLE POSTSYNAPTIC NICOTINIC ACETYLCHOLINE RECEPTORS | Genes involved in Highly calcium permeable postsynaptic nicotinic acetylcholine receptors |
| 0.0 | 0.6 | REACTOME TRAF3 DEPENDENT IRF ACTIVATION PATHWAY | Genes involved in TRAF3-dependent IRF activation pathway |
| 0.0 | 0.6 | REACTOME G ALPHA Z SIGNALLING EVENTS | Genes involved in G alpha (z) signalling events |
| 0.0 | 1.0 | REACTOME PTM GAMMA CARBOXYLATION HYPUSINE FORMATION AND ARYLSULFATASE ACTIVATION | Genes involved in PTM: gamma carboxylation, hypusine formation and arylsulfatase activation |
| 0.0 | 0.3 | REACTOME RECRUITMENT OF NUMA TO MITOTIC CENTROSOMES | Genes involved in Recruitment of NuMA to mitotic centrosomes |
| 0.0 | 0.6 | REACTOME ACTIVATED TAK1 MEDIATES P38 MAPK ACTIVATION | Genes involved in activated TAK1 mediates p38 MAPK activation |
| 0.0 | 0.9 | REACTOME HS GAG BIOSYNTHESIS | Genes involved in HS-GAG biosynthesis |
| 0.0 | 0.5 | REACTOME INHIBITION OF VOLTAGE GATED CA2 CHANNELS VIA GBETA GAMMA SUBUNITS | Genes involved in Inhibition of voltage gated Ca2+ channels via Gbeta/gamma subunits |
| 0.0 | 0.5 | REACTOME CRMPS IN SEMA3A SIGNALING | Genes involved in CRMPs in Sema3A signaling |
| 0.0 | 0.3 | REACTOME CHONDROITIN SULFATE DERMATAN SULFATE METABOLISM | Genes involved in Chondroitin sulfate/dermatan sulfate metabolism |
| 0.0 | 0.2 | REACTOME PECAM1 INTERACTIONS | Genes involved in PECAM1 interactions |
| 0.0 | 0.3 | REACTOME MTORC1 MEDIATED SIGNALLING | Genes involved in mTORC1-mediated signalling |
| 0.0 | 1.5 | REACTOME OLFACTORY SIGNALING PATHWAY | Genes involved in Olfactory Signaling Pathway |
| 0.0 | 1.3 | REACTOME INTERFERON GAMMA SIGNALING | Genes involved in Interferon gamma signaling |
| 0.0 | 1.0 | REACTOME G ALPHA I SIGNALLING EVENTS | Genes involved in G alpha (i) signalling events |