Project
GNF SymAtlas + NCI-60 cancer cell lines, human (Su, 2004; Ross, 2000)
Navigation
Downloads
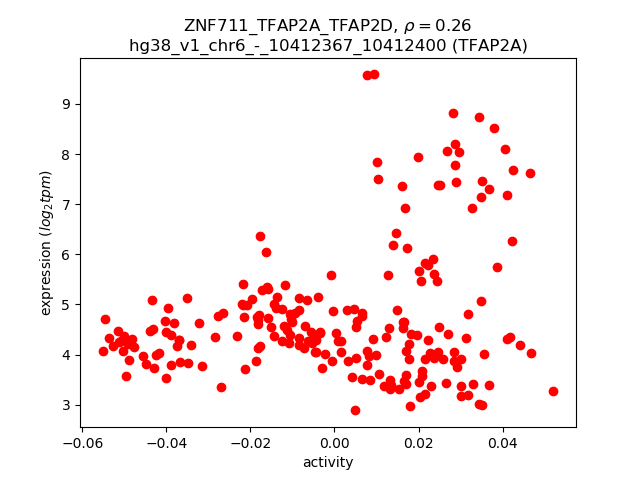
Results for ZNF711_TFAP2A_TFAP2D
Z-value: 3.63
Motif logo
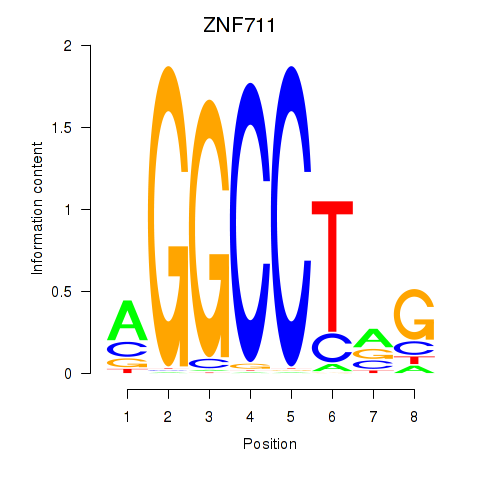
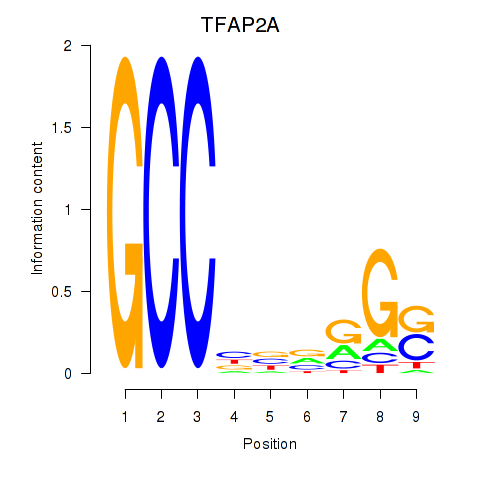
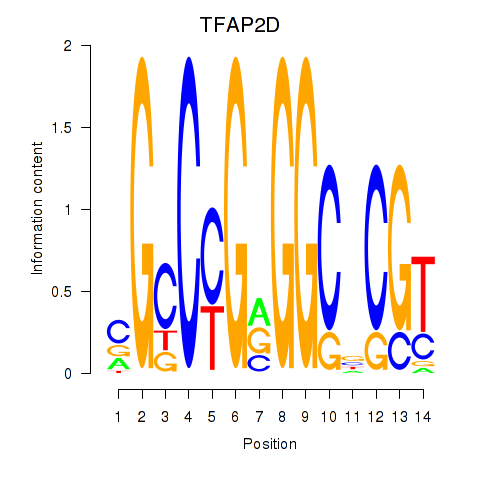
Transcription factors associated with ZNF711_TFAP2A_TFAP2D
| Gene Symbol | Gene ID | Gene Info |
|---|---|---|
|
ZNF711
|
ENSG00000147180.17 | ZNF711 |
|
TFAP2A
|
ENSG00000137203.15 | TFAP2A |
|
TFAP2D
|
ENSG00000008197.5 | TFAP2D |
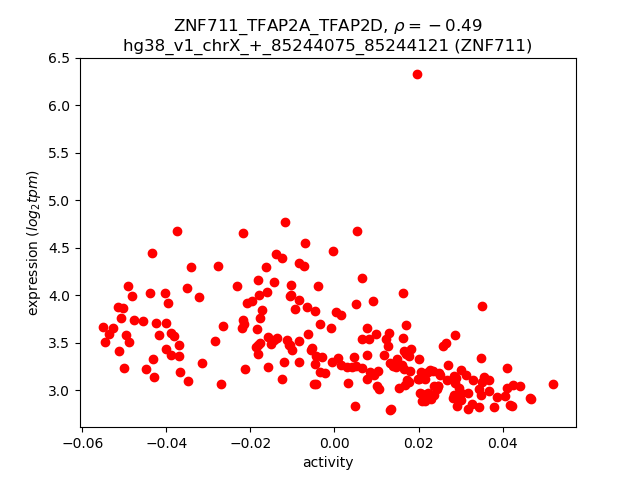
Activity-expression correlation:
| Gene | Promoter | Pearson corr. coef. | P-value | Plot |
|---|---|---|---|---|
| ZNF711 | hg38_v1_chrX_+_85244075_85244121, hg38_v1_chrX_+_85244032_85244073, hg38_v1_chrX_+_85243983_85243997 | -0.49 | 1.5e-14 | Click! |
| TFAP2A | hg38_v1_chr6_-_10412367_10412400, hg38_v1_chr6_-_10415043_10415109 | 0.26 | 1.0e-04 | Click! |
Activity profile of ZNF711_TFAP2A_TFAP2D motif
Sorted Z-values of ZNF711_TFAP2A_TFAP2D motif
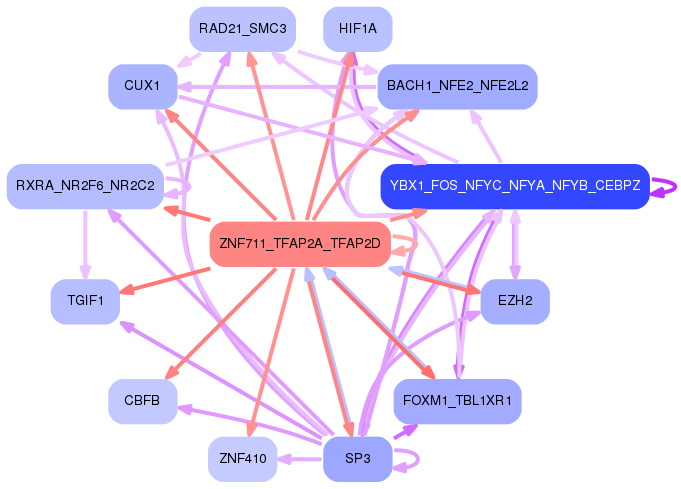
Network of associatons between targets according to the STRING database.

First level regulatory network of ZNF711_TFAP2A_TFAP2D
Gene Ontology Analysis
Gene overrepresentation in biological process category:
| Log-likelihood per target | Total log-likelihood | Term | Description |
|---|---|---|---|
| 63.5 | 254.0 | GO:1903755 | regulation of SUMO transferase activity(GO:1903182) positive regulation of SUMO transferase activity(GO:1903755) |
| 62.6 | 187.7 | GO:1905000 | regulation of membrane repolarization during atrial cardiac muscle cell action potential(GO:1905000) |
| 59.4 | 178.3 | GO:0005999 | xylulose biosynthetic process(GO:0005999) |
| 55.3 | 276.6 | GO:0033387 | putrescine biosynthetic process from ornithine(GO:0033387) |
| 46.9 | 46.9 | GO:2000819 | regulation of nucleotide-excision repair(GO:2000819) |
| 43.0 | 171.8 | GO:0016333 | morphogenesis of follicular epithelium(GO:0016333) establishment or maintenance of polarity of follicular epithelium(GO:0016334) establishment of planar polarity of follicular epithelium(GO:0042247) |
| 40.9 | 122.8 | GO:0090669 | telomerase RNA stabilization(GO:0090669) |
| 40.5 | 161.9 | GO:1904154 | positive regulation of retrograde protein transport, ER to cytosol(GO:1904154) |
| 39.0 | 116.9 | GO:0046081 | dUTP metabolic process(GO:0046080) dUTP catabolic process(GO:0046081) |
| 36.9 | 36.9 | GO:0021896 | forebrain astrocyte differentiation(GO:0021896) forebrain astrocyte development(GO:0021897) |
| 36.0 | 108.1 | GO:0006097 | glyoxylate cycle(GO:0006097) |
| 35.6 | 106.9 | GO:2000276 | negative regulation of oxidative phosphorylation uncoupler activity(GO:2000276) |
| 35.5 | 106.4 | GO:0090149 | mitochondrial membrane fission(GO:0090149) |
| 35.2 | 105.6 | GO:0006226 | dUMP biosynthetic process(GO:0006226) |
| 34.9 | 174.7 | GO:0044111 | development involved in symbiotic interaction(GO:0044111) |
| 33.6 | 67.3 | GO:0019322 | pentose biosynthetic process(GO:0019322) |
| 33.6 | 100.9 | GO:1903976 | negative regulation of glial cell migration(GO:1903976) |
| 33.5 | 100.4 | GO:1902822 | regulation of late endosome to lysosome transport(GO:1902822) |
| 33.1 | 198.6 | GO:0009212 | dTTP biosynthetic process(GO:0006235) pyrimidine deoxyribonucleoside triphosphate biosynthetic process(GO:0009212) |
| 32.7 | 196.5 | GO:2000254 | regulation of male germ cell proliferation(GO:2000254) |
| 32.6 | 130.4 | GO:1904045 | cellular response to aldosterone(GO:1904045) |
| 32.5 | 130.0 | GO:0046035 | CMP salvage(GO:0006238) CMP biosynthetic process(GO:0009224) CMP metabolic process(GO:0046035) |
| 32.2 | 96.6 | GO:1903644 | regulation of chaperone-mediated protein folding(GO:1903644) |
| 32.0 | 96.0 | GO:0070476 | RNA (guanine-N7)-methylation(GO:0036265) rRNA (guanine-N7)-methylation(GO:0070476) |
| 31.8 | 95.4 | GO:1901301 | regulation of cargo loading into COPII-coated vesicle(GO:1901301) |
| 31.6 | 94.8 | GO:0001732 | formation of cytoplasmic translation initiation complex(GO:0001732) |
| 31.5 | 94.6 | GO:1903778 | protein localization to vacuolar membrane(GO:1903778) |
| 31.0 | 93.1 | GO:0060623 | regulation of chromosome condensation(GO:0060623) |
| 30.6 | 122.3 | GO:1903788 | mycotoxin catabolic process(GO:0043387) aflatoxin catabolic process(GO:0046223) organic heteropentacyclic compound catabolic process(GO:1901377) regulation of glutathione biosynthetic process(GO:1903786) positive regulation of glutathione biosynthetic process(GO:1903788) |
| 30.4 | 121.8 | GO:1903609 | negative regulation of peptidyl-tyrosine autophosphorylation(GO:1900085) negative regulation of inward rectifier potassium channel activity(GO:1903609) |
| 30.3 | 91.0 | GO:0006842 | tricarboxylic acid transport(GO:0006842) citrate transport(GO:0015746) |
| 30.2 | 120.8 | GO:0000961 | negative regulation of mitochondrial RNA catabolic process(GO:0000961) |
| 29.6 | 88.8 | GO:1902524 | positive regulation of protein K48-linked ubiquitination(GO:1902524) |
| 29.5 | 117.8 | GO:0033634 | positive regulation of cell-cell adhesion mediated by integrin(GO:0033634) |
| 29.4 | 88.2 | GO:0016344 | meiotic chromosome movement towards spindle pole(GO:0016344) |
| 29.1 | 116.5 | GO:0055011 | atrial cardiac muscle cell differentiation(GO:0055011) atrial cardiac muscle cell development(GO:0055014) |
| 28.4 | 113.5 | GO:0009440 | cyanate metabolic process(GO:0009439) cyanate catabolic process(GO:0009440) |
| 28.4 | 226.9 | GO:0036444 | calcium ion transmembrane import into mitochondrion(GO:0036444) |
| 27.4 | 82.2 | GO:0046452 | dihydrofolate metabolic process(GO:0046452) |
| 27.2 | 108.9 | GO:1901873 | regulation of post-translational protein modification(GO:1901873) |
| 26.6 | 79.7 | GO:0036333 | hepatocyte homeostasis(GO:0036333) response to tetrachloromethane(GO:1904772) |
| 26.2 | 157.3 | GO:0002424 | T cell mediated immune response to tumor cell(GO:0002424) regulation of T cell mediated immune response to tumor cell(GO:0002840) |
| 26.1 | 182.5 | GO:0046726 | positive regulation by virus of viral protein levels in host cell(GO:0046726) |
| 26.0 | 415.9 | GO:0043248 | proteasome assembly(GO:0043248) |
| 26.0 | 52.0 | GO:0014038 | regulation of Schwann cell differentiation(GO:0014038) |
| 26.0 | 155.7 | GO:0042997 | negative regulation of Golgi to plasma membrane protein transport(GO:0042997) |
| 25.9 | 51.8 | GO:0046086 | adenosine biosynthetic process(GO:0046086) |
| 25.9 | 77.6 | GO:0097069 | response to human chorionic gonadotropin(GO:0044752) cellular response to thyroxine stimulus(GO:0097069) cellular response to L-phenylalanine derivative(GO:1904387) |
| 25.2 | 25.2 | GO:0010040 | response to iron(II) ion(GO:0010040) |
| 25.2 | 352.5 | GO:1904871 | regulation of protein localization to Cajal body(GO:1904869) positive regulation of protein localization to Cajal body(GO:1904871) |
| 24.8 | 222.9 | GO:0006265 | DNA topological change(GO:0006265) |
| 24.5 | 98.0 | GO:0090095 | metanephric cap development(GO:0072185) metanephric cap morphogenesis(GO:0072186) metanephric cap mesenchymal cell proliferation involved in metanephros development(GO:0090094) regulation of metanephric cap mesenchymal cell proliferation(GO:0090095) positive regulation of metanephric cap mesenchymal cell proliferation(GO:0090096) |
| 24.5 | 48.9 | GO:1903595 | positive regulation of histamine secretion by mast cell(GO:1903595) |
| 24.3 | 121.7 | GO:1902766 | skeletal muscle satellite cell migration(GO:1902766) |
| 24.3 | 72.8 | GO:0009786 | regulation of asymmetric cell division(GO:0009786) |
| 24.2 | 120.8 | GO:0071033 | nuclear retention of pre-mRNA at the site of transcription(GO:0071033) |
| 24.1 | 192.6 | GO:0032077 | positive regulation of deoxyribonuclease activity(GO:0032077) |
| 24.0 | 120.0 | GO:1903588 | negative regulation of blood vessel endothelial cell proliferation involved in sprouting angiogenesis(GO:1903588) |
| 23.7 | 260.7 | GO:0010756 | positive regulation of plasminogen activation(GO:0010756) |
| 23.5 | 93.9 | GO:0046833 | positive regulation of RNA export from nucleus(GO:0046833) |
| 23.3 | 140.0 | GO:0006021 | inositol biosynthetic process(GO:0006021) |
| 23.1 | 92.4 | GO:0000915 | assembly of actomyosin apparatus involved in cytokinesis(GO:0000912) actomyosin contractile ring assembly(GO:0000915) actomyosin contractile ring organization(GO:0044837) |
| 23.0 | 161.0 | GO:0032218 | riboflavin transport(GO:0032218) |
| 22.7 | 158.9 | GO:0001922 | B-1 B cell homeostasis(GO:0001922) |
| 22.5 | 135.0 | GO:0010266 | response to vitamin B1(GO:0010266) |
| 22.3 | 44.6 | GO:0006458 | 'de novo' protein folding(GO:0006458) |
| 22.3 | 89.2 | GO:2000435 | regulation of protein neddylation(GO:2000434) negative regulation of protein neddylation(GO:2000435) |
| 22.2 | 155.1 | GO:0006166 | purine ribonucleoside salvage(GO:0006166) |
| 22.1 | 199.0 | GO:0009263 | deoxyribonucleotide biosynthetic process(GO:0009263) |
| 21.9 | 153.0 | GO:0030421 | defecation(GO:0030421) |
| 21.8 | 65.5 | GO:0032071 | regulation of endodeoxyribonuclease activity(GO:0032071) |
| 21.8 | 87.1 | GO:0044210 | 'de novo' CTP biosynthetic process(GO:0044210) |
| 21.8 | 21.8 | GO:0018171 | peptidyl-cysteine oxidation(GO:0018171) |
| 21.8 | 21.8 | GO:0030043 | actin filament fragmentation(GO:0030043) |
| 21.6 | 86.5 | GO:0018106 | peptidyl-histidine phosphorylation(GO:0018106) |
| 21.5 | 21.5 | GO:0009085 | lysine biosynthetic process(GO:0009085) lysine biosynthetic process via aminoadipic acid(GO:0019878) |
| 21.4 | 42.8 | GO:0009051 | pentose-phosphate shunt, oxidative branch(GO:0009051) |
| 21.4 | 64.1 | GO:0051793 | medium-chain fatty acid catabolic process(GO:0051793) |
| 21.3 | 127.8 | GO:0075525 | viral translational termination-reinitiation(GO:0075525) |
| 21.3 | 85.2 | GO:0036496 | regulation of translational initiation by eIF2 alpha dephosphorylation(GO:0036496) |
| 21.1 | 147.8 | GO:0010792 | DNA double-strand break processing involved in repair via single-strand annealing(GO:0010792) |
| 21.0 | 188.8 | GO:0010993 | regulation of ubiquitin homeostasis(GO:0010993) free ubiquitin chain polymerization(GO:0010994) |
| 20.9 | 293.1 | GO:2000680 | rubidium ion transport(GO:0035826) regulation of rubidium ion transport(GO:2000680) |
| 20.9 | 41.8 | GO:0009180 | nucleoside diphosphate biosynthetic process(GO:0009133) purine nucleoside diphosphate biosynthetic process(GO:0009136) purine ribonucleoside diphosphate biosynthetic process(GO:0009180) ribonucleoside diphosphate biosynthetic process(GO:0009188) |
| 20.9 | 20.9 | GO:0043504 | mitochondrial DNA repair(GO:0043504) |
| 20.8 | 62.4 | GO:0075732 | viral penetration into host nucleus(GO:0075732) multi-organism nuclear import(GO:1902594) |
| 20.8 | 62.4 | GO:0008611 | ether lipid biosynthetic process(GO:0008611) glycerol ether biosynthetic process(GO:0046504) ether biosynthetic process(GO:1901503) |
| 20.7 | 123.9 | GO:0032487 | regulation of Rap protein signal transduction(GO:0032487) |
| 20.6 | 61.8 | GO:0006117 | acetaldehyde metabolic process(GO:0006117) |
| 20.6 | 102.8 | GO:0015862 | uridine transport(GO:0015862) |
| 20.5 | 82.0 | GO:0042776 | mitochondrial ATP synthesis coupled proton transport(GO:0042776) |
| 20.5 | 102.5 | GO:0003065 | positive regulation of heart rate by epinephrine(GO:0003065) negative regulation of vascular associated smooth muscle cell migration(GO:1904753) |
| 20.4 | 122.6 | GO:0002943 | tRNA dihydrouridine synthesis(GO:0002943) |
| 20.4 | 102.1 | GO:0071894 | histone H2B conserved C-terminal lysine ubiquitination(GO:0071894) |
| 20.3 | 60.8 | GO:0046292 | formaldehyde metabolic process(GO:0046292) |
| 20.2 | 80.7 | GO:0018242 | protein O-linked glycosylation via serine(GO:0018242) |
| 20.1 | 140.6 | GO:0046940 | nucleoside monophosphate phosphorylation(GO:0046940) |
| 20.0 | 60.0 | GO:0001923 | B-1 B cell differentiation(GO:0001923) |
| 19.9 | 79.5 | GO:0044571 | [2Fe-2S] cluster assembly(GO:0044571) |
| 19.8 | 39.5 | GO:0051754 | meiotic sister chromatid cohesion, centromeric(GO:0051754) |
| 19.7 | 118.2 | GO:0006398 | mRNA 3'-end processing by stem-loop binding and cleavage(GO:0006398) |
| 19.7 | 78.6 | GO:0045048 | protein insertion into ER membrane(GO:0045048) |
| 19.5 | 234.0 | GO:0033631 | cell-cell adhesion mediated by integrin(GO:0033631) |
| 19.5 | 97.5 | GO:0043137 | DNA replication, removal of RNA primer(GO:0043137) |
| 19.5 | 155.7 | GO:2000825 | positive regulation of androgen receptor activity(GO:2000825) |
| 19.5 | 116.7 | GO:0007079 | mitotic chromosome movement towards spindle pole(GO:0007079) |
| 19.4 | 97.0 | GO:0007406 | negative regulation of neuroblast proliferation(GO:0007406) |
| 19.4 | 96.8 | GO:0006620 | posttranslational protein targeting to membrane(GO:0006620) |
| 19.2 | 76.7 | GO:0043335 | protein unfolding(GO:0043335) |
| 19.1 | 57.3 | GO:1902498 | regulation of protein autoubiquitination(GO:1902498) |
| 19.0 | 38.0 | GO:1905167 | positive regulation of lysosomal protein catabolic process(GO:1905167) |
| 18.9 | 113.7 | GO:0022614 | membrane to membrane docking(GO:0022614) |
| 18.9 | 56.8 | GO:0030951 | establishment or maintenance of microtubule cytoskeleton polarity(GO:0030951) |
| 18.8 | 131.9 | GO:0090204 | protein localization to nuclear pore(GO:0090204) |
| 18.5 | 407.5 | GO:0015949 | nucleobase-containing small molecule interconversion(GO:0015949) |
| 18.5 | 406.5 | GO:0007084 | mitotic nuclear envelope reassembly(GO:0007084) |
| 18.4 | 18.4 | GO:0033152 | immunoglobulin V(D)J recombination(GO:0033152) |
| 18.3 | 18.3 | GO:0018283 | metal incorporation into metallo-sulfur cluster(GO:0018282) iron incorporation into metallo-sulfur cluster(GO:0018283) |
| 18.2 | 18.2 | GO:0006106 | fumarate metabolic process(GO:0006106) |
| 18.2 | 145.7 | GO:0032020 | ISG15-protein conjugation(GO:0032020) |
| 18.1 | 126.9 | GO:1903551 | regulation of extracellular exosome assembly(GO:1903551) |
| 18.0 | 36.0 | GO:0019065 | receptor-mediated endocytosis of virus by host cell(GO:0019065) endocytosis involved in viral entry into host cell(GO:0075509) |
| 18.0 | 144.0 | GO:0055129 | proline biosynthetic process(GO:0006561) L-proline biosynthetic process(GO:0055129) |
| 17.9 | 53.6 | GO:1990022 | RNA polymerase II complex import to nucleus(GO:0044376) RNA polymerase III complex localization to nucleus(GO:1990022) |
| 17.8 | 53.5 | GO:0007057 | spindle assembly involved in female meiosis I(GO:0007057) |
| 17.8 | 35.5 | GO:0018364 | peptidyl-glutamine methylation(GO:0018364) |
| 17.8 | 35.5 | GO:2000374 | regulation of oxygen metabolic process(GO:2000374) |
| 17.7 | 88.7 | GO:0071163 | DNA replication preinitiation complex assembly(GO:0071163) |
| 17.7 | 17.7 | GO:1904672 | regulation of somatic stem cell population maintenance(GO:1904672) |
| 17.7 | 53.0 | GO:0071038 | exonucleolytic trimming involved in rRNA processing(GO:0000459) exonucleolytic trimming to generate mature 3'-end of 5.8S rRNA from tricistronic rRNA transcript (SSU-rRNA, 5.8S rRNA, LSU-rRNA)(GO:0000467) U1 snRNA 3'-end processing(GO:0034473) U5 snRNA 3'-end processing(GO:0034476) nuclear polyadenylation-dependent tRNA catabolic process(GO:0071038) |
| 17.6 | 70.3 | GO:2000653 | regulation of genetic imprinting(GO:2000653) |
| 17.4 | 173.6 | GO:0002480 | antigen processing and presentation of exogenous peptide antigen via MHC class I, TAP-independent(GO:0002480) |
| 17.3 | 138.8 | GO:0006659 | phosphatidylserine biosynthetic process(GO:0006659) |
| 17.2 | 69.0 | GO:0006167 | AMP biosynthetic process(GO:0006167) |
| 17.2 | 103.4 | GO:0010032 | meiotic chromosome condensation(GO:0010032) |
| 17.1 | 68.5 | GO:0051490 | negative regulation of filopodium assembly(GO:0051490) |
| 17.1 | 85.3 | GO:0006177 | GMP biosynthetic process(GO:0006177) |
| 17.0 | 255.7 | GO:0030422 | production of siRNA involved in RNA interference(GO:0030422) |
| 17.0 | 119.0 | GO:0045047 | protein targeting to ER(GO:0045047) |
| 17.0 | 34.0 | GO:0034136 | negative regulation of toll-like receptor 2 signaling pathway(GO:0034136) negative regulation of toll-like receptor 4 signaling pathway(GO:0034144) |
| 17.0 | 67.9 | GO:0048205 | COPI-coated vesicle budding(GO:0035964) Golgi transport vesicle coating(GO:0048200) COPI coating of Golgi vesicle(GO:0048205) |
| 17.0 | 84.9 | GO:1902626 | assembly of large subunit precursor of preribosome(GO:1902626) |
| 16.9 | 50.6 | GO:0072526 | pyridine-containing compound catabolic process(GO:0072526) |
| 16.9 | 50.6 | GO:0002184 | cytoplasmic translational termination(GO:0002184) |
| 16.8 | 168.5 | GO:0043353 | enucleate erythrocyte differentiation(GO:0043353) |
| 16.8 | 50.5 | GO:0031990 | mRNA export from nucleus in response to heat stress(GO:0031990) |
| 16.8 | 50.5 | GO:0006059 | hexitol metabolic process(GO:0006059) |
| 16.8 | 218.0 | GO:0006268 | DNA unwinding involved in DNA replication(GO:0006268) |
| 16.8 | 67.0 | GO:0032262 | pyrimidine ribonucleotide salvage(GO:0010138) pyrimidine nucleotide salvage(GO:0032262) UMP salvage(GO:0044206) |
| 16.7 | 50.1 | GO:0015822 | ornithine transport(GO:0015822) L-ornithine transmembrane transport(GO:1903352) |
| 16.7 | 133.3 | GO:0046984 | regulation of hemoglobin biosynthetic process(GO:0046984) |
| 16.7 | 50.0 | GO:0070901 | mitochondrial tRNA methylation(GO:0070901) |
| 16.7 | 50.0 | GO:0071072 | negative regulation of phospholipid biosynthetic process(GO:0071072) |
| 16.4 | 65.5 | GO:0046946 | hydroxylysine metabolic process(GO:0046946) hydroxylysine biosynthetic process(GO:0046947) |
| 16.4 | 1471.7 | GO:0002479 | antigen processing and presentation of exogenous peptide antigen via MHC class I, TAP-dependent(GO:0002479) |
| 16.2 | 16.2 | GO:0043465 | fermentation(GO:0006113) regulation of fermentation(GO:0043465) |
| 16.2 | 16.2 | GO:1903911 | positive regulation of receptor clustering(GO:1903911) |
| 16.1 | 112.9 | GO:2000483 | negative regulation of interleukin-8 secretion(GO:2000483) |
| 16.0 | 224.1 | GO:0070934 | CRD-mediated mRNA stabilization(GO:0070934) |
| 16.0 | 32.0 | GO:0046166 | glyceraldehyde-3-phosphate biosynthetic process(GO:0046166) |
| 16.0 | 95.9 | GO:0019060 | intracellular transport of viral protein in host cell(GO:0019060) symbiont intracellular protein transport in host(GO:0030581) intracellular protein transport in other organism involved in symbiotic interaction(GO:0051708) |
| 16.0 | 47.9 | GO:1903382 | neuron intrinsic apoptotic signaling pathway in response to endoplasmic reticulum stress(GO:0036483) regulation of endoplasmic reticulum stress-induced neuron intrinsic apoptotic signaling pathway(GO:1903381) negative regulation of endoplasmic reticulum stress-induced neuron intrinsic apoptotic signaling pathway(GO:1903382) |
| 15.8 | 15.8 | GO:0036510 | trimming of terminal mannose on C branch(GO:0036510) |
| 15.8 | 15.8 | GO:1902956 | regulation of mitochondrial electron transport, NADH to ubiquinone(GO:1902956) negative regulation of mitochondrial electron transport, NADH to ubiquinone(GO:1902957) |
| 15.7 | 47.0 | GO:1902905 | positive regulation of fibril organization(GO:1902905) |
| 15.7 | 15.7 | GO:1901970 | positive regulation of mitotic metaphase/anaphase transition(GO:0045842) positive regulation of mitotic sister chromatid separation(GO:1901970) positive regulation of metaphase/anaphase transition of cell cycle(GO:1902101) |
| 15.6 | 31.2 | GO:0015853 | adenine transport(GO:0015853) |
| 15.6 | 62.4 | GO:0090579 | transcriptional activation by promoter-enhancer looping(GO:0071733) gene looping(GO:0090202) dsDNA loop formation(GO:0090579) |
| 15.6 | 62.2 | GO:1901165 | positive regulation of trophoblast cell migration(GO:1901165) |
| 15.5 | 46.6 | GO:0014810 | positive regulation of skeletal muscle contraction by regulation of release of sequestered calcium ion(GO:0014810) |
| 15.5 | 46.6 | GO:0046586 | regulation of calcium-dependent cell-cell adhesion(GO:0046586) |
| 15.4 | 15.4 | GO:1903826 | arginine transmembrane transport(GO:1903826) |
| 15.4 | 15.4 | GO:0050717 | positive regulation of interleukin-1 alpha secretion(GO:0050717) |
| 15.3 | 153.2 | GO:0046826 | negative regulation of protein export from nucleus(GO:0046826) |
| 15.3 | 30.5 | GO:0034402 | recruitment of 3'-end processing factors to RNA polymerase II holoenzyme complex(GO:0034402) |
| 15.2 | 152.3 | GO:0000463 | maturation of LSU-rRNA from tricistronic rRNA transcript (SSU-rRNA, 5.8S rRNA, LSU-rRNA)(GO:0000463) |
| 15.2 | 60.8 | GO:0030047 | actin modification(GO:0030047) |
| 15.2 | 15.2 | GO:1903721 | regulation of I-kappaB phosphorylation(GO:1903719) positive regulation of I-kappaB phosphorylation(GO:1903721) |
| 15.1 | 60.3 | GO:0010796 | regulation of multivesicular body size(GO:0010796) |
| 14.9 | 134.4 | GO:0071578 | zinc II ion transmembrane import(GO:0071578) |
| 14.9 | 44.8 | GO:2000616 | negative regulation of histone H3-K9 acetylation(GO:2000616) |
| 14.9 | 59.7 | GO:0000379 | tRNA-type intron splice site recognition and cleavage(GO:0000379) |
| 14.9 | 134.2 | GO:0006335 | DNA replication-dependent nucleosome assembly(GO:0006335) DNA replication-dependent nucleosome organization(GO:0034723) |
| 14.8 | 44.5 | GO:0009438 | methylglyoxal metabolic process(GO:0009438) |
| 14.7 | 58.9 | GO:0070982 | L-asparagine biosynthetic process(GO:0070981) L-asparagine metabolic process(GO:0070982) |
| 14.7 | 132.3 | GO:0038110 | interleukin-2-mediated signaling pathway(GO:0038110) |
| 14.7 | 44.0 | GO:0003420 | regulation of growth plate cartilage chondrocyte proliferation(GO:0003420) |
| 14.6 | 102.4 | GO:0030948 | negative regulation of vascular endothelial growth factor receptor signaling pathway(GO:0030948) |
| 14.6 | 29.3 | GO:1901420 | negative regulation of response to alcohol(GO:1901420) |
| 14.6 | 43.8 | GO:0018160 | peptidyl-pyrromethane cofactor linkage(GO:0018160) |
| 14.5 | 87.2 | GO:0032511 | late endosome to vacuole transport via multivesicular body sorting pathway(GO:0032511) |
| 14.5 | 101.7 | GO:0006621 | protein retention in ER lumen(GO:0006621) maintenance of protein localization in endoplasmic reticulum(GO:0035437) |
| 14.5 | 29.0 | GO:1903527 | positive regulation of membrane tubulation(GO:1903527) |
| 14.5 | 14.5 | GO:0015780 | nucleotide-sugar transport(GO:0015780) pyrimidine nucleotide-sugar transport(GO:0015781) |
| 14.4 | 186.9 | GO:1900029 | positive regulation of ruffle assembly(GO:1900029) |
| 14.4 | 28.7 | GO:0044375 | regulation of peroxisome size(GO:0044375) |
| 14.3 | 85.7 | GO:0097052 | L-kynurenine metabolic process(GO:0097052) |
| 14.3 | 171.3 | GO:0019388 | galactose catabolic process(GO:0019388) |
| 14.3 | 57.1 | GO:0046900 | tetrahydrofolylpolyglutamate metabolic process(GO:0046900) |
| 14.1 | 183.9 | GO:1904667 | negative regulation of ubiquitin protein ligase activity(GO:1904667) |
| 14.1 | 84.8 | GO:1904688 | regulation of cap-independent translational initiation(GO:1903677) positive regulation of cap-independent translational initiation(GO:1903679) regulation of cytoplasmic translational initiation(GO:1904688) positive regulation of cytoplasmic translational initiation(GO:1904690) |
| 14.1 | 42.4 | GO:0052572 | response to immune response of other organism involved in symbiotic interaction(GO:0052564) response to host immune response(GO:0052572) |
| 14.1 | 14.1 | GO:0061004 | pattern specification involved in kidney development(GO:0061004) renal system pattern specification(GO:0072048) |
| 14.1 | 84.4 | GO:0016321 | female meiosis chromosome segregation(GO:0016321) |
| 14.1 | 70.3 | GO:0001306 | age-dependent response to oxidative stress(GO:0001306) age-dependent response to reactive oxygen species(GO:0001315) regulation of systemic arterial blood pressure by acetylcholine(GO:0003068) vasodilation by acetylcholine involved in regulation of systemic arterial blood pressure(GO:0003069) regulation of systemic arterial blood pressure by neurotransmitter(GO:0003070) age-dependent general metabolic decline(GO:0007571) |
| 14.1 | 84.3 | GO:2000561 | CD4-positive, alpha-beta T cell proliferation(GO:0035739) regulation of CD4-positive, alpha-beta T cell proliferation(GO:2000561) |
| 14.0 | 14.0 | GO:0090170 | regulation of Golgi inheritance(GO:0090170) |
| 14.0 | 336.3 | GO:0042769 | DNA damage response, detection of DNA damage(GO:0042769) |
| 14.0 | 84.0 | GO:0033314 | mitotic DNA replication checkpoint(GO:0033314) |
| 13.8 | 82.9 | GO:1903332 | regulation of protein folding(GO:1903332) |
| 13.8 | 55.3 | GO:0000973 | posttranscriptional tethering of RNA polymerase II gene DNA at nuclear periphery(GO:0000973) |
| 13.8 | 27.6 | GO:0007113 | endomitotic cell cycle(GO:0007113) |
| 13.8 | 1048.9 | GO:0070125 | mitochondrial translational elongation(GO:0070125) |
| 13.8 | 82.8 | GO:0006104 | succinyl-CoA metabolic process(GO:0006104) |
| 13.8 | 55.1 | GO:0035407 | histone H3-T11 phosphorylation(GO:0035407) |
| 13.8 | 82.6 | GO:2000587 | negative regulation of platelet-derived growth factor receptor-beta signaling pathway(GO:2000587) |
| 13.8 | 137.5 | GO:0061732 | mitochondrial acetyl-CoA biosynthetic process from pyruvate(GO:0061732) |
| 13.7 | 13.7 | GO:0097201 | negative regulation of transcription from RNA polymerase II promoter in response to stress(GO:0097201) |
| 13.7 | 68.5 | GO:0019747 | regulation of isoprenoid metabolic process(GO:0019747) |
| 13.6 | 13.6 | GO:0071888 | macrophage apoptotic process(GO:0071888) |
| 13.6 | 27.2 | GO:0042822 | pyridoxal phosphate metabolic process(GO:0042822) pyridoxal phosphate biosynthetic process(GO:0042823) |
| 13.6 | 68.0 | GO:0090069 | regulation of ribosome biogenesis(GO:0090069) |
| 13.6 | 81.4 | GO:0000727 | double-strand break repair via break-induced replication(GO:0000727) |
| 13.6 | 40.7 | GO:0033512 | L-lysine catabolic process to acetyl-CoA via saccharopine(GO:0033512) |
| 13.6 | 40.7 | GO:1902544 | regulation of DNA N-glycosylase activity(GO:1902544) |
| 13.5 | 13.5 | GO:2000850 | negative regulation of steroid hormone secretion(GO:2000832) negative regulation of corticosteroid hormone secretion(GO:2000847) negative regulation of glucocorticoid secretion(GO:2000850) |
| 13.5 | 13.5 | GO:1900060 | negative regulation of sphingolipid biosynthetic process(GO:0090155) negative regulation of ceramide biosynthetic process(GO:1900060) |
| 13.5 | 53.8 | GO:0035880 | embryonic nail plate morphogenesis(GO:0035880) |
| 13.5 | 40.4 | GO:0035732 | nitric oxide storage(GO:0035732) |
| 13.4 | 40.3 | GO:1902460 | regulation of mesenchymal stem cell proliferation(GO:1902460) positive regulation of mesenchymal stem cell proliferation(GO:1902462) |
| 13.4 | 53.6 | GO:0009838 | abscission(GO:0009838) |
| 13.3 | 13.3 | GO:0090611 | ubiquitin-independent protein catabolic process via the multivesicular body sorting pathway(GO:0090611) |
| 13.3 | 80.0 | GO:0006616 | SRP-dependent cotranslational protein targeting to membrane, translocation(GO:0006616) |
| 13.3 | 13.3 | GO:0033206 | meiotic cytokinesis(GO:0033206) |
| 13.3 | 39.8 | GO:0035026 | leading edge cell differentiation(GO:0035026) |
| 13.2 | 39.7 | GO:0045337 | geranyl diphosphate metabolic process(GO:0033383) geranyl diphosphate biosynthetic process(GO:0033384) farnesyl diphosphate biosynthetic process(GO:0045337) farnesyl diphosphate metabolic process(GO:0045338) |
| 13.2 | 52.9 | GO:0006344 | maintenance of chromatin silencing(GO:0006344) |
| 13.2 | 552.6 | GO:0006370 | 7-methylguanosine mRNA capping(GO:0006370) |
| 13.0 | 13.0 | GO:0036260 | 7-methylguanosine RNA capping(GO:0009452) RNA capping(GO:0036260) |
| 13.0 | 39.0 | GO:0006120 | mitochondrial electron transport, NADH to ubiquinone(GO:0006120) |
| 12.9 | 64.6 | GO:0001971 | negative regulation of activation of membrane attack complex(GO:0001971) |
| 12.9 | 12.9 | GO:0033182 | regulation of histone ubiquitination(GO:0033182) |
| 12.8 | 25.6 | GO:0072019 | proximal convoluted tubule development(GO:0072019) metanephric proximal convoluted tubule development(GO:0072229) |
| 12.8 | 25.6 | GO:0019087 | transformation of host cell by virus(GO:0019087) |
| 12.8 | 38.3 | GO:0071963 | establishment or maintenance of cell polarity regulating cell shape(GO:0071963) |
| 12.8 | 12.8 | GO:1900110 | negative regulation of histone H3-K9 dimethylation(GO:1900110) |
| 12.7 | 38.2 | GO:0097698 | telomere maintenance via base-excision repair(GO:0097698) |
| 12.7 | 25.5 | GO:0000967 | endonucleolytic cleavage to generate mature 5'-end of SSU-rRNA from (SSU-rRNA, 5.8S rRNA, LSU-rRNA)(GO:0000472) rRNA 5'-end processing(GO:0000967) ncRNA 5'-end processing(GO:0034471) |
| 12.7 | 50.8 | GO:1904924 | negative regulation of mitophagy in response to mitochondrial depolarization(GO:1904924) |
| 12.7 | 12.7 | GO:0070433 | negative regulation of nucleotide-binding oligomerization domain containing signaling pathway(GO:0070425) negative regulation of nucleotide-binding oligomerization domain containing 2 signaling pathway(GO:0070433) |
| 12.7 | 88.6 | GO:0003433 | chondrocyte development involved in endochondral bone morphogenesis(GO:0003433) |
| 12.6 | 50.5 | GO:0061643 | chemorepulsion of dopaminergic neuron axon(GO:0036518) chemorepulsion of axon(GO:0061643) |
| 12.6 | 37.7 | GO:1901421 | positive regulation of response to alcohol(GO:1901421) |
| 12.6 | 75.3 | GO:0015680 | intracellular copper ion transport(GO:0015680) |
| 12.5 | 12.5 | GO:0051177 | meiotic sister chromatid cohesion(GO:0051177) |
| 12.5 | 24.9 | GO:0072665 | protein localization to vacuole(GO:0072665) |
| 12.5 | 49.8 | GO:0019418 | sulfide oxidation(GO:0019418) sulfide oxidation, using sulfide:quinone oxidoreductase(GO:0070221) |
| 12.4 | 99.4 | GO:0034134 | toll-like receptor 2 signaling pathway(GO:0034134) |
| 12.4 | 111.7 | GO:0018401 | peptidyl-proline hydroxylation to 4-hydroxy-L-proline(GO:0018401) |
| 12.4 | 494.5 | GO:0070979 | protein K11-linked ubiquitination(GO:0070979) |
| 12.3 | 221.9 | GO:0048026 | positive regulation of mRNA splicing, via spliceosome(GO:0048026) |
| 12.3 | 86.2 | GO:0033183 | negative regulation of histone ubiquitination(GO:0033183) negative regulation of protein K63-linked ubiquitination(GO:1900045) regulation of histone H2A K63-linked ubiquitination(GO:1901314) negative regulation of histone H2A K63-linked ubiquitination(GO:1901315) negative regulation of protein polyubiquitination(GO:1902915) |
| 12.3 | 196.9 | GO:0006851 | mitochondrial calcium ion transport(GO:0006851) |
| 12.3 | 86.1 | GO:0035879 | plasma membrane lactate transport(GO:0035879) |
| 12.2 | 36.5 | GO:0097086 | amniotic stem cell differentiation(GO:0097086) negative regulation of dense core granule biogenesis(GO:2000706) negative regulation of mesenchymal stem cell differentiation(GO:2000740) regulation of amniotic stem cell differentiation(GO:2000797) negative regulation of amniotic stem cell differentiation(GO:2000798) |
| 12.2 | 340.7 | GO:0070911 | global genome nucleotide-excision repair(GO:0070911) |
| 12.1 | 48.6 | GO:0060715 | syncytiotrophoblast cell differentiation involved in labyrinthine layer development(GO:0060715) |
| 12.1 | 242.7 | GO:0000028 | ribosomal small subunit assembly(GO:0000028) |
| 12.1 | 12.1 | GO:0097694 | establishment of RNA localization to telomere(GO:0097694) establishment of macromolecular complex localization to telomere(GO:0097695) |
| 12.1 | 133.0 | GO:0015939 | pantothenate metabolic process(GO:0015939) |
| 12.1 | 60.3 | GO:0031145 | anaphase-promoting complex-dependent catabolic process(GO:0031145) |
| 12.1 | 84.4 | GO:0060844 | arterial endothelial cell fate commitment(GO:0060844) blood vessel lumenization(GO:0072554) positive regulation of ephrin receptor signaling pathway(GO:1901189) positive regulation of canonical Wnt signaling pathway involved in cardiac muscle cell fate commitment(GO:1901297) positive regulation of canonical Wnt signaling pathway involved in heart development(GO:1905068) |
| 12.0 | 24.1 | GO:2000628 | regulation of miRNA metabolic process(GO:2000628) |
| 12.0 | 108.2 | GO:0006388 | tRNA splicing, via endonucleolytic cleavage and ligation(GO:0006388) |
| 12.0 | 36.1 | GO:0070973 | protein localization to endoplasmic reticulum exit site(GO:0070973) |
| 12.0 | 12.0 | GO:2000224 | regulation of testosterone biosynthetic process(GO:2000224) |
| 12.0 | 36.0 | GO:0043490 | malate-aspartate shuttle(GO:0043490) |
| 12.0 | 47.8 | GO:0015910 | peroxisomal long-chain fatty acid import(GO:0015910) |
| 11.9 | 35.8 | GO:0043461 | proton-transporting ATP synthase complex assembly(GO:0043461) proton-transporting ATP synthase complex biogenesis(GO:0070272) |
| 11.9 | 47.5 | GO:0070358 | actin polymerization-dependent cell motility(GO:0070358) |
| 11.9 | 47.5 | GO:2001247 | positive regulation of phosphatidylcholine biosynthetic process(GO:2001247) |
| 11.8 | 189.5 | GO:0034975 | protein folding in endoplasmic reticulum(GO:0034975) |
| 11.8 | 23.7 | GO:0006740 | NADPH regeneration(GO:0006740) |
| 11.8 | 35.5 | GO:0090158 | endoplasmic reticulum membrane organization(GO:0090158) |
| 11.7 | 387.6 | GO:0061641 | chromatin remodeling at centromere(GO:0031055) CENP-A containing nucleosome assembly(GO:0034080) CENP-A containing chromatin organization(GO:0061641) |
| 11.7 | 654.4 | GO:0045454 | cell redox homeostasis(GO:0045454) |
| 11.6 | 104.7 | GO:0043951 | negative regulation of cAMP-mediated signaling(GO:0043951) |
| 11.5 | 46.1 | GO:0042450 | arginine biosynthetic process via ornithine(GO:0042450) |
| 11.5 | 34.5 | GO:0030327 | prenylated protein catabolic process(GO:0030327) |
| 11.5 | 23.0 | GO:0071677 | positive regulation of mononuclear cell migration(GO:0071677) |
| 11.5 | 34.5 | GO:0006121 | mitochondrial electron transport, succinate to ubiquinone(GO:0006121) |
| 11.5 | 45.9 | GO:0072683 | T cell extravasation(GO:0072683) |
| 11.5 | 11.5 | GO:0002176 | male germ cell proliferation(GO:0002176) germ cell proliferation(GO:0036093) |
| 11.4 | 11.4 | GO:1901856 | negative regulation of cellular respiration(GO:1901856) |
| 11.4 | 34.3 | GO:0006391 | transcription initiation from mitochondrial promoter(GO:0006391) |
| 11.4 | 102.5 | GO:0000710 | meiotic mismatch repair(GO:0000710) |
| 11.3 | 22.6 | GO:0046075 | dTTP metabolic process(GO:0046075) |
| 11.3 | 67.5 | GO:1900223 | positive regulation of beta-amyloid clearance(GO:1900223) |
| 11.2 | 55.9 | GO:0045040 | protein import into mitochondrial outer membrane(GO:0045040) |
| 11.1 | 55.7 | GO:1900369 | regulation of RNA interference(GO:1900368) negative regulation of RNA interference(GO:1900369) |
| 11.1 | 89.1 | GO:0016129 | phytosteroid metabolic process(GO:0016128) phytosteroid biosynthetic process(GO:0016129) |
| 11.1 | 132.9 | GO:0006089 | lactate metabolic process(GO:0006089) |
| 11.1 | 442.7 | GO:0000387 | spliceosomal snRNP assembly(GO:0000387) |
| 11.0 | 11.0 | GO:0098902 | regulation of membrane depolarization during action potential(GO:0098902) |
| 10.9 | 21.9 | GO:0051088 | PMA-inducible membrane protein ectodomain proteolysis(GO:0051088) |
| 10.9 | 76.5 | GO:0015866 | ADP transport(GO:0015866) |
| 10.9 | 76.3 | GO:0010606 | positive regulation of cytoplasmic mRNA processing body assembly(GO:0010606) |
| 10.8 | 54.0 | GO:0097680 | double-strand break repair via classical nonhomologous end joining(GO:0097680) |
| 10.7 | 32.1 | GO:0031086 | nuclear-transcribed mRNA catabolic process, deadenylation-independent decay(GO:0031086) deadenylation-independent decapping of nuclear-transcribed mRNA(GO:0031087) |
| 10.7 | 74.8 | GO:0070537 | histone H2A K63-linked deubiquitination(GO:0070537) |
| 10.7 | 96.1 | GO:0051315 | attachment of mitotic spindle microtubules to kinetochore(GO:0051315) |
| 10.7 | 32.0 | GO:1902415 | regulation of mRNA binding(GO:1902415) |
| 10.6 | 31.8 | GO:0035752 | lysosomal lumen pH elevation(GO:0035752) |
| 10.5 | 231.7 | GO:0051639 | actin filament network formation(GO:0051639) |
| 10.5 | 31.5 | GO:0061445 | endocardial cell fate commitment(GO:0060957) endocardial cushion cell fate commitment(GO:0061445) |
| 10.5 | 41.9 | GO:0006049 | UDP-N-acetylglucosamine catabolic process(GO:0006049) |
| 10.5 | 73.4 | GO:0000389 | mRNA 3'-splice site recognition(GO:0000389) |
| 10.5 | 10.5 | GO:0060382 | regulation of DNA strand elongation(GO:0060382) |
| 10.4 | 135.5 | GO:2001032 | regulation of double-strand break repair via nonhomologous end joining(GO:2001032) |
| 10.3 | 82.7 | GO:0021817 | nucleokinesis involved in cell motility in cerebral cortex radial glia guided migration(GO:0021817) nuclear migration along microtubule(GO:0030473) |
| 10.3 | 93.0 | GO:0000414 | regulation of histone H3-K36 methylation(GO:0000414) |
| 10.3 | 20.7 | GO:0034501 | protein localization to kinetochore(GO:0034501) |
| 10.3 | 1298.8 | GO:0006613 | cotranslational protein targeting to membrane(GO:0006613) |
| 10.3 | 10.3 | GO:0061034 | olfactory bulb mitral cell layer development(GO:0061034) |
| 10.3 | 30.8 | GO:1900224 | positive regulation of nodal signaling pathway involved in determination of lateral mesoderm left/right asymmetry(GO:1900224) |
| 10.3 | 102.8 | GO:0006610 | ribosomal protein import into nucleus(GO:0006610) |
| 10.3 | 41.1 | GO:0030961 | peptidyl-arginine hydroxylation(GO:0030961) |
| 10.3 | 30.8 | GO:0090435 | protein localization to nuclear envelope(GO:0090435) |
| 10.2 | 30.7 | GO:0036493 | positive regulation of translation in response to endoplasmic reticulum stress(GO:0036493) |
| 10.2 | 30.7 | GO:0046543 | development of secondary female sexual characteristics(GO:0046543) |
| 10.2 | 10.2 | GO:0006447 | regulation of translational initiation by iron(GO:0006447) |
| 10.2 | 30.5 | GO:0036363 | transforming growth factor beta activation(GO:0036363) |
| 10.1 | 20.2 | GO:0034729 | histone H3-K79 methylation(GO:0034729) |
| 10.1 | 231.6 | GO:0043968 | histone H2A acetylation(GO:0043968) |
| 10.0 | 170.6 | GO:1902455 | negative regulation of stem cell population maintenance(GO:1902455) |
| 10.0 | 30.1 | GO:0070902 | mitochondrial tRNA pseudouridine synthesis(GO:0070902) |
| 10.0 | 40.1 | GO:0032600 | B cell receptor transport within lipid bilayer(GO:0032595) B cell receptor transport into membrane raft(GO:0032597) protein transport out of membrane raft(GO:0032599) chemokine receptor transport out of membrane raft(GO:0032600) negative regulation of transforming growth factor beta3 production(GO:0032913) chemokine receptor transport within lipid bilayer(GO:0033606) |
| 10.0 | 50.0 | GO:0080009 | mRNA methylation(GO:0080009) |
| 10.0 | 20.0 | GO:0048478 | replication fork protection(GO:0048478) |
| 10.0 | 19.9 | GO:1904378 | maintenance of unfolded protein(GO:0036506) maintenance of unfolded protein involved in ERAD pathway(GO:1904378) |
| 9.9 | 139.2 | GO:0000054 | ribosomal subunit export from nucleus(GO:0000054) ribosome localization(GO:0033750) establishment of ribosome localization(GO:0033753) |
| 9.9 | 49.7 | GO:0002439 | chronic inflammatory response to antigenic stimulus(GO:0002439) |
| 9.9 | 218.6 | GO:0050872 | white fat cell differentiation(GO:0050872) |
| 9.9 | 39.7 | GO:0000972 | transcription-dependent tethering of RNA polymerase II gene DNA at nuclear periphery(GO:0000972) |
| 9.9 | 79.3 | GO:0007068 | negative regulation of transcription during mitosis(GO:0007068) negative regulation of transcription from RNA polymerase II promoter during mitosis(GO:0007070) |
| 9.9 | 39.6 | GO:0042262 | DNA protection(GO:0042262) |
| 9.9 | 39.5 | GO:0099640 | axo-dendritic protein transport(GO:0099640) |
| 9.9 | 78.8 | GO:0007144 | female meiosis I(GO:0007144) |
| 9.8 | 245.3 | GO:0000185 | activation of MAPKKK activity(GO:0000185) |
| 9.8 | 29.4 | GO:2000767 | positive regulation of cytoplasmic translation(GO:2000767) |
| 9.8 | 9.8 | GO:0050653 | chondroitin sulfate proteoglycan biosynthetic process, polysaccharide chain biosynthetic process(GO:0050653) |
| 9.8 | 97.9 | GO:0046689 | response to mercury ion(GO:0046689) |
| 9.8 | 48.9 | GO:0061441 | renal artery morphogenesis(GO:0061441) |
| 9.7 | 117.0 | GO:0001522 | pseudouridine synthesis(GO:0001522) |
| 9.7 | 87.7 | GO:0086042 | cardiac muscle cell-cardiac muscle cell adhesion(GO:0086042) |
| 9.7 | 48.6 | GO:0070269 | pyroptosis(GO:0070269) |
| 9.7 | 19.4 | GO:2000048 | negative regulation of cell-cell adhesion mediated by cadherin(GO:2000048) |
| 9.7 | 155.3 | GO:0006596 | polyamine biosynthetic process(GO:0006596) |
| 9.7 | 281.0 | GO:0042347 | negative regulation of NF-kappaB import into nucleus(GO:0042347) |
| 9.7 | 58.1 | GO:0052405 | negative regulation by host of symbiont molecular function(GO:0052405) |
| 9.6 | 86.7 | GO:0090151 | establishment of protein localization to mitochondrial membrane(GO:0090151) |
| 9.6 | 76.9 | GO:0009249 | protein lipoylation(GO:0009249) |
| 9.6 | 57.5 | GO:1902031 | regulation of NADP metabolic process(GO:1902031) |
| 9.6 | 57.5 | GO:0070345 | negative regulation of fat cell proliferation(GO:0070345) |
| 9.6 | 66.9 | GO:0043615 | astrocyte cell migration(GO:0043615) |
| 9.5 | 95.4 | GO:1902857 | positive regulation of nonmotile primary cilium assembly(GO:1902857) |
| 9.5 | 57.3 | GO:0019511 | peptidyl-proline hydroxylation(GO:0019511) |
| 9.5 | 47.6 | GO:0072656 | maintenance of protein location in mitochondrion(GO:0072656) |
| 9.5 | 76.1 | GO:0072734 | response to staurosporine(GO:0072733) cellular response to staurosporine(GO:0072734) |
| 9.5 | 9.5 | GO:0060066 | oviduct development(GO:0060066) |
| 9.5 | 47.4 | GO:1903224 | regulation of endodermal cell differentiation(GO:1903224) |
| 9.5 | 18.9 | GO:1902044 | regulation of Fas signaling pathway(GO:1902044) |
| 9.4 | 47.2 | GO:0090336 | positive regulation of brown fat cell differentiation(GO:0090336) |
| 9.4 | 141.4 | GO:0060213 | regulation of nuclear-transcribed mRNA poly(A) tail shortening(GO:0060211) positive regulation of nuclear-transcribed mRNA poly(A) tail shortening(GO:0060213) |
| 9.4 | 46.9 | GO:0016074 | snoRNA metabolic process(GO:0016074) snoRNA processing(GO:0043144) |
| 9.4 | 37.5 | GO:0036114 | medium-chain fatty-acyl-CoA catabolic process(GO:0036114) long-chain fatty-acyl-CoA catabolic process(GO:0036116) palmitic acid metabolic process(GO:1900533) palmitic acid biosynthetic process(GO:1900535) |
| 9.4 | 84.4 | GO:0007023 | post-chaperonin tubulin folding pathway(GO:0007023) |
| 9.4 | 131.2 | GO:0042761 | fatty acid elongation(GO:0030497) very long-chain fatty acid biosynthetic process(GO:0042761) |
| 9.4 | 37.5 | GO:1902463 | protein localization to cell leading edge(GO:1902463) |
| 9.3 | 46.7 | GO:1901163 | trophoblast cell migration(GO:0061450) regulation of trophoblast cell migration(GO:1901163) |
| 9.3 | 37.3 | GO:1900041 | negative regulation of interleukin-2 secretion(GO:1900041) |
| 9.3 | 27.9 | GO:0071459 | protein localization to chromosome, centromeric region(GO:0071459) |
| 9.3 | 27.9 | GO:0030920 | N-terminal peptidyl-serine acetylation(GO:0017198) N-terminal peptidyl-glutamic acid acetylation(GO:0018002) peptidyl-serine acetylation(GO:0030920) |
| 9.2 | 212.0 | GO:0061157 | mRNA destabilization(GO:0061157) |
| 9.2 | 36.9 | GO:1902570 | protein localization to nucleolus(GO:1902570) |
| 9.2 | 18.4 | GO:0010940 | positive regulation of necrotic cell death(GO:0010940) |
| 9.2 | 119.4 | GO:0000715 | nucleotide-excision repair, DNA damage recognition(GO:0000715) |
| 9.2 | 18.3 | GO:2000412 | positive regulation of thymocyte migration(GO:2000412) |
| 9.1 | 36.5 | GO:0050689 | negative regulation of defense response to virus by host(GO:0050689) |
| 9.1 | 9.1 | GO:0071306 | cellular response to vitamin E(GO:0071306) |
| 9.1 | 18.3 | GO:0070309 | lens fiber cell morphogenesis(GO:0070309) |
| 9.1 | 81.8 | GO:0031936 | negative regulation of chromatin silencing(GO:0031936) |
| 9.1 | 54.4 | GO:0046654 | tetrahydrofolate biosynthetic process(GO:0046654) |
| 9.0 | 9.0 | GO:0010216 | maintenance of DNA methylation(GO:0010216) |
| 9.0 | 18.1 | GO:0016584 | nucleosome positioning(GO:0016584) |
| 9.0 | 108.1 | GO:0060712 | spongiotrophoblast layer development(GO:0060712) |
| 9.0 | 116.8 | GO:0001682 | tRNA 5'-leader removal(GO:0001682) |
| 9.0 | 143.5 | GO:0034356 | NAD biosynthesis via nicotinamide riboside salvage pathway(GO:0034356) |
| 9.0 | 251.1 | GO:0031581 | hemidesmosome assembly(GO:0031581) |
| 9.0 | 53.8 | GO:0008582 | regulation of synaptic growth at neuromuscular junction(GO:0008582) |
| 9.0 | 71.7 | GO:0000491 | small nucleolar ribonucleoprotein complex assembly(GO:0000491) |
| 9.0 | 44.8 | GO:0006189 | 'de novo' IMP biosynthetic process(GO:0006189) |
| 8.9 | 62.6 | GO:0090481 | pyrimidine nucleotide-sugar transmembrane transport(GO:0090481) |
| 8.9 | 26.8 | GO:2000097 | regulation of smooth muscle cell-matrix adhesion(GO:2000097) |
| 8.9 | 98.1 | GO:0090344 | negative regulation of cell aging(GO:0090344) |
| 8.9 | 26.6 | GO:0046121 | deoxyribonucleoside catabolic process(GO:0046121) |
| 8.8 | 35.4 | GO:0010637 | negative regulation of mitochondrial fusion(GO:0010637) |
| 8.8 | 203.1 | GO:2000675 | negative regulation of type B pancreatic cell apoptotic process(GO:2000675) |
| 8.8 | 8.8 | GO:0033567 | DNA replication, Okazaki fragment processing(GO:0033567) |
| 8.8 | 35.1 | GO:0042264 | peptidyl-aspartic acid hydroxylation(GO:0042264) |
| 8.8 | 35.0 | GO:0006269 | DNA replication, synthesis of RNA primer(GO:0006269) |
| 8.8 | 17.5 | GO:0048102 | autophagic cell death(GO:0048102) |
| 8.7 | 43.7 | GO:0043128 | regulation of 1-phosphatidylinositol 4-kinase activity(GO:0043126) positive regulation of 1-phosphatidylinositol 4-kinase activity(GO:0043128) |
| 8.7 | 26.1 | GO:1900063 | regulation of peroxisome organization(GO:1900063) |
| 8.7 | 26.0 | GO:1904899 | regulation of hepatic stellate cell proliferation(GO:1904897) positive regulation of hepatic stellate cell proliferation(GO:1904899) hepatic stellate cell proliferation(GO:1990922) |
| 8.6 | 34.6 | GO:0034773 | histone H4-K20 trimethylation(GO:0034773) |
| 8.6 | 25.9 | GO:0006015 | 5-phosphoribose 1-diphosphate biosynthetic process(GO:0006015) 5-phosphoribose 1-diphosphate metabolic process(GO:0046391) |
| 8.6 | 25.9 | GO:0070625 | zymogen granule exocytosis(GO:0070625) |
| 8.6 | 17.2 | GO:1903722 | regulation of centriole elongation(GO:1903722) |
| 8.6 | 77.6 | GO:1901407 | regulation of phosphorylation of RNA polymerase II C-terminal domain(GO:1901407) |
| 8.6 | 68.8 | GO:0072307 | metanephric nephron tubule epithelial cell differentiation(GO:0072257) regulation of metanephric nephron tubule epithelial cell differentiation(GO:0072307) |
| 8.5 | 34.1 | GO:1904627 | response to phorbol 13-acetate 12-myristate(GO:1904627) cellular response to phorbol 13-acetate 12-myristate(GO:1904628) |
| 8.5 | 93.4 | GO:0000920 | cell separation after cytokinesis(GO:0000920) |
| 8.5 | 93.0 | GO:0051096 | positive regulation of helicase activity(GO:0051096) |
| 8.4 | 84.4 | GO:0045948 | positive regulation of translational initiation(GO:0045948) |
| 8.4 | 33.7 | GO:0003409 | optic cup structural organization(GO:0003409) |
| 8.4 | 84.3 | GO:0040016 | embryonic cleavage(GO:0040016) |
| 8.4 | 67.4 | GO:0051988 | regulation of attachment of spindle microtubules to kinetochore(GO:0051988) |
| 8.4 | 67.3 | GO:1903003 | positive regulation of protein deubiquitination(GO:1903003) |
| 8.4 | 25.2 | GO:0032792 | negative regulation of CREB transcription factor activity(GO:0032792) |
| 8.4 | 33.4 | GO:0010992 | ubiquitin homeostasis(GO:0010992) |
| 8.3 | 41.7 | GO:1903301 | positive regulation of glucokinase activity(GO:0033133) positive regulation of hexokinase activity(GO:1903301) |
| 8.3 | 16.6 | GO:0042590 | antigen processing and presentation of exogenous peptide antigen via MHC class I(GO:0042590) |
| 8.3 | 8.3 | GO:0034398 | telomere tethering at nuclear periphery(GO:0034398) |
| 8.3 | 24.8 | GO:0036111 | very long-chain fatty-acyl-CoA metabolic process(GO:0036111) |
| 8.2 | 33.0 | GO:0061304 | retinal blood vessel morphogenesis(GO:0061304) |
| 8.2 | 74.0 | GO:0001731 | formation of translation preinitiation complex(GO:0001731) |
| 8.2 | 41.0 | GO:0090168 | Golgi reassembly(GO:0090168) |
| 8.2 | 24.5 | GO:0044830 | modulation by host of viral RNA genome replication(GO:0044830) positive regulation of intracellular transport of viral material(GO:1901254) |
| 8.2 | 73.5 | GO:0045835 | negative regulation of meiotic nuclear division(GO:0045835) |
| 8.1 | 24.4 | GO:0042819 | pyridoxine metabolic process(GO:0008614) pyridoxine biosynthetic process(GO:0008615) vitamin B6 biosynthetic process(GO:0042819) |
| 8.1 | 16.3 | GO:0002001 | renal response to blood flow involved in circulatory renin-angiotensin regulation of systemic arterial blood pressure(GO:0001999) renin secretion into blood stream(GO:0002001) regulation of renin secretion into blood stream(GO:1900133) |
| 8.1 | 8.1 | GO:0098507 | polynucleotide 5' dephosphorylation(GO:0098507) |
| 8.1 | 96.8 | GO:0061014 | positive regulation of mRNA catabolic process(GO:0061014) |
| 8.1 | 104.8 | GO:2000271 | positive regulation of fibroblast apoptotic process(GO:2000271) |
| 8.1 | 40.3 | GO:0051643 | endoplasmic reticulum localization(GO:0051643) |
| 8.0 | 88.1 | GO:0071550 | death-inducing signaling complex assembly(GO:0071550) |
| 8.0 | 24.0 | GO:0061635 | regulation of protein complex stability(GO:0061635) |
| 8.0 | 95.9 | GO:0046784 | viral mRNA export from host cell nucleus(GO:0046784) |
| 8.0 | 31.8 | GO:0035965 | cardiolipin acyl-chain remodeling(GO:0035965) |
| 7.9 | 23.6 | GO:0018103 | protein C-linked glycosylation(GO:0018103) peptidyl-tryptophan modification(GO:0018211) protein C-linked glycosylation via tryptophan(GO:0018317) protein C-linked glycosylation via 2'-alpha-mannosyl-L-tryptophan(GO:0018406) |
| 7.8 | 133.3 | GO:0006607 | NLS-bearing protein import into nucleus(GO:0006607) |
| 7.8 | 23.5 | GO:0030174 | regulation of DNA-dependent DNA replication initiation(GO:0030174) |
| 7.8 | 31.2 | GO:0071243 | cellular response to arsenic-containing substance(GO:0071243) |
| 7.8 | 31.1 | GO:0050917 | sensory perception of umami taste(GO:0050917) |
| 7.7 | 23.1 | GO:0044806 | G-quadruplex DNA unwinding(GO:0044806) |
| 7.7 | 46.0 | GO:0050668 | cellular response to phosphate starvation(GO:0016036) positive regulation of sulfur amino acid metabolic process(GO:0031337) positive regulation of homocysteine metabolic process(GO:0050668) |
| 7.6 | 53.4 | GO:0015712 | hexose phosphate transport(GO:0015712) glucose-6-phosphate transport(GO:0015760) |
| 7.6 | 22.9 | GO:0048280 | vesicle fusion with Golgi apparatus(GO:0048280) |
| 7.6 | 22.8 | GO:0048382 | mesendoderm development(GO:0048382) |
| 7.5 | 120.6 | GO:0070389 | chaperone cofactor-dependent protein refolding(GO:0070389) |
| 7.5 | 45.2 | GO:0001833 | inner cell mass cell proliferation(GO:0001833) |
| 7.5 | 157.4 | GO:0006465 | signal peptide processing(GO:0006465) |
| 7.5 | 15.0 | GO:0003162 | atrioventricular node development(GO:0003162) |
| 7.5 | 67.4 | GO:0045116 | protein neddylation(GO:0045116) |
| 7.5 | 104.7 | GO:0018206 | peptidyl-methionine modification(GO:0018206) |
| 7.5 | 104.7 | GO:0007080 | mitotic metaphase plate congression(GO:0007080) |
| 7.4 | 22.3 | GO:0031550 | positive regulation of brain-derived neurotrophic factor receptor signaling pathway(GO:0031550) |
| 7.4 | 7.4 | GO:1903774 | positive regulation of viral budding via host ESCRT complex(GO:1903774) |
| 7.4 | 37.0 | GO:0051382 | kinetochore assembly(GO:0051382) |
| 7.4 | 22.2 | GO:0002678 | positive regulation of chronic inflammatory response(GO:0002678) |
| 7.4 | 14.8 | GO:0070384 | Harderian gland development(GO:0070384) |
| 7.4 | 95.7 | GO:0030150 | protein import into mitochondrial matrix(GO:0030150) |
| 7.3 | 22.0 | GO:0010730 | negative regulation of hydrogen peroxide biosynthetic process(GO:0010730) |
| 7.3 | 29.3 | GO:2000354 | regulation of ovarian follicle development(GO:2000354) |
| 7.3 | 43.8 | GO:1904814 | regulation of protein localization to chromosome, telomeric region(GO:1904814) |
| 7.3 | 124.0 | GO:0031440 | regulation of mRNA 3'-end processing(GO:0031440) |
| 7.3 | 14.6 | GO:0005997 | xylulose metabolic process(GO:0005997) |
| 7.3 | 65.4 | GO:0038203 | TORC2 signaling(GO:0038203) |
| 7.2 | 7.2 | GO:0035754 | B cell chemotaxis(GO:0035754) |
| 7.2 | 21.7 | GO:0006478 | peptidyl-tyrosine sulfation(GO:0006478) |
| 7.2 | 28.9 | GO:0090073 | positive regulation of protein homodimerization activity(GO:0090073) |
| 7.2 | 36.1 | GO:0051547 | regulation of keratinocyte migration(GO:0051547) |
| 7.2 | 36.1 | GO:0006065 | UDP-glucuronate biosynthetic process(GO:0006065) |
| 7.2 | 21.5 | GO:1904528 | regulation of microtubule plus-end binding(GO:1903031) positive regulation of microtubule plus-end binding(GO:1903033) positive regulation of microtubule binding(GO:1904528) |
| 7.2 | 71.5 | GO:1905098 | negative regulation of guanyl-nucleotide exchange factor activity(GO:1905098) |
| 7.2 | 42.9 | GO:0031017 | exocrine pancreas development(GO:0031017) |
| 7.1 | 21.4 | GO:0034350 | regulation of glial cell apoptotic process(GO:0034350) negative regulation of glial cell apoptotic process(GO:0034351) |
| 7.1 | 28.6 | GO:0002084 | protein depalmitoylation(GO:0002084) |
| 7.1 | 128.3 | GO:0002183 | cytoplasmic translational initiation(GO:0002183) |
| 7.1 | 28.5 | GO:0042091 | interleukin-10 biosynthetic process(GO:0042091) regulation of interleukin-10 biosynthetic process(GO:0045074) |
| 7.1 | 42.6 | GO:0032911 | negative regulation of transforming growth factor beta1 production(GO:0032911) |
| 7.1 | 120.5 | GO:0006002 | fructose 6-phosphate metabolic process(GO:0006002) |
| 7.1 | 169.3 | GO:0016578 | histone deubiquitination(GO:0016578) |
| 7.0 | 42.3 | GO:0007296 | vitellogenesis(GO:0007296) |
| 7.0 | 21.0 | GO:0034635 | glutathione transport(GO:0034635) tripeptide transport(GO:0042939) |
| 7.0 | 14.0 | GO:1904117 | response to vasopressin(GO:1904116) cellular response to vasopressin(GO:1904117) |
| 7.0 | 62.9 | GO:0006369 | termination of RNA polymerase II transcription(GO:0006369) |
| 7.0 | 48.9 | GO:0048050 | post-embryonic eye morphogenesis(GO:0048050) |
| 7.0 | 41.8 | GO:1903435 | positive regulation of constitutive secretory pathway(GO:1903435) |
| 6.9 | 27.6 | GO:0001302 | replicative cell aging(GO:0001302) |
| 6.9 | 13.8 | GO:0070562 | regulation of vitamin D receptor signaling pathway(GO:0070562) |
| 6.9 | 75.8 | GO:0001886 | endothelial cell morphogenesis(GO:0001886) |
| 6.9 | 41.4 | GO:0060136 | embryonic process involved in female pregnancy(GO:0060136) |
| 6.9 | 82.7 | GO:0070986 | left/right axis specification(GO:0070986) |
| 6.9 | 41.3 | GO:0045079 | negative regulation of chemokine biosynthetic process(GO:0045079) |
| 6.9 | 20.6 | GO:0072396 | response to cell cycle checkpoint signaling(GO:0072396) response to DNA integrity checkpoint signaling(GO:0072402) response to DNA damage checkpoint signaling(GO:0072423) |
| 6.9 | 27.5 | GO:0042796 | snRNA transcription from RNA polymerase III promoter(GO:0042796) |
| 6.9 | 96.0 | GO:0070935 | 3'-UTR-mediated mRNA stabilization(GO:0070935) |
| 6.9 | 27.4 | GO:0045218 | zonula adherens maintenance(GO:0045218) |
| 6.8 | 6.8 | GO:0060585 | regulation of prostaglandin-endoperoxide synthase activity(GO:0060584) positive regulation of prostaglandin-endoperoxide synthase activity(GO:0060585) |
| 6.8 | 27.0 | GO:0051574 | positive regulation of histone H3-K9 methylation(GO:0051574) |
| 6.8 | 67.5 | GO:0002566 | somatic diversification of immune receptors via somatic mutation(GO:0002566) |
| 6.7 | 113.4 | GO:0006107 | oxaloacetate metabolic process(GO:0006107) |
| 6.7 | 13.3 | GO:0061428 | negative regulation of transcription from RNA polymerase II promoter in response to hypoxia(GO:0061428) |
| 6.7 | 26.7 | GO:0009956 | radial pattern formation(GO:0009956) |
| 6.7 | 20.0 | GO:0036233 | glycine import(GO:0036233) |
| 6.6 | 19.9 | GO:0098905 | regulation of bundle of His cell action potential(GO:0098905) |
| 6.6 | 79.6 | GO:0017121 | phospholipid scrambling(GO:0017121) |
| 6.6 | 19.9 | GO:0002949 | tRNA threonylcarbamoyladenosine modification(GO:0002949) |
| 6.6 | 26.4 | GO:1903173 | phytol metabolic process(GO:0033306) fatty alcohol metabolic process(GO:1903173) |
| 6.6 | 13.1 | GO:1904796 | regulation of core promoter binding(GO:1904796) |
| 6.6 | 13.1 | GO:0042986 | positive regulation of amyloid precursor protein biosynthetic process(GO:0042986) |
| 6.5 | 32.6 | GO:0031053 | primary miRNA processing(GO:0031053) |
| 6.5 | 13.0 | GO:0051295 | establishment of meiotic spindle localization(GO:0051295) |
| 6.5 | 19.5 | GO:0034982 | protein processing involved in protein targeting to mitochondrion(GO:0006627) mitochondrial protein processing(GO:0034982) |
| 6.5 | 26.0 | GO:0045658 | regulation of neutrophil differentiation(GO:0045658) negative regulation of neutrophil differentiation(GO:0045659) |
| 6.5 | 19.4 | GO:2000176 | regulation of pro-T cell differentiation(GO:2000174) positive regulation of pro-T cell differentiation(GO:2000176) |
| 6.4 | 83.7 | GO:0035459 | cargo loading into vesicle(GO:0035459) |
| 6.4 | 38.6 | GO:0060356 | leucine import(GO:0060356) |
| 6.4 | 25.7 | GO:0043555 | regulation of translation in response to stress(GO:0043555) |
| 6.4 | 32.2 | GO:0007076 | mitotic chromosome condensation(GO:0007076) |
| 6.4 | 70.7 | GO:2000394 | positive regulation of lamellipodium morphogenesis(GO:2000394) |
| 6.4 | 25.7 | GO:0018008 | N-terminal peptidyl-glycine N-myristoylation(GO:0018008) peptidyl-glycine modification(GO:0018201) |
| 6.4 | 32.1 | GO:1900864 | mitochondrial tRNA modification(GO:0070900) mitochondrial RNA modification(GO:1900864) |
| 6.4 | 12.8 | GO:0046116 | queuosine biosynthetic process(GO:0008616) queuosine metabolic process(GO:0046116) |
| 6.4 | 6.4 | GO:0042256 | mature ribosome assembly(GO:0042256) |
| 6.4 | 12.7 | GO:0061502 | early endosome to recycling endosome transport(GO:0061502) |
| 6.3 | 12.7 | GO:1904760 | myofibroblast differentiation(GO:0036446) regulation of myofibroblast differentiation(GO:1904760) |
| 6.3 | 57.1 | GO:2000774 | positive regulation of cellular senescence(GO:2000774) |
| 6.3 | 12.6 | GO:0097252 | oligodendrocyte apoptotic process(GO:0097252) |
| 6.3 | 6.3 | GO:0090107 | regulation of high-density lipoprotein particle assembly(GO:0090107) |
| 6.3 | 50.2 | GO:0033211 | adiponectin-activated signaling pathway(GO:0033211) |
| 6.3 | 31.3 | GO:0090385 | phagosome-lysosome fusion(GO:0090385) |
| 6.3 | 431.3 | GO:0010257 | NADH dehydrogenase complex assembly(GO:0010257) mitochondrial respiratory chain complex I assembly(GO:0032981) mitochondrial respiratory chain complex I biogenesis(GO:0097031) |
| 6.2 | 12.5 | GO:0051182 | coenzyme transport(GO:0051182) |
| 6.2 | 397.8 | GO:0000079 | regulation of cyclin-dependent protein serine/threonine kinase activity(GO:0000079) |
| 6.2 | 12.3 | GO:0015917 | aminophospholipid transport(GO:0015917) |
| 6.2 | 80.1 | GO:1900623 | regulation of monocyte aggregation(GO:1900623) positive regulation of monocyte aggregation(GO:1900625) |
| 6.1 | 73.8 | GO:0031163 | iron-sulfur cluster assembly(GO:0016226) metallo-sulfur cluster assembly(GO:0031163) |
| 6.1 | 79.9 | GO:0006787 | porphyrin-containing compound catabolic process(GO:0006787) tetrapyrrole catabolic process(GO:0033015) heme catabolic process(GO:0042167) pigment catabolic process(GO:0046149) |
| 6.1 | 24.5 | GO:0045541 | negative regulation of cholesterol biosynthetic process(GO:0045541) negative regulation of cholesterol metabolic process(GO:0090206) |
| 6.1 | 42.8 | GO:0000012 | single strand break repair(GO:0000012) |
| 6.1 | 36.6 | GO:0006931 | substrate-dependent cell migration, cell attachment to substrate(GO:0006931) |
| 6.1 | 42.7 | GO:0051437 | positive regulation of ubiquitin-protein ligase activity involved in regulation of mitotic cell cycle transition(GO:0051437) |
| 6.1 | 42.7 | GO:1903895 | negative regulation of IRE1-mediated unfolded protein response(GO:1903895) |
| 6.1 | 54.7 | GO:1904715 | negative regulation of chaperone-mediated autophagy(GO:1904715) |
| 6.1 | 36.4 | GO:0015677 | copper ion import(GO:0015677) |
| 6.1 | 78.8 | GO:0045292 | mRNA cis splicing, via spliceosome(GO:0045292) |
| 6.0 | 42.3 | GO:0001866 | NK T cell proliferation(GO:0001866) |
| 6.0 | 42.2 | GO:0051014 | actin filament severing(GO:0051014) |
| 6.0 | 18.0 | GO:0070407 | oxidation-dependent protein catabolic process(GO:0070407) |
| 6.0 | 131.8 | GO:0035456 | response to interferon-beta(GO:0035456) |
| 6.0 | 12.0 | GO:0002101 | tRNA wobble cytosine modification(GO:0002101) |
| 6.0 | 17.9 | GO:0060739 | mesenchymal-epithelial cell signaling involved in prostate gland development(GO:0060739) |
| 6.0 | 119.2 | GO:0006337 | nucleosome disassembly(GO:0006337) protein-DNA complex disassembly(GO:0032986) |
| 6.0 | 29.8 | GO:0043418 | homocysteine catabolic process(GO:0043418) |
| 6.0 | 29.8 | GO:0033277 | abortive mitotic cell cycle(GO:0033277) |
| 5.9 | 94.9 | GO:0032486 | Rap protein signal transduction(GO:0032486) |
| 5.9 | 171.6 | GO:0043574 | protein targeting to peroxisome(GO:0006625) peroxisomal transport(GO:0043574) protein localization to peroxisome(GO:0072662) establishment of protein localization to peroxisome(GO:0072663) |
| 5.9 | 142.0 | GO:0051031 | tRNA transport(GO:0051031) |
| 5.9 | 41.2 | GO:0042407 | cristae formation(GO:0042407) |
| 5.9 | 5.9 | GO:0003415 | chondrocyte hypertrophy(GO:0003415) |
| 5.9 | 23.5 | GO:1903070 | negative regulation of ER-associated ubiquitin-dependent protein catabolic process(GO:1903070) |
| 5.9 | 5.9 | GO:2000812 | regulation of barbed-end actin filament capping(GO:2000812) |
| 5.8 | 5.8 | GO:0001832 | blastocyst growth(GO:0001832) |
| 5.8 | 35.0 | GO:0035413 | positive regulation of catenin import into nucleus(GO:0035413) |
| 5.8 | 52.5 | GO:0089700 | protein kinase D signaling(GO:0089700) |
| 5.8 | 11.7 | GO:0003221 | right ventricular cardiac muscle tissue morphogenesis(GO:0003221) |
| 5.8 | 23.3 | GO:1904550 | chemotaxis to arachidonic acid(GO:0034670) response to arachidonic acid(GO:1904550) |
| 5.8 | 5.8 | GO:0035360 | positive regulation of peroxisome proliferator activated receptor signaling pathway(GO:0035360) |
| 5.7 | 23.0 | GO:1903899 | positive regulation of PERK-mediated unfolded protein response(GO:1903899) |
| 5.7 | 17.2 | GO:0016240 | autophagosome docking(GO:0016240) |
| 5.7 | 11.4 | GO:0043311 | regulation of eosinophil degranulation(GO:0043309) positive regulation of eosinophil degranulation(GO:0043311) positive regulation of eosinophil activation(GO:1902568) |
| 5.7 | 40.1 | GO:0031444 | slow-twitch skeletal muscle fiber contraction(GO:0031444) |
| 5.7 | 57.2 | GO:0060020 | Bergmann glial cell differentiation(GO:0060020) |
| 5.7 | 22.8 | GO:0006556 | S-adenosylmethionine biosynthetic process(GO:0006556) |
| 5.7 | 5.7 | GO:1903659 | regulation of complement-dependent cytotoxicity(GO:1903659) |
| 5.7 | 22.8 | GO:1903803 | glutamine secretion(GO:0010585) L-glutamine import(GO:0036229) L-glutamine import into cell(GO:1903803) |
| 5.7 | 45.4 | GO:0010592 | positive regulation of lamellipodium assembly(GO:0010592) |
| 5.7 | 51.1 | GO:0031274 | positive regulation of pseudopodium assembly(GO:0031274) |
| 5.7 | 11.3 | GO:0033591 | response to L-ascorbic acid(GO:0033591) |
| 5.7 | 33.9 | GO:0061197 | fungiform papilla morphogenesis(GO:0061197) |
| 5.6 | 5.6 | GO:0021691 | cerebellar Purkinje cell layer maturation(GO:0021691) |
| 5.6 | 78.9 | GO:0001765 | membrane raft assembly(GO:0001765) |
| 5.6 | 371.6 | GO:0090114 | COPII-coated vesicle budding(GO:0090114) |
| 5.6 | 5.6 | GO:0045084 | positive regulation of interleukin-12 biosynthetic process(GO:0045084) |
| 5.6 | 44.8 | GO:0051451 | myoblast migration(GO:0051451) |
| 5.6 | 39.1 | GO:2000643 | positive regulation of early endosome to late endosome transport(GO:2000643) |
| 5.6 | 33.5 | GO:0006415 | translational termination(GO:0006415) |
| 5.6 | 44.6 | GO:1900119 | positive regulation of execution phase of apoptosis(GO:1900119) |
| 5.6 | 38.9 | GO:0060753 | regulation of mast cell chemotaxis(GO:0060753) |
| 5.6 | 5.6 | GO:0070213 | protein auto-ADP-ribosylation(GO:0070213) |
| 5.5 | 11.1 | GO:0002317 | plasma cell differentiation(GO:0002317) |
| 5.5 | 27.6 | GO:1901350 | cell-cell signaling involved in cell-cell junction organization(GO:1901350) |
| 5.5 | 5.5 | GO:0044827 | modulation by host of viral genome replication(GO:0044827) |
| 5.5 | 76.9 | GO:0070208 | protein heterotrimerization(GO:0070208) |
| 5.5 | 5.5 | GO:0033299 | secretion of lysosomal enzymes(GO:0033299) |
| 5.5 | 10.9 | GO:0031953 | negative regulation of protein autophosphorylation(GO:0031953) |
| 5.5 | 5.5 | GO:0051255 | spindle midzone assembly(GO:0051255) |
| 5.4 | 27.2 | GO:0034036 | purine ribonucleoside bisphosphate biosynthetic process(GO:0034036) 3'-phosphoadenosine 5'-phosphosulfate biosynthetic process(GO:0050428) |
| 5.4 | 54.2 | GO:0007175 | negative regulation of epidermal growth factor-activated receptor activity(GO:0007175) |
| 5.4 | 59.1 | GO:0071803 | positive regulation of podosome assembly(GO:0071803) |
| 5.4 | 48.3 | GO:0060330 | regulation of response to interferon-gamma(GO:0060330) |
| 5.4 | 16.1 | GO:0070863 | positive regulation of protein exit from endoplasmic reticulum(GO:0070863) |
| 5.3 | 234.6 | GO:0043488 | regulation of mRNA stability(GO:0043488) |
| 5.3 | 16.0 | GO:0015920 | lipopolysaccharide transport(GO:0015920) |
| 5.3 | 15.9 | GO:2000035 | regulation of stem cell division(GO:2000035) |
| 5.3 | 15.8 | GO:0048250 | mitochondrial iron ion transport(GO:0048250) |
| 5.2 | 15.6 | GO:1903758 | regulation of transcription from RNA polymerase II promoter by histone modification(GO:1903756) negative regulation of transcription from RNA polymerase II promoter by histone modification(GO:1903758) |
| 5.2 | 5.2 | GO:0006529 | asparagine biosynthetic process(GO:0006529) |
| 5.2 | 36.4 | GO:2000344 | positive regulation of acrosome reaction(GO:2000344) |
| 5.2 | 25.9 | GO:1904424 | regulation of GTP binding(GO:1904424) |
| 5.2 | 10.3 | GO:1904732 | regulation of electron carrier activity(GO:1904732) |
| 5.2 | 31.0 | GO:0051958 | methotrexate transport(GO:0051958) reduced folate transmembrane transport(GO:0098838) |
| 5.2 | 113.5 | GO:0050686 | negative regulation of mRNA processing(GO:0050686) |
| 5.1 | 30.8 | GO:0070200 | establishment of protein localization to telomere(GO:0070200) |
| 5.1 | 10.3 | GO:0051984 | positive regulation of chromosome segregation(GO:0051984) |
| 5.1 | 5.1 | GO:2000586 | regulation of platelet-derived growth factor receptor-beta signaling pathway(GO:2000586) |
| 5.1 | 15.3 | GO:0060352 | cell adhesion molecule production(GO:0060352) |
| 5.1 | 15.3 | GO:0001188 | RNA polymerase I transcriptional preinitiation complex assembly(GO:0001188) RNA polymerase I transcriptional preinitiation complex assembly at the promoter for the nuclear large rRNA transcript(GO:0001189) |
| 5.1 | 25.4 | GO:0032506 | cytokinetic process(GO:0032506) |
| 5.1 | 10.1 | GO:0003350 | pulmonary myocardium development(GO:0003350) |
| 5.1 | 10.1 | GO:0070561 | vitamin D receptor signaling pathway(GO:0070561) |
| 5.0 | 120.2 | GO:0006301 | postreplication repair(GO:0006301) |
| 5.0 | 269.9 | GO:0070671 | response to interleukin-12(GO:0070671) |
| 5.0 | 99.9 | GO:0016254 | preassembly of GPI anchor in ER membrane(GO:0016254) |
| 5.0 | 39.9 | GO:0060340 | positive regulation of type I interferon-mediated signaling pathway(GO:0060340) |
| 5.0 | 19.9 | GO:2000253 | positive regulation of feeding behavior(GO:2000253) |
| 4.9 | 19.8 | GO:0070933 | histone H4 deacetylation(GO:0070933) |
| 4.9 | 14.8 | GO:0006903 | vesicle targeting(GO:0006903) |
| 4.9 | 14.8 | GO:0023016 | signal transduction by trans-phosphorylation(GO:0023016) |
| 4.9 | 103.4 | GO:0043928 | nuclear-transcribed mRNA catabolic process, exonucleolytic(GO:0000291) exonucleolytic nuclear-transcribed mRNA catabolic process involved in deadenylation-dependent decay(GO:0043928) |
| 4.9 | 39.3 | GO:0006307 | DNA dealkylation involved in DNA repair(GO:0006307) |
| 4.9 | 9.8 | GO:0000965 | mitochondrial RNA 3'-end processing(GO:0000965) |
| 4.9 | 19.5 | GO:1903265 | positive regulation of tumor necrosis factor-mediated signaling pathway(GO:1903265) |
| 4.9 | 24.3 | GO:1903232 | melanosome assembly(GO:1903232) |
| 4.8 | 14.5 | GO:0006679 | glucosylceramide biosynthetic process(GO:0006679) |
| 4.8 | 57.9 | GO:0036120 | cellular response to platelet-derived growth factor stimulus(GO:0036120) |
| 4.8 | 19.3 | GO:0035750 | protein localization to myelin sheath abaxonal region(GO:0035750) |
| 4.8 | 53.0 | GO:0060056 | mammary gland involution(GO:0060056) |
| 4.8 | 4.8 | GO:0051195 | negative regulation of glycolytic process(GO:0045820) negative regulation of cofactor metabolic process(GO:0051195) negative regulation of coenzyme metabolic process(GO:0051198) |
| 4.8 | 206.0 | GO:0042273 | ribosomal large subunit biogenesis(GO:0042273) |
| 4.8 | 14.3 | GO:1901029 | negative regulation of mitochondrial outer membrane permeabilization involved in apoptotic signaling pathway(GO:1901029) |
| 4.7 | 47.5 | GO:0009414 | response to water deprivation(GO:0009414) |
| 4.7 | 19.0 | GO:0090084 | negative regulation of inclusion body assembly(GO:0090084) |
| 4.7 | 14.1 | GO:0009174 | UMP biosynthetic process(GO:0006222) pyrimidine ribonucleoside monophosphate metabolic process(GO:0009173) pyrimidine ribonucleoside monophosphate biosynthetic process(GO:0009174) UMP metabolic process(GO:0046049) |
| 4.7 | 28.2 | GO:0044351 | macropinocytosis(GO:0044351) |
| 4.7 | 28.2 | GO:0006771 | riboflavin metabolic process(GO:0006771) |
| 4.7 | 173.0 | GO:0030212 | hyaluronan metabolic process(GO:0030212) |
| 4.6 | 9.3 | GO:0048199 | vesicle targeting, to, from or within Golgi(GO:0048199) |
| 4.6 | 27.8 | GO:1904274 | tricellular tight junction assembly(GO:1904274) |
| 4.6 | 18.5 | GO:0044336 | canonical Wnt signaling pathway involved in negative regulation of apoptotic process(GO:0044336) |
| 4.6 | 9.2 | GO:0070601 | centromeric sister chromatid cohesion(GO:0070601) |
| 4.6 | 13.8 | GO:0035733 | hepatic stellate cell activation(GO:0035733) |
| 4.6 | 9.2 | GO:0061394 | regulation of transcription from RNA polymerase II promoter in response to arsenic-containing substance(GO:0061394) |
| 4.6 | 13.7 | GO:0002934 | desmosome organization(GO:0002934) |
| 4.6 | 9.1 | GO:0060628 | regulation of ER to Golgi vesicle-mediated transport(GO:0060628) |
| 4.6 | 18.3 | GO:0018231 | peptidyl-L-cysteine S-palmitoylation(GO:0018230) peptidyl-S-diacylglycerol-L-cysteine biosynthetic process from peptidyl-cysteine(GO:0018231) |
| 4.5 | 13.6 | GO:0032776 | DNA methylation on cytosine(GO:0032776) |
| 4.5 | 22.7 | GO:0043457 | regulation of cellular respiration(GO:0043457) |
| 4.5 | 13.6 | GO:0072205 | metanephric collecting duct development(GO:0072205) |
| 4.5 | 4.5 | GO:0051983 | regulation of chromosome segregation(GO:0051983) |
| 4.5 | 9.0 | GO:0010986 | positive regulation of lipoprotein particle clearance(GO:0010986) |
| 4.5 | 40.4 | GO:0043568 | positive regulation of insulin-like growth factor receptor signaling pathway(GO:0043568) |
| 4.5 | 22.4 | GO:0000288 | nuclear-transcribed mRNA catabolic process, deadenylation-dependent decay(GO:0000288) |
| 4.5 | 31.4 | GO:0031339 | negative regulation of vesicle fusion(GO:0031339) |
| 4.5 | 40.3 | GO:0071340 | skeletal muscle acetylcholine-gated channel clustering(GO:0071340) |
| 4.5 | 17.9 | GO:0019264 | glycine biosynthetic process from serine(GO:0019264) |
| 4.5 | 17.9 | GO:2000210 | positive regulation of anoikis(GO:2000210) |
| 4.5 | 4.5 | GO:0010041 | response to iron(III) ion(GO:0010041) |
| 4.5 | 142.8 | GO:0034314 | Arp2/3 complex-mediated actin nucleation(GO:0034314) |
| 4.5 | 4.5 | GO:1900220 | semaphorin-plexin signaling pathway involved in bone trabecula morphogenesis(GO:1900220) |
| 4.5 | 17.8 | GO:0097021 | lymphocyte migration into lymphoid organs(GO:0097021) |
| 4.5 | 17.8 | GO:0060743 | epithelial cell maturation involved in prostate gland development(GO:0060743) |
| 4.4 | 13.3 | GO:0031455 | glycine betaine biosynthetic process from choline(GO:0019285) glycine betaine metabolic process(GO:0031455) glycine betaine biosynthetic process(GO:0031456) |
| 4.4 | 4.4 | GO:2000182 | regulation of progesterone biosynthetic process(GO:2000182) |
| 4.4 | 13.3 | GO:1903377 | negative regulation of oxidative stress-induced neuron intrinsic apoptotic signaling pathway(GO:1903377) |
| 4.4 | 17.6 | GO:0007386 | compartment pattern specification(GO:0007386) |
| 4.4 | 17.6 | GO:0030200 | heparan sulfate proteoglycan catabolic process(GO:0030200) |
| 4.4 | 13.1 | GO:0048817 | negative regulation of hair follicle maturation(GO:0048817) |
| 4.4 | 17.5 | GO:1903069 | regulation of ER-associated ubiquitin-dependent protein catabolic process(GO:1903069) |
| 4.3 | 4.3 | GO:0043366 | beta selection(GO:0043366) |
| 4.3 | 43.5 | GO:0048853 | forebrain morphogenesis(GO:0048853) |
| 4.3 | 17.3 | GO:0050703 | interleukin-1 alpha secretion(GO:0050703) |
| 4.3 | 25.9 | GO:1902237 | positive regulation of endoplasmic reticulum stress-induced intrinsic apoptotic signaling pathway(GO:1902237) |
| 4.3 | 47.3 | GO:0060546 | negative regulation of necroptotic process(GO:0060546) |
| 4.3 | 60.0 | GO:0050873 | brown fat cell differentiation(GO:0050873) |
| 4.3 | 42.7 | GO:0099515 | actin filament-based transport(GO:0099515) |
| 4.3 | 8.5 | GO:1903378 | positive regulation of oxidative stress-induced neuron intrinsic apoptotic signaling pathway(GO:1903378) |
| 4.3 | 217.0 | GO:0031124 | mRNA 3'-end processing(GO:0031124) |
| 4.2 | 12.7 | GO:0042255 | ribosome assembly(GO:0042255) |
| 4.2 | 8.5 | GO:2001268 | negative regulation of cysteine-type endopeptidase activity involved in apoptotic signaling pathway(GO:2001268) |
| 4.2 | 4.2 | GO:0021684 | cerebellar granular layer formation(GO:0021684) cerebellar granule cell differentiation(GO:0021707) |
| 4.2 | 89.0 | GO:0033689 | negative regulation of osteoblast proliferation(GO:0033689) |
| 4.2 | 50.8 | GO:0070327 | thyroid hormone transport(GO:0070327) |
| 4.2 | 8.5 | GO:0072321 | chaperone-mediated protein transport(GO:0072321) |
| 4.2 | 16.9 | GO:0045876 | positive regulation of sister chromatid cohesion(GO:0045876) |
| 4.2 | 236.2 | GO:0007157 | heterophilic cell-cell adhesion via plasma membrane cell adhesion molecules(GO:0007157) |
| 4.2 | 25.3 | GO:0030263 | apoptotic chromosome condensation(GO:0030263) |
| 4.2 | 21.1 | GO:1904293 | negative regulation of ERAD pathway(GO:1904293) |
| 4.2 | 4.2 | GO:0061290 | cell-cell signaling involved in kidney development(GO:0060995) Wnt signaling pathway involved in kidney development(GO:0061289) canonical Wnt signaling pathway involved in metanephric kidney development(GO:0061290) cell-cell signaling involved in metanephros development(GO:0072204) |
| 4.1 | 16.6 | GO:0031179 | peptide amidation(GO:0001519) protein amidation(GO:0018032) peptide modification(GO:0031179) |
| 4.1 | 62.0 | GO:0000462 | maturation of SSU-rRNA from tricistronic rRNA transcript (SSU-rRNA, 5.8S rRNA, LSU-rRNA)(GO:0000462) |
| 4.1 | 12.4 | GO:0098974 | postsynaptic actin cytoskeleton organization(GO:0098974) |
| 4.1 | 8.2 | GO:0010793 | regulation of mRNA export from nucleus(GO:0010793) regulation of ribonucleoprotein complex localization(GO:2000197) |
| 4.1 | 4.1 | GO:0048294 | negative regulation of isotype switching to IgE isotypes(GO:0048294) |
| 4.1 | 12.3 | GO:0061086 | negative regulation of histone H3-K27 methylation(GO:0061086) |
| 4.1 | 73.6 | GO:0006270 | DNA replication initiation(GO:0006270) |
| 4.1 | 93.7 | GO:0006517 | protein deglycosylation(GO:0006517) |
| 4.1 | 40.7 | GO:0036109 | alpha-linolenic acid metabolic process(GO:0036109) |
| 4.1 | 4.1 | GO:0098935 | dendritic transport(GO:0098935) anterograde dendritic transport(GO:0098937) |
| 4.1 | 60.8 | GO:0051231 | spindle elongation(GO:0051231) |
| 4.1 | 4.1 | GO:0033484 | nitric oxide homeostasis(GO:0033484) |
| 4.0 | 68.8 | GO:0043388 | positive regulation of DNA binding(GO:0043388) |
| 4.0 | 24.3 | GO:2000696 | regulation of epithelial cell differentiation involved in kidney development(GO:2000696) |
| 4.0 | 28.3 | GO:2000270 | negative regulation of fibroblast apoptotic process(GO:2000270) |
| 4.0 | 24.1 | GO:0097284 | hepatocyte apoptotic process(GO:0097284) |
| 4.0 | 36.0 | GO:0033683 | nucleotide-excision repair, DNA incision(GO:0033683) |
| 4.0 | 11.9 | GO:0002296 | T-helper 1 cell lineage commitment(GO:0002296) |
| 4.0 | 67.5 | GO:0040015 | negative regulation of multicellular organism growth(GO:0040015) |
| 4.0 | 71.4 | GO:0051642 | centrosome localization(GO:0051642) |
| 4.0 | 19.8 | GO:0006574 | valine catabolic process(GO:0006574) |
| 4.0 | 4.0 | GO:0090283 | regulation of protein glycosylation in Golgi(GO:0090283) |
| 3.9 | 19.7 | GO:0034721 | histone H3-K4 demethylation, trimethyl-H3-K4-specific(GO:0034721) |
| 3.9 | 11.8 | GO:0000738 | DNA catabolic process, exonucleolytic(GO:0000738) |
| 3.9 | 31.5 | GO:0015014 | heparan sulfate proteoglycan biosynthetic process, polysaccharide chain biosynthetic process(GO:0015014) |
| 3.9 | 3.9 | GO:0048295 | isotype switching to IgE isotypes(GO:0048289) regulation of isotype switching to IgE isotypes(GO:0048293) positive regulation of isotype switching to IgE isotypes(GO:0048295) |
| 3.9 | 19.5 | GO:0019050 | suppression by virus of host apoptotic process(GO:0019050) modulation by virus of host apoptotic process(GO:0039526) |
| 3.9 | 19.5 | GO:0002318 | myeloid progenitor cell differentiation(GO:0002318) |
| 3.8 | 19.2 | GO:0007619 | courtship behavior(GO:0007619) |
| 3.8 | 7.7 | GO:0060252 | positive regulation of glial cell proliferation(GO:0060252) |
| 3.8 | 15.3 | GO:1904977 | lymphatic endothelial cell migration(GO:1904977) |
| 3.8 | 15.2 | GO:0046368 | GDP-L-fucose metabolic process(GO:0046368) |
| 3.8 | 3.8 | GO:0070914 | UV-damage excision repair(GO:0070914) |
| 3.8 | 34.2 | GO:2000484 | positive regulation of interleukin-8 secretion(GO:2000484) |
| 3.8 | 3.8 | GO:0035574 | histone H4-K20 demethylation(GO:0035574) |
| 3.8 | 18.9 | GO:0000733 | DNA strand renaturation(GO:0000733) |
| 3.8 | 30.1 | GO:0006283 | transcription-coupled nucleotide-excision repair(GO:0006283) |
| 3.8 | 41.3 | GO:0072673 | lamellipodium morphogenesis(GO:0072673) |
| 3.8 | 11.3 | GO:0006741 | NADP biosynthetic process(GO:0006741) |
| 3.7 | 86.2 | GO:0009649 | entrainment of circadian clock(GO:0009649) |
| 3.7 | 15.0 | GO:0043382 | regulation of memory T cell differentiation(GO:0043380) positive regulation of memory T cell differentiation(GO:0043382) |
| 3.7 | 26.2 | GO:0007379 | segment specification(GO:0007379) |
| 3.7 | 18.7 | GO:0006564 | L-serine biosynthetic process(GO:0006564) |
| 3.7 | 37.4 | GO:0032905 | transforming growth factor beta1 production(GO:0032905) regulation of transforming growth factor beta1 production(GO:0032908) positive regulation of transforming growth factor beta1 production(GO:0032914) |
| 3.7 | 15.0 | GO:0010764 | negative regulation of fibroblast migration(GO:0010764) |
| 3.7 | 48.3 | GO:0032786 | positive regulation of DNA-templated transcription, elongation(GO:0032786) |
| 3.7 | 66.3 | GO:0032802 | low-density lipoprotein particle receptor catabolic process(GO:0032802) |
| 3.7 | 58.9 | GO:0006353 | DNA-templated transcription, termination(GO:0006353) |
| 3.7 | 18.4 | GO:0046490 | isopentenyl diphosphate biosynthetic process(GO:0009240) isopentenyl diphosphate metabolic process(GO:0046490) |
| 3.6 | 29.1 | GO:0000460 | maturation of 5.8S rRNA(GO:0000460) |
| 3.6 | 10.9 | GO:0060666 | dichotomous subdivision of terminal units involved in salivary gland branching(GO:0060666) |
| 3.6 | 25.4 | GO:0046449 | creatinine metabolic process(GO:0046449) |
| 3.6 | 39.9 | GO:0010579 | regulation of adenylate cyclase activity involved in G-protein coupled receptor signaling pathway(GO:0010578) positive regulation of adenylate cyclase activity involved in G-protein coupled receptor signaling pathway(GO:0010579) |
| 3.6 | 7.2 | GO:0042414 | epinephrine metabolic process(GO:0042414) epinephrine biosynthetic process(GO:0042418) |
| 3.6 | 57.7 | GO:2000637 | positive regulation of posttranscriptional gene silencing(GO:0060148) positive regulation of gene silencing by miRNA(GO:2000637) |
| 3.6 | 7.2 | GO:1901223 | negative regulation of NIK/NF-kappaB signaling(GO:1901223) |
| 3.6 | 3.6 | GO:0060368 | regulation of Fc receptor mediated stimulatory signaling pathway(GO:0060368) |
| 3.6 | 50.1 | GO:2000144 | positive regulation of DNA-templated transcription, initiation(GO:2000144) |
| 3.6 | 39.3 | GO:0007213 | G-protein coupled acetylcholine receptor signaling pathway(GO:0007213) |
| 3.6 | 7.1 | GO:0040031 | snRNA modification(GO:0040031) |
| 3.6 | 17.8 | GO:1903385 | regulation of homophilic cell adhesion(GO:1903385) |
| 3.6 | 17.8 | GO:0001878 | response to yeast(GO:0001878) |
| 3.6 | 24.9 | GO:0033123 | positive regulation of cyclic nucleotide catabolic process(GO:0030807) positive regulation of cAMP catabolic process(GO:0030822) positive regulation of purine nucleotide catabolic process(GO:0033123) |
| 3.5 | 7.1 | GO:0031291 | Ran protein signal transduction(GO:0031291) |
| 3.5 | 70.8 | GO:0071526 | semaphorin-plexin signaling pathway(GO:0071526) |
| 3.5 | 3.5 | GO:0007028 | cytoplasm organization(GO:0007028) |
| 3.5 | 102.2 | GO:0032392 | DNA geometric change(GO:0032392) |
| 3.5 | 6.9 | GO:0006221 | pyrimidine nucleotide biosynthetic process(GO:0006221) |
| 3.5 | 62.5 | GO:0006123 | mitochondrial electron transport, cytochrome c to oxygen(GO:0006123) |
| 3.5 | 6.9 | GO:0033600 | negative regulation of mammary gland epithelial cell proliferation(GO:0033600) |
| 3.5 | 3.5 | GO:0060268 | negative regulation of respiratory burst(GO:0060268) |
| 3.4 | 24.1 | GO:0032055 | negative regulation of translation in response to stress(GO:0032055) negative regulation of translational initiation in response to stress(GO:0032057) |
| 3.4 | 17.2 | GO:0035897 | proteolysis in other organism(GO:0035897) |
| 3.4 | 65.3 | GO:0090224 | regulation of mitotic spindle organization(GO:0060236) regulation of spindle organization(GO:0090224) |
| 3.4 | 181.5 | GO:0006334 | nucleosome assembly(GO:0006334) |
| 3.4 | 3.4 | GO:0038195 | urokinase plasminogen activator signaling pathway(GO:0038195) |
| 3.4 | 30.8 | GO:0045793 | positive regulation of cell size(GO:0045793) |
| 3.4 | 3.4 | GO:0010455 | positive regulation of cell fate commitment(GO:0010455) |
| 3.4 | 51.1 | GO:0031954 | positive regulation of protein autophosphorylation(GO:0031954) |
| 3.4 | 10.2 | GO:0032825 | positive regulation of natural killer cell differentiation(GO:0032825) |
| 3.4 | 33.8 | GO:0045191 | regulation of isotype switching(GO:0045191) |
| 3.4 | 3.4 | GO:0019858 | cytosine metabolic process(GO:0019858) |
| 3.4 | 3.4 | GO:0051792 | medium-chain fatty acid biosynthetic process(GO:0051792) |
| 3.4 | 67.2 | GO:2000188 | regulation of cholesterol homeostasis(GO:2000188) |
| 3.4 | 23.5 | GO:0060124 | positive regulation of growth hormone secretion(GO:0060124) |
| 3.3 | 23.4 | GO:0098881 | exocytic insertion of neurotransmitter receptor to plasma membrane(GO:0098881) exocytic insertion of neurotransmitter receptor to postsynaptic membrane(GO:0098967) |
| 3.3 | 20.1 | GO:0006050 | mannosamine metabolic process(GO:0006050) N-acetylmannosamine metabolic process(GO:0006051) |
| 3.3 | 6.7 | GO:0018312 | peptidyl-serine ADP-ribosylation(GO:0018312) |
| 3.3 | 23.4 | GO:1901741 | positive regulation of myoblast fusion(GO:1901741) |
| 3.3 | 23.3 | GO:0071332 | cellular response to fructose stimulus(GO:0071332) |
| 3.3 | 126.5 | GO:0006656 | phosphatidylcholine biosynthetic process(GO:0006656) |
| 3.3 | 36.6 | GO:0007077 | mitotic nuclear envelope disassembly(GO:0007077) |
| 3.3 | 36.3 | GO:0044818 | mitotic G2/M transition checkpoint(GO:0044818) |
| 3.3 | 29.3 | GO:0048227 | plasma membrane to endosome transport(GO:0048227) |
| 3.3 | 9.8 | GO:0048703 | embryonic viscerocranium morphogenesis(GO:0048703) |
| 3.2 | 9.7 | GO:0036079 | GDP-fucose transport(GO:0015783) purine nucleotide-sugar transport(GO:0036079) |
| 3.2 | 9.7 | GO:0060741 | prostate gland stromal morphogenesis(GO:0060741) |
| 3.2 | 9.7 | GO:0097264 | self proteolysis(GO:0097264) |
| 3.2 | 22.4 | GO:0042985 | negative regulation of amyloid precursor protein biosynthetic process(GO:0042985) |
| 3.2 | 25.6 | GO:0071455 | cellular response to hyperoxia(GO:0071455) |
| 3.2 | 19.2 | GO:0006983 | ER overload response(GO:0006983) |
| 3.2 | 9.6 | GO:0006642 | triglyceride mobilization(GO:0006642) |
| 3.2 | 63.6 | GO:0006754 | ATP biosynthetic process(GO:0006754) |
| 3.2 | 15.9 | GO:0009099 | branched-chain amino acid biosynthetic process(GO:0009082) leucine biosynthetic process(GO:0009098) valine biosynthetic process(GO:0009099) |
| 3.2 | 28.6 | GO:0071404 | cellular response to low-density lipoprotein particle stimulus(GO:0071404) |
| 3.2 | 6.3 | GO:0014067 | negative regulation of phosphatidylinositol 3-kinase signaling(GO:0014067) |
| 3.2 | 3.2 | GO:0061009 | common bile duct development(GO:0061009) |
| 3.2 | 22.1 | GO:0031468 | nuclear envelope reassembly(GO:0031468) |
| 3.1 | 81.4 | GO:0007520 | myoblast fusion(GO:0007520) |
| 3.1 | 37.5 | GO:0046040 | IMP metabolic process(GO:0046040) |
| 3.1 | 15.6 | GO:0045716 | positive regulation of low-density lipoprotein particle receptor biosynthetic process(GO:0045716) |
| 3.1 | 96.4 | GO:0048745 | smooth muscle tissue development(GO:0048745) |
| 3.1 | 15.5 | GO:0009052 | pentose-phosphate shunt, non-oxidative branch(GO:0009052) |
| 3.1 | 74.5 | GO:0071470 | cellular response to osmotic stress(GO:0071470) |
| 3.1 | 24.8 | GO:0032876 | negative regulation of DNA endoreduplication(GO:0032876) |
| 3.1 | 6.2 | GO:0001777 | T cell homeostatic proliferation(GO:0001777) regulation of T cell homeostatic proliferation(GO:0046013) |
| 3.1 | 48.9 | GO:0031648 | protein destabilization(GO:0031648) |
| 3.1 | 88.7 | GO:0006261 | DNA-dependent DNA replication(GO:0006261) |
| 3.1 | 3.1 | GO:0071680 | response to indole-3-methanol(GO:0071680) cellular response to indole-3-methanol(GO:0071681) |
| 3.0 | 21.3 | GO:0006750 | glutathione biosynthetic process(GO:0006750) |
| 3.0 | 15.2 | GO:0070383 | DNA cytosine deamination(GO:0070383) |
| 3.0 | 3.0 | GO:0061309 | cardiac neural crest cell development involved in outflow tract morphogenesis(GO:0061309) |
| 3.0 | 87.9 | GO:0051123 | RNA polymerase II transcriptional preinitiation complex assembly(GO:0051123) |
| 3.0 | 21.2 | GO:0030638 | polyketide metabolic process(GO:0030638) aminoglycoside antibiotic metabolic process(GO:0030647) daunorubicin metabolic process(GO:0044597) doxorubicin metabolic process(GO:0044598) |
| 3.0 | 6.1 | GO:0010225 | response to UV-C(GO:0010225) |
| 3.0 | 12.1 | GO:0019348 | dolichol metabolic process(GO:0019348) |
| 3.0 | 27.2 | GO:0014854 | response to inactivity(GO:0014854) response to muscle inactivity(GO:0014870) |
| 3.0 | 3.0 | GO:0060729 | intestinal epithelial structure maintenance(GO:0060729) |
| 3.0 | 90.3 | GO:1902402 | signal transduction involved in mitotic cell cycle checkpoint(GO:0072413) signal transduction involved in mitotic DNA damage checkpoint(GO:1902402) signal transduction involved in mitotic DNA integrity checkpoint(GO:1902403) |
| 3.0 | 12.0 | GO:0030579 | ubiquitin-dependent SMAD protein catabolic process(GO:0030579) |
| 3.0 | 45.0 | GO:0070534 | protein K63-linked ubiquitination(GO:0070534) |
| 3.0 | 86.3 | GO:0090383 | phagosome acidification(GO:0090383) |
| 3.0 | 8.9 | GO:0048819 | catagen(GO:0042637) positive regulation of hair follicle maturation(GO:0048818) regulation of hair follicle maturation(GO:0048819) regulation of catagen(GO:0051794) positive regulation of catagen(GO:0051795) |
| 3.0 | 32.6 | GO:0043101 | purine-containing compound salvage(GO:0043101) |
| 3.0 | 11.8 | GO:0003366 | cell-matrix adhesion involved in ameboidal cell migration(GO:0003366) |
| 3.0 | 8.9 | GO:0051683 | establishment of Golgi localization(GO:0051683) |
| 3.0 | 17.7 | GO:0002418 | immune response to tumor cell(GO:0002418) |
| 2.9 | 5.9 | GO:0051582 | positive regulation of neurotransmitter uptake(GO:0051582) positive regulation of dopamine uptake involved in synaptic transmission(GO:0051586) positive regulation of catecholamine uptake involved in synaptic transmission(GO:0051944) |
| 2.9 | 52.8 | GO:0033234 | negative regulation of protein sumoylation(GO:0033234) |
| 2.9 | 73.3 | GO:0032436 | positive regulation of proteasomal ubiquitin-dependent protein catabolic process(GO:0032436) |
| 2.9 | 14.5 | GO:0035246 | peptidyl-arginine N-methylation(GO:0035246) |
| 2.9 | 86.4 | GO:0000188 | inactivation of MAPK activity(GO:0000188) |
| 2.9 | 2.9 | GO:0035509 | negative regulation of myosin-light-chain-phosphatase activity(GO:0035509) negative regulation of bicellular tight junction assembly(GO:1903347) |
| 2.9 | 8.6 | GO:0051444 | negative regulation of ubiquitin-protein transferase activity(GO:0051444) |
| 2.8 | 5.7 | GO:0072008 | mesangial cell differentiation(GO:0072007) glomerular mesangial cell differentiation(GO:0072008) kidney interstitial fibroblast differentiation(GO:0072071) |
| 2.8 | 19.8 | GO:1905123 | regulation of glucosylceramidase activity(GO:1905123) |
| 2.8 | 36.6 | GO:0016180 | snRNA processing(GO:0016180) |
| 2.8 | 16.8 | GO:0090241 | negative regulation of histone H4 acetylation(GO:0090241) |
| 2.8 | 41.9 | GO:0046341 | CDP-diacylglycerol metabolic process(GO:0046341) |
| 2.8 | 8.3 | GO:0003064 | regulation of heart rate by hormone(GO:0003064) |
| 2.8 | 24.8 | GO:0030490 | maturation of SSU-rRNA(GO:0030490) |
| 2.8 | 16.5 | GO:0042026 | protein refolding(GO:0042026) |
| 2.8 | 104.7 | GO:0000245 | spliceosomal complex assembly(GO:0000245) |
| 2.8 | 16.5 | GO:0042492 | gamma-delta T cell differentiation(GO:0042492) |
| 2.7 | 19.2 | GO:0048387 | negative regulation of retinoic acid receptor signaling pathway(GO:0048387) |
| 2.7 | 76.5 | GO:0035329 | hippo signaling(GO:0035329) |
| 2.7 | 2.7 | GO:0090273 | positive regulation of pancreatic juice secretion(GO:0090187) regulation of somatostatin secretion(GO:0090273) positive regulation of somatostatin secretion(GO:0090274) |
| 2.7 | 8.1 | GO:0001845 | phagolysosome assembly(GO:0001845) |
| 2.7 | 10.8 | GO:0016973 | poly(A)+ mRNA export from nucleus(GO:0016973) |
| 2.7 | 8.0 | GO:0045324 | late endosome to vacuole transport(GO:0045324) |
| 2.7 | 34.8 | GO:2000659 | regulation of interleukin-1-mediated signaling pathway(GO:2000659) |
| 2.7 | 26.7 | GO:0033622 | integrin activation(GO:0033622) |
| 2.6 | 26.4 | GO:0045663 | positive regulation of myoblast differentiation(GO:0045663) |
| 2.6 | 39.5 | GO:0071353 | cellular response to interleukin-4(GO:0071353) |
| 2.6 | 55.2 | GO:0015721 | bile acid and bile salt transport(GO:0015721) |
| 2.6 | 20.8 | GO:0016139 | glycoside catabolic process(GO:0016139) |
| 2.6 | 13.0 | GO:0001887 | selenium compound metabolic process(GO:0001887) |
| 2.5 | 27.9 | GO:0043983 | histone H4-K12 acetylation(GO:0043983) |
| 2.5 | 397.9 | GO:0000377 | RNA splicing, via transesterification reactions with bulged adenosine as nucleophile(GO:0000377) mRNA splicing, via spliceosome(GO:0000398) |
| 2.5 | 95.5 | GO:0045214 | sarcomere organization(GO:0045214) |
| 2.5 | 12.5 | GO:1904355 | positive regulation of telomere capping(GO:1904355) |
| 2.5 | 5.0 | GO:0007518 | myoblast fate determination(GO:0007518) |
| 2.5 | 12.3 | GO:0033028 | myeloid cell apoptotic process(GO:0033028) |
| 2.5 | 110.8 | GO:0007062 | sister chromatid cohesion(GO:0007062) |
| 2.4 | 39.2 | GO:0046501 | protoporphyrinogen IX metabolic process(GO:0046501) |
| 2.4 | 26.9 | GO:0034384 | high-density lipoprotein particle clearance(GO:0034384) |
| 2.4 | 2.4 | GO:0090191 | negative regulation of branching involved in ureteric bud morphogenesis(GO:0090191) |
| 2.4 | 121.1 | GO:0006364 | rRNA processing(GO:0006364) |
| 2.4 | 64.8 | GO:0000301 | retrograde transport, vesicle recycling within Golgi(GO:0000301) |
| 2.4 | 9.6 | GO:0048743 | positive regulation of skeletal muscle fiber development(GO:0048743) |
| 2.4 | 38.2 | GO:0006101 | citrate metabolic process(GO:0006101) |
| 2.4 | 21.4 | GO:0050862 | positive regulation of T cell receptor signaling pathway(GO:0050862) |
| 2.4 | 7.1 | GO:0051016 | barbed-end actin filament capping(GO:0051016) |
| 2.4 | 2.4 | GO:0036023 | limb joint morphogenesis(GO:0036022) embryonic skeletal limb joint morphogenesis(GO:0036023) |
| 2.4 | 7.1 | GO:0002086 | diaphragm contraction(GO:0002086) |
| 2.4 | 2.4 | GO:0060374 | mast cell differentiation(GO:0060374) |
| 2.4 | 4.7 | GO:0035989 | tendon development(GO:0035989) |
| 2.4 | 7.1 | GO:0035811 | negative regulation of urine volume(GO:0035811) |
| 2.3 | 39.9 | GO:0043496 | regulation of protein homodimerization activity(GO:0043496) |
| 2.3 | 46.7 | GO:0050855 | regulation of B cell receptor signaling pathway(GO:0050855) |
| 2.3 | 23.2 | GO:0006122 | mitochondrial electron transport, ubiquinol to cytochrome c(GO:0006122) |
| 2.3 | 6.9 | GO:0038043 | interleukin-5-mediated signaling pathway(GO:0038043) |
| 2.3 | 2.3 | GO:0055093 | response to hyperoxia(GO:0055093) |
| 2.3 | 36.7 | GO:0045747 | positive regulation of Notch signaling pathway(GO:0045747) |
| 2.3 | 6.8 | GO:1901656 | glycoside transport(GO:1901656) |
| 2.3 | 9.0 | GO:0007097 | nuclear migration(GO:0007097) |
| 2.2 | 27.0 | GO:0060396 | growth hormone receptor signaling pathway(GO:0060396) |
| 2.2 | 24.6 | GO:0006552 | leucine metabolic process(GO:0006551) leucine catabolic process(GO:0006552) |
| 2.2 | 8.9 | GO:0051151 | negative regulation of smooth muscle cell differentiation(GO:0051151) |
| 2.2 | 26.5 | GO:0006527 | arginine catabolic process(GO:0006527) |
| 2.2 | 13.3 | GO:0035583 | sequestering of TGFbeta in extracellular matrix(GO:0035583) |
| 2.2 | 19.8 | GO:1902033 | regulation of hematopoietic stem cell proliferation(GO:1902033) |
| 2.2 | 2.2 | GO:0021562 | vestibulocochlear nerve development(GO:0021562) |
| 2.2 | 120.5 | GO:0006401 | RNA catabolic process(GO:0006401) |
| 2.2 | 8.7 | GO:0003150 | muscular septum morphogenesis(GO:0003150) |
| 2.2 | 13.1 | GO:0060576 | intestinal epithelial cell development(GO:0060576) |
| 2.2 | 19.6 | GO:0051084 | 'de novo' posttranslational protein folding(GO:0051084) |
| 2.2 | 4.3 | GO:0090136 | epithelial cell-cell adhesion(GO:0090136) |
| 2.2 | 10.8 | GO:0016255 | attachment of GPI anchor to protein(GO:0016255) |
| 2.2 | 13.0 | GO:0017182 | peptidyl-diphthamide metabolic process(GO:0017182) peptidyl-diphthamide biosynthetic process from peptidyl-histidine(GO:0017183) peptidyl-histidine modification(GO:0018202) |
| 2.1 | 4.3 | GO:0006474 | N-terminal protein amino acid acetylation(GO:0006474) |
| 2.1 | 21.4 | GO:0040023 | establishment of nucleus localization(GO:0040023) |
| 2.1 | 12.8 | GO:0051044 | positive regulation of membrane protein ectodomain proteolysis(GO:0051044) |
| 2.1 | 8.5 | GO:2000980 | regulation of auditory receptor cell differentiation(GO:0045607) regulation of mechanoreceptor differentiation(GO:0045631) regulation of inner ear receptor cell differentiation(GO:2000980) |
| 2.1 | 87.7 | GO:0006413 | translational initiation(GO:0006413) |
| 2.1 | 10.4 | GO:1902254 | negative regulation of intrinsic apoptotic signaling pathway by p53 class mediator(GO:1902254) |
| 2.1 | 10.3 | GO:0014886 | transition between slow and fast fiber(GO:0014886) |
| 2.1 | 80.5 | GO:0006414 | translational elongation(GO:0006414) |
| 2.1 | 51.5 | GO:0008210 | estrogen metabolic process(GO:0008210) |
| 2.1 | 14.4 | GO:0006880 | intracellular sequestering of iron ion(GO:0006880) sequestering of iron ion(GO:0097577) |
| 2.0 | 69.1 | GO:0006487 | protein N-linked glycosylation(GO:0006487) |
| 2.0 | 6.1 | GO:0002818 | intracellular defense response(GO:0002818) |
| 2.0 | 6.0 | GO:0032679 | TRAIL production(GO:0032639) regulation of TRAIL production(GO:0032679) positive regulation of TRAIL production(GO:0032759) |
| 2.0 | 12.1 | GO:0010898 | positive regulation of triglyceride catabolic process(GO:0010898) |
| 2.0 | 2.0 | GO:0071409 | cellular response to cycloheximide(GO:0071409) |
| 2.0 | 2.0 | GO:2000574 | regulation of microtubule motor activity(GO:2000574) |
| 2.0 | 6.0 | GO:0036481 | intrinsic apoptotic signaling pathway in response to hydrogen peroxide(GO:0036481) |
| 2.0 | 10.0 | GO:0021902 | commitment of neuronal cell to specific neuron type in forebrain(GO:0021902) |
| 2.0 | 21.7 | GO:0035162 | embryonic hemopoiesis(GO:0035162) |
| 2.0 | 5.9 | GO:0038165 | oncostatin-M-mediated signaling pathway(GO:0038165) |
| 2.0 | 3.9 | GO:0007182 | common-partner SMAD protein phosphorylation(GO:0007182) |
| 2.0 | 82.2 | GO:0018279 | peptidyl-asparagine modification(GO:0018196) protein N-linked glycosylation via asparagine(GO:0018279) |
| 1.9 | 5.8 | GO:0061042 | vascular wound healing(GO:0061042) |
| 1.9 | 3.8 | GO:0048535 | lymph node development(GO:0048535) |
| 1.9 | 5.7 | GO:0052501 | induction of programmed cell death(GO:0012502) positive regulation of apoptotic process in other organism(GO:0044533) positive regulation by symbiont of host programmed cell death(GO:0052042) positive regulation by organism of programmed cell death in other organism involved in symbiotic interaction(GO:0052330) positive regulation by organism of apoptotic process in other organism involved in symbiotic interaction(GO:0052501) |
| 1.9 | 9.6 | GO:0045579 | positive regulation of B cell differentiation(GO:0045579) |
| 1.9 | 1.9 | GO:0060166 | olfactory pit development(GO:0060166) |
| 1.9 | 3.8 | GO:0002415 | immunoglobulin transcytosis in epithelial cells mediated by polymeric immunoglobulin receptor(GO:0002415) |
| 1.9 | 1.9 | GO:0098917 | retrograde trans-synaptic signaling(GO:0098917) |
| 1.9 | 1.9 | GO:0033210 | leptin-mediated signaling pathway(GO:0033210) |
| 1.9 | 7.4 | GO:0051697 | protein delipidation(GO:0051697) |
| 1.8 | 11.1 | GO:0060033 | anatomical structure regression(GO:0060033) |
| 1.8 | 3.6 | GO:0031034 | myosin filament assembly(GO:0031034) |
| 1.8 | 7.3 | GO:0046882 | negative regulation of follicle-stimulating hormone secretion(GO:0046882) |
| 1.8 | 12.6 | GO:0071763 | nuclear membrane organization(GO:0071763) |
| 1.8 | 25.2 | GO:0051923 | sulfation(GO:0051923) |
| 1.8 | 24.9 | GO:0001542 | ovulation from ovarian follicle(GO:0001542) |
| 1.8 | 28.0 | GO:0031958 | corticosteroid receptor signaling pathway(GO:0031958) glucocorticoid receptor signaling pathway(GO:0042921) |
| 1.7 | 3.5 | GO:0036018 | cellular response to erythropoietin(GO:0036018) |
| 1.7 | 5.2 | GO:0009648 | photoperiodism(GO:0009648) |
| 1.7 | 3.4 | GO:0060434 | bronchus morphogenesis(GO:0060434) |
| 1.7 | 5.1 | GO:0048752 | semicircular canal morphogenesis(GO:0048752) |
| 1.7 | 18.8 | GO:0002089 | lens morphogenesis in camera-type eye(GO:0002089) |
| 1.7 | 1.7 | GO:0002351 | serotonin production involved in inflammatory response(GO:0002351) serotonin secretion involved in inflammatory response(GO:0002442) serotonin secretion by platelet(GO:0002554) |
| 1.7 | 1.7 | GO:0046642 | negative regulation of alpha-beta T cell proliferation(GO:0046642) |
| 1.6 | 8.0 | GO:0015692 | lead ion transport(GO:0015692) |
| 1.6 | 14.4 | GO:0034465 | response to carbon monoxide(GO:0034465) |
| 1.6 | 4.8 | GO:0055015 | ventricular cardiac muscle cell development(GO:0055015) |
| 1.6 | 12.7 | GO:0072513 | positive regulation of secondary heart field cardioblast proliferation(GO:0072513) |
| 1.6 | 22.2 | GO:0031639 | plasminogen activation(GO:0031639) |
| 1.6 | 17.4 | GO:0048251 | elastic fiber assembly(GO:0048251) |
| 1.6 | 11.0 | GO:0042797 | 5S class rRNA transcription from RNA polymerase III type 1 promoter(GO:0042791) tRNA transcription from RNA polymerase III promoter(GO:0042797) |
| 1.6 | 4.7 | GO:1902358 | sulfate transmembrane transport(GO:1902358) |
| 1.5 | 4.6 | GO:0000183 | chromatin silencing at rDNA(GO:0000183) |
| 1.5 | 19.9 | GO:0090161 | Golgi ribbon formation(GO:0090161) |
| 1.5 | 41.3 | GO:0032467 | positive regulation of cytokinesis(GO:0032467) |
| 1.5 | 4.6 | GO:0021569 | rhombomere 3 development(GO:0021569) |
| 1.5 | 6.1 | GO:0008635 | activation of cysteine-type endopeptidase activity involved in apoptotic process by cytochrome c(GO:0008635) |
| 1.5 | 4.6 | GO:0061724 | lipophagy(GO:0061724) |
| 1.5 | 9.1 | GO:0035518 | histone H2A monoubiquitination(GO:0035518) |
| 1.5 | 15.1 | GO:0046688 | response to copper ion(GO:0046688) |
| 1.5 | 1.5 | GO:0001916 | positive regulation of T cell mediated cytotoxicity(GO:0001916) |
| 1.5 | 4.5 | GO:0000212 | meiotic spindle organization(GO:0000212) |
| 1.5 | 16.4 | GO:0042455 | ribonucleoside biosynthetic process(GO:0042455) |
| 1.5 | 1.5 | GO:0031268 | pseudopodium organization(GO:0031268) |
| 1.5 | 8.8 | GO:0048643 | positive regulation of skeletal muscle tissue development(GO:0048643) |
| 1.5 | 2.9 | GO:0034378 | chylomicron assembly(GO:0034378) |
| 1.4 | 4.3 | GO:0035720 | intraciliary anterograde transport(GO:0035720) |
| 1.4 | 4.3 | GO:0006543 | glutamine catabolic process(GO:0006543) |
| 1.4 | 57.9 | GO:0061077 | chaperone-mediated protein folding(GO:0061077) |
| 1.4 | 1.4 | GO:2000001 | regulation of DNA damage checkpoint(GO:2000001) |
| 1.4 | 18.2 | GO:0033540 | fatty acid beta-oxidation using acyl-CoA oxidase(GO:0033540) |
| 1.4 | 15.4 | GO:2001288 | positive regulation of caveolin-mediated endocytosis(GO:2001288) |
| 1.4 | 33.5 | GO:0048009 | insulin-like growth factor receptor signaling pathway(GO:0048009) |
| 1.4 | 13.8 | GO:0051601 | exocyst localization(GO:0051601) |
| 1.4 | 2.7 | GO:0009650 | UV protection(GO:0009650) |
| 1.4 | 6.8 | GO:1990253 | cellular response to leucine starvation(GO:1990253) |
| 1.4 | 8.2 | GO:0008218 | bioluminescence(GO:0008218) |
| 1.4 | 27.2 | GO:0034198 | cellular response to amino acid starvation(GO:0034198) |
| 1.4 | 12.2 | GO:0042178 | xenobiotic catabolic process(GO:0042178) |
| 1.3 | 22.8 | GO:0061418 | regulation of transcription from RNA polymerase II promoter in response to hypoxia(GO:0061418) |
| 1.3 | 12.0 | GO:0035860 | glial cell-derived neurotrophic factor receptor signaling pathway(GO:0035860) |
| 1.3 | 19.5 | GO:0035987 | endodermal cell differentiation(GO:0035987) |
| 1.3 | 13.0 | GO:0000038 | very long-chain fatty acid metabolic process(GO:0000038) |
| 1.3 | 6.5 | GO:0016554 | cytidine to uridine editing(GO:0016554) |
| 1.3 | 1.3 | GO:0002901 | mature B cell apoptotic process(GO:0002901) regulation of mature B cell apoptotic process(GO:0002905) negative regulation of mature B cell apoptotic process(GO:0002906) |
| 1.3 | 1.3 | GO:0032425 | regulation of mismatch repair(GO:0032423) positive regulation of mismatch repair(GO:0032425) |
| 1.2 | 1.2 | GO:1901187 | regulation of ephrin receptor signaling pathway(GO:1901187) |
| 1.2 | 11.2 | GO:0010839 | negative regulation of keratinocyte proliferation(GO:0010839) |
| 1.2 | 3.7 | GO:0051775 | response to redox state(GO:0051775) |
| 1.2 | 14.8 | GO:0001709 | cell fate determination(GO:0001709) |
| 1.2 | 7.4 | GO:0002155 | thyroid hormone mediated signaling pathway(GO:0002154) regulation of thyroid hormone mediated signaling pathway(GO:0002155) kinin cascade(GO:0002254) plasma kallikrein-kinin cascade(GO:0002353) |
| 1.2 | 3.7 | GO:0061484 | hematopoietic stem cell homeostasis(GO:0061484) |
| 1.2 | 16.8 | GO:0008299 | isoprenoid biosynthetic process(GO:0008299) |
| 1.2 | 1.2 | GO:0031064 | negative regulation of histone deacetylation(GO:0031064) |
| 1.2 | 33.6 | GO:0061462 | protein localization to lysosome(GO:0061462) |
| 1.2 | 9.6 | GO:0034383 | low-density lipoprotein particle clearance(GO:0034383) |
| 1.2 | 8.4 | GO:0009651 | response to salt stress(GO:0009651) |
| 1.2 | 3.6 | GO:0033630 | positive regulation of cell adhesion mediated by integrin(GO:0033630) |
| 1.2 | 9.4 | GO:0071397 | cellular response to cholesterol(GO:0071397) |
| 1.2 | 4.7 | GO:0010643 | cell communication by chemical coupling(GO:0010643) |
| 1.2 | 1.2 | GO:0097320 | membrane tubulation(GO:0097320) |
| 1.2 | 20.9 | GO:0006891 | intra-Golgi vesicle-mediated transport(GO:0006891) |
| 1.2 | 10.4 | GO:0042149 | cellular response to glucose starvation(GO:0042149) |
| 1.1 | 12.4 | GO:0006739 | NADP metabolic process(GO:0006739) |
| 1.1 | 5.6 | GO:1990564 | protein polyufmylation(GO:1990564) protein K69-linked ufmylation(GO:1990592) |
| 1.1 | 5.6 | GO:0006054 | N-acetylneuraminate metabolic process(GO:0006054) |
| 1.1 | 7.7 | GO:0042401 | cellular biogenic amine biosynthetic process(GO:0042401) |
| 1.1 | 1.1 | GO:0035166 | post-embryonic hemopoiesis(GO:0035166) |
| 1.1 | 9.8 | GO:0060416 | response to growth hormone(GO:0060416) |
| 1.1 | 3.3 | GO:0070131 | positive regulation of mitochondrial translation(GO:0070131) |
| 1.1 | 5.4 | GO:0015842 | aminergic neurotransmitter loading into synaptic vesicle(GO:0015842) |
| 1.1 | 11.7 | GO:1903321 | negative regulation of protein modification by small protein conjugation or removal(GO:1903321) |
| 1.1 | 7.4 | GO:0030091 | protein repair(GO:0030091) |
| 1.0 | 2.1 | GO:0034499 | late endosome to Golgi transport(GO:0034499) |
| 1.0 | 5.2 | GO:1903027 | regulation of opsonization(GO:1903027) |
| 1.0 | 4.2 | GO:0071361 | cellular response to ethanol(GO:0071361) |
| 1.0 | 6.1 | GO:0090103 | cochlea morphogenesis(GO:0090103) |
| 1.0 | 2.0 | GO:0042659 | regulation of cell fate specification(GO:0042659) |
| 1.0 | 22.1 | GO:0009954 | proximal/distal pattern formation(GO:0009954) |
| 1.0 | 4.0 | GO:0060235 | lens induction in camera-type eye(GO:0060235) |
| 1.0 | 6.0 | GO:1903566 | positive regulation of protein localization to cilium(GO:1903566) |
| 1.0 | 3.9 | GO:0031507 | heterochromatin assembly(GO:0031507) |
| 1.0 | 1.0 | GO:0030862 | positive regulation of polarized epithelial cell differentiation(GO:0030862) |
| 1.0 | 5.9 | GO:0009437 | carnitine metabolic process(GO:0009437) |
| 1.0 | 1.9 | GO:0044130 | negative regulation of growth of symbiont in host(GO:0044130) |
| 1.0 | 39.7 | GO:0043171 | peptide catabolic process(GO:0043171) |
| 1.0 | 1.0 | GO:0034141 | positive regulation of toll-like receptor 3 signaling pathway(GO:0034141) |
| 0.9 | 2.8 | GO:0048170 | positive regulation of long-term neuronal synaptic plasticity(GO:0048170) |
| 0.9 | 2.8 | GO:0071360 | cellular response to exogenous dsRNA(GO:0071360) |
| 0.9 | 9.3 | GO:0045954 | positive regulation of natural killer cell mediated cytotoxicity(GO:0045954) |
| 0.9 | 12.9 | GO:0003334 | keratinocyte development(GO:0003334) |
| 0.9 | 8.1 | GO:0016576 | histone dephosphorylation(GO:0016576) |
| 0.9 | 2.7 | GO:0019276 | UDP-N-acetylgalactosamine metabolic process(GO:0019276) |
| 0.9 | 10.7 | GO:0006490 | oligosaccharide-lipid intermediate biosynthetic process(GO:0006490) |
| 0.9 | 13.2 | GO:0033139 | regulation of peptidyl-serine phosphorylation of STAT protein(GO:0033139) |
| 0.9 | 6.2 | GO:0001705 | ectoderm formation(GO:0001705) ectodermal cell fate commitment(GO:0001712) |
| 0.9 | 2.6 | GO:0090675 | intermicrovillar adhesion(GO:0090675) |
| 0.8 | 6.7 | GO:0007031 | peroxisome organization(GO:0007031) |
| 0.8 | 2.5 | GO:0002925 | positive regulation of humoral immune response mediated by circulating immunoglobulin(GO:0002925) |
| 0.8 | 0.8 | GO:0048625 | myoblast fate commitment(GO:0048625) |
| 0.8 | 1.6 | GO:0035425 | autocrine signaling(GO:0035425) |
| 0.8 | 4.9 | GO:0048875 | chemical homeostasis within a tissue(GO:0048875) |
| 0.8 | 2.4 | GO:0019064 | fusion of virus membrane with host plasma membrane(GO:0019064) membrane fusion involved in viral entry into host cell(GO:0039663) multi-organism membrane fusion(GO:0044800) |
| 0.8 | 4.6 | GO:0032472 | Golgi calcium ion homeostasis(GO:0032468) Golgi calcium ion transport(GO:0032472) |
| 0.8 | 9.2 | GO:0060510 | Type II pneumocyte differentiation(GO:0060510) |
| 0.8 | 3.0 | GO:0071732 | cellular response to nitric oxide(GO:0071732) |
| 0.8 | 23.3 | GO:0036498 | IRE1-mediated unfolded protein response(GO:0036498) |
| 0.7 | 0.7 | GO:0070295 | renal water absorption(GO:0070295) |
| 0.7 | 9.6 | GO:0061640 | cytoskeleton-dependent cytokinesis(GO:0061640) |
| 0.7 | 2.2 | GO:0045794 | negative regulation of cell volume(GO:0045794) |
| 0.7 | 8.8 | GO:0050690 | regulation of defense response to virus by virus(GO:0050690) |
| 0.7 | 3.6 | GO:0006537 | glutamate biosynthetic process(GO:0006537) |
| 0.7 | 1.4 | GO:2000196 | positive regulation of female gonad development(GO:2000196) |
| 0.7 | 7.1 | GO:0009313 | oligosaccharide catabolic process(GO:0009313) |
| 0.7 | 0.7 | GO:0002436 | immune complex clearance(GO:0002434) immune complex clearance by monocytes and macrophages(GO:0002436) regulation of immune complex clearance by monocytes and macrophages(GO:0090264) |
| 0.7 | 2.1 | GO:0045743 | positive regulation of fibroblast growth factor receptor signaling pathway(GO:0045743) |
| 0.7 | 14.2 | GO:0046339 | diacylglycerol metabolic process(GO:0046339) |
| 0.7 | 45.3 | GO:0016126 | sterol biosynthetic process(GO:0016126) |
| 0.7 | 0.7 | GO:0060157 | urinary bladder development(GO:0060157) |
| 0.7 | 0.7 | GO:0006678 | glucosylceramide metabolic process(GO:0006678) |
| 0.7 | 4.7 | GO:0003096 | renal sodium ion transport(GO:0003096) |
| 0.7 | 2.7 | GO:0018199 | peptidyl-glutamine modification(GO:0018199) |
| 0.6 | 1.3 | GO:2000359 | regulation of binding of sperm to zona pellucida(GO:2000359) |
| 0.6 | 3.2 | GO:1901202 | negative regulation of extracellular matrix assembly(GO:1901202) |
| 0.6 | 1.9 | GO:0060830 | ciliary receptor clustering involved in smoothened signaling pathway(GO:0060830) |
| 0.6 | 3.1 | GO:1902894 | negative regulation of pri-miRNA transcription from RNA polymerase II promoter(GO:1902894) |
| 0.6 | 3.1 | GO:1903361 | protein localization to basolateral plasma membrane(GO:1903361) |
| 0.6 | 1.2 | GO:0021764 | amygdala development(GO:0021764) |
| 0.6 | 12.5 | GO:0043525 | positive regulation of neuron apoptotic process(GO:0043525) |
| 0.6 | 1.8 | GO:0061536 | glycine secretion(GO:0061536) glycine secretion, neurotransmission(GO:0061537) |
| 0.6 | 1.7 | GO:0036500 | ATF6-mediated unfolded protein response(GO:0036500) |
| 0.6 | 1.2 | GO:0003164 | His-Purkinje system development(GO:0003164) |
| 0.6 | 1.2 | GO:0070874 | negative regulation of glycogen metabolic process(GO:0070874) |
| 0.6 | 11.9 | GO:0031529 | ruffle organization(GO:0031529) |
| 0.6 | 7.7 | GO:0051894 | positive regulation of focal adhesion assembly(GO:0051894) |
| 0.6 | 2.8 | GO:0061099 | negative regulation of protein tyrosine kinase activity(GO:0061099) |
| 0.5 | 12.1 | GO:0015893 | drug transport(GO:0015893) |
| 0.5 | 6.5 | GO:0042987 | amyloid precursor protein catabolic process(GO:0042987) |
| 0.5 | 0.5 | GO:0007343 | egg activation(GO:0007343) |
| 0.5 | 3.8 | GO:0046348 | amino sugar catabolic process(GO:0046348) |
| 0.5 | 0.5 | GO:0055012 | ventricular cardiac muscle cell differentiation(GO:0055012) |
| 0.5 | 6.3 | GO:0031915 | positive regulation of synaptic plasticity(GO:0031915) |
| 0.5 | 3.2 | GO:0098735 | positive regulation of the force of heart contraction(GO:0098735) |
| 0.5 | 2.1 | GO:1902080 | regulation of calcium ion import into sarcoplasmic reticulum(GO:1902080) negative regulation of calcium ion import into sarcoplasmic reticulum(GO:1902081) |
| 0.5 | 2.1 | GO:0035520 | monoubiquitinated protein deubiquitination(GO:0035520) |
| 0.5 | 5.7 | GO:0010501 | RNA secondary structure unwinding(GO:0010501) |
| 0.5 | 1.5 | GO:0002503 | peptide antigen assembly with MHC class II protein complex(GO:0002503) |
| 0.5 | 5.1 | GO:0015732 | prostaglandin transport(GO:0015732) |
| 0.5 | 2.5 | GO:0048596 | embryonic camera-type eye morphogenesis(GO:0048596) |
| 0.5 | 16.6 | GO:0045071 | negative regulation of viral genome replication(GO:0045071) |
| 0.5 | 1.0 | GO:0002638 | negative regulation of immunoglobulin production(GO:0002638) |
| 0.5 | 1.0 | GO:1902202 | regulation of hepatocyte growth factor receptor signaling pathway(GO:1902202) |
| 0.5 | 3.4 | GO:0032757 | positive regulation of interleukin-8 production(GO:0032757) |
| 0.5 | 1.5 | GO:0071799 | response to prostaglandin D(GO:0071798) cellular response to prostaglandin D stimulus(GO:0071799) |
| 0.5 | 10.2 | GO:0007216 | G-protein coupled glutamate receptor signaling pathway(GO:0007216) |
| 0.5 | 4.3 | GO:0070536 | protein K63-linked deubiquitination(GO:0070536) |
| 0.5 | 2.4 | GO:0070071 | proton-transporting two-sector ATPase complex assembly(GO:0070071) |
| 0.5 | 1.8 | GO:0007185 | transmembrane receptor protein tyrosine phosphatase signaling pathway(GO:0007185) |
| 0.4 | 0.4 | GO:0034163 | regulation of toll-like receptor 9 signaling pathway(GO:0034163) |
| 0.4 | 6.0 | GO:0045671 | negative regulation of osteoclast differentiation(GO:0045671) |
| 0.4 | 5.1 | GO:0046602 | regulation of mitotic centrosome separation(GO:0046602) |
| 0.4 | 1.7 | GO:2000741 | positive regulation of mesenchymal stem cell differentiation(GO:2000741) |
| 0.4 | 5.4 | GO:0030890 | positive regulation of B cell proliferation(GO:0030890) |
| 0.4 | 5.4 | GO:0045604 | regulation of epidermal cell differentiation(GO:0045604) |
| 0.4 | 1.7 | GO:0019509 | L-methionine biosynthetic process from methylthioadenosine(GO:0019509) |
| 0.4 | 7.9 | GO:0006611 | protein export from nucleus(GO:0006611) |
| 0.4 | 14.1 | GO:0006635 | fatty acid beta-oxidation(GO:0006635) |
| 0.4 | 1.9 | GO:1903299 | regulation of hexokinase activity(GO:1903299) |
| 0.4 | 0.7 | GO:0009138 | pyrimidine nucleoside diphosphate metabolic process(GO:0009138) |
| 0.4 | 20.4 | GO:0002377 | immunoglobulin production(GO:0002377) |
| 0.3 | 1.0 | GO:1902513 | regulation of organelle transport along microtubule(GO:1902513) |
| 0.3 | 1.0 | GO:0030037 | actin filament reorganization involved in cell cycle(GO:0030037) |
| 0.3 | 1.7 | GO:0050915 | sensory perception of sour taste(GO:0050915) |
| 0.3 | 0.3 | GO:0001915 | negative regulation of T cell mediated cytotoxicity(GO:0001915) |
| 0.3 | 2.3 | GO:0090005 | negative regulation of establishment of protein localization to plasma membrane(GO:0090005) |
| 0.3 | 0.3 | GO:0002679 | respiratory burst involved in defense response(GO:0002679) |
| 0.3 | 5.0 | GO:0035898 | parathyroid hormone secretion(GO:0035898) |
| 0.3 | 0.6 | GO:0015884 | folic acid transport(GO:0015884) |
| 0.3 | 1.8 | GO:0051560 | mitochondrial calcium ion homeostasis(GO:0051560) |
| 0.3 | 0.9 | GO:0032304 | negative regulation of icosanoid secretion(GO:0032304) |
| 0.3 | 6.7 | GO:0046031 | ADP metabolic process(GO:0046031) |
| 0.3 | 1.4 | GO:1904322 | response to forskolin(GO:1904321) cellular response to forskolin(GO:1904322) |
| 0.3 | 85.1 | GO:0042119 | neutrophil activation(GO:0042119) |
| 0.3 | 1.1 | GO:0031666 | positive regulation of lipopolysaccharide-mediated signaling pathway(GO:0031666) |
| 0.3 | 1.0 | GO:0009404 | toxin metabolic process(GO:0009404) |
| 0.3 | 1.3 | GO:0033227 | dsRNA transport(GO:0033227) |
| 0.2 | 0.2 | GO:0016199 | axon midline choice point recognition(GO:0016199) |
| 0.2 | 0.7 | GO:0070314 | G1 to G0 transition(GO:0070314) |
| 0.2 | 2.7 | GO:0002076 | osteoblast development(GO:0002076) |
| 0.2 | 0.4 | GO:0051798 | positive regulation of hair cycle(GO:0042635) positive regulation of hair follicle development(GO:0051798) |
| 0.2 | 11.4 | GO:0006626 | protein targeting to mitochondrion(GO:0006626) |
| 0.2 | 2.5 | GO:0042100 | B cell proliferation(GO:0042100) |
| 0.2 | 1.0 | GO:0043616 | keratinocyte proliferation(GO:0043616) |
| 0.2 | 0.4 | GO:0061739 | protein lipidation involved in autophagosome assembly(GO:0061739) |
| 0.2 | 0.7 | GO:0034334 | adherens junction maintenance(GO:0034334) |
| 0.2 | 1.1 | GO:0043536 | positive regulation of blood vessel endothelial cell migration(GO:0043536) |
| 0.2 | 15.1 | GO:0070268 | cornification(GO:0070268) |
| 0.2 | 0.8 | GO:0035970 | peptidyl-threonine dephosphorylation(GO:0035970) |
| 0.2 | 0.2 | GO:0007195 | adenylate cyclase-inhibiting dopamine receptor signaling pathway(GO:0007195) |
| 0.1 | 1.3 | GO:0007168 | receptor guanylyl cyclase signaling pathway(GO:0007168) |
| 0.1 | 0.3 | GO:2000381 | negative regulation of mesoderm development(GO:2000381) |
| 0.1 | 1.2 | GO:0071427 | mRNA export from nucleus(GO:0006406) mRNA-containing ribonucleoprotein complex export from nucleus(GO:0071427) |
| 0.1 | 0.1 | GO:0060300 | regulation of cytokine activity(GO:0060300) |
| 0.1 | 0.4 | GO:1900383 | regulation of synaptic plasticity by receptor localization to synapse(GO:1900383) |
| 0.1 | 0.2 | GO:0035995 | detection of muscle stretch(GO:0035995) |
| 0.1 | 0.2 | GO:0071372 | cellular response to follicle-stimulating hormone stimulus(GO:0071372) |
| 0.1 | 0.3 | GO:0097498 | endothelial tube lumen extension(GO:0097498) |
| 0.1 | 0.8 | GO:0014722 | regulation of skeletal muscle contraction by calcium ion signaling(GO:0014722) |
| 0.1 | 0.3 | GO:0032096 | negative regulation of response to food(GO:0032096) negative regulation of appetite(GO:0032099) |
| 0.1 | 0.1 | GO:0035791 | platelet-derived growth factor receptor-beta signaling pathway(GO:0035791) |
| 0.1 | 0.1 | GO:0010728 | regulation of hydrogen peroxide biosynthetic process(GO:0010728) |
| 0.1 | 0.1 | GO:0044805 | late nucleophagy(GO:0044805) |
| 0.1 | 0.2 | GO:0035048 | splicing factor protein import into nucleus(GO:0035048) |
| 0.0 | 0.7 | GO:0035902 | response to immobilization stress(GO:0035902) |
| 0.0 | 0.1 | GO:0010452 | histone H3-K36 methylation(GO:0010452) |
| 0.0 | 0.3 | GO:0035372 | protein localization to microtubule(GO:0035372) |
| 0.0 | 0.0 | GO:0061056 | sclerotome development(GO:0061056) |
| 0.0 | 0.2 | GO:0086100 | endothelin receptor signaling pathway(GO:0086100) |
| 0.0 | 0.6 | GO:0032434 | regulation of proteasomal ubiquitin-dependent protein catabolic process(GO:0032434) |
| 0.0 | 0.0 | GO:0070242 | thymocyte apoptotic process(GO:0070242) |
| 0.0 | 0.2 | GO:0060372 | regulation of atrial cardiac muscle cell membrane repolarization(GO:0060372) |
| 0.0 | 0.0 | GO:0097152 | mesenchymal cell apoptotic process(GO:0097152) regulation of mesenchymal cell apoptotic process(GO:2001053) |
Gene overrepresentation in cellular component category:
| Log-likelihood per target | Total log-likelihood | Term | Description |
|---|---|---|---|
| 63.5 | 254.0 | GO:1990356 | sumoylated E2 ligase complex(GO:1990356) |
| 50.0 | 200.1 | GO:0005971 | ribonucleoside-diphosphate reductase complex(GO:0005971) |
| 45.8 | 229.0 | GO:0031523 | Myb complex(GO:0031523) |
| 44.7 | 134.0 | GO:0036284 | tubulobulbar complex(GO:0036284) |
| 43.4 | 130.2 | GO:0034677 | integrin alpha7-beta1 complex(GO:0034677) |
| 36.3 | 435.9 | GO:0019773 | proteasome core complex, alpha-subunit complex(GO:0019773) |
| 34.2 | 171.0 | GO:0042643 | actomyosin, actin portion(GO:0042643) |
| 32.5 | 195.1 | GO:0005784 | Sec61 translocon complex(GO:0005784) translocon complex(GO:0071256) |
| 32.0 | 352.2 | GO:0071204 | histone pre-mRNA 3'end processing complex(GO:0071204) |
| 30.9 | 277.7 | GO:0005787 | signal peptidase complex(GO:0005787) |
| 29.7 | 89.1 | GO:0030289 | protein phosphatase 4 complex(GO:0030289) |
| 29.3 | 146.5 | GO:0097149 | centralspindlin complex(GO:0097149) |
| 28.6 | 142.8 | GO:0005683 | U7 snRNP(GO:0005683) |
| 28.2 | 112.8 | GO:0097125 | cyclin B1-CDK1 complex(GO:0097125) |
| 27.3 | 218.7 | GO:0000015 | phosphopyruvate hydratase complex(GO:0000015) |
| 26.5 | 265.1 | GO:0071541 | eukaryotic translation initiation factor 3 complex, eIF3m(GO:0071541) |
| 26.5 | 79.4 | GO:0016222 | procollagen-proline 4-dioxygenase complex(GO:0016222) |
| 26.4 | 105.6 | GO:0071159 | NF-kappaB complex(GO:0071159) |
| 26.4 | 237.2 | GO:0000125 | PCAF complex(GO:0000125) |
| 25.9 | 77.6 | GO:0017109 | glutamate-cysteine ligase complex(GO:0017109) |
| 25.9 | 25.9 | GO:0031371 | ubiquitin conjugating enzyme complex(GO:0031371) |
| 25.2 | 75.7 | GO:0045323 | interleukin-1 receptor complex(GO:0045323) |
| 25.0 | 200.1 | GO:0098559 | cytoplasmic side of early endosome membrane(GO:0098559) |
| 24.4 | 390.0 | GO:0005736 | DNA-directed RNA polymerase I complex(GO:0005736) |
| 24.0 | 143.7 | GO:0009368 | endopeptidase Clp complex(GO:0009368) |
| 23.2 | 162.5 | GO:0044354 | pinosome(GO:0044352) macropinosome(GO:0044354) |
| 22.9 | 114.4 | GO:0031436 | BRCA1-BARD1 complex(GO:0031436) |
| 22.8 | 274.2 | GO:0097487 | multivesicular body, internal vesicle(GO:0097487) |
| 22.8 | 250.8 | GO:0008541 | proteasome regulatory particle, lid subcomplex(GO:0008541) |
| 22.8 | 91.1 | GO:0071942 | XPC complex(GO:0071942) |
| 22.7 | 136.0 | GO:0097422 | tubular endosome(GO:0097422) |
| 22.5 | 157.7 | GO:1990111 | spermatoproteasome complex(GO:1990111) |
| 22.1 | 154.4 | GO:0016589 | NURF complex(GO:0016589) |
| 22.0 | 88.2 | GO:1990246 | uniplex complex(GO:1990246) |
| 21.9 | 306.9 | GO:0034663 | endoplasmic reticulum chaperone complex(GO:0034663) |
| 21.3 | 85.3 | GO:0071817 | MMXD complex(GO:0071817) |
| 20.8 | 62.4 | GO:1990038 | glial cytoplasmic inclusion(GO:0097409) classical Lewy body(GO:0097414) Lewy neurite(GO:0097462) Lewy body corona(GO:1990038) |
| 20.8 | 187.1 | GO:0072546 | ER membrane protein complex(GO:0072546) |
| 20.7 | 413.9 | GO:0005838 | proteasome regulatory particle(GO:0005838) |
| 20.5 | 82.2 | GO:0000811 | GINS complex(GO:0000811) |
| 20.3 | 264.0 | GO:0002199 | zona pellucida receptor complex(GO:0002199) |
| 20.1 | 260.9 | GO:0005688 | U6 snRNP(GO:0005688) |
| 19.8 | 138.6 | GO:0072588 | box H/ACA snoRNP complex(GO:0031429) box H/ACA RNP complex(GO:0072588) box H/ACA scaRNP complex(GO:0072589) box H/ACA telomerase RNP complex(GO:0090661) |
| 19.8 | 98.8 | GO:0033503 | HULC complex(GO:0033503) |
| 19.8 | 98.8 | GO:0070557 | PCNA-p21 complex(GO:0070557) |
| 19.4 | 38.9 | GO:1990730 | VCP-NSFL1C complex(GO:1990730) |
| 19.4 | 19.4 | GO:0097454 | Schwann cell microvillus(GO:0097454) |
| 19.2 | 76.9 | GO:0022624 | proteasome accessory complex(GO:0022624) |
| 19.0 | 94.8 | GO:0031597 | cytosolic proteasome complex(GO:0031597) |
| 18.6 | 111.4 | GO:0002178 | palmitoyltransferase complex(GO:0002178) |
| 18.5 | 73.9 | GO:0071986 | Ragulator complex(GO:0071986) |
| 18.4 | 92.1 | GO:0045272 | plasma membrane respiratory chain complex I(GO:0045272) |
| 18.3 | 183.2 | GO:0000940 | condensed chromosome outer kinetochore(GO:0000940) |
| 18.2 | 73.0 | GO:0005846 | nuclear cap binding complex(GO:0005846) |
| 17.9 | 143.5 | GO:0000796 | condensin complex(GO:0000796) |
| 17.8 | 35.5 | GO:0001651 | dense fibrillar component(GO:0001651) |
| 17.6 | 87.9 | GO:0043625 | delta DNA polymerase complex(GO:0043625) |
| 17.0 | 51.1 | GO:1990298 | mitotic checkpoint complex(GO:0033597) bub1-bub3 complex(GO:1990298) |
| 16.9 | 50.6 | GO:0018444 | translation release factor complex(GO:0018444) |
| 16.5 | 66.2 | GO:0071920 | cleavage body(GO:0071920) |
| 16.5 | 49.5 | GO:0043259 | laminin-10 complex(GO:0043259) |
| 16.4 | 16.4 | GO:0035068 | micro-ribonucleoprotein complex(GO:0035068) |
| 16.3 | 48.8 | GO:0044393 | microspike(GO:0044393) |
| 16.1 | 451.8 | GO:0005763 | organellar small ribosomal subunit(GO:0000314) mitochondrial small ribosomal subunit(GO:0005763) |
| 16.1 | 128.9 | GO:0019907 | cyclin-dependent protein kinase activating kinase holoenzyme complex(GO:0019907) |
| 15.8 | 79.2 | GO:0008274 | gamma-tubulin large complex(GO:0000931) gamma-tubulin ring complex(GO:0008274) |
| 15.8 | 110.8 | GO:0016272 | prefoldin complex(GO:0016272) |
| 15.7 | 188.9 | GO:0008250 | oligosaccharyltransferase complex(GO:0008250) |
| 15.7 | 31.5 | GO:1990023 | mitotic spindle midzone(GO:1990023) |
| 15.7 | 31.4 | GO:0034666 | integrin alpha2-beta1 complex(GO:0034666) |
| 15.6 | 140.4 | GO:0042382 | paraspeckles(GO:0042382) |
| 15.6 | 202.6 | GO:0042555 | MCM complex(GO:0042555) |
| 15.5 | 62.2 | GO:0002189 | ribose phosphate diphosphokinase complex(GO:0002189) |
| 15.3 | 168.1 | GO:0042612 | MHC class I protein complex(GO:0042612) |
| 15.3 | 45.8 | GO:0030689 | Noc complex(GO:0030689) |
| 15.2 | 182.8 | GO:0008290 | F-actin capping protein complex(GO:0008290) |
| 15.0 | 90.0 | GO:0042824 | MHC class I peptide loading complex(GO:0042824) |
| 15.0 | 45.0 | GO:1990723 | cytoplasmic periphery of the nuclear pore complex(GO:1990723) |
| 15.0 | 30.0 | GO:0031262 | Ndc80 complex(GO:0031262) |
| 14.8 | 14.8 | GO:0005687 | U4 snRNP(GO:0005687) |
| 14.6 | 161.0 | GO:0005853 | eukaryotic translation elongation factor 1 complex(GO:0005853) |
| 14.6 | 145.9 | GO:0097255 | R2TP complex(GO:0097255) |
| 14.5 | 406.6 | GO:0005680 | anaphase-promoting complex(GO:0005680) |
| 14.5 | 144.9 | GO:0000506 | glycosylphosphatidylinositol-N-acetylglucosaminyltransferase (GPI-GnT) complex(GO:0000506) |
| 14.5 | 86.9 | GO:0031298 | replication fork protection complex(GO:0031298) |
| 14.5 | 231.6 | GO:0031080 | nuclear pore outer ring(GO:0031080) |
| 14.5 | 563.7 | GO:0005762 | organellar large ribosomal subunit(GO:0000315) mitochondrial large ribosomal subunit(GO:0005762) |
| 14.3 | 57.0 | GO:0031510 | SUMO activating enzyme complex(GO:0031510) |
| 14.1 | 126.9 | GO:0090543 | Flemming body(GO:0090543) |
| 14.0 | 126.3 | GO:0032133 | chromosome passenger complex(GO:0032133) |
| 13.8 | 41.3 | GO:0033565 | ESCRT-0 complex(GO:0033565) |
| 13.5 | 135.5 | GO:0034709 | methylosome(GO:0034709) |
| 13.3 | 173.5 | GO:0045275 | mitochondrial respiratory chain complex III(GO:0005750) respiratory chain complex III(GO:0045275) |
| 13.1 | 183.6 | GO:0070938 | contractile ring(GO:0070938) |
| 13.1 | 52.4 | GO:0001405 | presequence translocase-associated import motor(GO:0001405) |
| 13.1 | 65.5 | GO:0000214 | tRNA-intron endonuclease complex(GO:0000214) |
| 13.0 | 182.5 | GO:0005862 | muscle thin filament tropomyosin(GO:0005862) |
| 13.0 | 221.6 | GO:0005885 | Arp2/3 protein complex(GO:0005885) |
| 13.0 | 103.8 | GO:0032541 | cortical endoplasmic reticulum(GO:0032541) |
| 12.8 | 64.2 | GO:0032301 | MutSalpha complex(GO:0032301) |
| 12.8 | 217.3 | GO:0034098 | VCP-NPL4-UFD1 AAA ATPase complex(GO:0034098) |
| 12.7 | 25.4 | GO:0035061 | interchromatin granule(GO:0035061) |
| 12.5 | 50.1 | GO:0005960 | glycine cleavage complex(GO:0005960) |
| 12.3 | 197.1 | GO:0044233 | ER-mitochondrion membrane contact site(GO:0044233) |
| 12.2 | 36.7 | GO:0000939 | condensed chromosome inner kinetochore(GO:0000939) |
| 12.2 | 97.9 | GO:0031616 | spindle pole centrosome(GO:0031616) |
| 12.2 | 73.2 | GO:0005785 | signal recognition particle receptor complex(GO:0005785) |
| 12.0 | 601.4 | GO:0009295 | nucleoid(GO:0009295) mitochondrial nucleoid(GO:0042645) |
| 12.0 | 48.1 | GO:0030915 | Smc5-Smc6 complex(GO:0030915) |
| 12.0 | 96.1 | GO:0019774 | proteasome core complex, beta-subunit complex(GO:0019774) |
| 12.0 | 251.7 | GO:0032433 | filopodium tip(GO:0032433) |
| 12.0 | 47.9 | GO:0043541 | UDP-N-acetylglucosamine transferase complex(GO:0043541) |
| 11.9 | 59.3 | GO:0005839 | proteasome core complex(GO:0005839) |
| 11.9 | 11.9 | GO:0034667 | integrin alpha3-beta1 complex(GO:0034667) |
| 11.8 | 58.9 | GO:0045281 | mitochondrial respiratory chain complex II, succinate dehydrogenase complex (ubiquinone)(GO:0005749) succinate dehydrogenase complex (ubiquinone)(GO:0045257) respiratory chain complex II(GO:0045273) succinate dehydrogenase complex(GO:0045281) fumarate reductase complex(GO:0045283) |
| 11.7 | 210.3 | GO:0005852 | eukaryotic translation initiation factor 3 complex(GO:0005852) |
| 11.6 | 127.7 | GO:0072357 | PTW/PP1 phosphatase complex(GO:0072357) |
| 11.6 | 254.6 | GO:0000502 | proteasome complex(GO:0000502) |
| 11.5 | 34.6 | GO:0043159 | acrosomal matrix(GO:0043159) |
| 11.5 | 69.0 | GO:0000172 | ribonuclease MRP complex(GO:0000172) |
| 11.4 | 57.0 | GO:0045293 | MIS complex(GO:0036396) mRNA editing complex(GO:0045293) |
| 11.3 | 79.3 | GO:0005832 | chaperonin-containing T-complex(GO:0005832) |
| 11.2 | 56.2 | GO:0005663 | DNA replication factor C complex(GO:0005663) |
| 11.2 | 56.1 | GO:0032449 | CBM complex(GO:0032449) |
| 11.1 | 178.3 | GO:0070578 | RISC-loading complex(GO:0070578) |
| 11.1 | 77.8 | GO:0031415 | NatA complex(GO:0031415) |
| 11.1 | 88.4 | GO:0098575 | lumenal side of lysosomal membrane(GO:0098575) |
| 11.0 | 99.4 | GO:0002193 | MAML1-RBP-Jkappa- ICN1 complex(GO:0002193) |
| 10.9 | 120.1 | GO:0016593 | Cdc73/Paf1 complex(GO:0016593) |
| 10.8 | 227.1 | GO:0035098 | ESC/E(Z) complex(GO:0035098) |
| 10.8 | 32.4 | GO:0072669 | tRNA-splicing ligase complex(GO:0072669) |
| 10.8 | 21.6 | GO:0030981 | cortical microtubule cytoskeleton(GO:0030981) |
| 10.7 | 42.7 | GO:0030905 | retromer, tubulation complex(GO:0030905) |
| 10.7 | 42.7 | GO:0005732 | small nucleolar ribonucleoprotein complex(GO:0005732) |
| 10.6 | 42.4 | GO:0005715 | late recombination nodule(GO:0005715) |
| 10.5 | 42.1 | GO:1990357 | terminal web(GO:1990357) |
| 10.5 | 1124.3 | GO:0015934 | large ribosomal subunit(GO:0015934) |
| 10.5 | 31.5 | GO:0035370 | UBC13-UEV1A complex(GO:0035370) |
| 10.2 | 81.8 | GO:0005851 | eukaryotic translation initiation factor 2B complex(GO:0005851) |
| 10.2 | 91.7 | GO:0042719 | mitochondrial intermembrane space protein transporter complex(GO:0042719) |
| 10.2 | 142.4 | GO:0005686 | U2 snRNP(GO:0005686) |
| 10.2 | 30.5 | GO:1990913 | sperm head plasma membrane(GO:1990913) ooplasm(GO:1990917) |
| 10.1 | 50.7 | GO:0030062 | mitochondrial tricarboxylic acid cycle enzyme complex(GO:0030062) |
| 10.1 | 80.8 | GO:0048500 | signal recognition particle, endoplasmic reticulum targeting(GO:0005786) signal recognition particle(GO:0048500) |
| 10.1 | 171.5 | GO:0005665 | DNA-directed RNA polymerase II, core complex(GO:0005665) |
| 10.1 | 10.1 | GO:0036195 | muscle cell projection(GO:0036194) muscle cell projection membrane(GO:0036195) |
| 10.0 | 180.6 | GO:0030014 | CCR4-NOT complex(GO:0030014) |
| 10.0 | 59.8 | GO:0061617 | MICOS complex(GO:0061617) |
| 9.9 | 49.5 | GO:0001939 | female pronucleus(GO:0001939) |
| 9.9 | 19.8 | GO:0033185 | dolichol-phosphate-mannose synthase complex(GO:0033185) |
| 9.8 | 294.3 | GO:0031143 | pseudopodium(GO:0031143) |
| 9.8 | 1114.4 | GO:0035578 | azurophil granule lumen(GO:0035578) |
| 9.7 | 87.3 | GO:0044754 | autolysosome(GO:0044754) |
| 9.7 | 48.4 | GO:0089701 | U2AF(GO:0089701) |
| 9.6 | 48.1 | GO:0034388 | Pwp2p-containing subcomplex of 90S preribosome(GO:0034388) |
| 9.5 | 47.6 | GO:0043564 | Ku70:Ku80 complex(GO:0043564) |
| 9.5 | 47.4 | GO:0000408 | EKC/KEOPS complex(GO:0000408) |
| 9.5 | 28.4 | GO:0048237 | rough endoplasmic reticulum lumen(GO:0048237) |
| 9.3 | 9.3 | GO:0034750 | Scrib-APC-beta-catenin complex(GO:0034750) |
| 9.3 | 120.3 | GO:0016600 | flotillin complex(GO:0016600) |
| 9.1 | 36.3 | GO:0097057 | TRAF2-GSTP1 complex(GO:0097057) |
| 9.0 | 63.2 | GO:0044530 | supraspliceosomal complex(GO:0044530) |
| 9.0 | 9.0 | GO:0097342 | ripoptosome(GO:0097342) |
| 9.0 | 53.8 | GO:0017101 | aminoacyl-tRNA synthetase multienzyme complex(GO:0017101) |
| 8.9 | 53.6 | GO:0005610 | laminin-5 complex(GO:0005610) |
| 8.9 | 79.8 | GO:0005672 | transcription factor TFIIA complex(GO:0005672) |
| 8.9 | 150.5 | GO:0030127 | COPII vesicle coat(GO:0030127) |
| 8.8 | 17.7 | GO:0005845 | mRNA cap binding complex(GO:0005845) |
| 8.7 | 78.1 | GO:0070531 | BRCA1-A complex(GO:0070531) |
| 8.4 | 1206.7 | GO:0042470 | melanosome(GO:0042470) pigment granule(GO:0048770) |
| 8.3 | 16.7 | GO:0005850 | eukaryotic translation initiation factor 2 complex(GO:0005850) |
| 8.3 | 108.3 | GO:0000176 | nuclear exosome (RNase complex)(GO:0000176) |
| 8.3 | 41.6 | GO:0005658 | alpha DNA polymerase:primase complex(GO:0005658) |
| 8.3 | 58.0 | GO:0032021 | NELF complex(GO:0032021) |
| 8.0 | 48.1 | GO:0005742 | mitochondrial outer membrane translocase complex(GO:0005742) |
| 8.0 | 79.6 | GO:0097197 | tetraspanin-enriched microdomain(GO:0097197) |
| 7.9 | 268.7 | GO:0071564 | npBAF complex(GO:0071564) |
| 7.8 | 156.5 | GO:0005684 | U2-type spliceosomal complex(GO:0005684) |
| 7.8 | 23.4 | GO:1990393 | 3M complex(GO:1990393) |
| 7.8 | 93.0 | GO:0031464 | Cul4A-RING E3 ubiquitin ligase complex(GO:0031464) |
| 7.7 | 54.1 | GO:0030677 | ribonuclease P complex(GO:0030677) |
| 7.7 | 177.7 | GO:0005844 | polysome(GO:0005844) |
| 7.7 | 23.1 | GO:0098799 | outer mitochondrial membrane protein complex(GO:0098799) |
| 7.7 | 92.0 | GO:0090544 | BAF-type complex(GO:0090544) |
| 7.7 | 61.3 | GO:0000110 | nucleotide-excision repair factor 1 complex(GO:0000110) |
| 7.6 | 38.2 | GO:0070381 | endosome to plasma membrane transport vesicle(GO:0070381) |
| 7.6 | 160.1 | GO:0031305 | intrinsic component of mitochondrial inner membrane(GO:0031304) integral component of mitochondrial inner membrane(GO:0031305) |
| 7.6 | 22.8 | GO:0048269 | methionine adenosyltransferase complex(GO:0048269) |
| 7.6 | 121.7 | GO:0042405 | nuclear inclusion body(GO:0042405) |
| 7.5 | 67.9 | GO:0000177 | cytoplasmic exosome (RNase complex)(GO:0000177) |
| 7.5 | 497.0 | GO:0022627 | cytosolic small ribosomal subunit(GO:0022627) |
| 7.5 | 30.1 | GO:0042765 | GPI-anchor transamidase complex(GO:0042765) |
| 7.5 | 1088.1 | GO:1904813 | ficolin-1-rich granule(GO:0101002) ficolin-1-rich granule lumen(GO:1904813) |
| 7.5 | 59.9 | GO:0051286 | cell tip(GO:0051286) |
| 7.4 | 51.6 | GO:0001520 | outer dense fiber(GO:0001520) |
| 7.4 | 80.9 | GO:0005638 | lamin filament(GO:0005638) |
| 7.3 | 36.6 | GO:0012507 | ER to Golgi transport vesicle membrane(GO:0012507) |
| 7.3 | 65.5 | GO:0000347 | THO complex(GO:0000347) THO complex part of transcription export complex(GO:0000445) |
| 7.2 | 72.3 | GO:0032059 | bleb(GO:0032059) |
| 7.2 | 50.2 | GO:0035985 | senescence-associated heterochromatin focus(GO:0035985) |
| 7.2 | 64.4 | GO:0036449 | microtubule minus-end(GO:0036449) |
| 7.1 | 591.1 | GO:0005643 | nuclear pore(GO:0005643) |
| 7.1 | 21.2 | GO:0005588 | collagen type V trimer(GO:0005588) |
| 7.0 | 1149.8 | GO:0005681 | spliceosomal complex(GO:0005681) |
| 7.0 | 612.7 | GO:0005758 | mitochondrial intermembrane space(GO:0005758) |
| 6.9 | 206.8 | GO:0016469 | proton-transporting two-sector ATPase complex(GO:0016469) |
| 6.9 | 220.5 | GO:0030687 | preribosome, large subunit precursor(GO:0030687) |
| 6.8 | 61.3 | GO:0001673 | male germ cell nucleus(GO:0001673) |
| 6.7 | 13.5 | GO:1990726 | Lsm1-7-Pat1 complex(GO:1990726) |
| 6.7 | 379.7 | GO:0005876 | spindle microtubule(GO:0005876) |
| 6.7 | 99.8 | GO:0030663 | COPI-coated vesicle membrane(GO:0030663) |
| 6.7 | 133.1 | GO:0070822 | Sin3-type complex(GO:0070822) |
| 6.6 | 32.8 | GO:0030532 | small nuclear ribonucleoprotein complex(GO:0030532) |
| 6.6 | 72.1 | GO:0035692 | macrophage migration inhibitory factor receptor complex(GO:0035692) |
| 6.4 | 12.9 | GO:0031332 | RISC complex(GO:0016442) RNAi effector complex(GO:0031332) |
| 6.2 | 31.2 | GO:0000178 | exosome (RNase complex)(GO:0000178) |
| 6.2 | 130.7 | GO:0070971 | endoplasmic reticulum exit site(GO:0070971) |
| 6.1 | 18.3 | GO:0071065 | alpha9-beta1 integrin-vascular cell adhesion molecule-1 complex(GO:0071065) |
| 6.1 | 48.8 | GO:0070652 | HAUS complex(GO:0070652) |
| 6.0 | 54.4 | GO:0000808 | origin recognition complex(GO:0000808) nuclear origin of replication recognition complex(GO:0005664) |
| 6.0 | 24.2 | GO:0044307 | dendritic branch(GO:0044307) |
| 6.0 | 24.2 | GO:0048179 | activin receptor complex(GO:0048179) |
| 6.0 | 65.9 | GO:0045254 | pyruvate dehydrogenase complex(GO:0045254) |
| 6.0 | 411.0 | GO:0000779 | condensed chromosome, centromeric region(GO:0000779) |
| 5.9 | 17.8 | GO:0000798 | nuclear cohesin complex(GO:0000798) |
| 5.8 | 29.2 | GO:0032044 | DSIF complex(GO:0032044) |
| 5.8 | 23.3 | GO:0034385 | very-low-density lipoprotein particle(GO:0034361) triglyceride-rich lipoprotein particle(GO:0034385) |
| 5.8 | 34.8 | GO:1990452 | Parkin-FBXW7-Cul1 ubiquitin ligase complex(GO:1990452) |
| 5.8 | 23.1 | GO:0031467 | Cul7-RING ubiquitin ligase complex(GO:0031467) |
| 5.8 | 34.6 | GO:0032311 | angiogenin-PRI complex(GO:0032311) |
| 5.8 | 63.3 | GO:0044666 | MLL3/4 complex(GO:0044666) |
| 5.7 | 310.1 | GO:0010494 | cytoplasmic stress granule(GO:0010494) |
| 5.7 | 51.2 | GO:0035749 | myelin sheath adaxonal region(GO:0035749) |
| 5.6 | 158.1 | GO:0000421 | autophagosome membrane(GO:0000421) |
| 5.6 | 242.8 | GO:0000307 | cyclin-dependent protein kinase holoenzyme complex(GO:0000307) |
| 5.6 | 73.2 | GO:0005662 | DNA replication factor A complex(GO:0005662) |
| 5.6 | 44.7 | GO:0002169 | 3-methylcrotonyl-CoA carboxylase complex, mitochondrial(GO:0002169) methylcrotonoyl-CoA carboxylase complex(GO:1905202) |
| 5.6 | 83.7 | GO:0030867 | rough endoplasmic reticulum membrane(GO:0030867) |
| 5.5 | 71.9 | GO:0034993 | microtubule organizing center attachment site(GO:0034992) LINC complex(GO:0034993) |
| 5.5 | 55.1 | GO:0097443 | sorting endosome(GO:0097443) |
| 5.5 | 43.9 | GO:0071203 | WASH complex(GO:0071203) |
| 5.5 | 137.0 | GO:0031264 | death-inducing signaling complex(GO:0031264) |
| 5.5 | 87.3 | GO:0038201 | TORC2 complex(GO:0031932) TOR complex(GO:0038201) |
| 5.4 | 38.1 | GO:0097413 | Lewy body(GO:0097413) |
| 5.4 | 16.3 | GO:0098554 | cytoplasmic side of endoplasmic reticulum membrane(GO:0098554) |
| 5.4 | 118.5 | GO:0030056 | hemidesmosome(GO:0030056) |
| 5.4 | 171.6 | GO:0000776 | kinetochore(GO:0000776) |
| 5.4 | 16.1 | GO:0034686 | integrin alphav-beta8 complex(GO:0034686) |
| 5.3 | 31.7 | GO:0005916 | fascia adherens(GO:0005916) |
| 5.3 | 100.1 | GO:0035861 | site of double-strand break(GO:0035861) |
| 5.3 | 63.0 | GO:0030008 | TRAPP complex(GO:0030008) |
| 5.2 | 5.2 | GO:0035189 | Rb-E2F complex(GO:0035189) |
| 5.2 | 219.3 | GO:0035577 | azurophil granule membrane(GO:0035577) |
| 5.2 | 5.2 | GO:0032807 | DNA ligase IV complex(GO:0032807) |
| 5.2 | 177.2 | GO:0005669 | transcription factor TFIID complex(GO:0005669) |
| 5.1 | 20.5 | GO:0033257 | Bcl3/NF-kappaB2 complex(GO:0033257) |
| 5.1 | 301.0 | GO:0033116 | endoplasmic reticulum-Golgi intermediate compartment membrane(GO:0033116) |
| 5.1 | 5.1 | GO:0005899 | insulin receptor complex(GO:0005899) |
| 4.9 | 44.5 | GO:0016281 | eukaryotic translation initiation factor 4F complex(GO:0016281) |
| 4.9 | 2299.9 | GO:0005925 | focal adhesion(GO:0005925) |
| 4.9 | 19.5 | GO:0032937 | SREBP-SCAP-Insig complex(GO:0032937) |
| 4.8 | 14.4 | GO:1902636 | kinociliary basal body(GO:1902636) |
| 4.8 | 38.4 | GO:0031209 | SCAR complex(GO:0031209) |
| 4.8 | 19.1 | GO:0036513 | Derlin-1 retrotranslocation complex(GO:0036513) |
| 4.7 | 250.1 | GO:0005747 | mitochondrial respiratory chain complex I(GO:0005747) NADH dehydrogenase complex(GO:0030964) respiratory chain complex I(GO:0045271) |
| 4.7 | 18.9 | GO:0005675 | holo TFIIH complex(GO:0005675) carboxy-terminal domain protein kinase complex(GO:0032806) |
| 4.6 | 27.9 | GO:0010369 | chromocenter(GO:0010369) |
| 4.6 | 41.6 | GO:0071144 | SMAD2-SMAD3 protein complex(GO:0071144) |
| 4.6 | 83.1 | GO:0005640 | nuclear outer membrane(GO:0005640) |
| 4.6 | 13.8 | GO:0035517 | PR-DUB complex(GO:0035517) |
| 4.6 | 68.9 | GO:0005671 | Ada2/Gcn5/Ada3 transcription activator complex(GO:0005671) |
| 4.5 | 9.1 | GO:0033276 | transcription factor TFTC complex(GO:0033276) |
| 4.4 | 65.7 | GO:0001891 | phagocytic cup(GO:0001891) |
| 4.4 | 61.1 | GO:0031229 | integral component of nuclear inner membrane(GO:0005639) intrinsic component of nuclear inner membrane(GO:0031229) nuclear membrane part(GO:0044453) |
| 4.3 | 21.7 | GO:0034688 | integrin alphaM-beta2 complex(GO:0034688) |
| 4.3 | 12.9 | GO:0005958 | DNA-dependent protein kinase-DNA ligase 4 complex(GO:0005958) |
| 4.3 | 51.4 | GO:0000815 | ESCRT III complex(GO:0000815) |
| 4.2 | 4.2 | GO:1990075 | periciliary membrane compartment(GO:1990075) |
| 4.2 | 25.4 | GO:0033256 | I-kappaB/NF-kappaB complex(GO:0033256) |
| 4.2 | 29.6 | GO:0000153 | cytoplasmic ubiquitin ligase complex(GO:0000153) |
| 4.2 | 33.5 | GO:0005587 | collagen type IV trimer(GO:0005587) |
| 4.2 | 8.3 | GO:0070939 | Dsl1p complex(GO:0070939) |
| 4.2 | 29.2 | GO:0030686 | 90S preribosome(GO:0030686) |
| 4.2 | 83.3 | GO:0005719 | nuclear euchromatin(GO:0005719) |
| 4.2 | 16.6 | GO:0046581 | intercellular canaliculus(GO:0046581) |
| 4.1 | 12.4 | GO:0020016 | ciliary pocket(GO:0020016) ciliary pocket membrane(GO:0020018) |
| 4.1 | 36.8 | GO:0070449 | elongin complex(GO:0070449) |
| 4.1 | 32.6 | GO:0016011 | dystroglycan complex(GO:0016011) |
| 4.0 | 12.1 | GO:0030312 | external encapsulating structure(GO:0030312) |
| 4.0 | 19.9 | GO:0070765 | gamma-secretase complex(GO:0070765) |
| 4.0 | 11.9 | GO:0071148 | TEAD-1-YAP complex(GO:0071148) |
| 3.9 | 7.8 | GO:0070761 | pre-snoRNP complex(GO:0070761) |
| 3.9 | 42.7 | GO:0032039 | integrator complex(GO:0032039) |
| 3.9 | 42.5 | GO:0097470 | ribbon synapse(GO:0097470) |
| 3.9 | 23.1 | GO:0071797 | LUBAC complex(GO:0071797) |
| 3.8 | 30.4 | GO:0005915 | zonula adherens(GO:0005915) |
| 3.8 | 105.9 | GO:0032592 | integral component of mitochondrial membrane(GO:0032592) |
| 3.8 | 41.5 | GO:0042105 | alpha-beta T cell receptor complex(GO:0042105) |
| 3.7 | 26.0 | GO:0030904 | retromer complex(GO:0030904) |
| 3.7 | 602.3 | GO:0031968 | mitochondrial outer membrane(GO:0005741) organelle outer membrane(GO:0031968) |
| 3.7 | 11.1 | GO:0034457 | Mpp10 complex(GO:0034457) |
| 3.7 | 11.0 | GO:0030936 | collagen type XIII trimer(GO:0005600) transmembrane collagen trimer(GO:0030936) |
| 3.7 | 22.1 | GO:0032389 | MutLalpha complex(GO:0032389) |
| 3.7 | 3.7 | GO:0043260 | laminin-11 complex(GO:0043260) |
| 3.6 | 219.0 | GO:0000793 | condensed chromosome(GO:0000793) |
| 3.6 | 3.6 | GO:0034518 | RNA cap binding complex(GO:0034518) |
| 3.6 | 25.0 | GO:0000124 | SAGA complex(GO:0000124) |
| 3.6 | 21.3 | GO:0070554 | synaptobrevin 2-SNAP-25-syntaxin-3-complexin complex(GO:0070554) |
| 3.5 | 109.3 | GO:0008180 | COP9 signalosome(GO:0008180) |
| 3.4 | 58.4 | GO:0030122 | AP-2 adaptor complex(GO:0030122) |
| 3.4 | 164.5 | GO:0031907 | peroxisomal matrix(GO:0005782) microbody lumen(GO:0031907) |
| 3.4 | 23.8 | GO:0001741 | XY body(GO:0001741) |
| 3.4 | 233.3 | GO:0005913 | cell-cell adherens junction(GO:0005913) |
| 3.3 | 33.4 | GO:0005751 | mitochondrial respiratory chain complex IV(GO:0005751) |
| 3.3 | 16.4 | GO:1990425 | ryanodine receptor complex(GO:1990425) |
| 3.1 | 9.4 | GO:0070876 | SOSS complex(GO:0070876) |
| 3.0 | 15.2 | GO:0005854 | nascent polypeptide-associated complex(GO:0005854) |
| 3.0 | 116.6 | GO:0005840 | ribosome(GO:0005840) |
| 3.0 | 74.2 | GO:0030670 | phagocytic vesicle membrane(GO:0030670) |
| 3.0 | 29.6 | GO:0002102 | podosome(GO:0002102) |
| 2.9 | 58.8 | GO:0043205 | microfibril(GO:0001527) fibril(GO:0043205) |
| 2.9 | 34.7 | GO:0016591 | DNA-directed RNA polymerase II, holoenzyme(GO:0016591) |
| 2.8 | 234.8 | GO:0070821 | tertiary granule membrane(GO:0070821) |
| 2.8 | 2.8 | GO:0000805 | X chromosome(GO:0000805) |
| 2.8 | 16.5 | GO:0031088 | platelet dense granule membrane(GO:0031088) |
| 2.7 | 35.3 | GO:0030125 | clathrin vesicle coat(GO:0030125) |
| 2.7 | 78.5 | GO:0005637 | nuclear inner membrane(GO:0005637) |
| 2.7 | 18.7 | GO:0031465 | Cul4B-RING E3 ubiquitin ligase complex(GO:0031465) |
| 2.6 | 21.0 | GO:0061689 | tricellular tight junction(GO:0061689) |
| 2.6 | 28.8 | GO:0034364 | high-density lipoprotein particle(GO:0034364) |
| 2.6 | 7.8 | GO:0005873 | plus-end kinesin complex(GO:0005873) |
| 2.6 | 79.4 | GO:0032420 | stereocilium(GO:0032420) |
| 2.5 | 55.5 | GO:0031092 | platelet alpha granule membrane(GO:0031092) |
| 2.5 | 7.5 | GO:0070195 | growth hormone receptor complex(GO:0070195) |
| 2.5 | 2.5 | GO:0005797 | Golgi medial cisterna(GO:0005797) |
| 2.5 | 495.2 | GO:0005743 | mitochondrial inner membrane(GO:0005743) |
| 2.4 | 16.6 | GO:0045239 | tricarboxylic acid cycle enzyme complex(GO:0045239) |
| 2.4 | 52.1 | GO:0030992 | intraciliary transport particle B(GO:0030992) |
| 2.4 | 7.1 | GO:0030688 | preribosome, small subunit precursor(GO:0030688) |
| 2.4 | 40.2 | GO:0031528 | microvillus membrane(GO:0031528) |
| 2.3 | 41.4 | GO:0031089 | platelet dense granule lumen(GO:0031089) |
| 2.3 | 34.3 | GO:0031362 | anchored component of external side of plasma membrane(GO:0031362) |
| 2.2 | 15.4 | GO:0070187 | telosome(GO:0070187) |
| 2.2 | 2.2 | GO:0005606 | laminin-1 complex(GO:0005606) |
| 2.1 | 23.5 | GO:0017119 | Golgi transport complex(GO:0017119) |
| 2.1 | 59.9 | GO:0005902 | microvillus(GO:0005902) |
| 2.1 | 19.2 | GO:0071339 | MLL1/2 complex(GO:0044665) MLL1 complex(GO:0071339) |
| 2.1 | 19.1 | GO:0044194 | cytolytic granule(GO:0044194) |
| 2.1 | 24.9 | GO:0005697 | telomerase holoenzyme complex(GO:0005697) |
| 2.0 | 22.4 | GO:0005666 | DNA-directed RNA polymerase III complex(GO:0005666) |
| 2.0 | 81.1 | GO:0000784 | nuclear chromosome, telomeric region(GO:0000784) |
| 2.0 | 2.0 | GO:0072557 | IPAF inflammasome complex(GO:0072557) |
| 2.0 | 21.9 | GO:0033202 | Ino80 complex(GO:0031011) DNA helicase complex(GO:0033202) |
| 2.0 | 55.7 | GO:0005605 | basal lamina(GO:0005605) |
| 2.0 | 7.9 | GO:0033263 | CORVET complex(GO:0033263) |
| 2.0 | 141.8 | GO:0032580 | Golgi cisterna membrane(GO:0032580) |
| 2.0 | 3.9 | GO:0033186 | CAF-1 complex(GO:0033186) |
| 1.9 | 1.9 | GO:1990462 | omegasome(GO:1990462) |
| 1.9 | 9.7 | GO:0001739 | sex chromatin(GO:0001739) |
| 1.9 | 15.4 | GO:1990909 | Wnt signalosome(GO:1990909) |
| 1.9 | 5.7 | GO:0097452 | GAIT complex(GO:0097452) |
| 1.9 | 15.3 | GO:0005790 | smooth endoplasmic reticulum(GO:0005790) |
| 1.9 | 11.3 | GO:0032279 | asymmetric synapse(GO:0032279) |
| 1.9 | 5.6 | GO:0036021 | endolysosome lumen(GO:0036021) |
| 1.9 | 3.8 | GO:0070435 | Shc-EGFR complex(GO:0070435) |
| 1.9 | 22.4 | GO:0030684 | preribosome(GO:0030684) |
| 1.8 | 18.4 | GO:0008385 | IkappaB kinase complex(GO:0008385) |
| 1.8 | 12.7 | GO:0030478 | actin cap(GO:0030478) |
| 1.8 | 1.8 | GO:0035867 | alphav-beta3 integrin-IGF-1-IGF1R complex(GO:0035867) |
| 1.8 | 34.5 | GO:0031588 | nucleotide-activated protein kinase complex(GO:0031588) |
| 1.8 | 9.0 | GO:0034719 | SMN-Sm protein complex(GO:0034719) |
| 1.8 | 123.6 | GO:0042579 | peroxisome(GO:0005777) microbody(GO:0042579) |
| 1.8 | 82.9 | GO:0035580 | specific granule lumen(GO:0035580) |
| 1.8 | 7.0 | GO:0033553 | rDNA heterochromatin(GO:0033553) |
| 1.8 | 15.8 | GO:0033588 | Elongator holoenzyme complex(GO:0033588) |
| 1.7 | 5.2 | GO:0002081 | outer acrosomal membrane(GO:0002081) |
| 1.7 | 3.4 | GO:0032777 | Piccolo NuA4 histone acetyltransferase complex(GO:0032777) |
| 1.7 | 1.7 | GO:0034271 | phosphatidylinositol 3-kinase complex, class III, type I(GO:0034271) phosphatidylinositol 3-kinase complex, class III, type II(GO:0034272) |
| 1.7 | 69.0 | GO:0035579 | specific granule membrane(GO:0035579) |
| 1.6 | 51.4 | GO:0000159 | protein phosphatase type 2A complex(GO:0000159) |
| 1.6 | 6.4 | GO:0097038 | perinuclear endoplasmic reticulum(GO:0097038) |
| 1.6 | 266.7 | GO:0005819 | spindle(GO:0005819) |
| 1.6 | 11.0 | GO:0000127 | transcription factor TFIIIC complex(GO:0000127) |
| 1.5 | 6.2 | GO:0097059 | CNTFR-CLCF1 complex(GO:0097059) |
| 1.5 | 1079.6 | GO:0005730 | nucleolus(GO:0005730) |
| 1.5 | 3.0 | GO:0055087 | Ski complex(GO:0055087) |
| 1.4 | 51.9 | GO:0005793 | endoplasmic reticulum-Golgi intermediate compartment(GO:0005793) |
| 1.4 | 2.8 | GO:0005740 | mitochondrial envelope(GO:0005740) |
| 1.4 | 49.1 | GO:0031093 | platelet alpha granule lumen(GO:0031093) |
| 1.4 | 51.3 | GO:0045095 | keratin filament(GO:0045095) |
| 1.3 | 5.3 | GO:0031010 | ISWI-type complex(GO:0031010) |
| 1.3 | 73.8 | GO:0031966 | mitochondrial membrane(GO:0031966) |
| 1.3 | 121.6 | GO:0090575 | RNA polymerase II transcription factor complex(GO:0090575) |
| 1.2 | 293.8 | GO:0005759 | mitochondrial matrix(GO:0005759) |
| 1.2 | 15.8 | GO:0035327 | transcriptionally active chromatin(GO:0035327) |
| 1.2 | 8.5 | GO:0097449 | astrocyte projection(GO:0097449) |
| 1.2 | 3.5 | GO:0005592 | collagen type XI trimer(GO:0005592) |
| 1.1 | 4.5 | GO:0042581 | specific granule(GO:0042581) |
| 1.1 | 4.5 | GO:0072558 | NLRP1 inflammasome complex(GO:0072558) |
| 1.1 | 122.5 | GO:0030176 | integral component of endoplasmic reticulum membrane(GO:0030176) |
| 1.1 | 2.2 | GO:0030134 | ER to Golgi transport vesicle(GO:0030134) |
| 1.1 | 1.1 | GO:0098642 | network-forming collagen trimer(GO:0098642) collagen network(GO:0098645) |
| 1.1 | 5.4 | GO:0031254 | uropod(GO:0001931) cell trailing edge(GO:0031254) |
| 1.1 | 2.2 | GO:0070022 | transforming growth factor beta receptor homodimeric complex(GO:0070022) |
| 1.1 | 6.4 | GO:0030140 | trans-Golgi network transport vesicle(GO:0030140) |
| 1.1 | 15.0 | GO:0005868 | cytoplasmic dynein complex(GO:0005868) |
| 1.0 | 69.6 | GO:0017053 | transcriptional repressor complex(GO:0017053) |
| 1.0 | 3.9 | GO:0005677 | chromatin silencing complex(GO:0005677) |
| 1.0 | 1.9 | GO:0033150 | perinuclear theca(GO:0033011) cytoskeletal calyx(GO:0033150) |
| 0.9 | 3.6 | GO:0071595 | Nem1-Spo7 phosphatase complex(GO:0071595) |
| 0.8 | 1823.3 | GO:0070062 | extracellular exosome(GO:0070062) |
| 0.8 | 7.1 | GO:1990712 | HFE-transferrin receptor complex(GO:1990712) |
| 0.8 | 3.1 | GO:0043196 | varicosity(GO:0043196) |
| 0.7 | 18.4 | GO:0000118 | histone deacetylase complex(GO:0000118) |
| 0.7 | 0.7 | GO:0098592 | cytoplasmic side of apical plasma membrane(GO:0098592) |
| 0.7 | 1.4 | GO:0031970 | organelle envelope lumen(GO:0031970) |
| 0.7 | 2.0 | GO:0043511 | inhibin complex(GO:0043511) inhibin A complex(GO:0043512) |
| 0.6 | 1.9 | GO:0097486 | multivesicular body lumen(GO:0097486) |
| 0.6 | 3.0 | GO:1902560 | GMP reductase complex(GO:1902560) |
| 0.6 | 4.8 | GO:0035686 | sperm fibrous sheath(GO:0035686) |
| 0.6 | 2.9 | GO:0000306 | extrinsic component of vacuolar membrane(GO:0000306) extrinsic component of endosome membrane(GO:0031313) |
| 0.5 | 2.5 | GO:0005943 | phosphatidylinositol 3-kinase complex, class IA(GO:0005943) |
| 0.5 | 2.4 | GO:0043291 | RAVE complex(GO:0043291) |
| 0.5 | 9.0 | GO:0032432 | actin filament bundle(GO:0032432) |
| 0.5 | 11.9 | GO:0005791 | rough endoplasmic reticulum(GO:0005791) |
| 0.4 | 16.3 | GO:0005811 | lipid particle(GO:0005811) |
| 0.3 | 2.3 | GO:0061574 | ASAP complex(GO:0061574) |
| 0.3 | 4.1 | GO:0032982 | myosin filament(GO:0032982) |
| 0.3 | 1.2 | GO:0031466 | Cul5-RING ubiquitin ligase complex(GO:0031466) |
| 0.3 | 16.4 | GO:0016605 | PML body(GO:0016605) |
| 0.2 | 15.5 | GO:0032993 | protein-DNA complex(GO:0032993) |
| 0.2 | 41.4 | GO:0005635 | nuclear envelope(GO:0005635) |
| 0.1 | 1.3 | GO:0097524 | sperm plasma membrane(GO:0097524) |
| 0.1 | 1.8 | GO:0030669 | clathrin-coated endocytic vesicle membrane(GO:0030669) |
| 0.1 | 0.5 | GO:0030895 | apolipoprotein B mRNA editing enzyme complex(GO:0030895) |
| 0.1 | 0.3 | GO:0005583 | fibrillar collagen trimer(GO:0005583) banded collagen fibril(GO:0098643) |
Gene overrepresentation in molecular function category:
| Log-likelihood per target | Total log-likelihood | Term | Description |
|---|---|---|---|
| 63.5 | 254.0 | GO:0061656 | SUMO conjugating enzyme activity(GO:0061656) |
| 56.4 | 225.5 | GO:0071208 | histone pre-mRNA DCP binding(GO:0071208) |
| 50.0 | 200.1 | GO:0004748 | ribonucleoside-diphosphate reductase activity, thioredoxin disulfide as acceptor(GO:0004748) oxidoreductase activity, acting on CH or CH2 groups, disulfide as acceptor(GO:0016728) ribonucleoside-diphosphate reductase activity(GO:0061731) |
| 47.7 | 143.1 | GO:0098808 | mRNA cap binding(GO:0098808) |
| 42.3 | 169.2 | GO:0044378 | non-sequence-specific DNA binding, bending(GO:0044378) |
| 41.3 | 123.9 | GO:0003974 | UDP-N-acetylglucosamine 4-epimerase activity(GO:0003974) UDP-glucose 4-epimerase activity(GO:0003978) |
| 39.0 | 116.9 | GO:0004170 | dUTP diphosphatase activity(GO:0004170) |
| 39.0 | 116.9 | GO:0009041 | uridylate kinase activity(GO:0009041) |
| 37.7 | 188.5 | GO:0034988 | Fc-gamma receptor I complex binding(GO:0034988) |
| 36.7 | 183.5 | GO:0019834 | phospholipase A2 inhibitor activity(GO:0019834) |
| 36.0 | 108.1 | GO:0004450 | isocitrate dehydrogenase (NADP+) activity(GO:0004450) |
| 35.2 | 105.6 | GO:0004132 | dCMP deaminase activity(GO:0004132) |
| 34.9 | 104.8 | GO:0016784 | 3-mercaptopyruvate sulfurtransferase activity(GO:0016784) |
| 34.6 | 173.1 | GO:0016744 | transferase activity, transferring aldehyde or ketonic groups(GO:0016744) |
| 32.6 | 97.8 | GO:0010698 | acetyltransferase activator activity(GO:0010698) |
| 30.8 | 184.6 | GO:0061575 | cyclin-dependent protein serine/threonine kinase activator activity(GO:0061575) |
| 30.4 | 121.8 | GO:0070320 | inward rectifier potassium channel inhibitor activity(GO:0070320) |
| 30.3 | 91.0 | GO:0015137 | citrate transmembrane transporter activity(GO:0015137) tricarboxylic acid transmembrane transporter activity(GO:0015142) |
| 30.3 | 90.8 | GO:0004165 | dodecenoyl-CoA delta-isomerase activity(GO:0004165) |
| 30.1 | 210.6 | GO:0061133 | endopeptidase activator activity(GO:0061133) |
| 29.7 | 89.2 | GO:0030337 | DNA polymerase processivity factor activity(GO:0030337) |
| 27.6 | 82.7 | GO:0008427 | calcium-dependent protein kinase inhibitor activity(GO:0008427) |
| 27.4 | 82.1 | GO:0005519 | cytoskeletal regulatory protein binding(GO:0005519) |
| 27.3 | 218.7 | GO:0004634 | phosphopyruvate hydratase activity(GO:0004634) |
| 26.8 | 107.2 | GO:0004360 | glutamine-fructose-6-phosphate transaminase (isomerizing) activity(GO:0004360) |
| 26.7 | 133.6 | GO:0047280 | nicotinamide phosphoribosyltransferase activity(GO:0047280) |
| 25.9 | 77.6 | GO:0004357 | glutamate-cysteine ligase activity(GO:0004357) |
| 25.9 | 155.1 | GO:0004849 | uridine kinase activity(GO:0004849) |
| 25.7 | 154.2 | GO:0043023 | ribosomal large subunit binding(GO:0043023) |
| 25.6 | 205.0 | GO:0015288 | porin activity(GO:0015288) |
| 25.4 | 76.1 | GO:0005046 | KDEL sequence binding(GO:0005046) |
| 24.7 | 98.8 | GO:0033897 | ribonuclease T2 activity(GO:0033897) |
| 24.5 | 440.8 | GO:0001055 | RNA polymerase II activity(GO:0001055) |
| 24.4 | 121.9 | GO:0004774 | succinate-CoA ligase activity(GO:0004774) |
| 23.8 | 71.5 | GO:0047315 | kynurenine-glyoxylate transaminase activity(GO:0047315) |
| 23.3 | 651.8 | GO:0070003 | threonine-type endopeptidase activity(GO:0004298) threonine-type peptidase activity(GO:0070003) |
| 23.0 | 161.0 | GO:0032217 | riboflavin transporter activity(GO:0032217) |
| 22.9 | 45.8 | GO:0016774 | phosphotransferase activity, carboxyl group as acceptor(GO:0016774) |
| 22.9 | 137.2 | GO:0019238 | cyclohydrolase activity(GO:0019238) |
| 22.7 | 250.0 | GO:0004791 | thioredoxin-disulfide reductase activity(GO:0004791) |
| 22.5 | 67.4 | GO:0070259 | tyrosyl-DNA phosphodiesterase activity(GO:0070259) |
| 22.2 | 199.6 | GO:0031730 | CCR5 chemokine receptor binding(GO:0031730) |
| 22.0 | 88.1 | GO:0002060 | purine nucleobase binding(GO:0002060) |
| 21.9 | 219.1 | GO:0010859 | calcium-dependent cysteine-type endopeptidase inhibitor activity(GO:0010859) |
| 21.9 | 109.5 | GO:0004656 | procollagen-proline 4-dioxygenase activity(GO:0004656) |
| 21.8 | 87.4 | GO:0010858 | calcium-dependent protein kinase regulator activity(GO:0010858) |
| 21.8 | 130.7 | GO:0046979 | TAP2 binding(GO:0046979) |
| 21.8 | 87.1 | GO:0003883 | CTP synthase activity(GO:0003883) |
| 21.5 | 85.9 | GO:0008508 | bile acid:sodium symporter activity(GO:0008508) |
| 21.4 | 214.0 | GO:1990948 | ligase inhibitor activity(GO:0055104) ubiquitin ligase inhibitor activity(GO:1990948) |
| 21.4 | 64.1 | GO:0070991 | medium-chain-acyl-CoA dehydrogenase activity(GO:0070991) |
| 21.1 | 147.5 | GO:0005497 | androgen binding(GO:0005497) |
| 20.9 | 104.6 | GO:0016668 | oxidoreductase activity, acting on a sulfur group of donors, NAD(P) as acceptor(GO:0016668) |
| 20.5 | 61.4 | GO:0051717 | inositol-1,3,4,5-tetrakisphosphate 3-phosphatase activity(GO:0051717) |
| 20.4 | 122.6 | GO:0017150 | tRNA dihydrouridine synthase activity(GO:0017150) |
| 20.3 | 81.3 | GO:0043515 | kinetochore binding(GO:0043515) |
| 20.1 | 80.2 | GO:0033677 | DNA/RNA helicase activity(GO:0033677) |
| 20.0 | 20.0 | GO:0004345 | glucose-6-phosphate dehydrogenase activity(GO:0004345) |
| 20.0 | 280.1 | GO:0031386 | protein tag(GO:0031386) |
| 20.0 | 60.0 | GO:0032767 | copper-dependent protein binding(GO:0032767) |
| 19.8 | 138.6 | GO:0034513 | box H/ACA snoRNA binding(GO:0034513) |
| 19.7 | 118.4 | GO:0004704 | NF-kappaB-inducing kinase activity(GO:0004704) |
| 19.6 | 78.3 | GO:0004001 | adenosine kinase activity(GO:0004001) |
| 19.5 | 78.2 | GO:0044388 | small protein activating enzyme binding(GO:0044388) |
| 19.5 | 58.5 | GO:0008426 | protein kinase C inhibitor activity(GO:0008426) |
| 19.5 | 58.5 | GO:0004998 | transferrin receptor activity(GO:0004998) |
| 19.3 | 135.0 | GO:0004457 | lactate dehydrogenase activity(GO:0004457) L-lactate dehydrogenase activity(GO:0004459) |
| 19.2 | 76.8 | GO:0071987 | WD40-repeat domain binding(GO:0071987) |
| 19.0 | 228.5 | GO:1990247 | N6-methyladenosine-containing RNA binding(GO:1990247) |
| 18.9 | 75.5 | GO:0070180 | large ribosomal subunit rRNA binding(GO:0070180) |
| 18.8 | 56.5 | GO:0004566 | beta-glucuronidase activity(GO:0004566) |
| 18.8 | 56.3 | GO:0004766 | spermidine synthase activity(GO:0004766) |
| 18.7 | 168.4 | GO:0036402 | proteasome-activating ATPase activity(GO:0036402) |
| 18.4 | 128.7 | GO:0102345 | 3-hydroxy-behenoyl-CoA dehydratase activity(GO:0102344) 3-hydroxy-lignoceroyl-CoA dehydratase activity(GO:0102345) |
| 18.3 | 54.8 | GO:0030156 | benzodiazepine receptor binding(GO:0030156) |
| 18.3 | 109.6 | GO:0097100 | supercoiled DNA binding(GO:0097100) |
| 17.8 | 71.4 | GO:0004074 | biliverdin reductase activity(GO:0004074) |
| 17.8 | 71.3 | GO:0016418 | S-acetyltransferase activity(GO:0016418) |
| 17.8 | 17.8 | GO:0034416 | bisphosphoglycerate phosphatase activity(GO:0034416) |
| 17.8 | 53.3 | GO:0008670 | 2,4-dienoyl-CoA reductase (NADPH) activity(GO:0008670) |
| 17.2 | 120.4 | GO:0016618 | hydroxypyruvate reductase activity(GO:0016618) glyoxylate reductase (NADP) activity(GO:0030267) |
| 17.0 | 50.9 | GO:0033699 | DNA 5'-adenosine monophosphate hydrolase activity(GO:0033699) |
| 16.9 | 388.9 | GO:0003756 | protein disulfide isomerase activity(GO:0003756) intramolecular oxidoreductase activity, transposing S-S bonds(GO:0016864) |
| 16.9 | 50.6 | GO:0004758 | serine C-palmitoyltransferase activity(GO:0004758) C-palmitoyltransferase activity(GO:0016454) |
| 16.7 | 50.1 | GO:0000064 | L-ornithine transmembrane transporter activity(GO:0000064) |
| 16.6 | 778.9 | GO:0061631 | ubiquitin conjugating enzyme activity(GO:0061631) |
| 16.5 | 214.6 | GO:1990825 | sequence-specific mRNA binding(GO:1990825) |
| 16.5 | 98.8 | GO:0008309 | double-stranded DNA exodeoxyribonuclease activity(GO:0008309) |
| 16.4 | 114.8 | GO:0008379 | thioredoxin peroxidase activity(GO:0008379) |
| 16.4 | 65.5 | GO:0033823 | procollagen-lysine 5-dioxygenase activity(GO:0008475) procollagen glucosyltransferase activity(GO:0033823) |
| 16.4 | 180.0 | GO:0004576 | oligosaccharyl transferase activity(GO:0004576) |
| 16.3 | 97.7 | GO:0050145 | nucleoside phosphate kinase activity(GO:0050145) |
| 16.2 | 48.5 | GO:0050509 | N-acetylglucosaminyl-proteoglycan 4-beta-glucuronosyltransferase activity(GO:0050509) |
| 16.2 | 96.9 | GO:0034186 | apolipoprotein A-I binding(GO:0034186) |
| 16.1 | 80.5 | GO:0050220 | prostaglandin-E synthase activity(GO:0050220) |
| 15.9 | 79.7 | GO:0043141 | ATP-dependent 5'-3' DNA helicase activity(GO:0043141) |
| 15.9 | 79.6 | GO:0051998 | carboxyl-O-methyltransferase activity(GO:0010340) protein carboxyl O-methyltransferase activity(GO:0051998) |
| 15.9 | 63.5 | GO:0098770 | FBXO family protein binding(GO:0098770) |
| 15.8 | 15.8 | GO:0031177 | phosphopantetheine binding(GO:0031177) |
| 15.7 | 47.2 | GO:0004047 | aminomethyltransferase activity(GO:0004047) |
| 15.7 | 141.1 | GO:0000340 | RNA 7-methylguanosine cap binding(GO:0000340) |
| 15.6 | 62.2 | GO:1990254 | keratin filament binding(GO:1990254) |
| 15.5 | 46.5 | GO:0004056 | argininosuccinate lyase activity(GO:0004056) |
| 15.5 | 139.5 | GO:0019960 | C-X3-C chemokine binding(GO:0019960) |
| 15.5 | 46.5 | GO:0050613 | delta14-sterol reductase activity(GO:0050613) |
| 15.4 | 15.4 | GO:0008160 | protein tyrosine phosphatase activator activity(GO:0008160) |
| 15.4 | 15.4 | GO:0015181 | arginine transmembrane transporter activity(GO:0015181) |
| 15.4 | 370.2 | GO:0070628 | proteasome binding(GO:0070628) |
| 15.3 | 91.7 | GO:0044020 | histone methyltransferase activity (H4-R3 specific)(GO:0044020) |
| 15.2 | 90.9 | GO:0004594 | pantothenate kinase activity(GO:0004594) |
| 15.0 | 90.2 | GO:0005047 | signal recognition particle binding(GO:0005047) |
| 15.0 | 135.1 | GO:0017176 | phosphatidylinositol N-acetylglucosaminyltransferase activity(GO:0017176) |
| 14.9 | 59.7 | GO:0000213 | tRNA-intron endonuclease activity(GO:0000213) |
| 14.8 | 148.4 | GO:0033592 | RNA strand annealing activity(GO:0033592) |
| 14.8 | 44.3 | GO:0001069 | regulatory region RNA binding(GO:0001069) |
| 14.8 | 59.0 | GO:0016530 | metallochaperone activity(GO:0016530) |
| 14.7 | 59.0 | GO:0034596 | phosphatidylinositol phosphate 4-phosphatase activity(GO:0034596) |
| 14.6 | 117.0 | GO:0050733 | RS domain binding(GO:0050733) |
| 14.6 | 43.8 | GO:0004418 | hydroxymethylbilane synthase activity(GO:0004418) |
| 14.5 | 58.2 | GO:0047676 | arachidonate-CoA ligase activity(GO:0047676) |
| 14.5 | 101.6 | GO:0070990 | snRNP binding(GO:0070990) |
| 14.4 | 115.1 | GO:0016721 | superoxide dismutase activity(GO:0004784) oxidoreductase activity, acting on superoxide radicals as acceptor(GO:0016721) |
| 14.1 | 14.1 | GO:0032558 | adenyl deoxyribonucleotide binding(GO:0032558) dATP binding(GO:0032564) |
| 14.1 | 254.1 | GO:0051537 | 2 iron, 2 sulfur cluster binding(GO:0051537) |
| 14.1 | 84.4 | GO:0016435 | rRNA (guanine) methyltransferase activity(GO:0016435) |
| 14.0 | 27.9 | GO:0043398 | HLH domain binding(GO:0043398) |
| 13.9 | 55.5 | GO:0043262 | adenosine-diphosphatase activity(GO:0043262) |
| 13.8 | 83.1 | GO:0070513 | death domain binding(GO:0070513) |
| 13.8 | 55.1 | GO:0035402 | histone kinase activity (H3-T11 specific)(GO:0035402) |
| 13.7 | 82.4 | GO:0010997 | anaphase-promoting complex binding(GO:0010997) |
| 13.7 | 178.3 | GO:0000774 | adenyl-nucleotide exchange factor activity(GO:0000774) |
| 13.6 | 40.7 | GO:0043739 | G/U mismatch-specific uracil-DNA glycosylase activity(GO:0043739) |
| 13.5 | 135.3 | GO:0070883 | pre-miRNA binding(GO:0070883) |
| 13.5 | 54.1 | GO:0004844 | uracil DNA N-glycosylase activity(GO:0004844) deaminated base DNA N-glycosylase activity(GO:0097506) |
| 13.5 | 40.4 | GO:0035731 | S-nitrosoglutathione binding(GO:0035730) dinitrosyl-iron complex binding(GO:0035731) |
| 13.4 | 40.2 | GO:0031403 | lithium ion binding(GO:0031403) |
| 13.3 | 80.0 | GO:0030620 | U2 snRNA binding(GO:0030620) |
| 13.3 | 53.2 | GO:0004906 | interferon-gamma receptor activity(GO:0004906) |
| 13.2 | 39.6 | GO:0070336 | flap-structured DNA binding(GO:0070336) |
| 13.2 | 171.2 | GO:0004726 | non-membrane spanning protein tyrosine phosphatase activity(GO:0004726) |
| 13.1 | 65.7 | GO:0034604 | pyruvate dehydrogenase activity(GO:0004738) pyruvate dehydrogenase [NAD(P)+] activity(GO:0034603) pyruvate dehydrogenase (NAD+) activity(GO:0034604) |
| 13.1 | 418.8 | GO:0008143 | poly(A) binding(GO:0008143) |
| 13.0 | 51.9 | GO:0003963 | RNA-3'-phosphate cyclase activity(GO:0003963) |
| 12.9 | 141.8 | GO:0008474 | palmitoyl-(protein) hydrolase activity(GO:0008474) palmitoyl hydrolase activity(GO:0098599) |
| 12.8 | 64.2 | GO:0032143 | single thymine insertion binding(GO:0032143) |
| 12.8 | 64.2 | GO:0004066 | asparagine synthase (glutamine-hydrolyzing) activity(GO:0004066) |
| 12.8 | 102.3 | GO:0016997 | exo-alpha-sialidase activity(GO:0004308) alpha-sialidase activity(GO:0016997) |
| 12.6 | 37.9 | GO:1990050 | phosphatidic acid transporter activity(GO:1990050) |
| 12.6 | 37.7 | GO:0004720 | protein-lysine 6-oxidase activity(GO:0004720) |
| 12.5 | 37.6 | GO:0000033 | alpha-1,3-mannosyltransferase activity(GO:0000033) |
| 12.5 | 224.3 | GO:0017070 | U6 snRNA binding(GO:0017070) |
| 12.4 | 99.1 | GO:0042301 | phosphate ion binding(GO:0042301) |
| 12.3 | 12.3 | GO:0032810 | sterol response element binding(GO:0032810) |
| 12.1 | 72.7 | GO:0004749 | ribose phosphate diphosphokinase activity(GO:0004749) |
| 12.1 | 84.4 | GO:0000150 | recombinase activity(GO:0000150) |
| 12.0 | 72.1 | GO:0003960 | NADPH:quinone reductase activity(GO:0003960) |
| 12.0 | 60.0 | GO:1990460 | leptin receptor binding(GO:1990460) |
| 11.9 | 119.4 | GO:0009982 | pseudouridine synthase activity(GO:0009982) |
| 11.9 | 35.7 | GO:0008988 | rRNA (adenine-N6-)-methyltransferase activity(GO:0008988) |
| 11.9 | 106.8 | GO:1990226 | histone methyltransferase binding(GO:1990226) |
| 11.9 | 308.3 | GO:0098641 | cadherin binding involved in cell-cell adhesion(GO:0098641) |
| 11.8 | 35.5 | GO:0005010 | insulin-like growth factor-activated receptor activity(GO:0005010) |
| 11.8 | 35.4 | GO:0050146 | nucleoside phosphotransferase activity(GO:0050146) |
| 11.7 | 70.5 | GO:0016748 | succinyltransferase activity(GO:0016748) |
| 11.7 | 35.1 | GO:0003918 | DNA topoisomerase type II (ATP-hydrolyzing) activity(GO:0003918) DNA topoisomerase II activity(GO:0061505) |
| 11.7 | 35.1 | GO:0004597 | peptide-aspartate beta-dioxygenase activity(GO:0004597) |
| 11.6 | 23.2 | GO:0070717 | poly-purine tract binding(GO:0070717) |
| 11.6 | 23.1 | GO:0004142 | diacylglycerol cholinephosphotransferase activity(GO:0004142) |
| 11.5 | 34.5 | GO:0045131 | pre-mRNA branch point binding(GO:0045131) |
| 11.5 | 34.5 | GO:0055100 | adiponectin binding(GO:0055100) |
| 11.5 | 34.5 | GO:0000104 | succinate dehydrogenase activity(GO:0000104) |
| 11.5 | 275.0 | GO:0004550 | nucleoside diphosphate kinase activity(GO:0004550) |
| 11.5 | 34.4 | GO:0003896 | DNA primase activity(GO:0003896) |
| 11.4 | 216.9 | GO:0043495 | protein anchor(GO:0043495) |
| 11.4 | 34.1 | GO:0008466 | glycogenin glucosyltransferase activity(GO:0008466) |
| 11.3 | 34.0 | GO:0016262 | protein N-acetylglucosaminyltransferase activity(GO:0016262) |
| 11.3 | 22.6 | GO:0019103 | pyrimidine nucleotide binding(GO:0019103) |
| 11.3 | 33.8 | GO:0003985 | acetyl-CoA C-acetyltransferase activity(GO:0003985) |
| 11.3 | 33.8 | GO:0035651 | AP-3 adaptor complex binding(GO:0035651) |
| 11.2 | 22.3 | GO:0008263 | pyrimidine-specific mismatch base pair DNA N-glycosylase activity(GO:0008263) |
| 11.1 | 55.3 | GO:0004694 | eukaryotic translation initiation factor 2alpha kinase activity(GO:0004694) |
| 11.0 | 44.2 | GO:0016509 | long-chain-3-hydroxyacyl-CoA dehydrogenase activity(GO:0016509) |
| 11.0 | 55.1 | GO:0004176 | ATP-dependent peptidase activity(GO:0004176) |
| 11.0 | 2257.4 | GO:0003735 | structural constituent of ribosome(GO:0003735) |
| 10.9 | 76.5 | GO:0015217 | adenine nucleotide transmembrane transporter activity(GO:0000295) purine ribonucleotide transmembrane transporter activity(GO:0005346) ATP transmembrane transporter activity(GO:0005347) purine nucleotide transmembrane transporter activity(GO:0015216) ADP transmembrane transporter activity(GO:0015217) |
| 10.9 | 65.6 | GO:0004301 | epoxide hydrolase activity(GO:0004301) |
| 10.9 | 21.8 | GO:0030628 | pre-mRNA 3'-splice site binding(GO:0030628) |
| 10.8 | 64.7 | GO:0030942 | endoplasmic reticulum signal peptide binding(GO:0030942) |
| 10.8 | 172.1 | GO:0017128 | phospholipid scramblase activity(GO:0017128) |
| 10.7 | 32.0 | GO:0031626 | beta-endorphin binding(GO:0031626) |
| 10.6 | 127.7 | GO:0016004 | phospholipase activator activity(GO:0016004) |
| 10.6 | 42.4 | GO:1990189 | peptide-serine-N-acetyltransferase activity(GO:1990189) |
| 10.5 | 210.9 | GO:0008349 | MAP kinase kinase kinase kinase activity(GO:0008349) |
| 10.5 | 305.7 | GO:0004003 | ATP-dependent DNA helicase activity(GO:0004003) |
| 10.5 | 31.5 | GO:0004346 | glucose-6-phosphatase activity(GO:0004346) sugar-terminal-phosphatase activity(GO:0050309) |
| 10.5 | 41.9 | GO:0003827 | alpha-1,3-mannosylglycoprotein 2-beta-N-acetylglucosaminyltransferase activity(GO:0003827) |
| 10.5 | 41.9 | GO:0004466 | long-chain-acyl-CoA dehydrogenase activity(GO:0004466) |
| 10.4 | 31.1 | GO:0051920 | peroxiredoxin activity(GO:0051920) |
| 10.4 | 124.3 | GO:0016174 | NAD(P)H oxidase activity(GO:0016174) |
| 10.3 | 41.3 | GO:0070363 | mitochondrial light strand promoter sense binding(GO:0070363) |
| 10.3 | 113.0 | GO:0016861 | intramolecular oxidoreductase activity, interconverting aldoses and ketoses(GO:0016861) |
| 10.3 | 30.8 | GO:0030292 | protein tyrosine kinase inhibitor activity(GO:0030292) |
| 10.3 | 71.8 | GO:0015450 | P-P-bond-hydrolysis-driven protein transmembrane transporter activity(GO:0015450) |
| 10.3 | 82.0 | GO:0030229 | very-low-density lipoprotein particle receptor activity(GO:0030229) |
| 10.2 | 61.5 | GO:0004735 | pyrroline-5-carboxylate reductase activity(GO:0004735) |
| 10.2 | 30.7 | GO:0004492 | methylmalonyl-CoA decarboxylase activity(GO:0004492) |
| 10.1 | 40.4 | GO:0003938 | IMP dehydrogenase activity(GO:0003938) |
| 10.1 | 30.3 | GO:0001226 | RNA polymerase II transcription corepressor binding(GO:0001226) |
| 10.1 | 30.2 | GO:0036219 | GTP diphosphatase activity(GO:0036219) 2-hydroxy-adenosine triphosphate pyrophosphatase activity(GO:0044713) 2-hydroxy-(deoxy)adenosine-triphosphate pyrophosphatase activity(GO:0044714) ATP diphosphatase activity(GO:0047693) |
| 10.0 | 60.2 | GO:0051996 | farnesyl-diphosphate farnesyltransferase activity(GO:0004310) squalene synthase activity(GO:0051996) |
| 10.0 | 260.0 | GO:0070182 | DNA polymerase binding(GO:0070182) |
| 9.9 | 297.2 | GO:0070577 | lysine-acetylated histone binding(GO:0070577) |
| 9.8 | 29.5 | GO:0004582 | dolichyl-phosphate beta-D-mannosyltransferase activity(GO:0004582) |
| 9.7 | 29.1 | GO:0008097 | 5S rRNA binding(GO:0008097) |
| 9.7 | 48.5 | GO:0035173 | histone kinase activity(GO:0035173) |
| 9.7 | 9.7 | GO:0000995 | transcription factor activity, core RNA polymerase III binding(GO:0000995) |
| 9.6 | 77.1 | GO:0015165 | pyrimidine nucleotide-sugar transmembrane transporter activity(GO:0015165) |
| 9.6 | 38.4 | GO:0017057 | 6-phosphogluconolactonase activity(GO:0017057) |
| 9.6 | 28.7 | GO:0004638 | phosphoribosylaminoimidazole carboxylase activity(GO:0004638) phosphoribosylaminoimidazolesuccinocarboxamide synthase activity(GO:0004639) |
| 9.5 | 66.7 | GO:0001849 | complement component C1q binding(GO:0001849) |
| 9.4 | 18.9 | GO:0004514 | nicotinate-nucleotide diphosphorylase (carboxylating) activity(GO:0004514) |
| 9.4 | 358.5 | GO:0031492 | nucleosomal DNA binding(GO:0031492) |
| 9.4 | 103.7 | GO:0001094 | TFIID-class transcription factor binding(GO:0001094) |
| 9.4 | 18.7 | GO:0008330 | protein tyrosine/threonine phosphatase activity(GO:0008330) |
| 9.3 | 9.3 | GO:0008413 | 8-oxo-7,8-dihydroguanosine triphosphate pyrophosphatase activity(GO:0008413) 8-oxo-7,8-dihydrodeoxyguanosine triphosphate pyrophosphatase activity(GO:0035539) |
| 9.3 | 93.1 | GO:0070878 | primary miRNA binding(GO:0070878) |
| 9.3 | 55.8 | GO:0036033 | mediator complex binding(GO:0036033) |
| 9.3 | 27.9 | GO:0043035 | chromatin insulator sequence binding(GO:0043035) |
| 9.3 | 9.3 | GO:0008174 | mRNA methyltransferase activity(GO:0008174) |
| 9.3 | 55.6 | GO:0004563 | beta-N-acetylhexosaminidase activity(GO:0004563) |
| 9.3 | 92.6 | GO:0000339 | RNA cap binding(GO:0000339) |
| 9.2 | 351.1 | GO:0031369 | translation initiation factor binding(GO:0031369) |
| 9.2 | 64.3 | GO:0046912 | transferase activity, transferring acyl groups, acyl groups converted into alkyl on transfer(GO:0046912) |
| 9.2 | 45.8 | GO:0035613 | RNA stem-loop binding(GO:0035613) |
| 9.1 | 72.9 | GO:0086083 | cell adhesive protein binding involved in bundle of His cell-Purkinje myocyte communication(GO:0086083) |
| 9.1 | 117.9 | GO:0004549 | tRNA-specific ribonuclease activity(GO:0004549) |
| 9.1 | 18.1 | GO:0035529 | NADH pyrophosphatase activity(GO:0035529) |
| 9.0 | 27.0 | GO:0004307 | ethanolaminephosphotransferase activity(GO:0004307) |
| 9.0 | 99.0 | GO:0008428 | ribonuclease inhibitor activity(GO:0008428) |
| 9.0 | 26.9 | GO:0003923 | GPI-anchor transamidase activity(GO:0003923) |
| 8.9 | 232.4 | GO:0005092 | GDP-dissociation inhibitor activity(GO:0005092) |
| 8.8 | 61.8 | GO:0036042 | long-chain fatty acyl-CoA binding(GO:0036042) |
| 8.8 | 8.8 | GO:0004792 | thiosulfate sulfurtransferase activity(GO:0004792) |
| 8.8 | 96.3 | GO:0008641 | small protein activating enzyme activity(GO:0008641) |
| 8.7 | 26.2 | GO:0000822 | inositol hexakisphosphate binding(GO:0000822) |
| 8.7 | 113.0 | GO:0043138 | 3'-5' DNA helicase activity(GO:0043138) |
| 8.7 | 43.3 | GO:0004161 | dimethylallyltranstransferase activity(GO:0004161) geranyltranstransferase activity(GO:0004337) |
| 8.6 | 25.9 | GO:0050510 | N-acetylgalactosaminyl-proteoglycan 3-beta-glucuronosyltransferase activity(GO:0050510) |
| 8.6 | 34.4 | GO:0016404 | 15-hydroxyprostaglandin dehydrogenase (NAD+) activity(GO:0016404) |
| 8.4 | 236.4 | GO:0017166 | vinculin binding(GO:0017166) |
| 8.4 | 25.2 | GO:0046577 | long-chain-alcohol oxidase activity(GO:0046577) |
| 8.4 | 42.0 | GO:0061649 | ubiquitinated histone binding(GO:0061649) |
| 8.4 | 41.9 | GO:0034714 | type III transforming growth factor beta receptor binding(GO:0034714) |
| 8.4 | 58.6 | GO:0042978 | ornithine decarboxylase activator activity(GO:0042978) |
| 8.3 | 25.0 | GO:0071535 | RING-like zinc finger domain binding(GO:0071535) |
| 8.3 | 91.6 | GO:0008253 | 5'-nucleotidase activity(GO:0008253) |
| 8.3 | 33.3 | GO:0070644 | vitamin D response element binding(GO:0070644) |
| 8.3 | 74.5 | GO:0019784 | NEDD8-specific protease activity(GO:0019784) |
| 8.3 | 24.8 | GO:0016508 | long-chain-enoyl-CoA hydratase activity(GO:0016508) 3alpha,7alpha,12alpha-trihydroxy-5beta-cholest-24-enoyl-CoA hydratase activity(GO:0033989) 17-beta-hydroxysteroid dehydrogenase (NAD+) activity(GO:0044594) |
| 8.2 | 57.7 | GO:0033170 | DNA clamp loader activity(GO:0003689) protein-DNA loading ATPase activity(GO:0033170) |
| 8.2 | 24.6 | GO:0019826 | oxygen sensor activity(GO:0019826) |
| 8.2 | 16.3 | GO:0030158 | protein xylosyltransferase activity(GO:0030158) |
| 8.1 | 445.8 | GO:0031593 | polyubiquitin binding(GO:0031593) |
| 8.1 | 8.1 | GO:0016778 | diphosphotransferase activity(GO:0016778) |
| 8.1 | 24.2 | GO:0004616 | phosphogluconate dehydrogenase (decarboxylating) activity(GO:0004616) |
| 8.0 | 32.0 | GO:0042134 | rRNA primary transcript binding(GO:0042134) |
| 8.0 | 152.0 | GO:0051400 | BH domain binding(GO:0051400) |
| 8.0 | 32.0 | GO:0004743 | pyruvate kinase activity(GO:0004743) |
| 8.0 | 47.8 | GO:0003747 | translation release factor activity(GO:0003747) translation termination factor activity(GO:0008079) |
| 8.0 | 31.8 | GO:1904408 | dihydronicotinamide riboside quinone reductase activity(GO:0001512) melatonin binding(GO:1904408) |
| 7.9 | 23.8 | GO:0004608 | phosphatidyl-N-methylethanolamine N-methyltransferase activity(GO:0000773) phosphatidylethanolamine N-methyltransferase activity(GO:0004608) phosphatidyl-N-dimethylethanolamine N-methyltransferase activity(GO:0080101) |
| 7.9 | 47.3 | GO:0004699 | calcium-independent protein kinase C activity(GO:0004699) |
| 7.9 | 157.2 | GO:0008301 | DNA binding, bending(GO:0008301) |
| 7.8 | 242.1 | GO:0044183 | protein binding involved in protein folding(GO:0044183) |
| 7.8 | 77.9 | GO:0001135 | transcription factor activity, RNA polymerase II transcription factor recruiting(GO:0001135) |
| 7.8 | 38.8 | GO:0008073 | ornithine decarboxylase inhibitor activity(GO:0008073) |
| 7.8 | 46.5 | GO:0016802 | adenosylhomocysteinase activity(GO:0004013) trialkylsulfonium hydrolase activity(GO:0016802) |
| 7.7 | 107.4 | GO:0004653 | polypeptide N-acetylgalactosaminyltransferase activity(GO:0004653) |
| 7.7 | 15.3 | GO:0016929 | SUMO-specific protease activity(GO:0016929) |
| 7.6 | 114.1 | GO:0009931 | calcium-dependent protein serine/threonine kinase activity(GO:0009931) |
| 7.5 | 158.5 | GO:0003746 | translation elongation factor activity(GO:0003746) |
| 7.5 | 60.1 | GO:0102338 | fatty acid elongase activity(GO:0009922) 3-oxo-arachidoyl-CoA synthase activity(GO:0102336) 3-oxo-cerotoyl-CoA synthase activity(GO:0102337) 3-oxo-lignoceronyl-CoA synthase activity(GO:0102338) |
| 7.5 | 299.3 | GO:0003743 | translation initiation factor activity(GO:0003743) |
| 7.5 | 194.4 | GO:0042288 | MHC class I protein binding(GO:0042288) |
| 7.5 | 231.4 | GO:0008139 | nuclear localization sequence binding(GO:0008139) |
| 7.4 | 183.8 | GO:0051059 | NF-kappaB binding(GO:0051059) |
| 7.3 | 14.7 | GO:0061676 | importin-alpha family protein binding(GO:0061676) |
| 7.3 | 219.7 | GO:0070410 | co-SMAD binding(GO:0070410) |
| 7.3 | 160.8 | GO:0070273 | phosphatidylinositol-4-phosphate binding(GO:0070273) |
| 7.3 | 7.3 | GO:1990381 | ubiquitin-specific protease binding(GO:1990381) |
| 7.3 | 29.1 | GO:0070053 | thrombospondin receptor activity(GO:0070053) |
| 7.3 | 14.5 | GO:0004920 | interleukin-10 receptor activity(GO:0004920) |
| 7.3 | 29.0 | GO:0008823 | cupric reductase activity(GO:0008823) ferric-chelate reductase (NADPH) activity(GO:0052851) |
| 7.2 | 21.7 | GO:0008476 | protein-tyrosine sulfotransferase activity(GO:0008476) |
| 7.2 | 172.5 | GO:0017025 | TBP-class protein binding(GO:0017025) |
| 7.2 | 78.7 | GO:0055106 | ubiquitin-protein transferase regulator activity(GO:0055106) |
| 7.2 | 21.5 | GO:0031755 | endothelial differentiation G-protein coupled receptor binding(GO:0031753) Edg-2 lysophosphatidic acid receptor binding(GO:0031755) |
| 7.1 | 14.2 | GO:0016212 | kynurenine-oxoglutarate transaminase activity(GO:0016212) kynurenine aminotransferase activity(GO:0036137) |
| 7.0 | 14.1 | GO:0016715 | oxidoreductase activity, acting on paired donors, with incorporation or reduction of molecular oxygen, reduced ascorbate as one donor, and incorporation of one atom of oxygen(GO:0016715) |
| 7.0 | 125.3 | GO:0016018 | cyclosporin A binding(GO:0016018) |
| 6.9 | 27.6 | GO:0047391 | alkylglycerophosphoethanolamine phosphodiesterase activity(GO:0047391) |
| 6.9 | 82.9 | GO:0015129 | lactate transmembrane transporter activity(GO:0015129) |
| 6.9 | 41.5 | GO:0015093 | ferrous iron transmembrane transporter activity(GO:0015093) |
| 6.9 | 191.9 | GO:0017056 | structural constituent of nuclear pore(GO:0017056) |
| 6.8 | 54.7 | GO:0015349 | thyroid hormone transmembrane transporter activity(GO:0015349) |
| 6.8 | 47.6 | GO:0042799 | histone methyltransferase activity (H4-K20 specific)(GO:0042799) |
| 6.8 | 27.1 | GO:0019798 | procollagen-proline dioxygenase activity(GO:0019798) |
| 6.7 | 94.2 | GO:0008187 | poly-pyrimidine tract binding(GO:0008187) |
| 6.7 | 40.2 | GO:0022833 | mechanically-gated ion channel activity(GO:0008381) mechanically gated channel activity(GO:0022833) |
| 6.7 | 53.6 | GO:0070569 | uridylyltransferase activity(GO:0070569) |
| 6.7 | 201.0 | GO:0000175 | 3'-5'-exoribonuclease activity(GO:0000175) |
| 6.7 | 46.8 | GO:0008454 | alpha-1,3-mannosylglycoprotein 4-beta-N-acetylglucosaminyltransferase activity(GO:0008454) |
| 6.7 | 59.9 | GO:0001075 | transcription factor activity, RNA polymerase II core promoter sequence-specific binding involved in preinitiation complex assembly(GO:0001075) |
| 6.6 | 59.5 | GO:0001222 | transcription corepressor binding(GO:0001222) |
| 6.5 | 77.7 | GO:0032050 | clathrin heavy chain binding(GO:0032050) |
| 6.4 | 25.7 | GO:0004379 | glycylpeptide N-tetradecanoyltransferase activity(GO:0004379) myristoyltransferase activity(GO:0019107) |
| 6.4 | 44.9 | GO:0019534 | toxin transporter activity(GO:0019534) |
| 6.4 | 6.4 | GO:0015563 | uptake transmembrane transporter activity(GO:0015563) |
| 6.4 | 44.5 | GO:0004652 | polynucleotide adenylyltransferase activity(GO:0004652) |
| 6.3 | 31.7 | GO:0033192 | calmodulin-dependent protein phosphatase activity(GO:0033192) |
| 6.3 | 18.9 | GO:0071933 | Arp2/3 complex binding(GO:0071933) |
| 6.3 | 37.7 | GO:0043120 | tumor necrosis factor binding(GO:0043120) |
| 6.3 | 18.8 | GO:0000252 | C-3 sterol dehydrogenase (C-4 sterol decarboxylase) activity(GO:0000252) sterol-4-alpha-carboxylate 3-dehydrogenase (decarboxylating) activity(GO:0047012) |
| 6.2 | 31.2 | GO:0050833 | pyruvate transmembrane transporter activity(GO:0050833) |
| 6.2 | 460.2 | GO:0019003 | GDP binding(GO:0019003) |
| 6.2 | 74.6 | GO:0003688 | DNA replication origin binding(GO:0003688) |
| 6.2 | 6.2 | GO:0070404 | NADH binding(GO:0070404) |
| 6.1 | 72.9 | GO:0032453 | histone demethylase activity (H3-K4 specific)(GO:0032453) |
| 6.0 | 66.5 | GO:0019869 | chloride channel inhibitor activity(GO:0019869) |
| 6.0 | 6.0 | GO:0043142 | single-stranded DNA-dependent ATPase activity(GO:0043142) |
| 6.0 | 54.3 | GO:0004128 | cytochrome-b5 reductase activity, acting on NAD(P)H(GO:0004128) |
| 6.0 | 48.2 | GO:0046703 | natural killer cell lectin-like receptor binding(GO:0046703) |
| 6.0 | 96.3 | GO:0048027 | mRNA 5'-UTR binding(GO:0048027) |
| 6.0 | 18.0 | GO:0004017 | adenylate kinase activity(GO:0004017) |
| 6.0 | 6.0 | GO:0035373 | chondroitin sulfate proteoglycan binding(GO:0035373) |
| 6.0 | 6.0 | GO:0042809 | vitamin D receptor binding(GO:0042809) |
| 5.9 | 29.7 | GO:0004905 | type I interferon receptor activity(GO:0004905) |
| 5.9 | 35.6 | GO:0016842 | amidine-lyase activity(GO:0016842) |
| 5.9 | 23.8 | GO:0045127 | N-acetylglucosamine kinase activity(GO:0045127) |
| 5.9 | 59.2 | GO:0016884 | carbon-nitrogen ligase activity, with glutamine as amido-N-donor(GO:0016884) |
| 5.9 | 53.2 | GO:0046790 | virion binding(GO:0046790) |
| 5.9 | 29.5 | GO:0034481 | chondroitin sulfotransferase activity(GO:0034481) |
| 5.9 | 105.7 | GO:0030515 | snoRNA binding(GO:0030515) |
| 5.9 | 11.7 | GO:0004611 | phosphoenolpyruvate carboxykinase activity(GO:0004611) phosphoenolpyruvate carboxykinase (GTP) activity(GO:0004613) |
| 5.8 | 35.1 | GO:0016922 | ligand-dependent nuclear receptor binding(GO:0016922) |
| 5.8 | 40.7 | GO:0050815 | phosphoserine binding(GO:0050815) |
| 5.8 | 34.8 | GO:0000014 | single-stranded DNA endodeoxyribonuclease activity(GO:0000014) |
| 5.8 | 23.2 | GO:0030235 | nitric-oxide synthase regulator activity(GO:0030235) |
| 5.8 | 272.6 | GO:0050136 | NADH dehydrogenase (ubiquinone) activity(GO:0008137) NADH dehydrogenase (quinone) activity(GO:0050136) |
| 5.8 | 23.2 | GO:0003988 | acetyl-CoA C-acyltransferase activity(GO:0003988) |
| 5.8 | 5.8 | GO:0042975 | peroxisome proliferator activated receptor binding(GO:0042975) |
| 5.7 | 211.2 | GO:0043236 | laminin binding(GO:0043236) |
| 5.7 | 34.1 | GO:0038049 | transcription factor activity, ligand-activated RNA polymerase II transcription factor binding(GO:0038049) |
| 5.7 | 45.4 | GO:0090482 | vitamin transmembrane transporter activity(GO:0090482) |
| 5.7 | 56.7 | GO:0035877 | death effector domain binding(GO:0035877) |
| 5.6 | 2160.9 | GO:0045296 | cadherin binding(GO:0045296) |
| 5.6 | 44.7 | GO:0004485 | methylcrotonoyl-CoA carboxylase activity(GO:0004485) |
| 5.5 | 11.1 | GO:0043682 | copper-exporting ATPase activity(GO:0004008) copper-transporting ATPase activity(GO:0043682) |
| 5.5 | 22.1 | GO:0005169 | neurotrophin TRKB receptor binding(GO:0005169) |
| 5.5 | 264.8 | GO:0050699 | WW domain binding(GO:0050699) |
| 5.5 | 21.9 | GO:0061513 | hexose phosphate transmembrane transporter activity(GO:0015119) organophosphate:inorganic phosphate antiporter activity(GO:0015315) hexose-phosphate:inorganic phosphate antiporter activity(GO:0015526) glucose 6-phosphate:inorganic phosphate antiporter activity(GO:0061513) |
| 5.5 | 208.0 | GO:0004198 | calcium-dependent cysteine-type endopeptidase activity(GO:0004198) |
| 5.5 | 21.9 | GO:0034713 | type I transforming growth factor beta receptor binding(GO:0034713) |
| 5.5 | 38.3 | GO:0005324 | long-chain fatty acid transporter activity(GO:0005324) |
| 5.4 | 69.8 | GO:0005337 | nucleoside transmembrane transporter activity(GO:0005337) |
| 5.4 | 16.1 | GO:0070704 | C-5 sterol desaturase activity(GO:0000248) sterol desaturase activity(GO:0070704) |
| 5.4 | 5.4 | GO:0004045 | aminoacyl-tRNA hydrolase activity(GO:0004045) |
| 5.3 | 16.0 | GO:0003860 | 3-hydroxyisobutyryl-CoA hydrolase activity(GO:0003860) |
| 5.3 | 15.9 | GO:0043024 | ribosomal small subunit binding(GO:0043024) |
| 5.3 | 42.4 | GO:0008269 | JAK pathway signal transduction adaptor activity(GO:0008269) |
| 5.3 | 26.5 | GO:0015183 | L-aspartate transmembrane transporter activity(GO:0015183) |
| 5.3 | 10.6 | GO:0035242 | protein-arginine omega-N asymmetric methyltransferase activity(GO:0035242) |
| 5.3 | 15.9 | GO:0055077 | gap junction hemi-channel activity(GO:0055077) |
| 5.2 | 25.9 | GO:0034597 | phosphatidylinositol-3,4-bisphosphate 4-phosphatase activity(GO:0016316) inositol-1,3,4-trisphosphate 4-phosphatase activity(GO:0017161) phosphatidylinositol-4,5-bisphosphate 4-phosphatase activity(GO:0034597) inositol-3,4-bisphosphate 4-phosphatase activity(GO:0052828) |
| 5.2 | 31.0 | GO:0008518 | reduced folate carrier activity(GO:0008518) methotrexate transporter activity(GO:0015350) |
| 5.2 | 97.9 | GO:0005487 | nucleocytoplasmic transporter activity(GO:0005487) |
| 5.1 | 66.8 | GO:0016289 | CoA hydrolase activity(GO:0016289) acyl-CoA hydrolase activity(GO:0047617) |
| 5.1 | 20.5 | GO:0042282 | hydroxymethylglutaryl-CoA reductase (NADPH) activity(GO:0004420) hydroxymethylglutaryl-CoA reductase activity(GO:0042282) |
| 5.1 | 30.7 | GO:0019788 | NEDD8 transferase activity(GO:0019788) |
| 5.1 | 46.0 | GO:0035174 | histone serine kinase activity(GO:0035174) |
| 5.1 | 5.1 | GO:0019239 | deaminase activity(GO:0019239) |
| 5.1 | 30.4 | GO:0019237 | centromeric DNA binding(GO:0019237) |
| 5.1 | 202.5 | GO:0042169 | SH2 domain binding(GO:0042169) |
| 5.0 | 55.2 | GO:0001056 | RNA polymerase III activity(GO:0001056) |
| 5.0 | 24.9 | GO:0043183 | vascular endothelial growth factor receptor 1 binding(GO:0043183) |
| 5.0 | 14.9 | GO:0016822 | hydrolase activity, acting on acid carbon-carbon bonds(GO:0016822) hydrolase activity, acting on acid carbon-carbon bonds, in ketonic substances(GO:0016823) |
| 4.9 | 14.7 | GO:0004677 | DNA-dependent protein kinase activity(GO:0004677) |
| 4.9 | 455.7 | GO:0003697 | single-stranded DNA binding(GO:0003697) |
| 4.9 | 136.6 | GO:0008157 | protein phosphatase 1 binding(GO:0008157) |
| 4.8 | 9.7 | GO:0008169 | C-methyltransferase activity(GO:0008169) |
| 4.8 | 33.9 | GO:0008934 | inositol monophosphate 1-phosphatase activity(GO:0008934) inositol monophosphate 3-phosphatase activity(GO:0052832) inositol monophosphate 4-phosphatase activity(GO:0052833) inositol monophosphate phosphatase activity(GO:0052834) |
| 4.8 | 19.3 | GO:0004335 | galactokinase activity(GO:0004335) |
| 4.8 | 72.0 | GO:0005095 | GTPase inhibitor activity(GO:0005095) |
| 4.8 | 28.8 | GO:0016672 | oxidoreductase activity, acting on a sulfur group of donors, quinone or similar compound as acceptor(GO:0016672) |
| 4.8 | 14.4 | GO:0033981 | D-dopachrome decarboxylase activity(GO:0033981) |
| 4.8 | 4.8 | GO:0034041 | sterol-transporting ATPase activity(GO:0034041) |
| 4.7 | 4.7 | GO:0010484 | H3 histone acetyltransferase activity(GO:0010484) |
| 4.7 | 205.6 | GO:0050681 | androgen receptor binding(GO:0050681) |
| 4.7 | 42.0 | GO:0050692 | DBD domain binding(GO:0050692) |
| 4.7 | 4.7 | GO:0046923 | ER retention sequence binding(GO:0046923) |
| 4.6 | 46.3 | GO:0004887 | thyroid hormone receptor activity(GO:0004887) |
| 4.6 | 32.3 | GO:0030274 | LIM domain binding(GO:0030274) |
| 4.6 | 9.2 | GO:0098518 | polynucleotide phosphatase activity(GO:0098518) |
| 4.6 | 27.5 | GO:1990763 | arrestin family protein binding(GO:1990763) |
| 4.6 | 36.6 | GO:0004571 | mannosyl-oligosaccharide 1,2-alpha-mannosidase activity(GO:0004571) |
| 4.6 | 72.9 | GO:0097602 | cullin family protein binding(GO:0097602) |
| 4.5 | 131.1 | GO:0042605 | peptide antigen binding(GO:0042605) |
| 4.5 | 17.9 | GO:0008732 | glycine hydroxymethyltransferase activity(GO:0004372) threonine aldolase activity(GO:0004793) L-allo-threonine aldolase activity(GO:0008732) |
| 4.5 | 31.3 | GO:1904929 | coreceptor activity involved in Wnt signaling pathway, planar cell polarity pathway(GO:1904929) |
| 4.4 | 53.2 | GO:0005161 | platelet-derived growth factor receptor binding(GO:0005161) |
| 4.4 | 35.3 | GO:0070087 | chromo shadow domain binding(GO:0070087) |
| 4.4 | 17.6 | GO:0015266 | protein channel activity(GO:0015266) |
| 4.4 | 74.4 | GO:0017154 | semaphorin receptor activity(GO:0017154) |
| 4.4 | 13.1 | GO:0034736 | sterol O-acyltransferase activity(GO:0004772) cholesterol O-acyltransferase activity(GO:0034736) |
| 4.4 | 47.9 | GO:0034450 | ubiquitin-ubiquitin ligase activity(GO:0034450) |
| 4.3 | 21.7 | GO:0008948 | malate dehydrogenase (decarboxylating) (NAD+) activity(GO:0004471) malate dehydrogenase (decarboxylating) (NADP+) activity(GO:0004473) oxaloacetate decarboxylase activity(GO:0008948) |
| 4.3 | 17.3 | GO:0002046 | opsin binding(GO:0002046) |
| 4.3 | 81.1 | GO:0035615 | clathrin adaptor activity(GO:0035615) endocytic adaptor activity(GO:0098748) |
| 4.3 | 29.8 | GO:0046527 | glucosyltransferase activity(GO:0046527) |
| 4.2 | 16.9 | GO:0008449 | N-acetylglucosamine-6-sulfatase activity(GO:0008449) |
| 4.2 | 59.1 | GO:0023026 | MHC class II protein complex binding(GO:0023026) |
| 4.2 | 134.6 | GO:0046966 | thyroid hormone receptor binding(GO:0046966) |
| 4.2 | 50.4 | GO:0017049 | GTP-Rho binding(GO:0017049) |
| 4.2 | 54.1 | GO:0043022 | ribosome binding(GO:0043022) |
| 4.2 | 108.1 | GO:0001671 | ATPase activator activity(GO:0001671) |
| 4.1 | 49.4 | GO:0017017 | MAP kinase tyrosine/serine/threonine phosphatase activity(GO:0017017) |
| 4.0 | 4.0 | GO:0034739 | histone deacetylase activity (H4-K16 specific)(GO:0034739) |
| 4.0 | 8.0 | GO:0004167 | dopachrome isomerase activity(GO:0004167) |
| 4.0 | 28.1 | GO:0016863 | intramolecular oxidoreductase activity, transposing C=C bonds(GO:0016863) |
| 4.0 | 24.0 | GO:0005114 | type II transforming growth factor beta receptor binding(GO:0005114) |
| 4.0 | 11.9 | GO:0016846 | carbon-sulfur lyase activity(GO:0016846) |
| 3.9 | 19.7 | GO:0047179 | platelet-activating factor acetyltransferase activity(GO:0047179) |
| 3.9 | 78.7 | GO:0032036 | myosin heavy chain binding(GO:0032036) |
| 3.9 | 366.0 | GO:0047485 | protein N-terminus binding(GO:0047485) |
| 3.9 | 15.6 | GO:0004853 | uroporphyrinogen decarboxylase activity(GO:0004853) |
| 3.9 | 108.7 | GO:0019956 | chemokine binding(GO:0019956) |
| 3.9 | 7.7 | GO:0051032 | nucleic acid transmembrane transporter activity(GO:0051032) RNA transmembrane transporter activity(GO:0051033) |
| 3.9 | 11.6 | GO:0016273 | arginine N-methyltransferase activity(GO:0016273) protein-arginine N-methyltransferase activity(GO:0016274) |
| 3.9 | 142.5 | GO:0030374 | ligand-dependent nuclear receptor transcription coactivator activity(GO:0030374) |
| 3.8 | 107.5 | GO:0005123 | death receptor binding(GO:0005123) |
| 3.8 | 34.3 | GO:0003831 | beta-N-acetylglucosaminylglycopeptide beta-1,4-galactosyltransferase activity(GO:0003831) |
| 3.8 | 19.0 | GO:0004809 | tRNA (guanine-N2-)-methyltransferase activity(GO:0004809) |
| 3.8 | 11.4 | GO:0052836 | inositol 5-diphosphate pentakisphosphate 5-kinase activity(GO:0052836) inositol diphosphate tetrakisphosphate kinase activity(GO:0052839) |
| 3.8 | 18.9 | GO:0036310 | annealing helicase activity(GO:0036310) |
| 3.8 | 11.3 | GO:0000253 | 3-keto sterol reductase activity(GO:0000253) |
| 3.8 | 71.6 | GO:0051721 | protein phosphatase 2A binding(GO:0051721) |
| 3.7 | 11.2 | GO:0032795 | heterotrimeric G-protein binding(GO:0032795) |
| 3.7 | 78.1 | GO:0008191 | metalloendopeptidase inhibitor activity(GO:0008191) |
| 3.7 | 144.6 | GO:0004407 | histone deacetylase activity(GO:0004407) |
| 3.7 | 29.5 | GO:0051525 | NFAT protein binding(GO:0051525) |
| 3.7 | 33.1 | GO:0042609 | CD4 receptor binding(GO:0042609) |
| 3.7 | 69.8 | GO:0045505 | dynein intermediate chain binding(GO:0045505) |
| 3.7 | 3.7 | GO:0032089 | NACHT domain binding(GO:0032089) |
| 3.7 | 25.6 | GO:1904264 | ubiquitin protein ligase activity involved in ERAD pathway(GO:1904264) |
| 3.6 | 21.9 | GO:0030369 | ICAM-3 receptor activity(GO:0030369) |
| 3.6 | 237.0 | GO:0008307 | structural constituent of muscle(GO:0008307) |
| 3.6 | 18.2 | GO:0019531 | oxalate transmembrane transporter activity(GO:0019531) |
| 3.6 | 90.7 | GO:0050431 | transforming growth factor beta binding(GO:0050431) |
| 3.6 | 14.5 | GO:0016655 | oxidoreductase activity, acting on NAD(P)H, quinone or similar compound as acceptor(GO:0016655) |
| 3.6 | 97.2 | GO:0036442 | hydrogen-exporting ATPase activity(GO:0036442) |
| 3.6 | 18.0 | GO:0047066 | phospholipid-hydroperoxide glutathione peroxidase activity(GO:0047066) |
| 3.6 | 46.2 | GO:0048407 | platelet-derived growth factor binding(GO:0048407) |
| 3.5 | 7.1 | GO:0017089 | glycolipid transporter activity(GO:0017089) |
| 3.5 | 240.3 | GO:0008565 | protein transporter activity(GO:0008565) |
| 3.5 | 3.5 | GO:0015038 | glutathione disulfide oxidoreductase activity(GO:0015038) |
| 3.5 | 28.0 | GO:0003726 | double-stranded RNA adenosine deaminase activity(GO:0003726) |
| 3.5 | 14.0 | GO:0004727 | prenylated protein tyrosine phosphatase activity(GO:0004727) |
| 3.5 | 3.5 | GO:0050693 | LBD domain binding(GO:0050693) |
| 3.4 | 20.5 | GO:0004000 | adenosine deaminase activity(GO:0004000) |
| 3.4 | 10.2 | GO:0001665 | alpha-N-acetylgalactosaminide alpha-2,6-sialyltransferase activity(GO:0001665) |
| 3.4 | 27.1 | GO:0016679 | oxidoreductase activity, acting on diphenols and related substances as donors(GO:0016679) |
| 3.4 | 27.0 | GO:0008569 | ATP-dependent microtubule motor activity, minus-end-directed(GO:0008569) |
| 3.4 | 3.4 | GO:0004315 | 3-oxoacyl-[acyl-carrier-protein] synthase activity(GO:0004315) |
| 3.3 | 67.0 | GO:0005385 | zinc ion transmembrane transporter activity(GO:0005385) |
| 3.3 | 10.0 | GO:0004300 | enoyl-CoA hydratase activity(GO:0004300) |
| 3.3 | 10.0 | GO:0052739 | phosphatidylserine 1-acylhydrolase activity(GO:0052739) |
| 3.3 | 16.6 | GO:0047844 | deoxycytidine deaminase activity(GO:0047844) |
| 3.3 | 10.0 | GO:0008240 | tripeptidyl-peptidase activity(GO:0008240) |
| 3.3 | 29.8 | GO:0070324 | thyroid hormone binding(GO:0070324) |
| 3.3 | 3.3 | GO:0031544 | peptidyl-proline 3-dioxygenase activity(GO:0031544) |
| 3.3 | 29.7 | GO:0016634 | oxidoreductase activity, acting on the CH-CH group of donors, oxygen as acceptor(GO:0016634) |
| 3.3 | 19.6 | GO:0042392 | sphingosine-1-phosphate phosphatase activity(GO:0042392) |
| 3.3 | 201.5 | GO:0004197 | cysteine-type endopeptidase activity(GO:0004197) |
| 3.2 | 9.7 | GO:0036080 | GDP-fucose transmembrane transporter activity(GO:0005457) purine nucleotide-sugar transmembrane transporter activity(GO:0036080) |
| 3.2 | 240.0 | GO:0051082 | unfolded protein binding(GO:0051082) |
| 3.2 | 67.3 | GO:0001221 | transcription cofactor binding(GO:0001221) |
| 3.2 | 6.4 | GO:0050211 | procollagen galactosyltransferase activity(GO:0050211) |
| 3.2 | 12.8 | GO:0048256 | flap endonuclease activity(GO:0048256) |
| 3.2 | 15.9 | GO:0052654 | branched-chain-amino-acid transaminase activity(GO:0004084) L-leucine transaminase activity(GO:0052654) L-valine transaminase activity(GO:0052655) L-isoleucine transaminase activity(GO:0052656) |
| 3.1 | 83.9 | GO:0000993 | RNA polymerase II core binding(GO:0000993) |
| 3.1 | 34.0 | GO:0004602 | glutathione peroxidase activity(GO:0004602) |
| 3.1 | 83.3 | GO:0016538 | cyclin-dependent protein serine/threonine kinase regulator activity(GO:0016538) |
| 3.1 | 9.2 | GO:0017018 | myosin phosphatase activity(GO:0017018) |
| 3.1 | 18.5 | GO:0004523 | RNA-DNA hybrid ribonuclease activity(GO:0004523) |
| 3.0 | 30.5 | GO:0031014 | troponin T binding(GO:0031014) |
| 3.0 | 45.6 | GO:0030547 | receptor inhibitor activity(GO:0030547) |
| 3.0 | 18.3 | GO:0008353 | RNA polymerase II carboxy-terminal domain kinase activity(GO:0008353) |
| 3.0 | 9.1 | GO:0070181 | small ribosomal subunit rRNA binding(GO:0070181) |
| 3.0 | 18.1 | GO:0003678 | DNA helicase activity(GO:0003678) |
| 3.0 | 21.1 | GO:0000182 | rDNA binding(GO:0000182) |
| 3.0 | 42.2 | GO:0008094 | DNA-dependent ATPase activity(GO:0008094) |
| 3.0 | 27.1 | GO:0034452 | dynactin binding(GO:0034452) |
| 3.0 | 15.0 | GO:0030348 | syntaxin-3 binding(GO:0030348) |
| 3.0 | 41.9 | GO:0030215 | semaphorin receptor binding(GO:0030215) |
| 3.0 | 14.8 | GO:0008332 | low voltage-gated calcium channel activity(GO:0008332) |
| 2.9 | 20.6 | GO:0015187 | glycine transmembrane transporter activity(GO:0015187) |
| 2.9 | 26.4 | GO:0004396 | glucokinase activity(GO:0004340) hexokinase activity(GO:0004396) fructokinase activity(GO:0008865) mannokinase activity(GO:0019158) |
| 2.9 | 20.3 | GO:0008607 | phosphorylase kinase regulator activity(GO:0008607) |
| 2.8 | 31.2 | GO:0031434 | mitogen-activated protein kinase kinase binding(GO:0031434) |
| 2.8 | 11.3 | GO:0001190 | transcriptional activator activity, RNA polymerase II transcription factor binding(GO:0001190) transcriptional repressor activity, RNA polymerase II activating transcription factor binding(GO:0098811) |
| 2.8 | 17.0 | GO:0005353 | fructose transmembrane transporter activity(GO:0005353) |
| 2.8 | 8.4 | GO:0004647 | phosphoserine phosphatase activity(GO:0004647) |
| 2.8 | 155.1 | GO:0003725 | double-stranded RNA binding(GO:0003725) |
| 2.7 | 120.7 | GO:0043130 | ubiquitin binding(GO:0043130) |
| 2.7 | 8.2 | GO:0046848 | hydroxyapatite binding(GO:0046848) |
| 2.7 | 16.2 | GO:0045545 | syndecan binding(GO:0045545) |
| 2.7 | 10.8 | GO:0017077 | oxidative phosphorylation uncoupler activity(GO:0017077) |
| 2.7 | 172.3 | GO:0016765 | transferase activity, transferring alkyl or aryl (other than methyl) groups(GO:0016765) |
| 2.7 | 356.3 | GO:0005178 | integrin binding(GO:0005178) |
| 2.7 | 31.9 | GO:0070034 | telomerase RNA binding(GO:0070034) |
| 2.7 | 15.9 | GO:0015057 | thrombin receptor activity(GO:0015057) |
| 2.6 | 108.6 | GO:0005154 | epidermal growth factor receptor binding(GO:0005154) |
| 2.6 | 73.8 | GO:0003887 | DNA-directed DNA polymerase activity(GO:0003887) |
| 2.6 | 31.4 | GO:0019855 | calcium channel inhibitor activity(GO:0019855) |
| 2.6 | 10.5 | GO:0102007 | lactonohydrolase activity(GO:0046573) acyl-L-homoserine-lactone lactonohydrolase activity(GO:0102007) |
| 2.6 | 5.2 | GO:0005172 | vascular endothelial growth factor receptor binding(GO:0005172) |
| 2.6 | 7.7 | GO:0031543 | peptidyl-proline dioxygenase activity(GO:0031543) |
| 2.6 | 359.3 | GO:0051015 | actin filament binding(GO:0051015) |
| 2.6 | 5.1 | GO:0032422 | purine-rich negative regulatory element binding(GO:0032422) |
| 2.5 | 170.6 | GO:0070888 | E-box binding(GO:0070888) |
| 2.5 | 5.1 | GO:0048408 | epidermal growth factor binding(GO:0048408) |
| 2.5 | 74.6 | GO:0016831 | carboxy-lyase activity(GO:0016831) |
| 2.4 | 12.2 | GO:0052650 | NADP-retinol dehydrogenase activity(GO:0052650) |
| 2.4 | 53.6 | GO:0070006 | metalloaminopeptidase activity(GO:0070006) |
| 2.4 | 7.2 | GO:0015222 | serotonin transmembrane transporter activity(GO:0015222) |
| 2.4 | 12.0 | GO:0031871 | proteinase activated receptor binding(GO:0031871) |
| 2.4 | 7.1 | GO:0046921 | glycoprotein 6-alpha-L-fucosyltransferase activity(GO:0008424) alpha-(1->6)-fucosyltransferase activity(GO:0046921) |
| 2.3 | 23.5 | GO:0001727 | lipid kinase activity(GO:0001727) |
| 2.3 | 16.4 | GO:0050542 | icosanoid binding(GO:0050542) icosatetraenoic acid binding(GO:0050543) arachidonic acid binding(GO:0050544) fatty acid derivative binding(GO:1901567) |
| 2.3 | 4.7 | GO:0004530 | deoxyribonuclease I activity(GO:0004530) |
| 2.3 | 6.9 | GO:0004914 | interleukin-5 receptor activity(GO:0004914) |
| 2.3 | 20.5 | GO:0051879 | Hsp90 protein binding(GO:0051879) |
| 2.3 | 84.1 | GO:0004864 | protein phosphatase inhibitor activity(GO:0004864) |
| 2.3 | 2367.7 | GO:0003723 | RNA binding(GO:0003723) |
| 2.3 | 6.8 | GO:0042947 | glucoside transmembrane transporter activity(GO:0042947) |
| 2.2 | 17.7 | GO:0004032 | alditol:NADP+ 1-oxidoreductase activity(GO:0004032) |
| 2.2 | 11.1 | GO:0019776 | Atg8 ligase activity(GO:0019776) |
| 2.2 | 112.3 | GO:0008234 | cysteine-type peptidase activity(GO:0008234) |
| 2.2 | 45.9 | GO:0043027 | cysteine-type endopeptidase inhibitor activity involved in apoptotic process(GO:0043027) |
| 2.2 | 36.9 | GO:0030296 | protein tyrosine kinase activator activity(GO:0030296) |
| 2.1 | 4.2 | GO:0048039 | ubiquinone binding(GO:0048039) |
| 2.1 | 19.0 | GO:0050700 | CARD domain binding(GO:0050700) |
| 2.1 | 4.2 | GO:0005131 | growth hormone receptor binding(GO:0005131) |
| 2.1 | 20.6 | GO:0008525 | phosphatidylcholine transporter activity(GO:0008525) |
| 2.0 | 8.1 | GO:0017169 | CDP-alcohol phosphatidyltransferase activity(GO:0017169) |
| 2.0 | 4.0 | GO:0008384 | IkappaB kinase activity(GO:0008384) |
| 2.0 | 6.0 | GO:0045182 | translation regulator activity(GO:0045182) |
| 2.0 | 2.0 | GO:0015556 | C4-dicarboxylate transmembrane transporter activity(GO:0015556) |
| 1.9 | 5.8 | GO:0030548 | acetylcholine receptor regulator activity(GO:0030548) neurotransmitter receptor regulator activity(GO:0099602) |
| 1.9 | 9.6 | GO:0033743 | peptide-methionine (R)-S-oxide reductase activity(GO:0033743) |
| 1.9 | 5.7 | GO:0035605 | peptidyl-cysteine S-nitrosylase activity(GO:0035605) |
| 1.9 | 9.6 | GO:0004966 | galanin receptor activity(GO:0004966) |
| 1.9 | 9.6 | GO:0004666 | prostaglandin-endoperoxide synthase activity(GO:0004666) |
| 1.9 | 15.2 | GO:0015245 | fatty acid transporter activity(GO:0015245) |
| 1.9 | 16.7 | GO:0004645 | phosphorylase activity(GO:0004645) |
| 1.9 | 14.8 | GO:0015923 | mannosidase activity(GO:0015923) |
| 1.8 | 5.5 | GO:0004958 | prostaglandin F receptor activity(GO:0004958) |
| 1.8 | 12.9 | GO:0043021 | ribonucleoprotein complex binding(GO:0043021) |
| 1.8 | 7.4 | GO:0047685 | amine sulfotransferase activity(GO:0047685) |
| 1.8 | 76.7 | GO:0008138 | protein tyrosine/serine/threonine phosphatase activity(GO:0008138) |
| 1.8 | 10.9 | GO:0031957 | very long-chain fatty acid-CoA ligase activity(GO:0031957) |
| 1.8 | 3.6 | GO:0016639 | oxidoreductase activity, acting on the CH-NH2 group of donors, NAD or NADP as acceptor(GO:0016639) |
| 1.8 | 7.2 | GO:0070576 | vitamin D 24-hydroxylase activity(GO:0070576) |
| 1.8 | 9.0 | GO:0000832 | inositol-1,3,4,5,6-pentakisphosphate kinase activity(GO:0000827) inositol hexakisphosphate kinase activity(GO:0000828) inositol heptakisphosphate kinase activity(GO:0000829) inositol hexakisphosphate 5-kinase activity(GO:0000832) diphosphoinositol-pentakisphosphate kinase activity(GO:0033857) inositol hexakisphosphate 1-kinase activity(GO:0052723) inositol hexakisphosphate 3-kinase activity(GO:0052724) |
| 1.8 | 16.2 | GO:0001609 | G-protein coupled adenosine receptor activity(GO:0001609) |
| 1.8 | 7.2 | GO:0042608 | T cell receptor binding(GO:0042608) |
| 1.8 | 14.1 | GO:0004022 | alcohol dehydrogenase (NAD) activity(GO:0004022) |
| 1.7 | 15.6 | GO:0035005 | 1-phosphatidylinositol-4-phosphate 3-kinase activity(GO:0035005) |
| 1.7 | 5.1 | GO:0051022 | GDP-dissociation inhibitor binding(GO:0051021) Rho GDP-dissociation inhibitor binding(GO:0051022) |
| 1.7 | 5.1 | GO:0030060 | L-malate dehydrogenase activity(GO:0030060) |
| 1.7 | 3.4 | GO:0004126 | cytidine deaminase activity(GO:0004126) |
| 1.7 | 18.6 | GO:0022889 | L-serine transmembrane transporter activity(GO:0015194) serine transmembrane transporter activity(GO:0022889) |
| 1.7 | 5.0 | GO:0047238 | glucuronosyl-N-acetylgalactosaminyl-proteoglycan 4-beta-N-acetylgalactosaminyltransferase activity(GO:0047238) |
| 1.6 | 11.5 | GO:0016840 | carbon-nitrogen lyase activity(GO:0016840) |
| 1.6 | 29.4 | GO:0005527 | macrolide binding(GO:0005527) FK506 binding(GO:0005528) |
| 1.6 | 14.4 | GO:0060072 | large conductance calcium-activated potassium channel activity(GO:0060072) |
| 1.6 | 6.4 | GO:0017160 | Ral GTPase binding(GO:0017160) |
| 1.6 | 6.3 | GO:0016524 | latrotoxin receptor activity(GO:0016524) |
| 1.6 | 6.3 | GO:0005384 | manganese ion transmembrane transporter activity(GO:0005384) |
| 1.6 | 1.6 | GO:0018812 | 3-hydroxyacyl-CoA dehydratase activity(GO:0018812) |
| 1.6 | 7.8 | GO:0004619 | bisphosphoglycerate mutase activity(GO:0004082) phosphoglycerate mutase activity(GO:0004619) 2,3-bisphosphoglycerate-dependent phosphoglycerate mutase activity(GO:0046538) |
| 1.6 | 3.1 | GO:0004104 | cholinesterase activity(GO:0004104) |
| 1.6 | 14.0 | GO:0005225 | volume-sensitive anion channel activity(GO:0005225) |
| 1.6 | 3.1 | GO:0004886 | 9-cis retinoic acid receptor activity(GO:0004886) |
| 1.5 | 24.7 | GO:0004467 | long-chain fatty acid-CoA ligase activity(GO:0004467) |
| 1.5 | 50.6 | GO:0005540 | hyaluronic acid binding(GO:0005540) |
| 1.5 | 12.2 | GO:0016814 | hydrolase activity, acting on carbon-nitrogen (but not peptide) bonds, in cyclic amidines(GO:0016814) |
| 1.5 | 10.6 | GO:0016403 | dimethylargininase activity(GO:0016403) |
| 1.5 | 22.4 | GO:0019870 | potassium channel inhibitor activity(GO:0019870) |
| 1.5 | 1.5 | GO:0045550 | geranylgeranyl reductase activity(GO:0045550) indanol dehydrogenase activity(GO:0047718) |
| 1.4 | 5.8 | GO:0008479 | queuine tRNA-ribosyltransferase activity(GO:0008479) |
| 1.4 | 20.5 | GO:0008140 | cAMP response element binding protein binding(GO:0008140) |
| 1.4 | 10.9 | GO:0016723 | oxidoreductase activity, oxidizing metal ions, NAD or NADP as acceptor(GO:0016723) |
| 1.4 | 9.5 | GO:0016167 | glial cell-derived neurotrophic factor receptor activity(GO:0016167) |
| 1.3 | 2.7 | GO:0047429 | nucleoside-triphosphate diphosphatase activity(GO:0047429) |
| 1.3 | 25.2 | GO:0044390 | ubiquitin conjugating enzyme binding(GO:0031624) ubiquitin-like protein conjugating enzyme binding(GO:0044390) |
| 1.3 | 19.9 | GO:0042974 | retinoic acid receptor binding(GO:0042974) |
| 1.3 | 7.9 | GO:0048185 | activin binding(GO:0048185) |
| 1.3 | 5.2 | GO:0000026 | alpha-1,2-mannosyltransferase activity(GO:0000026) |
| 1.3 | 10.4 | GO:0004812 | aminoacyl-tRNA ligase activity(GO:0004812) ligase activity, forming carbon-oxygen bonds(GO:0016875) ligase activity, forming aminoacyl-tRNA and related compounds(GO:0016876) |
| 1.3 | 5.1 | GO:0061665 | SUMO ligase activity(GO:0061665) |
| 1.3 | 6.3 | GO:0004392 | heme oxygenase (decyclizing) activity(GO:0004392) |
| 1.3 | 3.8 | GO:0015319 | sodium:inorganic phosphate symporter activity(GO:0015319) |
| 1.2 | 8.7 | GO:0034617 | tetrahydrobiopterin binding(GO:0034617) |
| 1.2 | 20.9 | GO:0034237 | protein kinase A regulatory subunit binding(GO:0034237) |
| 1.2 | 19.6 | GO:0004185 | serine-type carboxypeptidase activity(GO:0004185) |
| 1.2 | 2.4 | GO:0050659 | N-acetylgalactosamine 4-sulfate 6-O-sulfotransferase activity(GO:0050659) |
| 1.2 | 4.9 | GO:0008853 | exodeoxyribonuclease III activity(GO:0008853) |
| 1.2 | 20.0 | GO:0003951 | NAD+ kinase activity(GO:0003951) |
| 1.2 | 44.6 | GO:0015485 | cholesterol binding(GO:0015485) |
| 1.2 | 15.1 | GO:0015926 | glucosidase activity(GO:0015926) |
| 1.2 | 10.4 | GO:0035497 | cAMP response element binding(GO:0035497) |
| 1.1 | 2.3 | GO:0004365 | glyceraldehyde-3-phosphate dehydrogenase (NAD+) (phosphorylating) activity(GO:0004365) glyceraldehyde-3-phosphate dehydrogenase (NAD(P)+) (phosphorylating) activity(GO:0043891) |
| 1.1 | 8.0 | GO:0008093 | cytoskeletal adaptor activity(GO:0008093) |
| 1.1 | 3.4 | GO:0016790 | thiolester hydrolase activity(GO:0016790) |
| 1.1 | 4.5 | GO:0005124 | scavenger receptor binding(GO:0005124) |
| 1.1 | 52.9 | GO:0017112 | Rab guanyl-nucleotide exchange factor activity(GO:0017112) |
| 1.1 | 3.3 | GO:0004348 | glucosylceramidase activity(GO:0004348) |
| 1.1 | 2.1 | GO:0031692 | alpha-1B adrenergic receptor binding(GO:0031692) |
| 1.0 | 3.1 | GO:0052810 | 1-phosphatidylinositol-5-kinase activity(GO:0052810) |
| 1.0 | 75.0 | GO:0000979 | RNA polymerase II core promoter sequence-specific DNA binding(GO:0000979) |
| 1.0 | 20.1 | GO:0004869 | cysteine-type endopeptidase inhibitor activity(GO:0004869) |
| 1.0 | 9.0 | GO:0019136 | deoxynucleoside kinase activity(GO:0019136) |
| 1.0 | 3.0 | GO:0016936 | galactoside binding(GO:0016936) |
| 1.0 | 1.0 | GO:0019828 | aspartic-type endopeptidase inhibitor activity(GO:0019828) |
| 1.0 | 13.7 | GO:0048018 | receptor agonist activity(GO:0048018) |
| 1.0 | 92.5 | GO:0004867 | serine-type endopeptidase inhibitor activity(GO:0004867) |
| 1.0 | 22.0 | GO:0004402 | histone acetyltransferase activity(GO:0004402) |
| 1.0 | 9.6 | GO:0034062 | RNA polymerase activity(GO:0034062) |
| 0.9 | 7.6 | GO:0004303 | estradiol 17-beta-dehydrogenase activity(GO:0004303) |
| 0.9 | 1.8 | GO:0031826 | type 2A serotonin receptor binding(GO:0031826) |
| 0.9 | 319.8 | GO:0003712 | transcription cofactor activity(GO:0003712) |
| 0.9 | 4.5 | GO:0004771 | sterol esterase activity(GO:0004771) |
| 0.9 | 2.7 | GO:0035248 | alpha-1,4-N-acetylgalactosaminyltransferase activity(GO:0035248) |
| 0.9 | 3.4 | GO:0030346 | protein phosphatase 2B binding(GO:0030346) |
| 0.9 | 38.4 | GO:0035326 | enhancer binding(GO:0035326) |
| 0.8 | 3.2 | GO:0099580 | ion antiporter activity involved in regulation of postsynaptic membrane potential(GO:0099580) |
| 0.7 | 9.6 | GO:0031419 | cobalamin binding(GO:0031419) |
| 0.7 | 8.7 | GO:0016857 | racemase and epimerase activity, acting on carbohydrates and derivatives(GO:0016857) |
| 0.7 | 0.7 | GO:0019770 | IgG receptor activity(GO:0019770) |
| 0.7 | 42.6 | GO:0009055 | electron carrier activity(GO:0009055) |
| 0.7 | 15.1 | GO:0008574 | ATP-dependent microtubule motor activity, plus-end-directed(GO:0008574) |
| 0.7 | 4.8 | GO:0016724 | ferroxidase activity(GO:0004322) oxidoreductase activity, oxidizing metal ions, oxygen as acceptor(GO:0016724) |
| 0.7 | 12.2 | GO:0001848 | complement binding(GO:0001848) |
| 0.7 | 4.0 | GO:0098821 | BMP receptor activity(GO:0098821) |
| 0.6 | 0.6 | GO:0050508 | glucuronosyl-N-acetylglucosaminyl-proteoglycan 4-alpha-N-acetylglucosaminyltransferase activity(GO:0050508) |
| 0.6 | 3.1 | GO:0097016 | L27 domain binding(GO:0097016) |
| 0.6 | 1.8 | GO:0005136 | interleukin-4 receptor binding(GO:0005136) |
| 0.6 | 3.0 | GO:0016657 | GMP reductase activity(GO:0003920) oxidoreductase activity, acting on NAD(P)H, nitrogenous group as acceptor(GO:0016657) |
| 0.6 | 3.6 | GO:0050294 | steroid sulfotransferase activity(GO:0050294) |
| 0.6 | 3.0 | GO:0004427 | inorganic diphosphatase activity(GO:0004427) |
| 0.6 | 1.8 | GO:0004531 | deoxyribonuclease II activity(GO:0004531) |
| 0.6 | 1.8 | GO:0005176 | ErbB-2 class receptor binding(GO:0005176) |
| 0.6 | 36.6 | GO:0050839 | cell adhesion molecule binding(GO:0050839) |
| 0.6 | 2.3 | GO:0004924 | oncostatin-M receptor activity(GO:0004924) |
| 0.6 | 2.3 | GO:0032190 | acrosin binding(GO:0032190) |
| 0.6 | 5.6 | GO:0051371 | muscle alpha-actinin binding(GO:0051371) |
| 0.6 | 4.5 | GO:0016868 | intramolecular transferase activity, phosphotransferases(GO:0016868) |
| 0.6 | 10.5 | GO:0005080 | protein kinase C binding(GO:0005080) |
| 0.6 | 2.8 | GO:0008517 | folic acid transporter activity(GO:0008517) |
| 0.5 | 2.2 | GO:0004911 | interleukin-2 receptor activity(GO:0004911) interleukin-2 binding(GO:0019976) |
| 0.5 | 2.1 | GO:0004102 | choline O-acetyltransferase activity(GO:0004102) |
| 0.5 | 35.1 | GO:0001618 | virus receptor activity(GO:0001618) |
| 0.5 | 1.4 | GO:0086089 | voltage-gated potassium channel activity involved in atrial cardiac muscle cell action potential repolarization(GO:0086089) |
| 0.4 | 2.2 | GO:0004447 | iodide peroxidase activity(GO:0004447) |
| 0.4 | 4.7 | GO:0052744 | phosphatidylinositol-3-phosphatase activity(GO:0004438) phosphatidylinositol monophosphate phosphatase activity(GO:0052744) |
| 0.4 | 11.0 | GO:0008235 | metalloexopeptidase activity(GO:0008235) |
| 0.4 | 2.0 | GO:0034711 | inhibin binding(GO:0034711) |
| 0.4 | 1.2 | GO:0015321 | sodium-dependent phosphate transmembrane transporter activity(GO:0015321) |
| 0.4 | 1.2 | GO:0046870 | cadmium ion binding(GO:0046870) |
| 0.4 | 8.9 | GO:0050840 | extracellular matrix binding(GO:0050840) |
| 0.4 | 17.9 | GO:0032947 | protein complex scaffold(GO:0032947) |
| 0.4 | 2.9 | GO:0004691 | cAMP-dependent protein kinase activity(GO:0004691) |
| 0.3 | 1.6 | GO:0004105 | choline-phosphate cytidylyltransferase activity(GO:0004105) |
| 0.3 | 0.9 | GO:0016979 | lipoate-protein ligase activity(GO:0016979) |
| 0.3 | 0.8 | GO:0031435 | mitogen-activated protein kinase kinase kinase binding(GO:0031435) |
| 0.3 | 8.1 | GO:0005484 | SNAP receptor activity(GO:0005484) |
| 0.2 | 2.4 | GO:0031995 | insulin-like growth factor II binding(GO:0031995) |
| 0.2 | 27.5 | GO:0061630 | ubiquitin protein ligase activity(GO:0061630) |
| 0.2 | 17.4 | GO:0005070 | SH3/SH2 adaptor activity(GO:0005070) |
| 0.2 | 0.9 | GO:0005412 | glucose:sodium symporter activity(GO:0005412) |
| 0.2 | 0.4 | GO:0001165 | RNA polymerase I upstream control element sequence-specific DNA binding(GO:0001165) |
| 0.2 | 1.8 | GO:0005523 | tropomyosin binding(GO:0005523) |
| 0.2 | 2.3 | GO:0008239 | dipeptidyl-peptidase activity(GO:0008239) |
| 0.2 | 1.1 | GO:0005041 | low-density lipoprotein receptor activity(GO:0005041) |
| 0.2 | 1.0 | GO:0048101 | calcium- and calmodulin-regulated 3',5'-cyclic-GMP phosphodiesterase activity(GO:0048101) |
| 0.1 | 0.4 | GO:0043295 | glutathione binding(GO:0043295) |
| 0.1 | 5.3 | GO:0008013 | beta-catenin binding(GO:0008013) |
| 0.1 | 1.1 | GO:0005549 | odorant binding(GO:0005549) |
| 0.1 | 0.3 | GO:0003845 | 11-beta-hydroxysteroid dehydrogenase [NAD(P)] activity(GO:0003845) |
| 0.1 | 0.9 | GO:0033038 | bitter taste receptor activity(GO:0033038) |
| 0.1 | 0.8 | GO:0016628 | oxidoreductase activity, acting on the CH-CH group of donors, NAD or NADP as acceptor(GO:0016628) |
| 0.1 | 1.0 | GO:0035591 | signaling adaptor activity(GO:0035591) |
| 0.1 | 0.1 | GO:0005017 | platelet-derived growth factor-activated receptor activity(GO:0005017) |
| 0.0 | 0.2 | GO:0004962 | endothelin receptor activity(GO:0004962) |
| 0.0 | 0.2 | GO:0050694 | galactosylceramide sulfotransferase activity(GO:0001733) galactose 3-O-sulfotransferase activity(GO:0050694) |
| 0.0 | 0.2 | GO:0030881 | beta-2-microglobulin binding(GO:0030881) |
| 0.0 | 0.0 | GO:0005026 | transforming growth factor beta receptor activity, type II(GO:0005026) |
Gene overrepresentation in curated gene sets: canonical pathways category:
| Log-likelihood per target | Total log-likelihood | Term | Description |
|---|---|---|---|
| 21.4 | 42.9 | PID THROMBIN PAR1 PATHWAY | PAR1-mediated thrombin signaling events |
| 16.0 | 31.9 | PID IFNG PATHWAY | IFN-gamma pathway |
| 14.8 | 593.5 | PID SMAD2 3PATHWAY | Regulation of cytoplasmic and nuclear SMAD2/3 signaling |
| 14.5 | 203.0 | SA G2 AND M PHASES | Cdc25 activates the cdc2/cyclin B complex to induce the G2/M transition. |
| 14.3 | 1945.9 | PID MYC ACTIV PATHWAY | Validated targets of C-MYC transcriptional activation |
| 13.7 | 150.5 | ST IL 13 PATHWAY | Interleukin 13 (IL-13) Pathway |
| 10.5 | 240.4 | PID ATR PATHWAY | ATR signaling pathway |
| 9.9 | 257.3 | PID FANCONI PATHWAY | Fanconi anemia pathway |
| 9.8 | 459.7 | PID BARD1 PATHWAY | BARD1 signaling events |
| 9.5 | 66.5 | PID WNT SIGNALING PATHWAY | Wnt signaling network |
| 9.3 | 308.2 | PID ATM PATHWAY | ATM pathway |
| 9.3 | 511.4 | PID AURORA B PATHWAY | Aurora B signaling |
| 9.2 | 524.5 | PID PLK1 PATHWAY | PLK1 signaling events |
| 9.2 | 284.0 | PID NFKAPPAB CANONICAL PATHWAY | Canonical NF-kappaB pathway |
| 9.0 | 771.1 | PID ILK PATHWAY | Integrin-linked kinase signaling |
| 8.9 | 97.7 | SA G1 AND S PHASES | Cdk2, 4, and 6 bind cyclin D in G1, while cdk2/cyclin E promotes the G1/S transition. |
| 8.5 | 347.0 | SIG REGULATION OF THE ACTIN CYTOSKELETON BY RHO GTPASES | Genes related to regulation of the actin cytoskeleton |
| 6.9 | 250.0 | PID FOXM1 PATHWAY | FOXM1 transcription factor network |
| 6.9 | 345.6 | PID SYNDECAN 2 PATHWAY | Syndecan-2-mediated signaling events |
| 6.8 | 136.6 | PID HIF1A PATHWAY | Hypoxic and oxygen homeostasis regulation of HIF-1-alpha |
| 6.8 | 651.7 | PID E2F PATHWAY | E2F transcription factor network |
| 6.7 | 436.3 | PID RAC1 PATHWAY | RAC1 signaling pathway |
| 6.5 | 254.6 | NABA BASEMENT MEMBRANES | Genes encoding structural components of basement membranes |
| 6.3 | 31.6 | ST GRANULE CELL SURVIVAL PATHWAY | Granule Cell Survival Pathway is a specific case of more general PAC1 Receptor Pathway. |
| 6.1 | 352.1 | PID TELOMERASE PATHWAY | Regulation of Telomerase |
| 6.0 | 6.0 | SA PROGRAMMED CELL DEATH | Programmed cell death, or apoptosis, eliminates damaged or unneeded cells. |
| 5.8 | 324.7 | PID FOXO PATHWAY | FoxO family signaling |
| 5.5 | 16.4 | PID FAS PATHWAY | FAS (CD95) signaling pathway |
| 5.4 | 48.9 | SA B CELL RECEPTOR COMPLEXES | Antigen binding to B cell receptors activates protein tyrosine kinases, such as the Src family, which ultimate activate MAP kinases. |
| 5.4 | 215.5 | PID ALK1 PATHWAY | ALK1 signaling events |
| 5.3 | 37.0 | PID BETA CATENIN DEG PATHWAY | Degradation of beta catenin |
| 5.1 | 288.0 | PID INTEGRIN1 PATHWAY | Beta1 integrin cell surface interactions |
| 5.0 | 206.6 | PID SYNDECAN 1 PATHWAY | Syndecan-1-mediated signaling events |
| 5.0 | 65.3 | PID EPHA2 FWD PATHWAY | EPHA2 forward signaling |
| 4.9 | 103.6 | PID P38 MK2 PATHWAY | p38 signaling mediated by MAPKAP kinases |
| 4.8 | 47.9 | PID PI3KCI AKT PATHWAY | Class I PI3K signaling events mediated by Akt |
| 4.7 | 80.7 | PID DNA PK PATHWAY | DNA-PK pathway in nonhomologous end joining |
| 4.7 | 9.5 | PID HIV NEF PATHWAY | HIV-1 Nef: Negative effector of Fas and TNF-alpha |
| 4.7 | 485.0 | PID AR PATHWAY | Coregulation of Androgen receptor activity |
| 4.7 | 37.2 | PID RANBP2 PATHWAY | Sumoylation by RanBP2 regulates transcriptional repression |
| 4.6 | 114.2 | PID TOLL ENDOGENOUS PATHWAY | Endogenous TLR signaling |
| 4.5 | 108.1 | ST ERK1 ERK2 MAPK PATHWAY | ERK1/ERK2 MAPK Pathway |
| 4.4 | 75.6 | PID ERBB1 RECEPTOR PROXIMAL PATHWAY | EGF receptor (ErbB1) signaling pathway |
| 4.4 | 87.5 | PID AVB3 OPN PATHWAY | Osteopontin-mediated events |
| 4.3 | 64.4 | PID TRAIL PATHWAY | TRAIL signaling pathway |
| 4.3 | 252.9 | PID FAK PATHWAY | Signaling events mediated by focal adhesion kinase |
| 4.1 | 94.3 | PID IL2 PI3K PATHWAY | IL2 signaling events mediated by PI3K |
| 3.9 | 3.9 | SIG BCR SIGNALING PATHWAY | Members of the BCR signaling pathway |
| 3.9 | 109.4 | PID TNF PATHWAY | TNF receptor signaling pathway |
| 3.9 | 15.5 | PID NFKAPPAB ATYPICAL PATHWAY | Atypical NF-kappaB pathway |
| 3.7 | 204.5 | PID CASPASE PATHWAY | Caspase cascade in apoptosis |
| 3.7 | 96.2 | PID ERB GENOMIC PATHWAY | Validated nuclear estrogen receptor beta network |
| 3.7 | 118.4 | PID IL6 7 PATHWAY | IL6-mediated signaling events |
| 3.6 | 213.4 | PID CERAMIDE PATHWAY | Ceramide signaling pathway |
| 3.6 | 93.8 | PID HIF2PATHWAY | HIF-2-alpha transcription factor network |
| 3.4 | 95.5 | PID WNT NONCANONICAL PATHWAY | Noncanonical Wnt signaling pathway |
| 3.3 | 29.6 | PID IGF1 PATHWAY | IGF1 pathway |
| 3.3 | 196.2 | PID DELTA NP63 PATHWAY | Validated transcriptional targets of deltaNp63 isoforms |
| 3.3 | 13.0 | PID EPO PATHWAY | EPO signaling pathway |
| 3.2 | 107.0 | PID PS1 PATHWAY | Presenilin action in Notch and Wnt signaling |
| 3.2 | 38.0 | PID NEPHRIN NEPH1 PATHWAY | Nephrin/Neph1 signaling in the kidney podocyte |
| 3.1 | 27.6 | PID CD40 PATHWAY | CD40/CD40L signaling |
| 3.0 | 185.9 | PID HIF1 TFPATHWAY | HIF-1-alpha transcription factor network |
| 3.0 | 362.7 | PID P53 DOWNSTREAM PATHWAY | Direct p53 effectors |
| 3.0 | 21.0 | PID IL3 PATHWAY | IL3-mediated signaling events |
| 3.0 | 18.0 | SIG IL4RECEPTOR IN B LYPHOCYTES | Genes related to IL4 rceptor signaling in B lymphocytes |
| 3.0 | 32.9 | ST PHOSPHOINOSITIDE 3 KINASE PATHWAY | PI3K Pathway |
| 3.0 | 20.9 | PID IL8 CXCR2 PATHWAY | IL8- and CXCR2-mediated signaling events |
| 3.0 | 121.2 | PID TGFBR PATHWAY | TGF-beta receptor signaling |
| 2.9 | 83.0 | PID ECADHERIN STABILIZATION PATHWAY | Stabilization and expansion of the E-cadherin adherens junction |
| 2.8 | 22.5 | PID IL2 STAT5 PATHWAY | IL2 signaling events mediated by STAT5 |
| 2.7 | 99.7 | SIG INSULIN RECEPTOR PATHWAY IN CARDIAC MYOCYTES | Genes related to the insulin receptor pathway |
| 2.5 | 5.1 | PID SYNDECAN 3 PATHWAY | Syndecan-3-mediated signaling events |
| 2.1 | 45.5 | PID ARF 3PATHWAY | Arf1 pathway |
| 2.0 | 12.2 | PID THROMBIN PAR4 PATHWAY | PAR4-mediated thrombin signaling events |
| 1.9 | 23.4 | PID VEGF VEGFR PATHWAY | VEGF and VEGFR signaling network |
| 1.9 | 66.2 | PID AR TF PATHWAY | Regulation of Androgen receptor activity |
| 1.8 | 49.3 | PID P38 ALPHA BETA DOWNSTREAM PATHWAY | Signaling mediated by p38-alpha and p38-beta |
| 1.8 | 29.8 | PID IL2 1PATHWAY | IL2-mediated signaling events |
| 1.7 | 25.4 | PID RET PATHWAY | Signaling events regulated by Ret tyrosine kinase |
| 1.7 | 42.1 | PID P53 REGULATION PATHWAY | p53 pathway |
| 1.6 | 80.6 | PID PTP1B PATHWAY | Signaling events mediated by PTP1B |
| 1.6 | 51.3 | PID TAP63 PATHWAY | Validated transcriptional targets of TAp63 isoforms |
| 1.5 | 68.9 | PID HNF3B PATHWAY | FOXA2 and FOXA3 transcription factor networks |
| 1.5 | 33.5 | PID PRL SIGNALING EVENTS PATHWAY | Signaling events mediated by PRL |
| 1.4 | 25.1 | SIG CHEMOTAXIS | Genes related to chemotaxis |
| 1.4 | 325.7 | NABA ECM REGULATORS | Genes encoding enzymes and their regulators involved in the remodeling of the extracellular matrix |
| 1.2 | 50.0 | PID RAC1 REG PATHWAY | Regulation of RAC1 activity |
| 1.2 | 4.8 | SIG PIP3 SIGNALING IN B LYMPHOCYTES | Genes related to PIP3 signaling in B lymphocytes |
| 1.2 | 39.9 | PID LIS1 PATHWAY | Lissencephaly gene (LIS1) in neuronal migration and development |
| 1.2 | 89.0 | PID CMYB PATHWAY | C-MYB transcription factor network |
| 1.2 | 7.0 | SIG CD40PATHWAYMAP | Genes related to CD40 signaling |
| 1.1 | 13.9 | PID CD8 TCR PATHWAY | TCR signaling in naïve CD8+ T cells |
| 1.1 | 23.3 | PID ATF2 PATHWAY | ATF-2 transcription factor network |
| 1.0 | 182.2 | NABA ECM AFFILIATED | Genes encoding proteins affiliated structurally or functionally to extracellular matrix proteins |
| 1.0 | 6.1 | PID HDAC CLASSIII PATHWAY | Signaling events mediated by HDAC Class III |
| 1.0 | 4.1 | ST JAK STAT PATHWAY | Jak-STAT Pathway |
| 1.0 | 13.5 | PID ARF6 DOWNSTREAM PATHWAY | Arf6 downstream pathway |
| 0.9 | 9.3 | PID ERBB NETWORK PATHWAY | ErbB receptor signaling network |
| 0.9 | 17.4 | PID RHOA PATHWAY | RhoA signaling pathway |
| 0.8 | 29.9 | ST FAS SIGNALING PATHWAY | Fas Signaling Pathway |
| 0.8 | 10.3 | ST JNK MAPK PATHWAY | JNK MAPK Pathway |
| 0.7 | 35.2 | PID BETA CATENIN NUC PATHWAY | Regulation of nuclear beta catenin signaling and target gene transcription |
| 0.7 | 8.9 | PID ANTHRAX PATHWAY | Cellular roles of Anthrax toxin |
| 0.6 | 27.6 | WNT SIGNALING | Genes related to Wnt-mediated signal transduction |
| 0.4 | 5.6 | PID EPHRINB REV PATHWAY | Ephrin B reverse signaling |
| 0.4 | 12.2 | PID AJDISS 2PATHWAY | Posttranslational regulation of adherens junction stability and dissassembly |
| 0.3 | 5.8 | PID INTEGRIN2 PATHWAY | Beta2 integrin cell surface interactions |
| 0.3 | 6.6 | PID MAPK TRK PATHWAY | Trk receptor signaling mediated by the MAPK pathway |
| 0.3 | 4.7 | PID NOTCH PATHWAY | Notch signaling pathway |
| 0.2 | 3.2 | PID INTEGRIN CS PATHWAY | Integrin family cell surface interactions |
| 0.2 | 4.9 | PID VEGFR1 2 PATHWAY | Signaling events mediated by VEGFR1 and VEGFR2 |
| 0.1 | 3.7 | PID NFAT TFPATHWAY | Calcineurin-regulated NFAT-dependent transcription in lymphocytes |
| 0.1 | 4.1 | ST T CELL SIGNAL TRANSDUCTION | T Cell Signal Transduction |
| 0.1 | 0.1 | PID PDGFRA PATHWAY | PDGFR-alpha signaling pathway |
| 0.1 | 4.0 | PID REG GR PATHWAY | Glucocorticoid receptor regulatory network |
| 0.1 | 2.0 | PID MTOR 4PATHWAY | mTOR signaling pathway |
| 0.0 | 0.6 | PID ANGIOPOIETIN RECEPTOR PATHWAY | Angiopoietin receptor Tie2-mediated signaling |
| 0.0 | 0.0 | PID ALK2 PATHWAY | ALK2 signaling events |
| 0.0 | 0.0 | PID IL5 PATHWAY | IL5-mediated signaling events |
Gene overrepresentation in curated gene sets: REACTOME pathways category:
| Log-likelihood per target | Total log-likelihood | Term | Description |
|---|---|---|---|
| 26.2 | 392.8 | REACTOME SLBP DEPENDENT PROCESSING OF REPLICATION DEPENDENT HISTONE PRE MRNAS | Genes involved in SLBP Dependent Processing of Replication-Dependent Histone Pre-mRNAs |
| 25.8 | 850.3 | REACTOME SYNTHESIS AND INTERCONVERSION OF NUCLEOTIDE DI AND TRIPHOSPHATES | Genes involved in Synthesis and interconversion of nucleotide di- and triphosphates |
| 25.1 | 25.1 | REACTOME 3 UTR MEDIATED TRANSLATIONAL REGULATION | Genes involved in 3' -UTR-mediated translational regulation |
| 24.1 | 1759.2 | REACTOME REGULATION OF ORNITHINE DECARBOXYLASE ODC | Genes involved in Regulation of ornithine decarboxylase (ODC) |
| 23.3 | 46.7 | REACTOME CDT1 ASSOCIATION WITH THE CDC6 ORC ORIGIN COMPLEX | Genes involved in CDT1 association with the CDC6:ORC:origin complex |
| 23.1 | 345.9 | REACTOME APOPTOSIS INDUCED DNA FRAGMENTATION | Genes involved in Apoptosis induced DNA fragmentation |
| 22.4 | 335.6 | REACTOME UNWINDING OF DNA | Genes involved in Unwinding of DNA |
| 22.0 | 505.3 | REACTOME VIRAL MESSENGER RNA SYNTHESIS | Genes involved in Viral Messenger RNA Synthesis |
| 19.7 | 295.7 | REACTOME REMOVAL OF THE FLAP INTERMEDIATE FROM THE C STRAND | Genes involved in Removal of the Flap Intermediate from the C-strand |
| 19.4 | 638.9 | REACTOME APC C CDC20 MEDIATED DEGRADATION OF MITOTIC PROTEINS | Genes involved in APC/C:Cdc20 mediated degradation of mitotic proteins |
| 18.1 | 361.8 | REACTOME ER PHAGOSOME PATHWAY | Genes involved in ER-Phagosome pathway |
| 17.4 | 139.6 | REACTOME INFLUENZA VIRAL RNA TRANSCRIPTION AND REPLICATION | Genes involved in Influenza Viral RNA Transcription and Replication |
| 16.5 | 380.6 | REACTOME DEPOSITION OF NEW CENPA CONTAINING NUCLEOSOMES AT THE CENTROMERE | Genes involved in Deposition of New CENPA-containing Nucleosomes at the Centromere |
| 15.5 | 170.8 | REACTOME COPI MEDIATED TRANSPORT | Genes involved in COPI Mediated Transport |
| 15.3 | 152.8 | REACTOME NFKB IS ACTIVATED AND SIGNALS SURVIVAL | Genes involved in NF-kB is activated and signals survival |
| 14.9 | 164.1 | REACTOME APOBEC3G MEDIATED RESISTANCE TO HIV1 INFECTION | Genes involved in APOBEC3G mediated resistance to HIV-1 infection |
| 14.2 | 170.0 | REACTOME RAF MAP KINASE CASCADE | Genes involved in RAF/MAP kinase cascade |
| 14.2 | 467.3 | REACTOME CELL EXTRACELLULAR MATRIX INTERACTIONS | Genes involved in Cell-extracellular matrix interactions |
| 14.0 | 126.2 | REACTOME PURINE CATABOLISM | Genes involved in Purine catabolism |
| 13.9 | 13.9 | REACTOME NEP NS2 INTERACTS WITH THE CELLULAR EXPORT MACHINERY | Genes involved in NEP/NS2 Interacts with the Cellular Export Machinery |
| 13.9 | 236.4 | REACTOME ANTIGEN PRESENTATION FOLDING ASSEMBLY AND PEPTIDE LOADING OF CLASS I MHC | Genes involved in Antigen Presentation: Folding, assembly and peptide loading of class I MHC |
| 13.8 | 13.8 | REACTOME TRANSPORT OF MATURE MRNA DERIVED FROM AN INTRONLESS TRANSCRIPT | Genes involved in Transport of Mature mRNA Derived from an Intronless Transcript |
| 13.5 | 256.5 | REACTOME SYNTHESIS SECRETION AND DEACYLATION OF GHRELIN | Genes involved in Synthesis, Secretion, and Deacylation of Ghrelin |
| 13.5 | 202.3 | REACTOME PURINE RIBONUCLEOSIDE MONOPHOSPHATE BIOSYNTHESIS | Genes involved in Purine ribonucleoside monophosphate biosynthesis |
| 13.4 | 53.8 | REACTOME P130CAS LINKAGE TO MAPK SIGNALING FOR INTEGRINS | Genes involved in p130Cas linkage to MAPK signaling for integrins |
| 13.4 | 520.9 | REACTOME PYRIMIDINE METABOLISM | Genes involved in Pyrimidine metabolism |
| 13.3 | 40.0 | REACTOME P75NTR SIGNALS VIA NFKB | Genes involved in p75NTR signals via NF-kB |
| 13.2 | 539.4 | REACTOME PREFOLDIN MEDIATED TRANSFER OF SUBSTRATE TO CCT TRIC | Genes involved in Prefoldin mediated transfer of substrate to CCT/TriC |
| 13.1 | 288.7 | REACTOME CITRIC ACID CYCLE TCA CYCLE | Genes involved in Citric acid cycle (TCA cycle) |
| 13.0 | 764.8 | REACTOME MITOCHONDRIAL PROTEIN IMPORT | Genes involved in Mitochondrial Protein Import |
| 12.8 | 436.4 | REACTOME INTERACTIONS OF VPR WITH HOST CELLULAR PROTEINS | Genes involved in Interactions of Vpr with host cellular proteins |
| 12.7 | 216.2 | REACTOME MITOCHONDRIAL FATTY ACID BETA OXIDATION | Genes involved in Mitochondrial Fatty Acid Beta-Oxidation |
| 12.7 | 936.3 | REACTOME FORMATION OF THE TERNARY COMPLEX AND SUBSEQUENTLY THE 43S COMPLEX | Genes involved in Formation of the ternary complex, and subsequently, the 43S complex |
| 12.6 | 139.1 | REACTOME G1 S SPECIFIC TRANSCRIPTION | Genes involved in G1/S-Specific Transcription |
| 12.6 | 12.6 | REACTOME ACTIVATION OF THE MRNA UPON BINDING OF THE CAP BINDING COMPLEX AND EIFS AND SUBSEQUENT BINDING TO 43S | Genes involved in Activation of the mRNA upon binding of the cap-binding complex and eIFs, and subsequent binding to 43S |
| 12.4 | 199.0 | REACTOME VITAMIN B5 PANTOTHENATE METABOLISM | Genes involved in Vitamin B5 (pantothenate) metabolism |
| 12.4 | 12.4 | REACTOME PHOSPHORYLATION OF THE APC C | Genes involved in Phosphorylation of the APC/C |
| 11.8 | 1384.8 | REACTOME SRP DEPENDENT COTRANSLATIONAL PROTEIN TARGETING TO MEMBRANE | Genes involved in SRP-dependent cotranslational protein targeting to membrane |
| 11.7 | 411.2 | REACTOME PYRUVATE METABOLISM AND CITRIC ACID TCA CYCLE | Genes involved in Pyruvate metabolism and Citric Acid (TCA) cycle |
| 11.7 | 422.4 | REACTOME DEADENYLATION OF MRNA | Genes involved in Deadenylation of mRNA |
| 11.7 | 70.0 | REACTOME APC C CDH1 MEDIATED DEGRADATION OF CDC20 AND OTHER APC C CDH1 TARGETED PROTEINS IN LATE MITOSIS EARLY G1 | Genes involved in APC/C:Cdh1 mediated degradation of Cdc20 and other APC/C:Cdh1 targeted proteins in late mitosis/early G1 |
| 11.5 | 298.6 | REACTOME TRANSLATION | Genes involved in Translation |
| 11.3 | 270.5 | REACTOME CYCLIN A B1 ASSOCIATED EVENTS DURING G2 M TRANSITION | Genes involved in Cyclin A/B1 associated events during G2/M transition |
| 11.3 | 90.1 | REACTOME POL SWITCHING | Genes involved in Polymerase switching |
| 11.0 | 241.2 | REACTOME CYCLIN E ASSOCIATED EVENTS DURING G1 S TRANSITION | Genes involved in Cyclin E associated events during G1/S transition |
| 10.7 | 128.7 | REACTOME EXTENSION OF TELOMERES | Genes involved in Extension of Telomeres |
| 10.4 | 311.0 | REACTOME ENOS ACTIVATION AND REGULATION | Genes involved in eNOS activation and regulation |
| 10.2 | 20.5 | REACTOME MRNA DECAY BY 3 TO 5 EXORIBONUCLEASE | Genes involved in mRNA Decay by 3' to 5' Exoribonuclease |
| 10.1 | 231.3 | REACTOME REGULATION OF IFNG SIGNALING | Genes involved in Regulation of IFNG signaling |
| 9.6 | 181.5 | REACTOME MRNA SPLICING MINOR PATHWAY | Genes involved in mRNA Splicing - Minor Pathway |
| 9.5 | 162.3 | REACTOME GLOBAL GENOMIC NER GG NER | Genes involved in Global Genomic NER (GG-NER) |
| 9.3 | 428.2 | REACTOME DOWNREGULATION OF SMAD2 3 SMAD4 TRANSCRIPTIONAL ACTIVITY | Genes involved in Downregulation of SMAD2/3:SMAD4 transcriptional activity |
| 9.0 | 36.1 | REACTOME RECEPTOR LIGAND BINDING INITIATES THE SECOND PROTEOLYTIC CLEAVAGE OF NOTCH RECEPTOR | Genes involved in Receptor-ligand binding initiates the second proteolytic cleavage of Notch receptor |
| 9.0 | 1010.3 | REACTOME MRNA SPLICING | Genes involved in mRNA Splicing |
| 9.0 | 214.8 | REACTOME HYALURONAN UPTAKE AND DEGRADATION | Genes involved in Hyaluronan uptake and degradation |
| 8.9 | 186.6 | REACTOME ENDOSOMAL SORTING COMPLEX REQUIRED FOR TRANSPORT ESCRT | Genes involved in Endosomal Sorting Complex Required For Transport (ESCRT) |
| 8.9 | 115.4 | REACTOME DESTABILIZATION OF MRNA BY KSRP | Genes involved in Destabilization of mRNA by KSRP |
| 8.8 | 166.8 | REACTOME DESTABILIZATION OF MRNA BY TRISTETRAPROLIN TTP | Genes involved in Destabilization of mRNA by Tristetraprolin (TTP) |
| 8.7 | 69.3 | REACTOME DESTABILIZATION OF MRNA BY AUF1 HNRNP D0 | Genes involved in Destabilization of mRNA by AUF1 (hnRNP D0) |
| 8.5 | 221.8 | REACTOME DOWNREGULATION OF TGF BETA RECEPTOR SIGNALING | Genes involved in Downregulation of TGF-beta receptor signaling |
| 8.5 | 119.2 | REACTOME PECAM1 INTERACTIONS | Genes involved in PECAM1 interactions |
| 8.5 | 323.0 | REACTOME FATTY ACYL COA BIOSYNTHESIS | Genes involved in Fatty Acyl-CoA Biosynthesis |
| 8.4 | 185.0 | REACTOME PURINE METABOLISM | Genes involved in Purine metabolism |
| 8.4 | 67.1 | REACTOME REGULATION OF THE FANCONI ANEMIA PATHWAY | Genes involved in Regulation of the Fanconi anemia pathway |
| 8.4 | 41.9 | REACTOME ACTIVATION OF THE PRE REPLICATIVE COMPLEX | Genes involved in Activation of the pre-replicative complex |
| 8.2 | 370.8 | REACTOME ANTIVIRAL MECHANISM BY IFN STIMULATED GENES | Genes involved in Antiviral mechanism by IFN-stimulated genes |
| 8.2 | 65.3 | REACTOME SMAD2 SMAD3 SMAD4 HETEROTRIMER REGULATES TRANSCRIPTION | Genes involved in SMAD2/SMAD3:SMAD4 heterotrimer regulates transcription |
| 8.1 | 97.7 | REACTOME NFKB ACTIVATION THROUGH FADD RIP1 PATHWAY MEDIATED BY CASPASE 8 AND10 | Genes involved in NF-kB activation through FADD/RIP-1 pathway mediated by caspase-8 and -10 |
| 8.1 | 146.3 | REACTOME NOTCH HLH TRANSCRIPTION PATHWAY | Genes involved in Notch-HLH transcription pathway |
| 8.1 | 145.3 | REACTOME METABOLISM OF POLYAMINES | Genes involved in Metabolism of polyamines |
| 7.9 | 79.4 | REACTOME POST CHAPERONIN TUBULIN FOLDING PATHWAY | Genes involved in Post-chaperonin tubulin folding pathway |
| 7.9 | 78.6 | REACTOME S PHASE | Genes involved in S Phase |
| 7.8 | 139.6 | REACTOME OXYGEN DEPENDENT PROLINE HYDROXYLATION OF HYPOXIA INDUCIBLE FACTOR ALPHA | Genes involved in Oxygen-dependent Proline Hydroxylation of Hypoxia-inducible Factor Alpha |
| 7.5 | 734.4 | REACTOME APOPTOTIC EXECUTION PHASE | Genes involved in Apoptotic execution phase |
| 7.5 | 29.8 | REACTOME NRAGE SIGNALS DEATH THROUGH JNK | Genes involved in NRAGE signals death through JNK |
| 7.4 | 297.4 | REACTOME CHOLESTEROL BIOSYNTHESIS | Genes involved in Cholesterol biosynthesis |
| 7.4 | 29.5 | REACTOME SYNTHESIS OF PIPS AT THE EARLY ENDOSOME MEMBRANE | Genes involved in Synthesis of PIPs at the early endosome membrane |
| 7.3 | 232.5 | REACTOME RNA POL II TRANSCRIPTION PRE INITIATION AND PROMOTER OPENING | Genes involved in RNA Polymerase II Transcription Pre-Initiation And Promoter Opening |
| 7.3 | 617.5 | REACTOME MITOTIC M M G1 PHASES | Genes involved in Mitotic M-M/G1 phases |
| 6.9 | 206.9 | REACTOME TRANSFERRIN ENDOCYTOSIS AND RECYCLING | Genes involved in Transferrin endocytosis and recycling |
| 6.5 | 32.6 | REACTOME P53 INDEPENDENT G1 S DNA DAMAGE CHECKPOINT | Genes involved in p53-Independent G1/S DNA damage checkpoint |
| 6.5 | 110.2 | REACTOME SIGNALING BY HIPPO | Genes involved in Signaling by Hippo |
| 6.5 | 309.9 | REACTOME GLYCOLYSIS | Genes involved in Glycolysis |
| 6.3 | 69.8 | REACTOME RNA POL III CHAIN ELONGATION | Genes involved in RNA Polymerase III Chain Elongation |
| 6.3 | 119.7 | REACTOME ACTIVATION OF BH3 ONLY PROTEINS | Genes involved in Activation of BH3-only proteins |
| 6.3 | 12.6 | REACTOME MEMBRANE BINDING AND TARGETTING OF GAG PROTEINS | Genes involved in Membrane binding and targetting of GAG proteins |
| 6.3 | 88.0 | REACTOME DEADENYLATION DEPENDENT MRNA DECAY | Genes involved in Deadenylation-dependent mRNA decay |
| 6.2 | 493.1 | REACTOME RESPIRATORY ELECTRON TRANSPORT | Genes involved in Respiratory electron transport |
| 6.2 | 295.6 | REACTOME SMOOTH MUSCLE CONTRACTION | Genes involved in Smooth Muscle Contraction |
| 5.8 | 151.0 | REACTOME HS GAG DEGRADATION | Genes involved in HS-GAG degradation |
| 5.6 | 371.9 | REACTOME COLLAGEN FORMATION | Genes involved in Collagen formation |
| 5.5 | 5.5 | REACTOME APC CDC20 MEDIATED DEGRADATION OF NEK2A | Genes involved in APC-Cdc20 mediated degradation of Nek2A |
| 5.4 | 48.3 | REACTOME CYTOSOLIC TRNA AMINOACYLATION | Genes involved in Cytosolic tRNA aminoacylation |
| 5.1 | 138.5 | REACTOME AMINO ACID SYNTHESIS AND INTERCONVERSION TRANSAMINATION | Genes involved in Amino acid synthesis and interconversion (transamination) |
| 5.0 | 150.7 | REACTOME METABOLISM OF PORPHYRINS | Genes involved in Metabolism of porphyrins |
| 5.0 | 95.4 | REACTOME PROTEIN FOLDING | Genes involved in Protein folding |
| 4.9 | 163.0 | REACTOME POST TRANSLATIONAL MODIFICATION SYNTHESIS OF GPI ANCHORED PROTEINS | Genes involved in Post-translational modification: synthesis of GPI-anchored proteins |
| 4.9 | 93.5 | REACTOME SIGNALING BY NODAL | Genes involved in Signaling by NODAL |
| 4.9 | 58.4 | REACTOME N GLYCAN TRIMMING IN THE ER AND CALNEXIN CALRETICULIN CYCLE | Genes involved in N-glycan trimming in the ER and Calnexin/Calreticulin cycle |
| 4.8 | 116.3 | REACTOME SULFUR AMINO ACID METABOLISM | Genes involved in Sulfur amino acid metabolism |
| 4.8 | 48.3 | REACTOME ACTIVATION OF NF KAPPAB IN B CELLS | Genes involved in Activation of NF-kappaB in B Cells |
| 4.8 | 154.0 | REACTOME SIGNALING BY FGFR1 FUSION MUTANTS | Genes involved in Signaling by FGFR1 fusion mutants |
| 4.8 | 67.3 | REACTOME METABOLISM OF NON CODING RNA | Genes involved in Metabolism of non-coding RNA |
| 4.8 | 47.8 | REACTOME REGULATION OF MRNA STABILITY BY PROTEINS THAT BIND AU RICH ELEMENTS | Genes involved in Regulation of mRNA Stability by Proteins that Bind AU-rich Elements |
| 4.8 | 133.6 | REACTOME G1 PHASE | Genes involved in G1 Phase |
| 4.7 | 28.2 | REACTOME TGF BETA RECEPTOR SIGNALING ACTIVATES SMADS | Genes involved in TGF-beta receptor signaling activates SMADs |
| 4.6 | 198.8 | REACTOME TRANSPORT OF VITAMINS NUCLEOSIDES AND RELATED MOLECULES | Genes involved in Transport of vitamins, nucleosides, and related molecules |
| 4.6 | 567.8 | REACTOME RESPONSE TO ELEVATED PLATELET CYTOSOLIC CA2 | Genes involved in Response to elevated platelet cytosolic Ca2+ |
| 4.5 | 36.0 | REACTOME MITOTIC G1 G1 S PHASES | Genes involved in Mitotic G1-G1/S phases |
| 4.4 | 198.1 | REACTOME TRANSPORT TO THE GOLGI AND SUBSEQUENT MODIFICATION | Genes involved in Transport to the Golgi and subsequent modification |
| 4.4 | 78.7 | REACTOME ZINC TRANSPORTERS | Genes involved in Zinc transporters |
| 4.3 | 4.3 | REACTOME TRANSLOCATION OF ZAP 70 TO IMMUNOLOGICAL SYNAPSE | Genes involved in Translocation of ZAP-70 to Immunological synapse |
| 4.3 | 630.1 | REACTOME ANTIGEN PROCESSING UBIQUITINATION PROTEASOME DEGRADATION | Genes involved in Antigen processing: Ubiquitination & Proteasome degradation |
| 4.2 | 37.5 | REACTOME MRNA PROCESSING | Genes involved in mRNA Processing |
| 4.1 | 24.9 | REACTOME PRE NOTCH TRANSCRIPTION AND TRANSLATION | Genes involved in Pre-NOTCH Transcription and Translation |
| 4.1 | 45.5 | REACTOME VEGF LIGAND RECEPTOR INTERACTIONS | Genes involved in VEGF ligand-receptor interactions |
| 4.1 | 57.2 | REACTOME ALPHA LINOLENIC ACID ALA METABOLISM | Genes involved in alpha-linolenic acid (ALA) metabolism |
| 4.0 | 4.0 | REACTOME PROCESSING OF CAPPED INTRON CONTAINING PRE MRNA | Genes involved in Processing of Capped Intron-Containing Pre-mRNA |
| 3.8 | 98.3 | REACTOME LATE PHASE OF HIV LIFE CYCLE | Genes involved in Late Phase of HIV Life Cycle |
| 3.6 | 46.3 | REACTOME THE NLRP3 INFLAMMASOME | Genes involved in The NLRP3 inflammasome |
| 3.5 | 184.5 | REACTOME ACTIVATION OF CHAPERONE GENES BY XBP1S | Genes involved in Activation of Chaperone Genes by XBP1(S) |
| 3.5 | 49.4 | REACTOME TRAFFICKING AND PROCESSING OF ENDOSOMAL TLR | Genes involved in Trafficking and processing of endosomal TLR |
| 3.4 | 126.6 | REACTOME RECYCLING PATHWAY OF L1 | Genes involved in Recycling pathway of L1 |
| 3.4 | 97.7 | REACTOME DOUBLE STRAND BREAK REPAIR | Genes involved in Double-Strand Break Repair |
| 3.3 | 76.0 | REACTOME EXTRINSIC PATHWAY FOR APOPTOSIS | Genes involved in Extrinsic Pathway for Apoptosis |
| 3.3 | 85.3 | REACTOME ADP SIGNALLING THROUGH P2RY12 | Genes involved in ADP signalling through P2Y purinoceptor 12 |
| 3.2 | 64.0 | REACTOME GLYCOGEN BREAKDOWN GLYCOGENOLYSIS | Genes involved in Glycogen breakdown (glycogenolysis) |
| 3.1 | 12.3 | REACTOME FGFR1 LIGAND BINDING AND ACTIVATION | Genes involved in FGFR1 ligand binding and activation |
| 3.1 | 85.5 | REACTOME SPHINGOLIPID DE NOVO BIOSYNTHESIS | Genes involved in Sphingolipid de novo biosynthesis |
| 3.0 | 24.4 | REACTOME MTORC1 MEDIATED SIGNALLING | Genes involved in mTORC1-mediated signalling |
| 2.9 | 55.2 | REACTOME NEPHRIN INTERACTIONS | Genes involved in Nephrin interactions |
| 2.8 | 2.8 | REACTOME GLUCAGON SIGNALING IN METABOLIC REGULATION | Genes involved in Glucagon signaling in metabolic regulation |
| 2.8 | 222.0 | REACTOME TRANS GOLGI NETWORK VESICLE BUDDING | Genes involved in trans-Golgi Network Vesicle Budding |
| 2.7 | 10.8 | REACTOME TCA CYCLE AND RESPIRATORY ELECTRON TRANSPORT | Genes involved in The citric acid (TCA) cycle and respiratory electron transport |
| 2.6 | 52.7 | REACTOME BASE FREE SUGAR PHOSPHATE REMOVAL VIA THE SINGLE NUCLEOTIDE REPLACEMENT PATHWAY | Genes involved in Base-free sugar-phosphate removal via the single-nucleotide replacement pathway |
| 2.6 | 75.7 | REACTOME RORA ACTIVATES CIRCADIAN EXPRESSION | Genes involved in RORA Activates Circadian Expression |
| 2.6 | 20.8 | REACTOME INFLAMMASOMES | Genes involved in Inflammasomes |
| 2.6 | 26.0 | REACTOME GAP JUNCTION DEGRADATION | Genes involved in Gap junction degradation |
| 2.6 | 87.2 | REACTOME O LINKED GLYCOSYLATION OF MUCINS | Genes involved in O-linked glycosylation of mucins |
| 2.5 | 40.2 | REACTOME BMAL1 CLOCK NPAS2 ACTIVATES CIRCADIAN EXPRESSION | Genes involved in BMAL1:CLOCK/NPAS2 Activates Circadian Expression |
| 2.5 | 12.5 | REACTOME CROSS PRESENTATION OF SOLUBLE EXOGENOUS ANTIGENS ENDOSOMES | Genes involved in Cross-presentation of soluble exogenous antigens (endosomes) |
| 2.4 | 41.1 | REACTOME GLUCOSE TRANSPORT | Genes involved in Glucose transport |
| 2.4 | 83.9 | REACTOME SEMA4D INDUCED CELL MIGRATION AND GROWTH CONE COLLAPSE | Genes involved in Sema4D induced cell migration and growth-cone collapse |
| 2.4 | 33.5 | REACTOME CHYLOMICRON MEDIATED LIPID TRANSPORT | Genes involved in Chylomicron-mediated lipid transport |
| 2.3 | 36.3 | REACTOME INSULIN SYNTHESIS AND PROCESSING | Genes involved in Insulin Synthesis and Processing |
| 2.2 | 33.2 | REACTOME MEIOTIC RECOMBINATION | Genes involved in Meiotic Recombination |
| 2.2 | 19.9 | REACTOME ELEVATION OF CYTOSOLIC CA2 LEVELS | Genes involved in Elevation of cytosolic Ca2+ levels |
| 2.2 | 6.6 | REACTOME SPRY REGULATION OF FGF SIGNALING | Genes involved in Spry regulation of FGF signaling |
| 2.1 | 62.3 | REACTOME BASIGIN INTERACTIONS | Genes involved in Basigin interactions |
| 2.1 | 60.1 | REACTOME BRANCHED CHAIN AMINO ACID CATABOLISM | Genes involved in Branched-chain amino acid catabolism |
| 2.1 | 67.8 | REACTOME MEIOSIS | Genes involved in Meiosis |
| 2.1 | 12.3 | REACTOME HORMONE SENSITIVE LIPASE HSL MEDIATED TRIACYLGLYCEROL HYDROLYSIS | Genes involved in Hormone-sensitive lipase (HSL)-mediated triacylglycerol hydrolysis |
| 2.0 | 17.9 | REACTOME SIGNALING BY NOTCH4 | Genes involved in Signaling by NOTCH4 |
| 2.0 | 39.2 | REACTOME CIRCADIAN CLOCK | Genes involved in Circadian Clock |
| 1.9 | 15.6 | REACTOME REGULATORY RNA PATHWAYS | Genes involved in Regulatory RNA pathways |
| 1.9 | 21.4 | REACTOME NEGATIVE REGULATION OF THE PI3K AKT NETWORK | Genes involved in Negative regulation of the PI3K/AKT network |
| 1.8 | 18.2 | REACTOME ADVANCED GLYCOSYLATION ENDPRODUCT RECEPTOR SIGNALING | Genes involved in Advanced glycosylation endproduct receptor signaling |
| 1.8 | 18.0 | REACTOME SIGNALLING TO P38 VIA RIT AND RIN | Genes involved in Signalling to p38 via RIT and RIN |
| 1.6 | 250.2 | REACTOME METABOLISM OF CARBOHYDRATES | Genes involved in Metabolism of carbohydrates |
| 1.6 | 11.0 | REACTOME ERKS ARE INACTIVATED | Genes involved in ERKs are inactivated |
| 1.5 | 9.3 | REACTOME G2 M CHECKPOINTS | Genes involved in G2/M Checkpoints |
| 1.5 | 66.2 | REACTOME GLYCOSPHINGOLIPID METABOLISM | Genes involved in Glycosphingolipid metabolism |
| 1.4 | 8.6 | REACTOME PLATELET SENSITIZATION BY LDL | Genes involved in Platelet sensitization by LDL |
| 1.4 | 41.6 | REACTOME GLUTATHIONE CONJUGATION | Genes involved in Glutathione conjugation |
| 1.4 | 15.6 | REACTOME REGULATION OF WATER BALANCE BY RENAL AQUAPORINS | Genes involved in Regulation of Water Balance by Renal Aquaporins |
| 1.4 | 25.0 | REACTOME PEROXISOMAL LIPID METABOLISM | Genes involved in Peroxisomal lipid metabolism |
| 1.4 | 31.9 | REACTOME REGULATION OF COMPLEMENT CASCADE | Genes involved in Regulation of Complement cascade |
| 1.4 | 77.9 | REACTOME TRANSCRIPTIONAL REGULATION OF WHITE ADIPOCYTE DIFFERENTIATION | Genes involved in Transcriptional Regulation of White Adipocyte Differentiation |
| 1.3 | 54.3 | REACTOME PPARA ACTIVATES GENE EXPRESSION | Genes involved in PPARA Activates Gene Expression |
| 1.3 | 19.8 | REACTOME TIE2 SIGNALING | Genes involved in Tie2 Signaling |
| 1.3 | 15.5 | REACTOME GAMMA CARBOXYLATION TRANSPORT AND AMINO TERMINAL CLEAVAGE OF PROTEINS | Genes involved in Gamma-carboxylation, transport, and amino-terminal cleavage of proteins |
| 1.3 | 12.8 | REACTOME RECYCLING OF BILE ACIDS AND SALTS | Genes involved in Recycling of bile acids and salts |
| 1.3 | 22.7 | REACTOME GLUCURONIDATION | Genes involved in Glucuronidation |
| 1.2 | 30.9 | REACTOME GROWTH HORMONE RECEPTOR SIGNALING | Genes involved in Growth hormone receptor signaling |
| 1.2 | 136.5 | REACTOME FACTORS INVOLVED IN MEGAKARYOCYTE DEVELOPMENT AND PLATELET PRODUCTION | Genes involved in Factors involved in megakaryocyte development and platelet production |
| 1.2 | 16.5 | REACTOME SYNTHESIS OF PIPS AT THE LATE ENDOSOME MEMBRANE | Genes involved in Synthesis of PIPs at the late endosome membrane |
| 1.1 | 6.7 | REACTOME SEMA4D IN SEMAPHORIN SIGNALING | Genes involved in Sema4D in semaphorin signaling |
| 1.1 | 7.5 | REACTOME SIGNAL ATTENUATION | Genes involved in Signal attenuation |
| 1.1 | 22.6 | REACTOME REGULATION OF IFNA SIGNALING | Genes involved in Regulation of IFNA signaling |
| 1.1 | 9.6 | REACTOME TRAF6 MEDIATED INDUCTION OF TAK1 COMPLEX | Genes involved in TRAF6 mediated induction of TAK1 complex |
| 1.1 | 12.8 | REACTOME DCC MEDIATED ATTRACTIVE SIGNALING | Genes involved in DCC mediated attractive signaling |
| 1.1 | 13.7 | REACTOME RNA POL III TRANSCRIPTION TERMINATION | Genes involved in RNA Polymerase III Transcription Termination |
| 1.0 | 35.6 | REACTOME ADHERENS JUNCTIONS INTERACTIONS | Genes involved in Adherens junctions interactions |
| 1.0 | 5.0 | REACTOME G BETA GAMMA SIGNALLING THROUGH PLC BETA | Genes involved in G beta:gamma signalling through PLC beta |
| 1.0 | 22.4 | REACTOME IL RECEPTOR SHC SIGNALING | Genes involved in Interleukin receptor SHC signaling |
| 0.8 | 132.0 | REACTOME SIGNALING BY RHO GTPASES | Genes involved in Signaling by Rho GTPases |
| 0.8 | 14.8 | REACTOME SIGNALING BY BMP | Genes involved in Signaling by BMP |
| 0.7 | 23.4 | REACTOME PHASE II CONJUGATION | Genes involved in Phase II conjugation |
| 0.7 | 15.7 | REACTOME PROTEOLYTIC CLEAVAGE OF SNARE COMPLEX PROTEINS | Genes involved in Proteolytic cleavage of SNARE complex proteins |
| 0.6 | 3.0 | REACTOME NUCLEAR EVENTS KINASE AND TRANSCRIPTION FACTOR ACTIVATION | Genes involved in Nuclear Events (kinase and transcription factor activation) |
| 0.6 | 3.3 | REACTOME RNA POL I PROMOTER OPENING | Genes involved in RNA Polymerase I Promoter Opening |
| 0.5 | 1.6 | REACTOME ROLE OF SECOND MESSENGERS IN NETRIN1 SIGNALING | Genes involved in Role of second messengers in netrin-1 signaling |
| 0.5 | 20.9 | REACTOME INTERFERON ALPHA BETA SIGNALING | Genes involved in Interferon alpha/beta signaling |
| 0.5 | 1.4 | REACTOME GASTRIN CREB SIGNALLING PATHWAY VIA PKC AND MAPK | Genes involved in Gastrin-CREB signalling pathway via PKC and MAPK |
| 0.4 | 7.5 | REACTOME NETRIN1 SIGNALING | Genes involved in Netrin-1 signaling |
| 0.4 | 6.7 | REACTOME GENERATION OF SECOND MESSENGER MOLECULES | Genes involved in Generation of second messenger molecules |
| 0.3 | 8.4 | REACTOME SYNTHESIS OF PC | Genes involved in Synthesis of PC |
| 0.3 | 9.5 | REACTOME EXTRACELLULAR MATRIX ORGANIZATION | Genes involved in Extracellular matrix organization |
| 0.3 | 7.6 | REACTOME NUCLEOTIDE LIKE PURINERGIC RECEPTORS | Genes involved in Nucleotide-like (purinergic) receptors |
| 0.3 | 2.6 | REACTOME IRON UPTAKE AND TRANSPORT | Genes involved in Iron uptake and transport |
| 0.3 | 0.6 | REACTOME IRAK1 RECRUITS IKK COMPLEX | Genes involved in IRAK1 recruits IKK complex |
| 0.3 | 0.6 | REACTOME DSCAM INTERACTIONS | Genes involved in DSCAM interactions |
| 0.3 | 3.4 | REACTOME HDL MEDIATED LIPID TRANSPORT | Genes involved in HDL-mediated lipid transport |
| 0.3 | 5.6 | REACTOME SHC1 EVENTS IN ERBB4 SIGNALING | Genes involved in SHC1 events in ERBB4 signaling |
| 0.3 | 3.2 | REACTOME GLYCOPROTEIN HORMONES | Genes involved in Glycoprotein hormones |
| 0.3 | 4.4 | REACTOME PROSTACYCLIN SIGNALLING THROUGH PROSTACYCLIN RECEPTOR | Genes involved in Prostacyclin signalling through prostacyclin receptor |
| 0.2 | 5.4 | REACTOME CELL SURFACE INTERACTIONS AT THE VASCULAR WALL | Genes involved in Cell surface interactions at the vascular wall |
| 0.2 | 0.5 | REACTOME IL 7 SIGNALING | Genes involved in Interleukin-7 signaling |
| 0.2 | 1.1 | REACTOME CLASS I MHC MEDIATED ANTIGEN PROCESSING PRESENTATION | Genes involved in Class I MHC mediated antigen processing & presentation |
| 0.1 | 2.8 | REACTOME NEGATIVE REGULATORS OF RIG I MDA5 SIGNALING | Genes involved in Negative regulators of RIG-I/MDA5 signaling |