Project
GNF SymAtlas + NCI-60 cancer cell lines, human (Su, 2004; Ross, 2000)
Navigation
Downloads
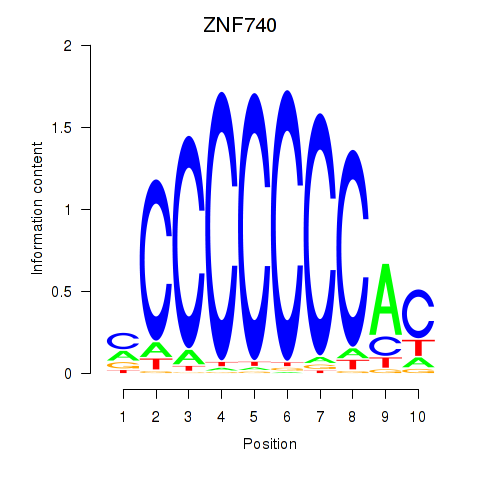
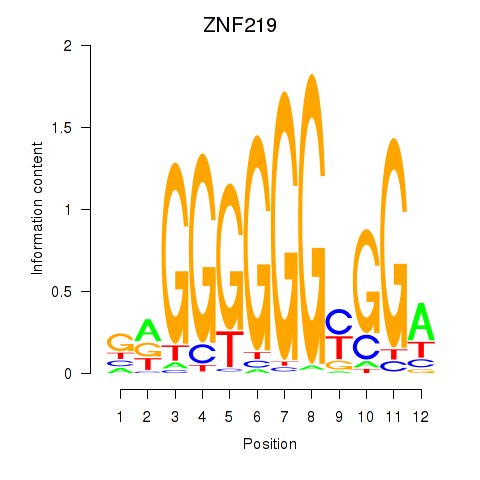
Results for ZNF740_ZNF219
Z-value: 1.28
Motif logo
Transcription factors associated with ZNF740_ZNF219
| Gene Symbol | Gene ID | Gene Info |
|---|---|---|
|
ZNF740
|
ENSG00000139651.11 | ZNF740 |
|
ZNF219
|
ENSG00000165804.16 | ZNF219 |
Activity-expression correlation:
| Gene | Promoter | Pearson corr. coef. | P-value | Plot |
|---|---|---|---|---|
| ZNF219 | hg38_v1_chr14_-_21098848_21099014, hg38_v1_chr14_-_21098570_21098678 | -0.19 | 4.0e-03 | Click! |
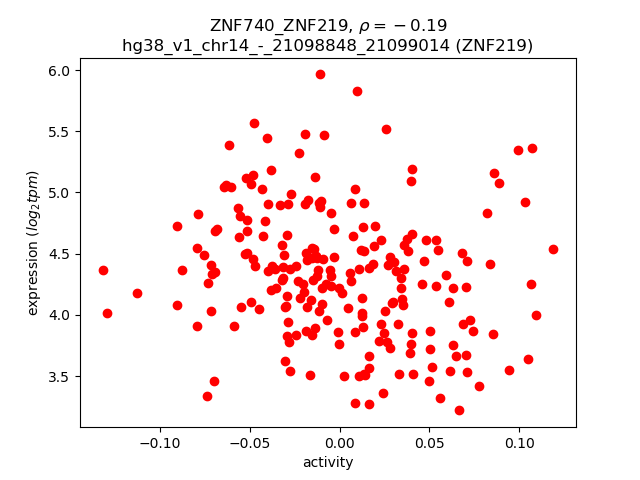
Activity profile of ZNF740_ZNF219 motif
Sorted Z-values of ZNF740_ZNF219 motif
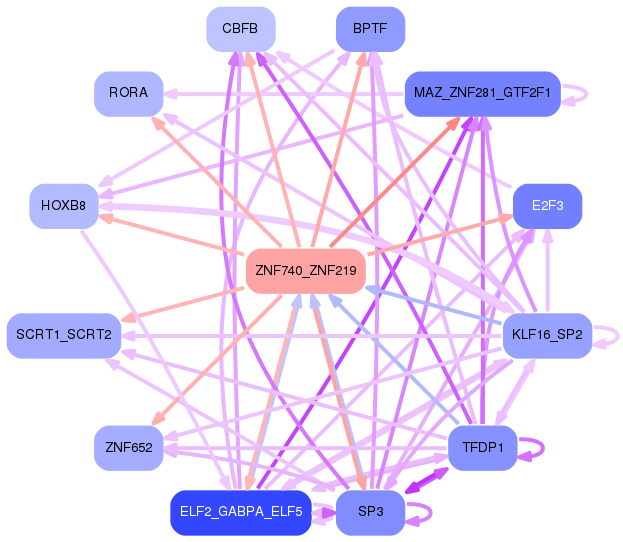
Network of associatons between targets according to the STRING database.

First level regulatory network of ZNF740_ZNF219
Gene Ontology Analysis
Gene overrepresentation in biological process category:
| Log-likelihood per target | Total log-likelihood | Term | Description |
|---|---|---|---|
| 6.8 | 75.0 | GO:0000056 | ribosomal small subunit export from nucleus(GO:0000056) |
| 6.5 | 58.2 | GO:0072553 | terminal button organization(GO:0072553) |
| 4.8 | 24.0 | GO:0006344 | maintenance of chromatin silencing(GO:0006344) |
| 4.4 | 8.9 | GO:1902822 | regulation of late endosome to lysosome transport(GO:1902822) |
| 3.9 | 11.8 | GO:0043973 | histone H3-K4 acetylation(GO:0043973) |
| 3.8 | 38.2 | GO:1903377 | negative regulation of oxidative stress-induced neuron intrinsic apoptotic signaling pathway(GO:1903377) |
| 3.6 | 25.0 | GO:1901315 | negative regulation of histone ubiquitination(GO:0033183) negative regulation of protein K63-linked ubiquitination(GO:1900045) regulation of histone H2A K63-linked ubiquitination(GO:1901314) negative regulation of histone H2A K63-linked ubiquitination(GO:1901315) negative regulation of protein polyubiquitination(GO:1902915) |
| 3.5 | 10.4 | GO:1903422 | negative regulation of synaptic vesicle recycling(GO:1903422) |
| 3.1 | 9.2 | GO:2000797 | amniotic stem cell differentiation(GO:0097086) negative regulation of dense core granule biogenesis(GO:2000706) negative regulation of mesenchymal stem cell differentiation(GO:2000740) regulation of amniotic stem cell differentiation(GO:2000797) negative regulation of amniotic stem cell differentiation(GO:2000798) |
| 3.0 | 12.0 | GO:0002296 | T-helper 1 cell lineage commitment(GO:0002296) |
| 2.8 | 14.1 | GO:0006850 | mitochondrial pyruvate transport(GO:0006850) mitochondrial pyruvate transmembrane transport(GO:1902361) |
| 2.7 | 8.0 | GO:1904772 | hepatocyte homeostasis(GO:0036333) response to tetrachloromethane(GO:1904772) |
| 2.5 | 25.2 | GO:0043353 | enucleate erythrocyte differentiation(GO:0043353) embryonic process involved in female pregnancy(GO:0060136) |
| 2.4 | 31.6 | GO:0043983 | histone H4-K12 acetylation(GO:0043983) |
| 2.2 | 8.9 | GO:1901165 | positive regulation of trophoblast cell migration(GO:1901165) |
| 2.2 | 26.7 | GO:0032876 | negative regulation of DNA endoreduplication(GO:0032876) |
| 2.1 | 119.0 | GO:0043486 | histone exchange(GO:0043486) |
| 2.0 | 8.1 | GO:0035359 | negative regulation of peroxisome proliferator activated receptor signaling pathway(GO:0035359) |
| 1.9 | 5.8 | GO:0002949 | tRNA threonylcarbamoyladenosine modification(GO:0002949) |
| 1.9 | 5.6 | GO:0060024 | rhythmic synaptic transmission(GO:0060024) |
| 1.8 | 21.3 | GO:0007379 | segment specification(GO:0007379) |
| 1.8 | 5.3 | GO:1901355 | response to rapamycin(GO:1901355) |
| 1.7 | 8.7 | GO:0051725 | protein de-ADP-ribosylation(GO:0051725) |
| 1.7 | 6.9 | GO:0061687 | detoxification of inorganic compound(GO:0061687) stress response to metal ion(GO:0097501) |
| 1.7 | 5.1 | GO:0003064 | regulation of heart rate by hormone(GO:0003064) negative regulation of potassium ion export(GO:1902303) |
| 1.7 | 16.8 | GO:0072718 | response to cisplatin(GO:0072718) |
| 1.7 | 6.6 | GO:0035740 | CD8-positive, alpha-beta T cell proliferation(GO:0035740) regulation of CD8-positive, alpha-beta T cell proliferation(GO:2000564) |
| 1.6 | 11.2 | GO:0070345 | negative regulation of fat cell proliferation(GO:0070345) |
| 1.6 | 14.1 | GO:0001866 | NK T cell proliferation(GO:0001866) |
| 1.5 | 6.1 | GO:0003366 | cell-matrix adhesion involved in ameboidal cell migration(GO:0003366) |
| 1.5 | 4.5 | GO:1903691 | positive regulation of wound healing, spreading of epidermal cells(GO:1903691) |
| 1.5 | 4.5 | GO:0072573 | regulation of toll-like receptor 5 signaling pathway(GO:0034147) negative regulation of toll-like receptor 5 signaling pathway(GO:0034148) negative regulation of nucleotide-binding oligomerization domain containing 1 signaling pathway(GO:0070429) tolerance induction to lipopolysaccharide(GO:0072573) |
| 1.5 | 10.5 | GO:2000491 | positive regulation of hepatic stellate cell activation(GO:2000491) |
| 1.5 | 24.0 | GO:1900017 | positive regulation of cytokine production involved in inflammatory response(GO:1900017) |
| 1.5 | 6.0 | GO:0048200 | COPI-coated vesicle budding(GO:0035964) Golgi transport vesicle coating(GO:0048200) COPI coating of Golgi vesicle(GO:0048205) |
| 1.4 | 7.1 | GO:0007386 | compartment pattern specification(GO:0007386) |
| 1.4 | 7.0 | GO:0019747 | regulation of isoprenoid metabolic process(GO:0019747) |
| 1.3 | 7.7 | GO:2000676 | positive regulation of type B pancreatic cell apoptotic process(GO:2000676) |
| 1.3 | 5.1 | GO:0046985 | positive regulation of hemoglobin biosynthetic process(GO:0046985) |
| 1.3 | 11.4 | GO:0000290 | deadenylation-dependent decapping of nuclear-transcribed mRNA(GO:0000290) |
| 1.2 | 5.0 | GO:0021759 | globus pallidus development(GO:0021759) |
| 1.2 | 4.7 | GO:0002270 | plasmacytoid dendritic cell activation(GO:0002270) regulation of restriction endodeoxyribonuclease activity(GO:0032072) T-helper 1 cell activation(GO:0035711) negative regulation of apoptotic cell clearance(GO:2000426) |
| 1.2 | 18.5 | GO:0040032 | post-embryonic body morphogenesis(GO:0040032) |
| 1.1 | 7.9 | GO:0010792 | DNA double-strand break processing involved in repair via single-strand annealing(GO:0010792) |
| 1.1 | 4.4 | GO:0006049 | UDP-N-acetylglucosamine catabolic process(GO:0006049) |
| 1.1 | 11.1 | GO:0035331 | negative regulation of hippo signaling(GO:0035331) |
| 1.1 | 24.2 | GO:0007084 | mitotic nuclear envelope reassembly(GO:0007084) |
| 1.1 | 3.2 | GO:0048295 | positive regulation of isotype switching to IgE isotypes(GO:0048295) |
| 1.1 | 7.4 | GO:0051490 | negative regulation of filopodium assembly(GO:0051490) |
| 1.0 | 9.4 | GO:0000414 | regulation of histone H3-K36 methylation(GO:0000414) |
| 1.0 | 8.3 | GO:0033211 | adiponectin-activated signaling pathway(GO:0033211) |
| 1.0 | 5.2 | GO:0016584 | nucleosome positioning(GO:0016584) regulation of molecular function, epigenetic(GO:0040030) |
| 1.0 | 4.0 | GO:1904154 | positive regulation of retrograde protein transport, ER to cytosol(GO:1904154) |
| 1.0 | 6.9 | GO:1902963 | regulation of metalloendopeptidase activity involved in amyloid precursor protein catabolic process(GO:1902962) negative regulation of metalloendopeptidase activity involved in amyloid precursor protein catabolic process(GO:1902963) |
| 1.0 | 17.8 | GO:0075522 | IRES-dependent viral translational initiation(GO:0075522) |
| 1.0 | 8.8 | GO:0033088 | negative regulation of immature T cell proliferation in thymus(GO:0033088) |
| 1.0 | 3.9 | GO:0046833 | positive regulation of RNA export from nucleus(GO:0046833) |
| 0.9 | 3.7 | GO:2000653 | regulation of DNA demethylation(GO:1901535) negative regulation of DNA demethylation(GO:1901536) regulation of genetic imprinting(GO:2000653) |
| 0.9 | 2.7 | GO:0060032 | notochord regression(GO:0060032) |
| 0.9 | 2.7 | GO:0043974 | histone H3-K27 acetylation(GO:0043974) regulation of histone H3-K27 acetylation(GO:1901674) |
| 0.9 | 9.8 | GO:0031936 | negative regulation of chromatin silencing(GO:0031936) |
| 0.9 | 3.5 | GO:0061304 | retinal blood vessel morphogenesis(GO:0061304) |
| 0.9 | 9.6 | GO:0045945 | positive regulation of transcription from RNA polymerase III promoter(GO:0045945) |
| 0.9 | 3.5 | GO:0035261 | external genitalia morphogenesis(GO:0035261) |
| 0.9 | 8.7 | GO:0051574 | positive regulation of histone H3-K9 methylation(GO:0051574) |
| 0.9 | 2.6 | GO:0003221 | right ventricular cardiac muscle tissue morphogenesis(GO:0003221) |
| 0.8 | 2.5 | GO:1903719 | regulation of I-kappaB phosphorylation(GO:1903719) positive regulation of I-kappaB phosphorylation(GO:1903721) |
| 0.8 | 26.1 | GO:0016578 | histone deubiquitination(GO:0016578) |
| 0.8 | 8.9 | GO:0021694 | cerebellar Purkinje cell layer formation(GO:0021694) cerebellar Purkinje cell differentiation(GO:0021702) |
| 0.8 | 6.4 | GO:0019367 | fatty acid elongation, saturated fatty acid(GO:0019367) fatty acid elongation, unsaturated fatty acid(GO:0019368) fatty acid elongation, monounsaturated fatty acid(GO:0034625) fatty acid elongation, polyunsaturated fatty acid(GO:0034626) |
| 0.8 | 6.3 | GO:0048478 | replication fork protection(GO:0048478) |
| 0.8 | 6.1 | GO:0048386 | positive regulation of retinoic acid receptor signaling pathway(GO:0048386) |
| 0.8 | 13.8 | GO:2000052 | positive regulation of non-canonical Wnt signaling pathway(GO:2000052) |
| 0.8 | 3.8 | GO:0003150 | muscular septum morphogenesis(GO:0003150) |
| 0.8 | 4.5 | GO:1904016 | response to Thyroglobulin triiodothyronine(GO:1904016) |
| 0.7 | 5.2 | GO:0006499 | N-terminal protein myristoylation(GO:0006499) |
| 0.7 | 2.2 | GO:0051228 | mitotic spindle disassembly(GO:0051228) spindle disassembly(GO:0051230) |
| 0.7 | 18.8 | GO:0043153 | entrainment of circadian clock by photoperiod(GO:0043153) |
| 0.7 | 2.2 | GO:0010587 | miRNA catabolic process(GO:0010587) |
| 0.7 | 7.2 | GO:0043374 | CD8-positive, alpha-beta T cell differentiation(GO:0043374) |
| 0.7 | 25.5 | GO:0070534 | protein K63-linked ubiquitination(GO:0070534) |
| 0.7 | 2.1 | GO:1902161 | positive regulation of cyclic nucleotide-gated ion channel activity(GO:1902161) |
| 0.7 | 2.8 | GO:0072369 | regulation of lipid transport by positive regulation of transcription from RNA polymerase II promoter(GO:0072369) |
| 0.7 | 45.3 | GO:0006334 | nucleosome assembly(GO:0006334) |
| 0.7 | 2.1 | GO:0033386 | geranylgeranyl diphosphate metabolic process(GO:0033385) geranylgeranyl diphosphate biosynthetic process(GO:0033386) |
| 0.7 | 3.4 | GO:0015742 | alpha-ketoglutarate transport(GO:0015742) |
| 0.7 | 19.6 | GO:0050855 | regulation of B cell receptor signaling pathway(GO:0050855) |
| 0.7 | 8.1 | GO:0048743 | positive regulation of skeletal muscle fiber development(GO:0048743) |
| 0.7 | 13.3 | GO:0000052 | citrulline metabolic process(GO:0000052) |
| 0.6 | 5.8 | GO:0045176 | apical protein localization(GO:0045176) |
| 0.6 | 5.1 | GO:0032020 | ISG15-protein conjugation(GO:0032020) |
| 0.6 | 1.9 | GO:0021569 | rhombomere 3 development(GO:0021569) |
| 0.6 | 2.5 | GO:0030037 | actin filament reorganization involved in cell cycle(GO:0030037) |
| 0.6 | 5.0 | GO:0035865 | cellular response to potassium ion(GO:0035865) |
| 0.6 | 5.6 | GO:2000507 | cap-dependent translational initiation(GO:0002191) positive regulation of energy homeostasis(GO:2000507) |
| 0.6 | 3.1 | GO:0086048 | membrane depolarization during bundle of His cell action potential(GO:0086048) |
| 0.6 | 5.5 | GO:0060613 | fat pad development(GO:0060613) |
| 0.6 | 1.8 | GO:0008078 | mesodermal cell migration(GO:0008078) |
| 0.6 | 1.8 | GO:0035441 | cell migration involved in vasculogenesis(GO:0035441) |
| 0.6 | 3.5 | GO:0033299 | secretion of lysosomal enzymes(GO:0033299) |
| 0.6 | 15.2 | GO:0000185 | activation of MAPKKK activity(GO:0000185) |
| 0.6 | 4.7 | GO:0002084 | protein depalmitoylation(GO:0002084) |
| 0.6 | 2.3 | GO:0032913 | B cell receptor transport within lipid bilayer(GO:0032595) B cell receptor transport into membrane raft(GO:0032597) protein transport out of membrane raft(GO:0032599) chemokine receptor transport out of membrane raft(GO:0032600) negative regulation of transforming growth factor beta3 production(GO:0032913) chemokine receptor transport within lipid bilayer(GO:0033606) |
| 0.6 | 1.7 | GO:0002416 | IgG immunoglobulin transcytosis in epithelial cells mediated by FcRn immunoglobulin receptor(GO:0002416) |
| 0.5 | 12.1 | GO:0043555 | regulation of translation in response to stress(GO:0043555) |
| 0.5 | 2.2 | GO:0090107 | regulation of high-density lipoprotein particle assembly(GO:0090107) |
| 0.5 | 1.6 | GO:0051461 | regulation of corticotropin secretion(GO:0051459) positive regulation of corticotropin secretion(GO:0051461) |
| 0.5 | 8.5 | GO:1902659 | regulation of glucose mediated signaling pathway(GO:1902659) |
| 0.5 | 5.3 | GO:0034508 | centromere complex assembly(GO:0034508) |
| 0.5 | 1.6 | GO:0071816 | tail-anchored membrane protein insertion into ER membrane(GO:0071816) |
| 0.5 | 2.0 | GO:0019086 | late viral transcription(GO:0019086) |
| 0.5 | 11.6 | GO:1902894 | negative regulation of pri-miRNA transcription from RNA polymerase II promoter(GO:1902894) |
| 0.5 | 1.5 | GO:0060528 | secretory columnal luminar epithelial cell differentiation involved in prostate glandular acinus development(GO:0060528) |
| 0.5 | 54.1 | GO:0042035 | regulation of cytokine biosynthetic process(GO:0042035) |
| 0.5 | 2.9 | GO:0007256 | activation of JNKK activity(GO:0007256) |
| 0.5 | 45.2 | GO:0006369 | termination of RNA polymerase II transcription(GO:0006369) |
| 0.5 | 4.4 | GO:1901223 | negative regulation of NIK/NF-kappaB signaling(GO:1901223) |
| 0.5 | 8.2 | GO:0010867 | positive regulation of triglyceride biosynthetic process(GO:0010867) |
| 0.5 | 19.1 | GO:0061014 | positive regulation of mRNA catabolic process(GO:0061014) |
| 0.5 | 7.4 | GO:0051014 | actin filament severing(GO:0051014) |
| 0.5 | 1.4 | GO:0070213 | protein auto-ADP-ribosylation(GO:0070213) |
| 0.5 | 2.8 | GO:0089700 | protein kinase D signaling(GO:0089700) |
| 0.5 | 6.3 | GO:0090084 | negative regulation of inclusion body assembly(GO:0090084) |
| 0.4 | 10.7 | GO:0070423 | nucleotide-binding domain, leucine rich repeat containing receptor signaling pathway(GO:0035872) nucleotide-binding oligomerization domain containing signaling pathway(GO:0070423) |
| 0.4 | 1.8 | GO:0061087 | positive regulation of histone H3-K27 methylation(GO:0061087) |
| 0.4 | 6.5 | GO:0032025 | response to cobalt ion(GO:0032025) |
| 0.4 | 1.3 | GO:0061760 | antifungal innate immune response(GO:0061760) |
| 0.4 | 4.3 | GO:0060252 | positive regulation of glial cell proliferation(GO:0060252) |
| 0.4 | 2.1 | GO:0070885 | negative regulation of calcineurin-NFAT signaling cascade(GO:0070885) |
| 0.4 | 2.1 | GO:0042492 | gamma-delta T cell differentiation(GO:0042492) |
| 0.4 | 8.0 | GO:0043044 | ATP-dependent chromatin remodeling(GO:0043044) |
| 0.4 | 3.8 | GO:0001672 | regulation of chromatin assembly or disassembly(GO:0001672) |
| 0.4 | 1.7 | GO:0070417 | cellular response to cold(GO:0070417) response to fluoride(GO:1902617) |
| 0.4 | 1.7 | GO:0019082 | viral protein processing(GO:0019082) regulation of nerve growth factor production(GO:0032903) negative regulation of nerve growth factor production(GO:0032904) dibasic protein processing(GO:0090472) |
| 0.4 | 4.2 | GO:0021520 | spinal cord motor neuron cell fate specification(GO:0021520) |
| 0.4 | 0.8 | GO:0031064 | negative regulation of histone deacetylation(GO:0031064) |
| 0.4 | 4.9 | GO:0044334 | regulation of heparan sulfate proteoglycan biosynthetic process(GO:0010908) positive regulation of heparan sulfate proteoglycan biosynthetic process(GO:0010909) canonical Wnt signaling pathway involved in positive regulation of epithelial to mesenchymal transition(GO:0044334) positive regulation of proteoglycan biosynthetic process(GO:1902730) |
| 0.4 | 4.4 | GO:0030422 | production of siRNA involved in RNA interference(GO:0030422) |
| 0.4 | 10.0 | GO:0030033 | microvillus assembly(GO:0030033) |
| 0.4 | 4.0 | GO:0035745 | T-helper 2 cell cytokine production(GO:0035745) |
| 0.4 | 7.1 | GO:0021511 | spinal cord patterning(GO:0021511) |
| 0.4 | 3.4 | GO:0010265 | SCF complex assembly(GO:0010265) |
| 0.4 | 1.5 | GO:0007079 | mitotic chromosome movement towards spindle pole(GO:0007079) |
| 0.4 | 2.9 | GO:0000395 | mRNA 5'-splice site recognition(GO:0000395) |
| 0.4 | 5.7 | GO:0048934 | peripheral nervous system neuron differentiation(GO:0048934) peripheral nervous system neuron development(GO:0048935) |
| 0.3 | 8.5 | GO:0071108 | protein K48-linked deubiquitination(GO:0071108) |
| 0.3 | 1.0 | GO:0046603 | negative regulation of mitotic centrosome separation(GO:0046603) |
| 0.3 | 2.3 | GO:0014894 | response to muscle inactivity involved in regulation of muscle adaptation(GO:0014877) response to denervation involved in regulation of muscle adaptation(GO:0014894) |
| 0.3 | 8.4 | GO:0097067 | cellular response to thyroid hormone stimulus(GO:0097067) |
| 0.3 | 2.9 | GO:0010624 | regulation of Schwann cell proliferation(GO:0010624) negative regulation of Schwann cell proliferation(GO:0010626) |
| 0.3 | 2.5 | GO:0001887 | selenium compound metabolic process(GO:0001887) |
| 0.3 | 0.6 | GO:0060164 | regulation of timing of neuron differentiation(GO:0060164) |
| 0.3 | 28.1 | GO:0031146 | SCF-dependent proteasomal ubiquitin-dependent protein catabolic process(GO:0031146) |
| 0.3 | 2.8 | GO:0030497 | fatty acid elongation(GO:0030497) very long-chain fatty acid biosynthetic process(GO:0042761) |
| 0.3 | 2.1 | GO:0030421 | defecation(GO:0030421) |
| 0.3 | 1.5 | GO:0070375 | ventricular cardiac myofibril assembly(GO:0055005) ERK5 cascade(GO:0070375) |
| 0.3 | 28.3 | GO:0036498 | IRE1-mediated unfolded protein response(GO:0036498) |
| 0.3 | 0.8 | GO:0090245 | axis elongation involved in somitogenesis(GO:0090245) |
| 0.3 | 3.0 | GO:0070734 | histone H3-K27 methylation(GO:0070734) |
| 0.3 | 4.7 | GO:0034975 | protein folding in endoplasmic reticulum(GO:0034975) |
| 0.3 | 10.4 | GO:0045737 | positive regulation of cyclin-dependent protein serine/threonine kinase activity(GO:0045737) |
| 0.3 | 1.6 | GO:1901164 | negative regulation of trophoblast cell migration(GO:1901164) |
| 0.3 | 1.6 | GO:0032483 | regulation of Rab protein signal transduction(GO:0032483) |
| 0.3 | 6.1 | GO:0032786 | positive regulation of DNA-templated transcription, elongation(GO:0032786) |
| 0.3 | 1.9 | GO:0008215 | spermine metabolic process(GO:0008215) |
| 0.3 | 2.9 | GO:0035246 | peptidyl-arginine N-methylation(GO:0035246) |
| 0.3 | 0.5 | GO:0010890 | positive regulation of sequestering of triglyceride(GO:0010890) |
| 0.3 | 2.6 | GO:0060052 | neurofilament cytoskeleton organization(GO:0060052) |
| 0.3 | 2.9 | GO:0060576 | intestinal epithelial cell development(GO:0060576) |
| 0.3 | 3.1 | GO:0090435 | protein localization to nuclear envelope(GO:0090435) |
| 0.3 | 2.3 | GO:0019375 | galactosylceramide biosynthetic process(GO:0006682) galactolipid biosynthetic process(GO:0019375) |
| 0.3 | 2.6 | GO:0045163 | clustering of voltage-gated potassium channels(GO:0045163) |
| 0.2 | 1.0 | GO:2000595 | optic nerve formation(GO:0021634) optic chiasma development(GO:0061360) regulation of optic nerve formation(GO:2000595) positive regulation of optic nerve formation(GO:2000597) |
| 0.2 | 0.7 | GO:0032875 | regulation of DNA endoreduplication(GO:0032875) |
| 0.2 | 24.6 | GO:0006338 | chromatin remodeling(GO:0006338) |
| 0.2 | 1.0 | GO:0021562 | vestibulocochlear nerve development(GO:0021562) |
| 0.2 | 8.9 | GO:0000083 | regulation of transcription involved in G1/S transition of mitotic cell cycle(GO:0000083) |
| 0.2 | 1.9 | GO:0031053 | primary miRNA processing(GO:0031053) |
| 0.2 | 4.0 | GO:0038092 | nodal signaling pathway(GO:0038092) |
| 0.2 | 0.9 | GO:0060010 | Sertoli cell fate commitment(GO:0060010) |
| 0.2 | 1.8 | GO:0090336 | positive regulation of brown fat cell differentiation(GO:0090336) |
| 0.2 | 4.3 | GO:0097421 | liver regeneration(GO:0097421) |
| 0.2 | 1.8 | GO:0032000 | positive regulation of fatty acid beta-oxidation(GO:0032000) |
| 0.2 | 4.7 | GO:1904714 | regulation of chaperone-mediated autophagy(GO:1904714) |
| 0.2 | 8.5 | GO:1904837 | beta-catenin-TCF complex assembly(GO:1904837) |
| 0.2 | 1.3 | GO:0006346 | methylation-dependent chromatin silencing(GO:0006346) C-5 methylation of cytosine(GO:0090116) |
| 0.2 | 3.2 | GO:0035518 | histone H2A monoubiquitination(GO:0035518) |
| 0.2 | 1.9 | GO:0060754 | positive regulation of mast cell chemotaxis(GO:0060754) |
| 0.2 | 1.0 | GO:0071051 | polyadenylation-dependent snoRNA 3'-end processing(GO:0071051) |
| 0.2 | 2.0 | GO:0021516 | dorsal spinal cord development(GO:0021516) |
| 0.2 | 2.0 | GO:0070120 | brainstem development(GO:0003360) ciliary neurotrophic factor-mediated signaling pathway(GO:0070120) |
| 0.2 | 8.3 | GO:0000027 | ribosomal large subunit assembly(GO:0000027) |
| 0.2 | 0.8 | GO:0050893 | sensory processing(GO:0050893) |
| 0.2 | 0.8 | GO:1904799 | negative regulation of dendrite extension(GO:1903860) regulation of neuron remodeling(GO:1904799) negative regulation of neuron remodeling(GO:1904800) negative regulation of branching morphogenesis of a nerve(GO:2000173) |
| 0.2 | 1.8 | GO:0071763 | nuclear membrane organization(GO:0071763) |
| 0.2 | 3.2 | GO:0002335 | mature B cell differentiation(GO:0002335) |
| 0.2 | 5.9 | GO:0070328 | acylglycerol homeostasis(GO:0055090) triglyceride homeostasis(GO:0070328) |
| 0.2 | 0.3 | GO:0051458 | corticotropin secretion(GO:0051458) |
| 0.2 | 2.6 | GO:0007250 | activation of NF-kappaB-inducing kinase activity(GO:0007250) |
| 0.2 | 1.2 | GO:1903659 | regulation of complement-dependent cytotoxicity(GO:1903659) |
| 0.2 | 1.5 | GO:0009396 | folic acid-containing compound biosynthetic process(GO:0009396) |
| 0.2 | 7.7 | GO:2001222 | regulation of neuron migration(GO:2001222) |
| 0.2 | 1.3 | GO:0072520 | seminiferous tubule development(GO:0072520) |
| 0.2 | 0.9 | GO:0014057 | positive regulation of acetylcholine secretion, neurotransmission(GO:0014057) |
| 0.1 | 5.3 | GO:0060976 | coronary vasculature development(GO:0060976) |
| 0.1 | 1.5 | GO:0007064 | mitotic sister chromatid cohesion(GO:0007064) |
| 0.1 | 0.7 | GO:0007198 | adenylate cyclase-inhibiting serotonin receptor signaling pathway(GO:0007198) |
| 0.1 | 1.3 | GO:0030949 | positive regulation of vascular endothelial growth factor receptor signaling pathway(GO:0030949) |
| 0.1 | 0.4 | GO:0003199 | endocardial cushion to mesenchymal transition involved in heart valve formation(GO:0003199) |
| 0.1 | 2.3 | GO:0021591 | ventricular system development(GO:0021591) |
| 0.1 | 1.8 | GO:0014041 | regulation of neuron maturation(GO:0014041) |
| 0.1 | 10.0 | GO:0006968 | cellular defense response(GO:0006968) |
| 0.1 | 0.4 | GO:0001831 | trophectodermal cellular morphogenesis(GO:0001831) |
| 0.1 | 3.7 | GO:0072600 | establishment of protein localization to Golgi(GO:0072600) |
| 0.1 | 1.5 | GO:0060285 | cilium-dependent cell motility(GO:0060285) |
| 0.1 | 1.6 | GO:0043568 | positive regulation of insulin-like growth factor receptor signaling pathway(GO:0043568) |
| 0.1 | 0.3 | GO:0098937 | dendritic transport(GO:0098935) anterograde dendritic transport(GO:0098937) |
| 0.1 | 0.7 | GO:0000301 | retrograde transport, vesicle recycling within Golgi(GO:0000301) |
| 0.1 | 3.7 | GO:0061003 | positive regulation of dendritic spine morphogenesis(GO:0061003) |
| 0.1 | 3.5 | GO:0097009 | energy homeostasis(GO:0097009) |
| 0.1 | 2.2 | GO:1903432 | regulation of TORC1 signaling(GO:1903432) |
| 0.1 | 2.7 | GO:0050650 | chondroitin sulfate proteoglycan biosynthetic process(GO:0050650) |
| 0.1 | 0.4 | GO:0006931 | substrate-dependent cell migration, cell attachment to substrate(GO:0006931) |
| 0.1 | 1.6 | GO:0042921 | glucocorticoid receptor signaling pathway(GO:0042921) |
| 0.1 | 1.7 | GO:0001573 | ganglioside metabolic process(GO:0001573) |
| 0.1 | 0.7 | GO:0034638 | phosphatidylcholine catabolic process(GO:0034638) |
| 0.1 | 1.3 | GO:0019800 | peptide cross-linking via chondroitin 4-sulfate glycosaminoglycan(GO:0019800) |
| 0.1 | 2.7 | GO:0035065 | regulation of histone acetylation(GO:0035065) |
| 0.1 | 4.6 | GO:0006120 | mitochondrial electron transport, NADH to ubiquinone(GO:0006120) |
| 0.1 | 4.1 | GO:0001541 | ovarian follicle development(GO:0001541) |
| 0.1 | 5.0 | GO:0030574 | collagen catabolic process(GO:0030574) |
| 0.1 | 0.5 | GO:0010571 | positive regulation of nuclear cell cycle DNA replication(GO:0010571) |
| 0.1 | 0.8 | GO:0051000 | positive regulation of nitric-oxide synthase activity(GO:0051000) |
| 0.1 | 2.1 | GO:0006362 | transcription elongation from RNA polymerase I promoter(GO:0006362) |
| 0.1 | 0.7 | GO:0090136 | epithelial cell-cell adhesion(GO:0090136) |
| 0.1 | 1.4 | GO:0007143 | female meiotic division(GO:0007143) |
| 0.1 | 3.8 | GO:0000380 | alternative mRNA splicing, via spliceosome(GO:0000380) |
| 0.1 | 0.3 | GO:0031630 | regulation of synaptic vesicle fusion to presynaptic membrane(GO:0031630) |
| 0.1 | 0.3 | GO:0015891 | iron chelate transport(GO:0015688) siderophore transport(GO:0015891) sensory perception of sour taste(GO:0050915) |
| 0.1 | 1.0 | GO:0019511 | peptidyl-proline hydroxylation(GO:0019511) |
| 0.1 | 6.8 | GO:0051028 | mRNA transport(GO:0051028) |
| 0.1 | 1.8 | GO:0036297 | interstrand cross-link repair(GO:0036297) |
| 0.1 | 1.3 | GO:0095500 | acetylcholine receptor signaling pathway(GO:0095500) postsynaptic signal transduction(GO:0098926) signal transduction involved in cellular response to ammonium ion(GO:1903831) response to acetylcholine(GO:1905144) cellular response to acetylcholine(GO:1905145) |
| 0.1 | 0.8 | GO:0051299 | mitotic centrosome separation(GO:0007100) centrosome separation(GO:0051299) |
| 0.1 | 5.7 | GO:0008543 | fibroblast growth factor receptor signaling pathway(GO:0008543) |
| 0.0 | 0.7 | GO:0015732 | prostaglandin transport(GO:0015732) |
| 0.0 | 2.0 | GO:0000079 | regulation of cyclin-dependent protein serine/threonine kinase activity(GO:0000079) |
| 0.0 | 2.5 | GO:0006303 | double-strand break repair via nonhomologous end joining(GO:0006303) |
| 0.0 | 1.0 | GO:0032784 | regulation of DNA-templated transcription, elongation(GO:0032784) |
| 0.0 | 1.3 | GO:0032469 | endoplasmic reticulum calcium ion homeostasis(GO:0032469) |
| 0.0 | 1.6 | GO:0097435 | fibril organization(GO:0097435) |
| 0.0 | 1.1 | GO:2000369 | regulation of clathrin-mediated endocytosis(GO:2000369) |
| 0.0 | 0.2 | GO:1900245 | positive regulation of MDA-5 signaling pathway(GO:1900245) |
| 0.0 | 0.7 | GO:0010667 | negative regulation of cardiac muscle cell apoptotic process(GO:0010667) |
| 0.0 | 2.3 | GO:0007520 | myoblast fusion(GO:0007520) |
| 0.0 | 3.7 | GO:0031338 | regulation of vesicle fusion(GO:0031338) |
| 0.0 | 6.5 | GO:0006626 | protein targeting to mitochondrion(GO:0006626) |
| 0.0 | 0.2 | GO:1901838 | regulation of transcription of nuclear large rRNA transcript from RNA polymerase I promoter(GO:1901836) positive regulation of transcription of nuclear large rRNA transcript from RNA polymerase I promoter(GO:1901838) |
| 0.0 | 0.6 | GO:0016576 | histone dephosphorylation(GO:0016576) |
| 0.0 | 2.3 | GO:0006446 | regulation of translational initiation(GO:0006446) |
| 0.0 | 3.2 | GO:0043488 | regulation of mRNA stability(GO:0043488) |
| 0.0 | 1.3 | GO:0010501 | RNA secondary structure unwinding(GO:0010501) |
| 0.0 | 2.6 | GO:0046849 | bone remodeling(GO:0046849) |
| 0.0 | 0.5 | GO:0071157 | negative regulation of cell cycle arrest(GO:0071157) |
| 0.0 | 0.6 | GO:0035338 | long-chain fatty-acyl-CoA biosynthetic process(GO:0035338) |
| 0.0 | 0.7 | GO:0019430 | removal of superoxide radicals(GO:0019430) |
| 0.0 | 0.3 | GO:0033235 | positive regulation of protein sumoylation(GO:0033235) |
| 0.0 | 0.2 | GO:1900119 | positive regulation of execution phase of apoptosis(GO:1900119) |
| 0.0 | 1.1 | GO:0007274 | neuromuscular synaptic transmission(GO:0007274) |
| 0.0 | 0.4 | GO:0002755 | MyD88-dependent toll-like receptor signaling pathway(GO:0002755) |
| 0.0 | 1.5 | GO:0007292 | female gamete generation(GO:0007292) |
| 0.0 | 1.3 | GO:0055072 | iron ion homeostasis(GO:0055072) |
| 0.0 | 0.6 | GO:0006611 | protein export from nucleus(GO:0006611) |
| 0.0 | 2.1 | GO:0006414 | translational elongation(GO:0006414) |
| 0.0 | 1.0 | GO:0001895 | retina homeostasis(GO:0001895) |
| 0.0 | 0.2 | GO:0016024 | CDP-diacylglycerol biosynthetic process(GO:0016024) |
| 0.0 | 1.2 | GO:0033275 | muscle filament sliding(GO:0030049) actin-myosin filament sliding(GO:0033275) |
| 0.0 | 0.1 | GO:0032354 | response to follicle-stimulating hormone(GO:0032354) |
Gene overrepresentation in cellular component category:
| Log-likelihood per target | Total log-likelihood | Term | Description |
|---|---|---|---|
| 6.1 | 115.1 | GO:0000812 | Swr1 complex(GO:0000812) |
| 4.9 | 19.4 | GO:0008537 | proteasome activator complex(GO:0008537) |
| 4.8 | 77.4 | GO:0005642 | annulate lamellae(GO:0005642) |
| 3.1 | 21.6 | GO:0016589 | NURF complex(GO:0016589) |
| 3.1 | 27.5 | GO:0042382 | paraspeckles(GO:0042382) |
| 2.7 | 8.1 | GO:0035517 | PR-DUB complex(GO:0035517) |
| 2.3 | 11.4 | GO:0044094 | host cell nucleus(GO:0042025) host cell nuclear part(GO:0044094) |
| 2.1 | 8.2 | GO:0071595 | Nem1-Spo7 phosphatase complex(GO:0071595) |
| 1.7 | 10.4 | GO:0048787 | presynaptic active zone membrane(GO:0048787) |
| 1.7 | 23.9 | GO:0000124 | SAGA complex(GO:0000124) |
| 1.7 | 18.4 | GO:0072357 | PTW/PP1 phosphatase complex(GO:0072357) |
| 1.6 | 20.7 | GO:0031618 | nuclear pericentric heterochromatin(GO:0031618) |
| 1.5 | 6.1 | GO:0034669 | integrin alpha4-beta7 complex(GO:0034669) |
| 1.4 | 29.7 | GO:0035098 | ESC/E(Z) complex(GO:0035098) |
| 1.4 | 6.9 | GO:0070381 | endosome to plasma membrane transport vesicle(GO:0070381) |
| 1.4 | 35.4 | GO:0090545 | NuRD complex(GO:0016581) CHD-type complex(GO:0090545) |
| 1.3 | 5.2 | GO:0097059 | CNTFR-CLCF1 complex(GO:0097059) |
| 1.2 | 8.3 | GO:0005956 | protein kinase CK2 complex(GO:0005956) |
| 1.2 | 3.5 | GO:0032116 | SMC loading complex(GO:0032116) |
| 1.0 | 5.1 | GO:1902937 | inward rectifier potassium channel complex(GO:1902937) |
| 0.9 | 3.5 | GO:1990851 | Wnt-Frizzled-LRP5/6 complex(GO:1990851) |
| 0.9 | 8.5 | GO:0031595 | nuclear proteasome complex(GO:0031595) |
| 0.8 | 13.5 | GO:0035102 | PRC1 complex(GO:0035102) |
| 0.8 | 14.7 | GO:0005720 | nuclear heterochromatin(GO:0005720) |
| 0.8 | 3.2 | GO:0035363 | histone locus body(GO:0035363) |
| 0.8 | 26.7 | GO:0071564 | SWI/SNF complex(GO:0016514) npBAF complex(GO:0071564) |
| 0.7 | 6.3 | GO:0031298 | replication fork protection complex(GO:0031298) |
| 0.7 | 5.3 | GO:0031931 | TORC1 complex(GO:0031931) |
| 0.7 | 6.0 | GO:0070765 | gamma-secretase complex(GO:0070765) |
| 0.7 | 4.0 | GO:0071256 | Sec61 translocon complex(GO:0005784) translocon complex(GO:0071256) |
| 0.6 | 6.9 | GO:0044666 | MLL3/4 complex(GO:0044666) |
| 0.6 | 7.4 | GO:0071203 | F-actin capping protein complex(GO:0008290) WASH complex(GO:0071203) |
| 0.6 | 6.7 | GO:0031465 | Cul4B-RING E3 ubiquitin ligase complex(GO:0031465) |
| 0.5 | 2.1 | GO:0031205 | endoplasmic reticulum Sec complex(GO:0031205) |
| 0.5 | 5.7 | GO:0005638 | lamin filament(GO:0005638) |
| 0.5 | 1.6 | GO:0071818 | BAT3 complex(GO:0071818) ER membrane insertion complex(GO:0072379) |
| 0.5 | 7.4 | GO:0032059 | bleb(GO:0032059) |
| 0.5 | 4.4 | GO:0000445 | THO complex(GO:0000347) THO complex part of transcription export complex(GO:0000445) |
| 0.5 | 14.1 | GO:0031305 | intrinsic component of mitochondrial inner membrane(GO:0031304) integral component of mitochondrial inner membrane(GO:0031305) |
| 0.5 | 4.2 | GO:0019907 | cyclin-dependent protein kinase activating kinase holoenzyme complex(GO:0019907) |
| 0.5 | 1.8 | GO:0031010 | ISWI-type complex(GO:0031010) |
| 0.5 | 18.3 | GO:0000159 | protein phosphatase type 2A complex(GO:0000159) |
| 0.5 | 1.8 | GO:0005899 | insulin receptor complex(GO:0005899) |
| 0.4 | 5.6 | GO:0035749 | myelin sheath adaxonal region(GO:0035749) |
| 0.4 | 7.7 | GO:0016281 | eukaryotic translation initiation factor 4F complex(GO:0016281) |
| 0.4 | 4.7 | GO:0005853 | eukaryotic translation elongation factor 1 complex(GO:0005853) |
| 0.4 | 4.5 | GO:0030015 | CCR4-NOT core complex(GO:0030015) |
| 0.4 | 4.9 | GO:0070369 | beta-catenin-TCF7L2 complex(GO:0070369) |
| 0.4 | 4.1 | GO:0033276 | transcription factor TFTC complex(GO:0033276) |
| 0.4 | 4.2 | GO:0016593 | Cdc73/Paf1 complex(GO:0016593) |
| 0.4 | 6.1 | GO:0097470 | ribbon synapse(GO:0097470) |
| 0.4 | 2.2 | GO:1990131 | EGO complex(GO:0034448) Gtr1-Gtr2 GTPase complex(GO:1990131) |
| 0.4 | 1.1 | GO:0034686 | integrin alphav-beta8 complex(GO:0034686) |
| 0.4 | 1.8 | GO:0035061 | perichromatin fibrils(GO:0005726) interchromatin granule(GO:0035061) |
| 0.3 | 6.0 | GO:0044665 | MLL1/2 complex(GO:0044665) MLL1 complex(GO:0071339) |
| 0.3 | 1.9 | GO:0034098 | VCP-NPL4-UFD1 AAA ATPase complex(GO:0034098) |
| 0.3 | 42.5 | GO:0016605 | PML body(GO:0016605) |
| 0.3 | 8.9 | GO:0030137 | COPI-coated vesicle(GO:0030137) |
| 0.3 | 5.1 | GO:0035861 | site of double-strand break(GO:0035861) |
| 0.3 | 4.7 | GO:0034663 | endoplasmic reticulum chaperone complex(GO:0034663) |
| 0.3 | 23.2 | GO:0000123 | histone acetyltransferase complex(GO:0000123) |
| 0.3 | 1.5 | GO:0033588 | Elongator holoenzyme complex(GO:0033588) |
| 0.3 | 2.6 | GO:0000938 | GARP complex(GO:0000938) |
| 0.3 | 22.4 | GO:0005876 | spindle microtubule(GO:0005876) |
| 0.3 | 3.3 | GO:0000164 | protein phosphatase type 1 complex(GO:0000164) |
| 0.3 | 3.5 | GO:0005686 | U2 snRNP(GO:0005686) |
| 0.2 | 1.2 | GO:0033503 | HULC complex(GO:0033503) |
| 0.2 | 0.7 | GO:0071062 | alphav-beta3 integrin-vitronectin complex(GO:0071062) |
| 0.2 | 9.6 | GO:0016592 | mediator complex(GO:0016592) |
| 0.2 | 1.6 | GO:0030121 | AP-1 adaptor complex(GO:0030121) |
| 0.2 | 2.6 | GO:0097433 | dense body(GO:0097433) |
| 0.2 | 2.8 | GO:0017053 | transcriptional repressor complex(GO:0017053) |
| 0.2 | 1.9 | GO:0000346 | transcription export complex(GO:0000346) |
| 0.2 | 9.6 | GO:0000307 | cyclin-dependent protein kinase holoenzyme complex(GO:0000307) |
| 0.2 | 7.1 | GO:0016235 | aggresome(GO:0016235) |
| 0.2 | 3.0 | GO:0034709 | methylosome(GO:0034709) |
| 0.2 | 0.7 | GO:1990023 | mitotic spindle midzone(GO:1990023) |
| 0.2 | 2.2 | GO:0000815 | ESCRT III complex(GO:0000815) |
| 0.2 | 1.6 | GO:0051286 | cell tip(GO:0051286) |
| 0.2 | 3.3 | GO:0030867 | rough endoplasmic reticulum membrane(GO:0030867) |
| 0.2 | 14.7 | GO:0005811 | lipid particle(GO:0005811) |
| 0.2 | 17.8 | GO:0071013 | catalytic step 2 spliceosome(GO:0071013) |
| 0.2 | 18.4 | GO:0000932 | cytoplasmic mRNA processing body(GO:0000932) |
| 0.1 | 1.8 | GO:0043240 | Fanconi anaemia nuclear complex(GO:0043240) |
| 0.1 | 23.9 | GO:0000775 | chromosome, centromeric region(GO:0000775) |
| 0.1 | 56.7 | GO:0016607 | nuclear speck(GO:0016607) |
| 0.1 | 7.4 | GO:1990391 | DNA repair complex(GO:1990391) |
| 0.1 | 0.4 | GO:0070436 | Grb2-EGFR complex(GO:0070436) |
| 0.1 | 2.5 | GO:0016461 | unconventional myosin complex(GO:0016461) |
| 0.1 | 2.1 | GO:0005736 | DNA-directed RNA polymerase I complex(GO:0005736) |
| 0.1 | 2.1 | GO:0005719 | nuclear euchromatin(GO:0005719) |
| 0.1 | 1.5 | GO:0005858 | axonemal dynein complex(GO:0005858) |
| 0.1 | 2.6 | GO:0080008 | Cul4-RING E3 ubiquitin ligase complex(GO:0080008) |
| 0.1 | 30.8 | GO:0016604 | nuclear body(GO:0016604) |
| 0.1 | 1.0 | GO:0008541 | proteasome regulatory particle, lid subcomplex(GO:0008541) |
| 0.1 | 2.3 | GO:0031362 | anchored component of external side of plasma membrane(GO:0031362) |
| 0.1 | 16.4 | GO:1904813 | ficolin-1-rich granule(GO:0101002) ficolin-1-rich granule lumen(GO:1904813) |
| 0.1 | 1.5 | GO:0030904 | retromer complex(GO:0030904) |
| 0.1 | 1.4 | GO:0000242 | pericentriolar material(GO:0000242) |
| 0.1 | 8.6 | GO:0022625 | cytosolic large ribosomal subunit(GO:0022625) |
| 0.1 | 1.0 | GO:0000177 | nuclear exosome (RNase complex)(GO:0000176) cytoplasmic exosome (RNase complex)(GO:0000177) |
| 0.1 | 4.6 | GO:0005747 | mitochondrial respiratory chain complex I(GO:0005747) NADH dehydrogenase complex(GO:0030964) respiratory chain complex I(GO:0045271) |
| 0.1 | 0.4 | GO:0005677 | chromatin silencing complex(GO:0005677) |
| 0.1 | 213.8 | GO:0005654 | nucleoplasm(GO:0005654) |
| 0.1 | 0.9 | GO:0017146 | NMDA selective glutamate receptor complex(GO:0017146) |
| 0.1 | 5.5 | GO:0035578 | azurophil granule lumen(GO:0035578) |
| 0.1 | 1.9 | GO:0005643 | nuclear pore(GO:0005643) |
| 0.0 | 2.6 | GO:0030669 | clathrin-coated endocytic vesicle membrane(GO:0030669) |
| 0.0 | 5.8 | GO:0031225 | anchored component of membrane(GO:0031225) |
| 0.0 | 0.2 | GO:0070652 | HAUS complex(GO:0070652) |
| 0.0 | 7.8 | GO:0031965 | nuclear membrane(GO:0031965) |
| 0.0 | 3.5 | GO:0031985 | Golgi cisterna(GO:0031985) |
| 0.0 | 3.6 | GO:0032587 | ruffle membrane(GO:0032587) |
| 0.0 | 1.0 | GO:0034451 | centriolar satellite(GO:0034451) |
| 0.0 | 2.8 | GO:0070821 | tertiary granule membrane(GO:0070821) |
| 0.0 | 0.9 | GO:0030673 | axolemma(GO:0030673) |
| 0.0 | 12.2 | GO:0016324 | apical plasma membrane(GO:0016324) |
| 0.0 | 2.4 | GO:0031093 | platelet alpha granule lumen(GO:0031093) |
| 0.0 | 1.4 | GO:0005882 | intermediate filament(GO:0005882) |
| 0.0 | 1.3 | GO:0005793 | endoplasmic reticulum-Golgi intermediate compartment(GO:0005793) |
| 0.0 | 1.1 | GO:0005667 | transcription factor complex(GO:0005667) |
Gene overrepresentation in molecular function category:
| Log-likelihood per target | Total log-likelihood | Term | Description |
|---|---|---|---|
| 5.3 | 78.9 | GO:0005049 | nuclear export signal receptor activity(GO:0005049) |
| 4.9 | 29.6 | GO:0008420 | CTD phosphatase activity(GO:0008420) |
| 2.8 | 19.4 | GO:0061133 | endopeptidase activator activity(GO:0061133) |
| 2.0 | 14.3 | GO:0071535 | RING-like zinc finger domain binding(GO:0071535) |
| 1.9 | 13.3 | GO:0016403 | dimethylargininase activity(GO:0016403) |
| 1.9 | 5.6 | GO:0051717 | inositol-1,3,4,5-tetrakisphosphate 3-phosphatase activity(GO:0051717) |
| 1.8 | 14.1 | GO:0050833 | pyruvate transmembrane transporter activity(GO:0050833) |
| 1.8 | 100.1 | GO:0019212 | phosphatase inhibitor activity(GO:0019212) |
| 1.7 | 5.2 | GO:0043035 | chromatin insulator sequence binding(GO:0043035) |
| 1.5 | 72.7 | GO:0031492 | nucleosomal DNA binding(GO:0031492) |
| 1.5 | 8.9 | GO:0008142 | oxysterol binding(GO:0008142) |
| 1.4 | 47.2 | GO:0070577 | lysine-acetylated histone binding(GO:0070577) |
| 1.4 | 60.7 | GO:0048027 | mRNA 5'-UTR binding(GO:0048027) |
| 1.4 | 12.7 | GO:1990226 | histone methyltransferase binding(GO:1990226) |
| 1.3 | 11.8 | GO:0030274 | LIM domain binding(GO:0030274) |
| 1.3 | 22.7 | GO:0004535 | poly(A)-specific ribonuclease activity(GO:0004535) |
| 1.2 | 8.5 | GO:0001165 | RNA polymerase I upstream control element sequence-specific DNA binding(GO:0001165) |
| 1.2 | 9.5 | GO:1990829 | C-rich single-stranded DNA binding(GO:1990829) |
| 1.2 | 3.5 | GO:1904928 | coreceptor activity involved in canonical Wnt signaling pathway(GO:1904928) |
| 1.1 | 5.7 | GO:0016936 | galactoside binding(GO:0016936) |
| 1.1 | 4.4 | GO:0003827 | alpha-1,3-mannosylglycoprotein 2-beta-N-acetylglucosaminyltransferase activity(GO:0003827) |
| 1.0 | 5.1 | GO:0042296 | ISG15 transferase activity(GO:0042296) |
| 1.0 | 5.0 | GO:0017018 | myosin phosphatase activity(GO:0017018) |
| 1.0 | 5.0 | GO:0008332 | low voltage-gated calcium channel activity(GO:0008332) |
| 0.9 | 8.5 | GO:0036402 | proteasome-activating ATPase activity(GO:0036402) |
| 0.9 | 24.0 | GO:0005092 | GDP-dissociation inhibitor activity(GO:0005092) |
| 0.9 | 12.9 | GO:0046976 | histone methyltransferase activity (H3-K27 specific)(GO:0046976) |
| 0.9 | 6.1 | GO:0030267 | hydroxypyruvate reductase activity(GO:0016618) glyoxylate reductase (NADP) activity(GO:0030267) |
| 0.9 | 21.5 | GO:0016922 | ligand-dependent nuclear receptor binding(GO:0016922) |
| 0.9 | 3.4 | GO:0019788 | NEDD8 transferase activity(GO:0019788) |
| 0.8 | 6.4 | GO:0102337 | fatty acid elongase activity(GO:0009922) 3-oxo-arachidoyl-CoA synthase activity(GO:0102336) 3-oxo-cerotoyl-CoA synthase activity(GO:0102337) 3-oxo-lignoceronyl-CoA synthase activity(GO:0102338) |
| 0.8 | 5.4 | GO:0051864 | histone demethylase activity (H3-K36 specific)(GO:0051864) |
| 0.8 | 33.5 | GO:0046966 | thyroid hormone receptor binding(GO:0046966) |
| 0.8 | 15.2 | GO:0008349 | MAP kinase kinase kinase kinase activity(GO:0008349) |
| 0.7 | 2.9 | GO:0004706 | JUN kinase kinase kinase activity(GO:0004706) |
| 0.7 | 17.5 | GO:0070530 | K63-linked polyubiquitin binding(GO:0070530) |
| 0.7 | 5.1 | GO:0000155 | phosphorelay sensor kinase activity(GO:0000155) |
| 0.7 | 5.0 | GO:0004652 | polynucleotide adenylyltransferase activity(GO:0004652) |
| 0.7 | 2.1 | GO:0005260 | channel-conductance-controlling ATPase activity(GO:0005260) |
| 0.7 | 3.5 | GO:0036033 | mediator complex binding(GO:0036033) |
| 0.7 | 29.9 | GO:0061650 | ubiquitin conjugating enzyme activity(GO:0061631) ubiquitin-like protein conjugating enzyme activity(GO:0061650) |
| 0.7 | 2.8 | GO:0004466 | long-chain-acyl-CoA dehydrogenase activity(GO:0004466) |
| 0.7 | 18.5 | GO:0048156 | tau protein binding(GO:0048156) |
| 0.7 | 4.7 | GO:0010858 | calcium-dependent protein kinase regulator activity(GO:0010858) |
| 0.7 | 11.1 | GO:0032454 | histone demethylase activity (H3-K9 specific)(GO:0032454) |
| 0.6 | 18.5 | GO:0031698 | beta-2 adrenergic receptor binding(GO:0031698) |
| 0.6 | 70.5 | GO:0000979 | RNA polymerase II core promoter sequence-specific DNA binding(GO:0000979) |
| 0.6 | 14.0 | GO:0015271 | outward rectifier potassium channel activity(GO:0015271) |
| 0.6 | 4.0 | GO:0042975 | peroxisome proliferator activated receptor binding(GO:0042975) |
| 0.6 | 3.3 | GO:0004839 | ubiquitin activating enzyme activity(GO:0004839) |
| 0.6 | 5.0 | GO:0001161 | intronic transcription regulatory region sequence-specific DNA binding(GO:0001161) intronic transcription regulatory region DNA binding(GO:0044213) |
| 0.6 | 22.6 | GO:0043027 | cysteine-type endopeptidase inhibitor activity involved in apoptotic process(GO:0043027) |
| 0.5 | 25.1 | GO:0030374 | ligand-dependent nuclear receptor transcription coactivator activity(GO:0030374) |
| 0.5 | 20.7 | GO:0003950 | NAD+ ADP-ribosyltransferase activity(GO:0003950) |
| 0.5 | 9.7 | GO:0070016 | armadillo repeat domain binding(GO:0070016) |
| 0.5 | 5.9 | GO:0016274 | arginine N-methyltransferase activity(GO:0016273) protein-arginine N-methyltransferase activity(GO:0016274) |
| 0.5 | 3.2 | GO:0005127 | ciliary neurotrophic factor receptor binding(GO:0005127) |
| 0.5 | 8.9 | GO:0016004 | phospholipase activator activity(GO:0016004) |
| 0.5 | 1.0 | GO:0032422 | purine-rich negative regulatory element binding(GO:0032422) |
| 0.5 | 1.5 | GO:0030272 | 5-formyltetrahydrofolate cyclo-ligase activity(GO:0030272) |
| 0.5 | 4.4 | GO:0003831 | beta-N-acetylglucosaminylglycopeptide beta-1,4-galactosyltransferase activity(GO:0003831) |
| 0.5 | 6.2 | GO:0008190 | eukaryotic initiation factor 4E binding(GO:0008190) |
| 0.4 | 2.7 | GO:0004046 | aminoacylase activity(GO:0004046) |
| 0.4 | 7.5 | GO:0032452 | histone demethylase activity(GO:0032452) |
| 0.4 | 12.9 | GO:0008187 | poly-pyrimidine tract binding(GO:0008187) |
| 0.4 | 10.7 | GO:0008157 | protein phosphatase 1 binding(GO:0008157) |
| 0.4 | 4.7 | GO:0017162 | aryl hydrocarbon receptor binding(GO:0017162) |
| 0.4 | 1.7 | GO:0019770 | IgG receptor activity(GO:0019770) |
| 0.4 | 4.7 | GO:0098599 | palmitoyl-(protein) hydrolase activity(GO:0008474) palmitoyl hydrolase activity(GO:0098599) |
| 0.4 | 2.1 | GO:0001010 | transcription factor activity, sequence-specific DNA binding transcription factor recruiting(GO:0001010) |
| 0.4 | 2.1 | GO:0004161 | dimethylallyltranstransferase activity(GO:0004161) geranyltranstransferase activity(GO:0004337) |
| 0.4 | 4.9 | GO:0005005 | transmembrane-ephrin receptor activity(GO:0005005) |
| 0.4 | 1.9 | GO:0043183 | vascular endothelial growth factor receptor 1 binding(GO:0043183) |
| 0.4 | 3.4 | GO:0015143 | urate transmembrane transporter activity(GO:0015143) salt transmembrane transporter activity(GO:1901702) |
| 0.4 | 2.3 | GO:0051032 | nucleic acid transmembrane transporter activity(GO:0051032) RNA transmembrane transporter activity(GO:0051033) |
| 0.4 | 10.4 | GO:0070410 | co-SMAD binding(GO:0070410) |
| 0.4 | 7.4 | GO:0005522 | profilin binding(GO:0005522) |
| 0.4 | 3.7 | GO:0070087 | chromo shadow domain binding(GO:0070087) |
| 0.4 | 2.2 | GO:0034186 | apolipoprotein A-I binding(GO:0034186) |
| 0.4 | 27.2 | GO:0003705 | transcription factor activity, RNA polymerase II distal enhancer sequence-specific binding(GO:0003705) |
| 0.4 | 2.9 | GO:0050733 | RS domain binding(GO:0050733) |
| 0.4 | 3.6 | GO:0001135 | transcription factor activity, RNA polymerase II transcription factor recruiting(GO:0001135) |
| 0.3 | 6.9 | GO:0098748 | clathrin adaptor activity(GO:0035615) endocytic adaptor activity(GO:0098748) |
| 0.3 | 9.1 | GO:0003746 | translation elongation factor activity(GO:0003746) |
| 0.3 | 2.0 | GO:0004897 | ciliary neurotrophic factor receptor activity(GO:0004897) |
| 0.3 | 6.9 | GO:0005385 | zinc ion transmembrane transporter activity(GO:0005385) |
| 0.3 | 2.2 | GO:0008568 | microtubule-severing ATPase activity(GO:0008568) |
| 0.3 | 1.3 | GO:0050659 | N-acetylgalactosamine 4-sulfate 6-O-sulfotransferase activity(GO:0050659) |
| 0.3 | 5.6 | GO:0031996 | thioesterase binding(GO:0031996) |
| 0.3 | 24.5 | GO:0000980 | RNA polymerase II distal enhancer sequence-specific DNA binding(GO:0000980) |
| 0.3 | 11.0 | GO:0001671 | ATPase activator activity(GO:0001671) |
| 0.3 | 13.8 | GO:0001190 | transcriptional activator activity, RNA polymerase II transcription factor binding(GO:0001190) transcriptional repressor activity, RNA polymerase II activating transcription factor binding(GO:0098811) |
| 0.3 | 3.1 | GO:0046790 | virion binding(GO:0046790) |
| 0.3 | 2.2 | GO:1990825 | sequence-specific mRNA binding(GO:1990825) |
| 0.3 | 3.8 | GO:0045294 | alpha-catenin binding(GO:0045294) |
| 0.3 | 1.1 | GO:1990430 | extracellular matrix protein binding(GO:1990430) |
| 0.3 | 2.1 | GO:0032393 | MHC class I receptor activity(GO:0032393) |
| 0.3 | 0.8 | GO:0071532 | ankyrin repeat binding(GO:0071532) |
| 0.3 | 1.3 | GO:0003680 | AT DNA binding(GO:0003680) |
| 0.3 | 13.8 | GO:0017112 | Rab guanyl-nucleotide exchange factor activity(GO:0017112) |
| 0.2 | 2.2 | GO:0019784 | NEDD8-specific protease activity(GO:0019784) |
| 0.2 | 1.0 | GO:0019797 | procollagen-proline 3-dioxygenase activity(GO:0019797) |
| 0.2 | 1.9 | GO:0050682 | AF-2 domain binding(GO:0050682) |
| 0.2 | 21.7 | GO:0008094 | DNA-dependent ATPase activity(GO:0008094) |
| 0.2 | 10.4 | GO:0005484 | SNAP receptor activity(GO:0005484) |
| 0.2 | 13.5 | GO:0019213 | deacetylase activity(GO:0019213) |
| 0.2 | 12.8 | GO:0005160 | transforming growth factor beta receptor binding(GO:0005160) |
| 0.2 | 1.3 | GO:0003886 | DNA (cytosine-5-)-methyltransferase activity(GO:0003886) |
| 0.2 | 0.8 | GO:0035033 | histone deacetylase regulator activity(GO:0035033) |
| 0.2 | 1.6 | GO:0030911 | TPR domain binding(GO:0030911) |
| 0.2 | 1.3 | GO:0039706 | co-receptor binding(GO:0039706) |
| 0.2 | 0.5 | GO:0005280 | hydrogen:amino acid symporter activity(GO:0005280) |
| 0.2 | 3.5 | GO:0005537 | mannose binding(GO:0005537) |
| 0.2 | 0.5 | GO:0070984 | SET domain binding(GO:0070984) |
| 0.2 | 5.8 | GO:0005086 | ARF guanyl-nucleotide exchange factor activity(GO:0005086) |
| 0.2 | 5.3 | GO:0031624 | ubiquitin conjugating enzyme binding(GO:0031624) |
| 0.2 | 0.8 | GO:0016929 | SUMO-specific protease activity(GO:0016929) |
| 0.2 | 4.0 | GO:0042288 | MHC class I protein binding(GO:0042288) |
| 0.2 | 12.3 | GO:0019003 | GDP binding(GO:0019003) |
| 0.2 | 1.5 | GO:1990381 | ubiquitin-specific protease binding(GO:1990381) |
| 0.1 | 10.7 | GO:0004722 | protein serine/threonine phosphatase activity(GO:0004722) |
| 0.1 | 2.8 | GO:0042162 | telomeric DNA binding(GO:0042162) |
| 0.1 | 3.0 | GO:0019992 | diacylglycerol binding(GO:0019992) |
| 0.1 | 2.5 | GO:0008569 | ATP-dependent microtubule motor activity, minus-end-directed(GO:0008569) |
| 0.1 | 0.7 | GO:0043184 | vascular endothelial growth factor receptor 2 binding(GO:0043184) |
| 0.1 | 2.5 | GO:0048531 | beta-1,3-galactosyltransferase activity(GO:0048531) |
| 0.1 | 1.9 | GO:0009931 | calcium-dependent protein serine/threonine kinase activity(GO:0009931) |
| 0.1 | 5.6 | GO:0050699 | WW domain binding(GO:0050699) |
| 0.1 | 2.1 | GO:0001054 | RNA polymerase I activity(GO:0001054) |
| 0.1 | 8.6 | GO:0019843 | rRNA binding(GO:0019843) |
| 0.1 | 1.1 | GO:0004118 | cGMP-stimulated cyclic-nucleotide phosphodiesterase activity(GO:0004118) |
| 0.1 | 2.8 | GO:0004697 | protein kinase C activity(GO:0004697) |
| 0.1 | 0.4 | GO:0031208 | POZ domain binding(GO:0031208) |
| 0.1 | 1.7 | GO:0048406 | nerve growth factor binding(GO:0048406) |
| 0.1 | 2.4 | GO:0008191 | metalloendopeptidase inhibitor activity(GO:0008191) |
| 0.1 | 25.9 | GO:0001227 | transcriptional repressor activity, RNA polymerase II transcription regulatory region sequence-specific binding(GO:0001227) |
| 0.1 | 5.9 | GO:0001047 | core promoter binding(GO:0001047) |
| 0.1 | 11.0 | GO:0003697 | single-stranded DNA binding(GO:0003697) |
| 0.1 | 8.3 | GO:0043021 | ribonucleoprotein complex binding(GO:0043021) |
| 0.1 | 0.9 | GO:0001609 | G-protein coupled adenosine receptor activity(GO:0001609) |
| 0.1 | 0.7 | GO:0008379 | thioredoxin peroxidase activity(GO:0008379) |
| 0.1 | 10.7 | GO:0047485 | protein N-terminus binding(GO:0047485) |
| 0.1 | 1.3 | GO:0030547 | receptor inhibitor activity(GO:0030547) |
| 0.1 | 1.5 | GO:0030297 | transmembrane receptor protein tyrosine kinase activator activity(GO:0030297) |
| 0.1 | 1.3 | GO:0042043 | neurexin family protein binding(GO:0042043) |
| 0.1 | 1.5 | GO:0030215 | semaphorin receptor binding(GO:0030215) |
| 0.1 | 6.8 | GO:0003730 | mRNA 3'-UTR binding(GO:0003730) |
| 0.1 | 0.6 | GO:0003828 | alpha-N-acetylneuraminate alpha-2,8-sialyltransferase activity(GO:0003828) |
| 0.1 | 7.0 | GO:0019905 | syntaxin binding(GO:0019905) |
| 0.1 | 0.3 | GO:0015056 | corticotrophin-releasing factor receptor activity(GO:0015056) |
| 0.1 | 6.7 | GO:0003725 | double-stranded RNA binding(GO:0003725) |
| 0.1 | 4.6 | GO:0050136 | NADH dehydrogenase (ubiquinone) activity(GO:0008137) NADH dehydrogenase (quinone) activity(GO:0050136) |
| 0.1 | 2.0 | GO:0042056 | chemoattractant activity(GO:0042056) |
| 0.1 | 0.7 | GO:0047499 | calcium-independent phospholipase A2 activity(GO:0047499) |
| 0.1 | 2.7 | GO:0033613 | activating transcription factor binding(GO:0033613) |
| 0.1 | 5.2 | GO:0004843 | thiol-dependent ubiquitin-specific protease activity(GO:0004843) |
| 0.1 | 0.3 | GO:0044736 | acid-sensing ion channel activity(GO:0044736) |
| 0.1 | 1.0 | GO:0000175 | 3'-5'-exoribonuclease activity(GO:0000175) |
| 0.1 | 3.8 | GO:0015485 | cholesterol binding(GO:0015485) |
| 0.1 | 0.3 | GO:0004991 | parathyroid hormone receptor activity(GO:0004991) |
| 0.1 | 10.3 | GO:0008201 | heparin binding(GO:0008201) |
| 0.1 | 0.7 | GO:0043176 | amine binding(GO:0043176) serotonin binding(GO:0051378) |
| 0.1 | 2.5 | GO:0005547 | phosphatidylinositol-3,4,5-trisphosphate binding(GO:0005547) |
| 0.1 | 0.9 | GO:0030296 | protein tyrosine kinase activator activity(GO:0030296) |
| 0.1 | 6.1 | GO:0001618 | virus receptor activity(GO:0001618) |
| 0.1 | 1.5 | GO:0051879 | Hsp90 protein binding(GO:0051879) |
| 0.1 | 0.8 | GO:0031404 | chloride ion binding(GO:0031404) |
| 0.1 | 0.8 | GO:0017017 | MAP kinase tyrosine/serine/threonine phosphatase activity(GO:0017017) |
| 0.1 | 1.3 | GO:0051010 | microtubule plus-end binding(GO:0051010) |
| 0.0 | 1.0 | GO:0016175 | superoxide-generating NADPH oxidase activity(GO:0016175) |
| 0.0 | 2.4 | GO:0042826 | histone deacetylase binding(GO:0042826) |
| 0.0 | 0.3 | GO:0015277 | kainate selective glutamate receptor activity(GO:0015277) |
| 0.0 | 2.1 | GO:0003743 | translation initiation factor activity(GO:0003743) |
| 0.0 | 0.3 | GO:0030021 | extracellular matrix structural constituent conferring compression resistance(GO:0030021) structural constituent of tooth enamel(GO:0030345) |
| 0.0 | 1.9 | GO:0003684 | damaged DNA binding(GO:0003684) |
| 0.0 | 0.7 | GO:0015347 | sodium-independent organic anion transmembrane transporter activity(GO:0015347) |
| 0.0 | 1.3 | GO:0070035 | ATP-dependent helicase activity(GO:0008026) purine NTP-dependent helicase activity(GO:0070035) |
| 0.0 | 0.6 | GO:0102391 | decanoate--CoA ligase activity(GO:0102391) |
| 0.0 | 7.2 | GO:0030246 | carbohydrate binding(GO:0030246) |
| 0.0 | 1.1 | GO:0070063 | RNA polymerase binding(GO:0070063) |
| 0.0 | 2.6 | GO:0020037 | heme binding(GO:0020037) |
| 0.0 | 0.1 | GO:0004972 | NMDA glutamate receptor activity(GO:0004972) |
| 0.0 | 0.1 | GO:0008607 | phosphorylase kinase regulator activity(GO:0008607) |
Gene overrepresentation in curated gene sets: canonical pathways category:
| Log-likelihood per target | Total log-likelihood | Term | Description |
|---|---|---|---|
| 3.3 | 75.0 | PID RANBP2 PATHWAY | Sumoylation by RanBP2 regulates transcriptional repression |
| 1.5 | 28.8 | PID CIRCADIAN PATHWAY | Circadian rhythm pathway |
| 1.3 | 2.6 | PID WNT NONCANONICAL PATHWAY | Noncanonical Wnt signaling pathway |
| 1.0 | 36.5 | PID SMAD2 3PATHWAY | Regulation of cytoplasmic and nuclear SMAD2/3 signaling |
| 0.7 | 7.9 | SA G1 AND S PHASES | Cdk2, 4, and 6 bind cyclin D in G1, while cdk2/cyclin E promotes the G1/S transition. |
| 0.7 | 14.5 | PID TCR JNK PATHWAY | JNK signaling in the CD4+ TCR pathway |
| 0.5 | 59.2 | PID RB 1PATHWAY | Regulation of retinoblastoma protein |
| 0.5 | 14.7 | PID HIF1A PATHWAY | Hypoxic and oxygen homeostasis regulation of HIF-1-alpha |
| 0.5 | 30.0 | ST ERK1 ERK2 MAPK PATHWAY | ERK1/ERK2 MAPK Pathway |
| 0.5 | 39.4 | PID PLK1 PATHWAY | PLK1 signaling events |
| 0.5 | 39.7 | PID TGFBR PATHWAY | TGF-beta receptor signaling |
| 0.5 | 46.6 | PID HDAC CLASSI PATHWAY | Signaling events mediated by HDAC Class I |
| 0.4 | 12.6 | PID DNA PK PATHWAY | DNA-PK pathway in nonhomologous end joining |
| 0.4 | 10.0 | PID BETA CATENIN DEG PATHWAY | Degradation of beta catenin |
| 0.4 | 32.4 | PID AP1 PATHWAY | AP-1 transcription factor network |
| 0.4 | 14.2 | PID INSULIN GLUCOSE PATHWAY | Insulin-mediated glucose transport |
| 0.4 | 26.0 | PID TELOMERASE PATHWAY | Regulation of Telomerase |
| 0.3 | 5.4 | PID HDAC CLASSII PATHWAY | Signaling events mediated by HDAC Class II |
| 0.3 | 9.0 | PID MYC PATHWAY | C-MYC pathway |
| 0.3 | 7.2 | PID INTEGRIN5 PATHWAY | Beta5 beta6 beta7 and beta8 integrin cell surface interactions |
| 0.3 | 3.7 | PID VEGF VEGFR PATHWAY | VEGF and VEGFR signaling network |
| 0.3 | 22.9 | PID MYC ACTIV PATHWAY | Validated targets of C-MYC transcriptional activation |
| 0.2 | 0.7 | PID LYMPH ANGIOGENESIS PATHWAY | VEGFR3 signaling in lymphatic endothelium |
| 0.2 | 6.5 | PID WNT SIGNALING PATHWAY | Wnt signaling network |
| 0.2 | 10.3 | PID TCPTP PATHWAY | Signaling events mediated by TCPTP |
| 0.2 | 8.0 | PID NECTIN PATHWAY | Nectin adhesion pathway |
| 0.2 | 8.6 | PID P53 REGULATION PATHWAY | p53 pathway |
| 0.2 | 6.3 | PID ATR PATHWAY | ATR signaling pathway |
| 0.2 | 5.6 | PID FRA PATHWAY | Validated transcriptional targets of AP1 family members Fra1 and Fra2 |
| 0.2 | 16.7 | PID CASPASE PATHWAY | Caspase cascade in apoptosis |
| 0.2 | 3.7 | PID ERBB1 RECEPTOR PROXIMAL PATHWAY | EGF receptor (ErbB1) signaling pathway |
| 0.2 | 4.5 | PID CD40 PATHWAY | CD40/CD40L signaling |
| 0.2 | 13.8 | PID ERA GENOMIC PATHWAY | Validated nuclear estrogen receptor alpha network |
| 0.2 | 5.1 | PID IL6 7 PATHWAY | IL6-mediated signaling events |
| 0.2 | 4.7 | PID TOLL ENDOGENOUS PATHWAY | Endogenous TLR signaling |
| 0.2 | 11.8 | PID BETA CATENIN NUC PATHWAY | Regulation of nuclear beta catenin signaling and target gene transcription |
| 0.2 | 1.5 | PID P38 ALPHA BETA DOWNSTREAM PATHWAY | Signaling mediated by p38-alpha and p38-beta |
| 0.1 | 8.5 | PID HIF1 TFPATHWAY | HIF-1-alpha transcription factor network |
| 0.1 | 2.4 | PID FANCONI PATHWAY | Fanconi anemia pathway |
| 0.1 | 1.8 | PID IGF1 PATHWAY | IGF1 pathway |
| 0.1 | 4.9 | PID AURORA B PATHWAY | Aurora B signaling |
| 0.1 | 1.9 | PID P38 MK2 PATHWAY | p38 signaling mediated by MAPKAP kinases |
| 0.1 | 4.1 | PID DELTA NP63 PATHWAY | Validated transcriptional targets of deltaNp63 isoforms |
| 0.1 | 6.1 | PID AR PATHWAY | Coregulation of Androgen receptor activity |
| 0.1 | 7.7 | PID ERBB1 DOWNSTREAM PATHWAY | ErbB1 downstream signaling |
| 0.1 | 5.5 | PID TAP63 PATHWAY | Validated transcriptional targets of TAp63 isoforms |
| 0.1 | 3.0 | PID CD8 TCR PATHWAY | TCR signaling in naïve CD8+ T cells |
| 0.1 | 2.2 | PID ANGIOPOIETIN RECEPTOR PATHWAY | Angiopoietin receptor Tie2-mediated signaling |
| 0.1 | 2.2 | PID MTOR 4PATHWAY | mTOR signaling pathway |
| 0.1 | 1.4 | PID IFNG PATHWAY | IFN-gamma pathway |
| 0.1 | 1.8 | PID RHOA PATHWAY | RhoA signaling pathway |
| 0.0 | 0.9 | PID HIF2PATHWAY | HIF-2-alpha transcription factor network |
| 0.0 | 2.4 | PID ILK PATHWAY | Integrin-linked kinase signaling |
| 0.0 | 2.1 | PID NOTCH PATHWAY | Notch signaling pathway |
| 0.0 | 1.8 | PID FGF PATHWAY | FGF signaling pathway |
| 0.0 | 1.3 | PID NFAT TFPATHWAY | Calcineurin-regulated NFAT-dependent transcription in lymphocytes |
| 0.0 | 1.0 | WNT SIGNALING | Genes related to Wnt-mediated signal transduction |
| 0.0 | 1.6 | PID HNF3B PATHWAY | FOXA2 and FOXA3 transcription factor networks |
| 0.0 | 1.1 | NABA BASEMENT MEMBRANES | Genes encoding structural components of basement membranes |
| 0.0 | 0.7 | PID AR TF PATHWAY | Regulation of Androgen receptor activity |
| 0.0 | 0.1 | PID REELIN PATHWAY | Reelin signaling pathway |
| 0.0 | 0.1 | SA B CELL RECEPTOR COMPLEXES | Antigen binding to B cell receptors activates protein tyrosine kinases, such as the Src family, which ultimate activate MAP kinases. |
Gene overrepresentation in curated gene sets: REACTOME pathways category:
| Log-likelihood per target | Total log-likelihood | Term | Description |
|---|---|---|---|
| 2.7 | 78.6 | REACTOME CYCLIN A B1 ASSOCIATED EVENTS DURING G2 M TRANSITION | Genes involved in Cyclin A/B1 associated events during G2/M transition |
| 1.2 | 13.0 | REACTOME IRAK2 MEDIATED ACTIVATION OF TAK1 COMPLEX UPON TLR7 8 OR 9 STIMULATION | Genes involved in IRAK2 mediated activation of TAK1 complex upon TLR7/8 or 9 stimulation |
| 1.1 | 8.5 | REACTOME RNA POL I PROMOTER OPENING | Genes involved in RNA Polymerase I Promoter Opening |
| 0.8 | 8.9 | REACTOME COPI MEDIATED TRANSPORT | Genes involved in COPI Mediated Transport |
| 0.8 | 37.7 | REACTOME DOWNREGULATION OF SMAD2 3 SMAD4 TRANSCRIPTIONAL ACTIVITY | Genes involved in Downregulation of SMAD2/3:SMAD4 transcriptional activity |
| 0.8 | 14.1 | REACTOME OXYGEN DEPENDENT PROLINE HYDROXYLATION OF HYPOXIA INDUCIBLE FACTOR ALPHA | Genes involved in Oxygen-dependent Proline Hydroxylation of Hypoxia-inducible Factor Alpha |
| 0.8 | 9.8 | REACTOME CDC6 ASSOCIATION WITH THE ORC ORIGIN COMPLEX | Genes involved in CDC6 association with the ORC:origin complex |
| 0.7 | 34.7 | REACTOME MEIOTIC SYNAPSIS | Genes involved in Meiotic Synapsis |
| 0.7 | 16.9 | REACTOME DOWNREGULATION OF TGF BETA RECEPTOR SIGNALING | Genes involved in Downregulation of TGF-beta receptor signaling |
| 0.6 | 22.4 | REACTOME DEADENYLATION OF MRNA | Genes involved in Deadenylation of mRNA |
| 0.6 | 17.8 | REACTOME RNA POL I TRANSCRIPTION | Genes involved in RNA Polymerase I Transcription |
| 0.5 | 28.9 | REACTOME G1 PHASE | Genes involved in G1 Phase |
| 0.5 | 34.6 | REACTOME CROSS PRESENTATION OF SOLUBLE EXOGENOUS ANTIGENS ENDOSOMES | Genes involved in Cross-presentation of soluble exogenous antigens (endosomes) |
| 0.5 | 21.1 | REACTOME NUCLEAR EVENTS KINASE AND TRANSCRIPTION FACTOR ACTIVATION | Genes involved in Nuclear Events (kinase and transcription factor activation) |
| 0.5 | 10.4 | REACTOME PROTEOLYTIC CLEAVAGE OF SNARE COMPLEX PROTEINS | Genes involved in Proteolytic cleavage of SNARE complex proteins |
| 0.5 | 3.7 | REACTOME RAF MAP KINASE CASCADE | Genes involved in RAF/MAP kinase cascade |
| 0.4 | 6.9 | REACTOME ZINC TRANSPORTERS | Genes involved in Zinc transporters |
| 0.4 | 10.0 | REACTOME P130CAS LINKAGE TO MAPK SIGNALING FOR INTEGRINS | Genes involved in p130Cas linkage to MAPK signaling for integrins |
| 0.4 | 6.2 | REACTOME APOPTOSIS INDUCED DNA FRAGMENTATION | Genes involved in Apoptosis induced DNA fragmentation |
| 0.4 | 75.1 | REACTOME DIABETES PATHWAYS | Genes involved in Diabetes pathways |
| 0.4 | 5.7 | REACTOME FORMATION OF RNA POL II ELONGATION COMPLEX | Genes involved in Formation of RNA Pol II elongation complex |
| 0.4 | 63.4 | REACTOME ANTIGEN PROCESSING UBIQUITINATION PROTEASOME DEGRADATION | Genes involved in Antigen processing: Ubiquitination & Proteasome degradation |
| 0.3 | 20.5 | REACTOME MITOCHONDRIAL PROTEIN IMPORT | Genes involved in Mitochondrial Protein Import |
| 0.3 | 20.2 | REACTOME CIRCADIAN CLOCK | Genes involved in Circadian Clock |
| 0.3 | 9.8 | REACTOME SYNTHESIS OF VERY LONG CHAIN FATTY ACYL COAS | Genes involved in Synthesis of very long-chain fatty acyl-CoAs |
| 0.3 | 11.7 | REACTOME NEGATIVE REGULATORS OF RIG I MDA5 SIGNALING | Genes involved in Negative regulators of RIG-I/MDA5 signaling |
| 0.3 | 2.1 | REACTOME RECEPTOR LIGAND BINDING INITIATES THE SECOND PROTEOLYTIC CLEAVAGE OF NOTCH RECEPTOR | Genes involved in Receptor-ligand binding initiates the second proteolytic cleavage of Notch receptor |
| 0.3 | 6.6 | REACTOME DEPOSITION OF NEW CENPA CONTAINING NUCLEOSOMES AT THE CENTROMERE | Genes involved in Deposition of New CENPA-containing Nucleosomes at the Centromere |
| 0.3 | 1.7 | REACTOME TGF BETA RECEPTOR SIGNALING ACTIVATES SMADS | Genes involved in TGF-beta receptor signaling activates SMADs |
| 0.3 | 6.6 | REACTOME TRAF6 MEDIATED IRF7 ACTIVATION | Genes involved in TRAF6 mediated IRF7 activation |
| 0.3 | 9.9 | REACTOME PROSTACYCLIN SIGNALLING THROUGH PROSTACYCLIN RECEPTOR | Genes involved in Prostacyclin signalling through prostacyclin receptor |
| 0.2 | 37.1 | REACTOME MRNA SPLICING | Genes involved in mRNA Splicing |
| 0.2 | 9.0 | REACTOME REGULATION OF MRNA STABILITY BY PROTEINS THAT BIND AU RICH ELEMENTS | Genes involved in Regulation of mRNA Stability by Proteins that Bind AU-rich Elements |
| 0.2 | 3.4 | REACTOME KERATAN SULFATE DEGRADATION | Genes involved in Keratan sulfate degradation |
| 0.2 | 1.8 | REACTOME SOS MEDIATED SIGNALLING | Genes involved in SOS-mediated signalling |
| 0.2 | 11.0 | REACTOME SIGNAL TRANSDUCTION BY L1 | Genes involved in Signal transduction by L1 |
| 0.2 | 15.2 | REACTOME APOPTOTIC CLEAVAGE OF CELLULAR PROTEINS | Genes involved in Apoptotic cleavage of cellular proteins |
| 0.2 | 3.4 | REACTOME ORGANIC CATION ANION ZWITTERION TRANSPORT | Genes involved in Organic cation/anion/zwitterion transport |
| 0.2 | 2.8 | REACTOME NONSENSE MEDIATED DECAY ENHANCED BY THE EXON JUNCTION COMPLEX | Genes involved in Nonsense Mediated Decay Enhanced by the Exon Junction Complex |
| 0.2 | 9.7 | REACTOME NOTCH1 INTRACELLULAR DOMAIN REGULATES TRANSCRIPTION | Genes involved in NOTCH1 Intracellular Domain Regulates Transcription |
| 0.1 | 5.6 | REACTOME DOWNSTREAM TCR SIGNALING | Genes involved in Downstream TCR signaling |
| 0.1 | 10.8 | REACTOME TRANS GOLGI NETWORK VESICLE BUDDING | Genes involved in trans-Golgi Network Vesicle Budding |
| 0.1 | 7.4 | REACTOME TRANSPORT TO THE GOLGI AND SUBSEQUENT MODIFICATION | Genes involved in Transport to the Golgi and subsequent modification |
| 0.1 | 1.9 | REACTOME VEGF LIGAND RECEPTOR INTERACTIONS | Genes involved in VEGF ligand-receptor interactions |
| 0.1 | 3.0 | REACTOME INTEGRIN ALPHAIIB BETA3 SIGNALING | Genes involved in Integrin alphaIIb beta3 signaling |
| 0.1 | 2.7 | REACTOME DOWNSTREAM SIGNAL TRANSDUCTION | Genes involved in Downstream signal transduction |
| 0.1 | 7.3 | REACTOME VOLTAGE GATED POTASSIUM CHANNELS | Genes involved in Voltage gated Potassium channels |
| 0.1 | 3.6 | REACTOME SIGNALING BY FGFR1 FUSION MUTANTS | Genes involved in Signaling by FGFR1 fusion mutants |
| 0.1 | 1.8 | REACTOME SIGNALING BY FGFR1 MUTANTS | Genes involved in Signaling by FGFR1 mutants |
| 0.1 | 2.3 | REACTOME OTHER SEMAPHORIN INTERACTIONS | Genes involved in Other semaphorin interactions |
| 0.1 | 1.8 | REACTOME FANCONI ANEMIA PATHWAY | Genes involved in Fanconi Anemia pathway |
| 0.1 | 8.3 | REACTOME IMMUNOREGULATORY INTERACTIONS BETWEEN A LYMPHOID AND A NON LYMPHOID CELL | Genes involved in Immunoregulatory interactions between a Lymphoid and a non-Lymphoid cell |
| 0.1 | 2.2 | REACTOME HDL MEDIATED LIPID TRANSPORT | Genes involved in HDL-mediated lipid transport |
| 0.1 | 13.3 | REACTOME PEPTIDE CHAIN ELONGATION | Genes involved in Peptide chain elongation |
| 0.1 | 2.8 | REACTOME O LINKED GLYCOSYLATION OF MUCINS | Genes involved in O-linked glycosylation of mucins |
| 0.1 | 0.3 | REACTOME REGULATION OF HYPOXIA INDUCIBLE FACTOR HIF BY OXYGEN | Genes involved in Regulation of Hypoxia-inducible Factor (HIF) by Oxygen |
| 0.1 | 2.3 | REACTOME PTM GAMMA CARBOXYLATION HYPUSINE FORMATION AND ARYLSULFATASE ACTIVATION | Genes involved in PTM: gamma carboxylation, hypusine formation and arylsulfatase activation |
| 0.1 | 4.6 | REACTOME RESPIRATORY ELECTRON TRANSPORT | Genes involved in Respiratory electron transport |
| 0.1 | 2.1 | REACTOME CHOLESTEROL BIOSYNTHESIS | Genes involved in Cholesterol biosynthesis |
| 0.1 | 1.6 | REACTOME DEGRADATION OF THE EXTRACELLULAR MATRIX | Genes involved in Degradation of the extracellular matrix |
| 0.0 | 0.7 | REACTOME SEROTONIN RECEPTORS | Genes involved in Serotonin receptors |
| 0.0 | 1.3 | REACTOME KINESINS | Genes involved in Kinesins |
| 0.0 | 0.7 | REACTOME TRANSPORT OF ORGANIC ANIONS | Genes involved in Transport of organic anions |
| 0.0 | 1.3 | REACTOME CHONDROITIN SULFATE BIOSYNTHESIS | Genes involved in Chondroitin sulfate biosynthesis |
| 0.0 | 2.3 | REACTOME ANTIVIRAL MECHANISM BY IFN STIMULATED GENES | Genes involved in Antiviral mechanism by IFN-stimulated genes |
| 0.0 | 0.9 | REACTOME NUCLEOTIDE LIKE PURINERGIC RECEPTORS | Genes involved in Nucleotide-like (purinergic) receptors |
| 0.0 | 2.1 | REACTOME TRANSLATION | Genes involved in Translation |
| 0.0 | 1.1 | REACTOME INTEGRIN CELL SURFACE INTERACTIONS | Genes involved in Integrin cell surface interactions |
| 0.0 | 0.4 | REACTOME TRAF6 MEDIATED NFKB ACTIVATION | Genes involved in TRAF6 mediated NF-kB activation |
| 0.0 | 1.3 | REACTOME NETRIN1 SIGNALING | Genes involved in Netrin-1 signaling |
| 0.0 | 1.2 | REACTOME SMOOTH MUSCLE CONTRACTION | Genes involved in Smooth Muscle Contraction |
| 0.0 | 1.5 | REACTOME TRANSCRIPTIONAL REGULATION OF WHITE ADIPOCYTE DIFFERENTIATION | Genes involved in Transcriptional Regulation of White Adipocyte Differentiation |
| 0.0 | 1.2 | REACTOME FACTORS INVOLVED IN MEGAKARYOCYTE DEVELOPMENT AND PLATELET PRODUCTION | Genes involved in Factors involved in megakaryocyte development and platelet production |