Project
SARS-CoV-2 Analysis Results (GEO series: GSE147507)
Navigation
Downloads
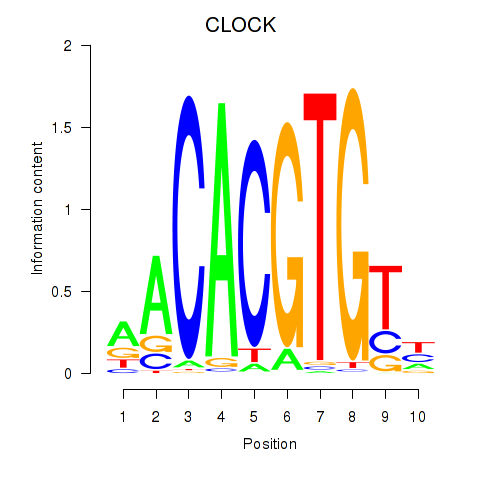
Results for CLOCK
Z-value: 1.59
Motif logo
Transcription factors associated with CLOCK
| Gene Symbol | Gene ID | Gene Info |
|---|---|---|
|
CLOCK
|
ENSG00000134852.10 | clock circadian regulator |
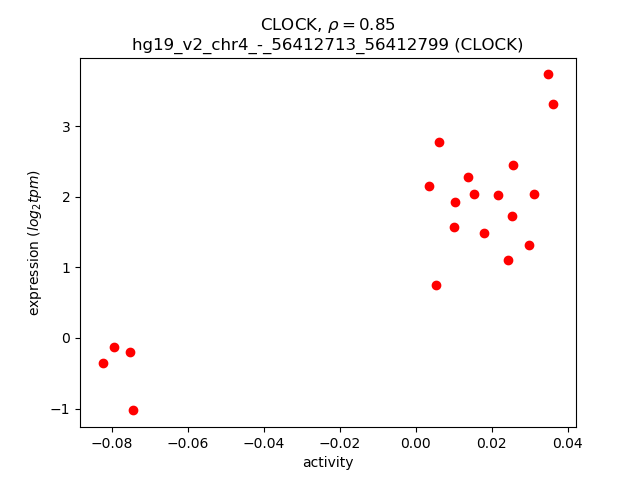
Activity-expression correlation:
| Gene | Promoter | Pearson corr. coef. | P-value | Plot |
|---|---|---|---|---|
| CLOCK | hg19_v2_chr4_-_56412713_56412799 | 0.85 | 2.7e-06 | Click! |
Activity profile of CLOCK motif
Sorted Z-values of CLOCK motif
| Promoter | Log-likelihood | Transcript | Gene | Gene Info |
|---|---|---|---|---|
| chr2_-_232328867 | 5.12 |
ENST00000453992.1
ENST00000417652.1 ENST00000454824.1 |
NCL
|
nucleolin |
| chr5_+_110427983 | 4.15 |
ENST00000513710.2
ENST00000505303.1 |
WDR36
|
WD repeat domain 36 |
| chr2_-_198364581 | 3.69 |
ENST00000428204.1
|
HSPD1
|
heat shock 60kDa protein 1 (chaperonin) |
| chr15_+_98503922 | 3.25 |
ENST00000268042.6
|
ARRDC4
|
arrestin domain containing 4 |
| chr9_+_112542591 | 3.20 |
ENST00000483909.1
ENST00000314527.4 ENST00000413420.1 ENST00000302798.7 ENST00000555236.1 ENST00000510514.5 |
PALM2
PALM2-AKAP2
AKAP2
|
paralemmin 2 PALM2-AKAP2 readthrough A kinase (PRKA) anchor protein 2 |
| chrX_-_48326764 | 3.13 |
ENST00000413668.1
ENST00000441948.1 |
SLC38A5
|
solute carrier family 38, member 5 |
| chr11_-_61101247 | 3.10 |
ENST00000543627.1
|
DDB1
|
damage-specific DNA binding protein 1, 127kDa |
| chr5_+_138609782 | 3.06 |
ENST00000361059.2
ENST00000514694.1 ENST00000504203.1 ENST00000502929.1 ENST00000394800.2 ENST00000509644.1 ENST00000505016.1 |
MATR3
|
matrin 3 |
| chr9_+_135545409 | 2.96 |
ENST00000483873.2
ENST00000372146.4 |
GTF3C4
|
general transcription factor IIIC, polypeptide 4, 90kDa |
| chr1_-_113498616 | 2.70 |
ENST00000433570.4
ENST00000538576.1 ENST00000458229.1 |
SLC16A1
|
solute carrier family 16 (monocarboxylate transporter), member 1 |
| chr2_+_201171268 | 2.61 |
ENST00000423749.1
ENST00000428692.1 ENST00000457757.1 ENST00000453663.1 |
SPATS2L
|
spermatogenesis associated, serine-rich 2-like |
| chr12_-_6715808 | 2.59 |
ENST00000545584.1
|
CHD4
|
chromodomain helicase DNA binding protein 4 |
| chr6_+_149539767 | 2.56 |
ENST00000606202.1
ENST00000536230.1 ENST00000445901.1 |
TAB2
RP1-111D6.3
|
TGF-beta activated kinase 1/MAP3K7 binding protein 2 RP1-111D6.3 |
| chrX_-_48326683 | 2.55 |
ENST00000440085.1
|
SLC38A5
|
solute carrier family 38, member 5 |
| chr11_+_72929319 | 2.54 |
ENST00000393597.2
ENST00000311131.2 |
P2RY2
|
purinergic receptor P2Y, G-protein coupled, 2 |
| chr2_-_74618907 | 2.51 |
ENST00000421392.1
ENST00000437375.1 |
DCTN1
|
dynactin 1 |
| chr11_-_122932730 | 2.47 |
ENST00000532182.1
ENST00000524590.1 ENST00000528292.1 ENST00000533540.1 ENST00000525463.1 |
HSPA8
|
heat shock 70kDa protein 8 |
| chr6_-_41888843 | 2.40 |
ENST00000434077.1
ENST00000409312.1 |
MED20
|
mediator complex subunit 20 |
| chr15_-_83952071 | 2.35 |
ENST00000569704.1
|
BNC1
|
basonuclin 1 |
| chr10_+_70715884 | 2.34 |
ENST00000354185.4
|
DDX21
|
DEAD (Asp-Glu-Ala-Asp) box helicase 21 |
| chr7_-_92465868 | 2.32 |
ENST00000424848.2
|
CDK6
|
cyclin-dependent kinase 6 |
| chr1_+_150254936 | 2.30 |
ENST00000447007.1
ENST00000369095.1 ENST00000369094.1 |
C1orf51
|
chromosome 1 open reading frame 51 |
| chr12_-_31478428 | 2.26 |
ENST00000543615.1
|
FAM60A
|
family with sequence similarity 60, member A |
| chr17_+_40985407 | 2.26 |
ENST00000586114.1
ENST00000590720.1 ENST00000585805.1 ENST00000541124.1 ENST00000441946.2 ENST00000591152.1 ENST00000589469.1 ENST00000293362.3 ENST00000592169.1 |
PSME3
|
proteasome (prosome, macropain) activator subunit 3 (PA28 gamma; Ki) |
| chr11_-_122931881 | 2.23 |
ENST00000526110.1
ENST00000227378.3 |
HSPA8
|
heat shock 70kDa protein 8 |
| chr5_+_34656529 | 2.23 |
ENST00000513974.1
ENST00000512629.1 |
RAI14
|
retinoic acid induced 14 |
| chr17_-_8059638 | 2.17 |
ENST00000584202.1
ENST00000354903.5 ENST00000577253.1 |
PER1
|
period circadian clock 1 |
| chr1_-_22215192 | 2.06 |
ENST00000374673.3
|
HSPG2
|
heparan sulfate proteoglycan 2 |
| chr9_-_135545380 | 2.03 |
ENST00000544003.1
|
DDX31
|
DEAD (Asp-Glu-Ala-Asp) box polypeptide 31 |
| chr11_+_72929402 | 2.02 |
ENST00000393596.2
|
P2RY2
|
purinergic receptor P2Y, G-protein coupled, 2 |
| chr5_+_43120985 | 2.02 |
ENST00000515326.1
|
ZNF131
|
zinc finger protein 131 |
| chr7_-_30009542 | 2.01 |
ENST00000438497.1
|
SCRN1
|
secernin 1 |
| chr5_-_142784101 | 1.99 |
ENST00000503201.1
ENST00000502892.1 |
NR3C1
|
nuclear receptor subfamily 3, group C, member 1 (glucocorticoid receptor) |
| chr18_+_72163536 | 1.98 |
ENST00000579847.1
ENST00000583203.1 ENST00000581513.1 ENST00000577600.1 ENST00000579583.1 ENST00000584613.1 |
CNDP2
|
CNDP dipeptidase 2 (metallopeptidase M20 family) |
| chr12_+_57623907 | 1.97 |
ENST00000553529.1
ENST00000554310.1 |
SHMT2
|
serine hydroxymethyltransferase 2 (mitochondrial) |
| chr5_+_34656450 | 1.93 |
ENST00000514527.1
|
RAI14
|
retinoic acid induced 14 |
| chr12_+_57624059 | 1.91 |
ENST00000557427.1
|
SHMT2
|
serine hydroxymethyltransferase 2 (mitochondrial) |
| chr3_-_150481218 | 1.90 |
ENST00000482706.1
|
SIAH2
|
siah E3 ubiquitin protein ligase 2 |
| chr17_-_38657849 | 1.90 |
ENST00000254051.6
|
TNS4
|
tensin 4 |
| chr11_-_3013482 | 1.88 |
ENST00000529361.1
ENST00000528968.1 ENST00000534372.1 ENST00000531291.1 ENST00000526842.1 |
NAP1L4
|
nucleosome assembly protein 1-like 4 |
| chr4_-_76649546 | 1.87 |
ENST00000508510.1
ENST00000509561.1 ENST00000499709.2 ENST00000511868.1 |
G3BP2
|
GTPase activating protein (SH3 domain) binding protein 2 |
| chr3_+_32148106 | 1.87 |
ENST00000425459.1
ENST00000431009.1 |
GPD1L
|
glycerol-3-phosphate dehydrogenase 1-like |
| chr9_+_131445703 | 1.87 |
ENST00000454747.1
|
SET
|
SET nuclear oncogene |
| chr13_+_98628886 | 1.84 |
ENST00000490680.1
ENST00000539640.1 ENST00000403772.3 |
IPO5
|
importin 5 |
| chr21_-_16374688 | 1.83 |
ENST00000411932.1
|
NRIP1
|
nuclear receptor interacting protein 1 |
| chr7_-_30008849 | 1.79 |
ENST00000409497.1
|
SCRN1
|
secernin 1 |
| chr4_+_169842707 | 1.78 |
ENST00000503290.1
|
PALLD
|
palladin, cytoskeletal associated protein |
| chr17_-_655278 | 1.78 |
ENST00000574958.1
ENST00000437269.1 ENST00000573482.1 |
GEMIN4
|
gem (nuclear organelle) associated protein 4 |
| chr6_-_90529418 | 1.77 |
ENST00000439638.1
ENST00000369393.3 ENST00000428876.1 |
MDN1
|
MDN1, midasin homolog (yeast) |
| chr2_-_44223089 | 1.75 |
ENST00000447246.1
ENST00000409946.1 ENST00000409659.1 |
LRPPRC
|
leucine-rich pentatricopeptide repeat containing |
| chr5_+_138609441 | 1.75 |
ENST00000509990.1
ENST00000506147.1 ENST00000512107.1 |
MATR3
|
matrin 3 |
| chr5_+_70883154 | 1.70 |
ENST00000509358.2
|
MCCC2
|
methylcrotonoyl-CoA carboxylase 2 (beta) |
| chr4_+_89514402 | 1.67 |
ENST00000426683.1
|
HERC3
|
HECT and RLD domain containing E3 ubiquitin protein ligase 3 |
| chr2_+_158114051 | 1.64 |
ENST00000259056.4
|
GALNT5
|
UDP-N-acetyl-alpha-D-galactosamine:polypeptide N-acetylgalactosaminyltransferase 5 (GalNAc-T5) |
| chr21_-_28215332 | 1.64 |
ENST00000517777.1
|
ADAMTS1
|
ADAM metallopeptidase with thrombospondin type 1 motif, 1 |
| chr18_+_72163443 | 1.64 |
ENST00000324262.4
ENST00000580672.1 |
CNDP2
|
CNDP dipeptidase 2 (metallopeptidase M20 family) |
| chr4_+_57333756 | 1.64 |
ENST00000510663.1
ENST00000504757.1 |
SRP72
|
signal recognition particle 72kDa |
| chr2_+_201170999 | 1.62 |
ENST00000439395.1
ENST00000444012.1 |
SPATS2L
|
spermatogenesis associated, serine-rich 2-like |
| chr2_+_201171064 | 1.60 |
ENST00000451764.2
|
SPATS2L
|
spermatogenesis associated, serine-rich 2-like |
| chr4_+_37828255 | 1.60 |
ENST00000381967.4
ENST00000544359.1 ENST00000537241.1 |
PGM2
|
phosphoglucomutase 2 |
| chr9_+_112542572 | 1.59 |
ENST00000374530.3
|
PALM2-AKAP2
|
PALM2-AKAP2 readthrough |
| chr1_-_26233423 | 1.59 |
ENST00000357865.2
|
STMN1
|
stathmin 1 |
| chr11_-_3013497 | 1.59 |
ENST00000448187.1
ENST00000532325.2 ENST00000399614.2 |
NAP1L4
|
nucleosome assembly protein 1-like 4 |
| chr2_-_220117867 | 1.57 |
ENST00000456818.1
ENST00000447205.1 |
TUBA4A
|
tubulin, alpha 4a |
| chr11_-_3013316 | 1.57 |
ENST00000430811.1
|
NAP1L4
|
nucleosome assembly protein 1-like 4 |
| chr1_-_205744205 | 1.57 |
ENST00000446390.2
|
RAB7L1
|
RAB7, member RAS oncogene family-like 1 |
| chr2_-_172291273 | 1.56 |
ENST00000442778.1
ENST00000453846.1 |
METTL8
|
methyltransferase like 8 |
| chr15_-_64126084 | 1.55 |
ENST00000560316.1
ENST00000443617.2 ENST00000560462.1 ENST00000558532.1 ENST00000561400.1 |
HERC1
|
HECT and RLD domain containing E3 ubiquitin protein ligase family member 1 |
| chr16_+_50280020 | 1.53 |
ENST00000564965.1
|
ADCY7
|
adenylate cyclase 7 |
| chr9_-_6015607 | 1.52 |
ENST00000259569.5
|
RANBP6
|
RAN binding protein 6 |
| chr15_-_49447771 | 1.51 |
ENST00000558843.1
ENST00000542928.1 ENST00000561248.1 |
COPS2
|
COP9 signalosome subunit 2 |
| chr1_+_166808667 | 1.51 |
ENST00000537173.1
ENST00000536514.1 ENST00000449930.1 |
POGK
|
pogo transposable element with KRAB domain |
| chr6_+_73331918 | 1.50 |
ENST00000402622.2
ENST00000355635.3 ENST00000403813.2 ENST00000414165.2 |
KCNQ5
|
potassium voltage-gated channel, KQT-like subfamily, member 5 |
| chr4_+_89514516 | 1.49 |
ENST00000452979.1
|
HERC3
|
HECT and RLD domain containing E3 ubiquitin protein ligase 3 |
| chr18_-_2982869 | 1.49 |
ENST00000584915.1
|
LPIN2
|
lipin 2 |
| chr8_-_103424986 | 1.49 |
ENST00000521922.1
|
UBR5
|
ubiquitin protein ligase E3 component n-recognin 5 |
| chr5_-_127873496 | 1.48 |
ENST00000508989.1
|
FBN2
|
fibrillin 2 |
| chr4_+_76649753 | 1.46 |
ENST00000603759.1
|
USO1
|
USO1 vesicle transport factor |
| chr16_+_66914264 | 1.45 |
ENST00000311765.2
ENST00000568869.1 ENST00000561704.1 ENST00000568398.1 ENST00000566776.1 |
PDP2
|
pyruvate dehyrogenase phosphatase catalytic subunit 2 |
| chr11_-_107436443 | 1.44 |
ENST00000429370.1
ENST00000417449.2 ENST00000428149.2 |
ALKBH8
|
alkB, alkylation repair homolog 8 (E. coli) |
| chr3_-_123411191 | 1.43 |
ENST00000354792.5
ENST00000508240.1 |
MYLK
|
myosin light chain kinase |
| chr2_+_201170770 | 1.41 |
ENST00000409988.3
ENST00000409385.1 |
SPATS2L
|
spermatogenesis associated, serine-rich 2-like |
| chr16_-_4588762 | 1.41 |
ENST00000562334.1
ENST00000562579.1 ENST00000567695.1 ENST00000563507.1 |
CDIP1
|
cell death-inducing p53 target 1 |
| chr2_+_17721920 | 1.41 |
ENST00000295156.4
|
VSNL1
|
visinin-like 1 |
| chr2_-_198364552 | 1.41 |
ENST00000439605.1
ENST00000418022.1 |
HSPD1
|
heat shock 60kDa protein 1 (chaperonin) |
| chr8_+_38614778 | 1.40 |
ENST00000521050.1
ENST00000522904.1 |
TACC1
|
transforming, acidic coiled-coil containing protein 1 |
| chr2_+_187350973 | 1.38 |
ENST00000544130.1
|
ZC3H15
|
zinc finger CCCH-type containing 15 |
| chr6_-_32636145 | 1.38 |
ENST00000399084.1
|
HLA-DQB1
|
major histocompatibility complex, class II, DQ beta 1 |
| chr5_+_133984462 | 1.37 |
ENST00000398844.2
ENST00000322887.4 |
SEC24A
|
SEC24 family member A |
| chr18_+_33877654 | 1.37 |
ENST00000257209.4
ENST00000445677.1 ENST00000590592.1 ENST00000359247.4 |
FHOD3
|
formin homology 2 domain containing 3 |
| chr3_+_52720187 | 1.37 |
ENST00000474423.1
|
GNL3
|
guanine nucleotide binding protein-like 3 (nucleolar) |
| chr20_-_6103666 | 1.35 |
ENST00000536936.1
|
FERMT1
|
fermitin family member 1 |
| chr5_+_70883178 | 1.34 |
ENST00000323375.8
|
MCCC2
|
methylcrotonoyl-CoA carboxylase 2 (beta) |
| chr19_+_19516561 | 1.33 |
ENST00000457895.2
|
GATAD2A
|
GATA zinc finger domain containing 2A |
| chr4_-_54232144 | 1.33 |
ENST00000388940.4
ENST00000503450.1 ENST00000401642.3 |
SCFD2
|
sec1 family domain containing 2 |
| chr17_-_5372068 | 1.32 |
ENST00000572490.1
|
DHX33
|
DEAH (Asp-Glu-Ala-His) box polypeptide 33 |
| chr8_+_6566206 | 1.30 |
ENST00000518327.1
|
AGPAT5
|
1-acylglycerol-3-phosphate O-acyltransferase 5 |
| chr12_-_105352047 | 1.30 |
ENST00000432951.1
ENST00000415674.1 ENST00000424946.1 |
SLC41A2
|
solute carrier family 41 (magnesium transporter), member 2 |
| chr6_-_89673280 | 1.29 |
ENST00000369475.3
ENST00000369485.4 ENST00000538899.1 ENST00000265607.6 |
RNGTT
|
RNA guanylyltransferase and 5'-phosphatase |
| chr6_+_142623758 | 1.29 |
ENST00000541199.1
ENST00000435011.2 |
GPR126
|
G protein-coupled receptor 126 |
| chr6_-_153304697 | 1.29 |
ENST00000367241.3
|
FBXO5
|
F-box protein 5 |
| chr16_+_53088885 | 1.27 |
ENST00000566029.1
ENST00000447540.1 |
CHD9
|
chromodomain helicase DNA binding protein 9 |
| chr22_+_40390930 | 1.25 |
ENST00000333407.6
|
FAM83F
|
family with sequence similarity 83, member F |
| chr6_-_41888814 | 1.25 |
ENST00000409060.1
ENST00000265350.4 |
MED20
|
mediator complex subunit 20 |
| chr2_-_220118631 | 1.25 |
ENST00000248437.4
|
TUBA4A
|
tubulin, alpha 4a |
| chr10_+_180405 | 1.24 |
ENST00000439456.1
ENST00000397962.3 ENST00000309776.4 ENST00000381602.4 |
ZMYND11
|
zinc finger, MYND-type containing 11 |
| chr3_-_150481164 | 1.24 |
ENST00000312960.3
|
SIAH2
|
siah E3 ubiquitin protein ligase 2 |
| chr17_-_40075219 | 1.24 |
ENST00000537919.1
ENST00000352035.2 ENST00000353196.1 ENST00000393896.2 |
ACLY
|
ATP citrate lyase |
| chr2_+_201170596 | 1.23 |
ENST00000439084.1
ENST00000409718.1 |
SPATS2L
|
spermatogenesis associated, serine-rich 2-like |
| chr6_-_153304148 | 1.23 |
ENST00000229758.3
|
FBXO5
|
F-box protein 5 |
| chr12_+_109535373 | 1.23 |
ENST00000242576.2
|
UNG
|
uracil-DNA glycosylase |
| chr1_+_236958554 | 1.22 |
ENST00000366577.5
ENST00000418145.2 |
MTR
|
5-methyltetrahydrofolate-homocysteine methyltransferase |
| chr1_+_44445643 | 1.22 |
ENST00000309519.7
|
B4GALT2
|
UDP-Gal:betaGlcNAc beta 1,4- galactosyltransferase, polypeptide 2 |
| chr2_+_201171372 | 1.20 |
ENST00000409140.3
|
SPATS2L
|
spermatogenesis associated, serine-rich 2-like |
| chr2_-_31361362 | 1.20 |
ENST00000430167.1
|
GALNT14
|
UDP-N-acetyl-alpha-D-galactosamine:polypeptide N-acetylgalactosaminyltransferase 14 (GalNAc-T14) |
| chr2_+_201171242 | 1.19 |
ENST00000360760.5
|
SPATS2L
|
spermatogenesis associated, serine-rich 2-like |
| chr3_-_52719810 | 1.19 |
ENST00000424867.1
ENST00000394830.3 ENST00000431678.1 ENST00000450271.1 |
PBRM1
|
polybromo 1 |
| chr12_-_6716569 | 1.19 |
ENST00000544040.1
ENST00000545942.1 |
CHD4
|
chromodomain helicase DNA binding protein 4 |
| chr6_+_7108210 | 1.19 |
ENST00000467782.1
ENST00000334984.6 ENST00000349384.6 |
RREB1
|
ras responsive element binding protein 1 |
| chr13_+_26828275 | 1.17 |
ENST00000381527.3
|
CDK8
|
cyclin-dependent kinase 8 |
| chr11_+_34643600 | 1.17 |
ENST00000530286.1
ENST00000533754.1 |
EHF
|
ets homologous factor |
| chr2_-_47142884 | 1.16 |
ENST00000409105.1
ENST00000409973.1 ENST00000409913.1 ENST00000319466.4 |
MCFD2
|
multiple coagulation factor deficiency 2 |
| chrX_-_128977875 | 1.16 |
ENST00000406492.2
|
ZDHHC9
|
zinc finger, DHHC-type containing 9 |
| chr15_+_76135622 | 1.16 |
ENST00000338677.4
ENST00000267938.4 ENST00000569423.1 |
UBE2Q2
|
ubiquitin-conjugating enzyme E2Q family member 2 |
| chr1_-_205744574 | 1.15 |
ENST00000367139.3
ENST00000235932.4 ENST00000437324.2 ENST00000414729.1 |
RAB7L1
|
RAB7, member RAS oncogene family-like 1 |
| chr2_+_62423242 | 1.15 |
ENST00000301998.4
|
B3GNT2
|
UDP-GlcNAc:betaGal beta-1,3-N-acetylglucosaminyltransferase 2 |
| chr1_-_35325318 | 1.14 |
ENST00000423898.1
ENST00000456842.1 |
SMIM12
|
small integral membrane protein 12 |
| chr2_+_109335929 | 1.13 |
ENST00000283195.6
|
RANBP2
|
RAN binding protein 2 |
| chr11_-_76091986 | 1.12 |
ENST00000260045.3
|
PRKRIR
|
protein-kinase, interferon-inducible double stranded RNA dependent inhibitor, repressor of (P58 repressor) |
| chr12_+_64798095 | 1.12 |
ENST00000332707.5
|
XPOT
|
exportin, tRNA |
| chr1_-_227505289 | 1.12 |
ENST00000366765.3
|
CDC42BPA
|
CDC42 binding protein kinase alpha (DMPK-like) |
| chr14_-_91884115 | 1.10 |
ENST00000389857.6
|
CCDC88C
|
coiled-coil domain containing 88C |
| chr1_-_86174065 | 1.10 |
ENST00000370574.3
ENST00000431532.2 |
ZNHIT6
|
zinc finger, HIT-type containing 6 |
| chr6_-_17706618 | 1.10 |
ENST00000262077.2
ENST00000537253.1 |
NUP153
|
nucleoporin 153kDa |
| chr17_-_5372229 | 1.09 |
ENST00000433302.3
|
DHX33
|
DEAH (Asp-Glu-Ala-His) box polypeptide 33 |
| chr3_+_50284321 | 1.09 |
ENST00000451956.1
|
GNAI2
|
guanine nucleotide binding protein (G protein), alpha inhibiting activity polypeptide 2 |
| chr3_+_184032919 | 1.09 |
ENST00000427845.1
ENST00000342981.4 ENST00000319274.6 |
EIF4G1
|
eukaryotic translation initiation factor 4 gamma, 1 |
| chr2_+_148778570 | 1.09 |
ENST00000407073.1
|
MBD5
|
methyl-CpG binding domain protein 5 |
| chr2_-_47143160 | 1.08 |
ENST00000409800.1
ENST00000409218.1 |
MCFD2
|
multiple coagulation factor deficiency 2 |
| chrX_+_54556633 | 1.08 |
ENST00000336470.4
ENST00000360845.2 |
GNL3L
|
guanine nucleotide binding protein-like 3 (nucleolar)-like |
| chr6_-_47277634 | 1.07 |
ENST00000296861.2
|
TNFRSF21
|
tumor necrosis factor receptor superfamily, member 21 |
| chr16_-_4588469 | 1.07 |
ENST00000588381.1
ENST00000563332.2 |
CDIP1
|
cell death-inducing p53 target 1 |
| chr2_+_242289502 | 1.07 |
ENST00000451310.1
|
SEPT2
|
septin 2 |
| chr6_-_114292284 | 1.07 |
ENST00000520895.1
ENST00000521163.1 ENST00000524334.1 ENST00000368632.2 ENST00000398283.2 |
HDAC2
|
histone deacetylase 2 |
| chr16_-_18937072 | 1.07 |
ENST00000569122.1
|
SMG1
|
SMG1 phosphatidylinositol 3-kinase-related kinase |
| chr10_-_50747064 | 1.06 |
ENST00000355832.5
ENST00000603152.1 ENST00000447839.2 |
ERCC6
PGBD3
ERCC6-PGBD3
|
excision repair cross-complementing rodent repair deficiency, complementation group 6 piggyBac transposable element derived 3 ERCC6-PGBD3 readthrough |
| chr21_-_45079341 | 1.06 |
ENST00000443485.1
ENST00000291560.2 |
HSF2BP
|
heat shock transcription factor 2 binding protein |
| chr3_+_184032419 | 1.06 |
ENST00000352767.3
ENST00000427141.2 |
EIF4G1
|
eukaryotic translation initiation factor 4 gamma, 1 |
| chr1_+_154193325 | 1.06 |
ENST00000428931.1
ENST00000441890.1 ENST00000271877.7 ENST00000412596.1 ENST00000368504.1 ENST00000437652.1 |
UBAP2L
|
ubiquitin associated protein 2-like |
| chr1_+_214776516 | 1.06 |
ENST00000366955.3
|
CENPF
|
centromere protein F, 350/400kDa |
| chr2_+_187350883 | 1.06 |
ENST00000337859.6
|
ZC3H15
|
zinc finger CCCH-type containing 15 |
| chr17_-_2615031 | 1.06 |
ENST00000576885.1
ENST00000574426.2 |
CLUH
|
clustered mitochondria (cluA/CLU1) homolog |
| chr4_-_185729602 | 1.05 |
ENST00000437665.3
|
ACSL1
|
acyl-CoA synthetase long-chain family member 1 |
| chr3_-_167813672 | 1.04 |
ENST00000470487.1
|
GOLIM4
|
golgi integral membrane protein 4 |
| chr1_+_29213678 | 1.04 |
ENST00000347529.3
|
EPB41
|
erythrocyte membrane protein band 4.1 (elliptocytosis 1, RH-linked) |
| chr2_+_118572226 | 1.04 |
ENST00000263239.2
|
DDX18
|
DEAD (Asp-Glu-Ala-Asp) box polypeptide 18 |
| chr11_-_125366089 | 1.04 |
ENST00000366139.3
ENST00000278919.3 |
FEZ1
|
fasciculation and elongation protein zeta 1 (zygin I) |
| chr1_+_61548374 | 1.04 |
ENST00000485903.2
ENST00000371185.2 ENST00000371184.2 |
NFIA
|
nuclear factor I/A |
| chr2_+_227771404 | 1.04 |
ENST00000409053.1
|
RHBDD1
|
rhomboid domain containing 1 |
| chr5_+_34656569 | 1.03 |
ENST00000428746.2
|
RAI14
|
retinoic acid induced 14 |
| chr12_-_13529642 | 1.03 |
ENST00000318426.2
|
C12orf36
|
chromosome 12 open reading frame 36 |
| chr1_+_26872324 | 1.02 |
ENST00000531382.1
|
RPS6KA1
|
ribosomal protein S6 kinase, 90kDa, polypeptide 1 |
| chr1_+_111991474 | 1.02 |
ENST00000369722.3
|
ATP5F1
|
ATP synthase, H+ transporting, mitochondrial Fo complex, subunit B1 |
| chr2_+_17721230 | 1.01 |
ENST00000457525.1
|
VSNL1
|
visinin-like 1 |
| chr14_-_91884150 | 1.01 |
ENST00000553403.1
|
CCDC88C
|
coiled-coil domain containing 88C |
| chr11_+_69455855 | 0.99 |
ENST00000227507.2
ENST00000536559.1 |
CCND1
|
cyclin D1 |
| chr6_+_7107830 | 0.99 |
ENST00000379933.3
|
RREB1
|
ras responsive element binding protein 1 |
| chr10_-_126849626 | 0.99 |
ENST00000530884.1
|
CTBP2
|
C-terminal binding protein 2 |
| chr5_+_96077888 | 0.98 |
ENST00000509259.1
ENST00000503828.1 |
CAST
|
calpastatin |
| chr9_+_706842 | 0.98 |
ENST00000382293.3
|
KANK1
|
KN motif and ankyrin repeat domains 1 |
| chr2_+_17721937 | 0.98 |
ENST00000451533.1
|
VSNL1
|
visinin-like 1 |
| chr1_+_38478432 | 0.98 |
ENST00000537711.1
|
UTP11L
|
UTP11-like, U3 small nucleolar ribonucleoprotein, (yeast) |
| chr21_-_35987438 | 0.97 |
ENST00000313806.4
|
RCAN1
|
regulator of calcineurin 1 |
| chr6_-_114292449 | 0.97 |
ENST00000519065.1
|
HDAC2
|
histone deacetylase 2 |
| chr11_+_18343800 | 0.95 |
ENST00000453096.2
|
GTF2H1
|
general transcription factor IIH, polypeptide 1, 62kDa |
| chr8_-_144679264 | 0.95 |
ENST00000531953.1
ENST00000526133.1 |
EEF1D
|
eukaryotic translation elongation factor 1 delta (guanine nucleotide exchange protein) |
| chr1_-_26232951 | 0.93 |
ENST00000426559.2
ENST00000455785.2 |
STMN1
|
stathmin 1 |
| chr8_-_103424916 | 0.93 |
ENST00000220959.4
|
UBR5
|
ubiquitin protein ligase E3 component n-recognin 5 |
| chr19_-_12833361 | 0.93 |
ENST00000592287.1
|
TNPO2
|
transportin 2 |
| chr17_-_34890617 | 0.92 |
ENST00000586886.1
ENST00000585719.1 ENST00000585818.1 |
MYO19
|
myosin XIX |
| chr7_-_47621229 | 0.92 |
ENST00000434451.1
|
TNS3
|
tensin 3 |
| chr17_+_7477040 | 0.91 |
ENST00000581384.1
ENST00000577929.1 |
EIF4A1
|
eukaryotic translation initiation factor 4A1 |
| chr4_-_152149033 | 0.91 |
ENST00000514152.1
|
SH3D19
|
SH3 domain containing 19 |
| chr2_-_74618964 | 0.91 |
ENST00000417090.1
ENST00000409868.1 |
DCTN1
|
dynactin 1 |
| chr22_-_44258360 | 0.91 |
ENST00000330884.4
ENST00000249130.5 |
SULT4A1
|
sulfotransferase family 4A, member 1 |
| chr12_-_6740802 | 0.89 |
ENST00000431922.1
|
LPAR5
|
lysophosphatidic acid receptor 5 |
| chr3_-_196987309 | 0.89 |
ENST00000453607.1
|
DLG1
|
discs, large homolog 1 (Drosophila) |
| chr4_-_4544061 | 0.88 |
ENST00000507908.1
|
STX18
|
syntaxin 18 |
| chr17_+_55163075 | 0.88 |
ENST00000571629.1
ENST00000570423.1 ENST00000575186.1 ENST00000573085.1 ENST00000572814.1 |
AKAP1
|
A kinase (PRKA) anchor protein 1 |
| chrX_-_41782683 | 0.87 |
ENST00000378163.1
ENST00000378154.1 |
CASK
|
calcium/calmodulin-dependent serine protein kinase (MAGUK family) |
| chr10_-_46090334 | 0.87 |
ENST00000395771.3
ENST00000319836.3 |
MARCH8
|
membrane-associated ring finger (C3HC4) 8, E3 ubiquitin protein ligase |
| chr12_+_65004292 | 0.86 |
ENST00000542104.1
ENST00000336061.2 |
RASSF3
|
Ras association (RalGDS/AF-6) domain family member 3 |
| chr9_-_100684769 | 0.86 |
ENST00000455506.1
ENST00000375117.4 |
C9orf156
|
chromosome 9 open reading frame 156 |
| chr1_-_249111272 | 0.86 |
ENST00000411742.2
|
SH3BP5L
|
SH3-binding domain protein 5-like |
| chr18_-_21977748 | 0.86 |
ENST00000399441.4
ENST00000319481.3 |
OSBPL1A
|
oxysterol binding protein-like 1A |
| chr12_+_57624119 | 0.86 |
ENST00000555773.1
ENST00000554975.1 ENST00000449049.3 ENST00000393827.4 |
SHMT2
|
serine hydroxymethyltransferase 2 (mitochondrial) |
| chr15_-_49447835 | 0.85 |
ENST00000388901.5
ENST00000299259.6 |
COPS2
|
COP9 signalosome subunit 2 |
| chr7_-_148725544 | 0.84 |
ENST00000413966.1
|
PDIA4
|
protein disulfide isomerase family A, member 4 |
| chr19_-_42759266 | 0.84 |
ENST00000594664.1
|
AC006486.9
|
Uncharacterized protein |
| chr20_-_49547910 | 0.84 |
ENST00000396032.3
|
ADNP
|
activity-dependent neuroprotector homeobox |
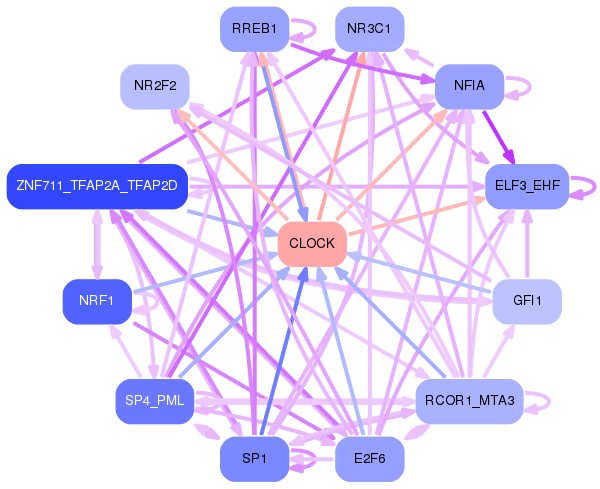
Network of associatons between targets according to the STRING database.

First level regulatory network of CLOCK
Gene Ontology Analysis
Gene overrepresentation in biological_process category:
| Log-likelihood per target | Total log-likelihood | Term | Description |
|---|---|---|---|
| 1.7 | 5.1 | GO:0045041 | B cell cytokine production(GO:0002368) protein import into mitochondrial intermembrane space(GO:0045041) |
| 0.9 | 4.7 | GO:1904764 | negative regulation of fibril organization(GO:1902904) chaperone-mediated autophagy translocation complex disassembly(GO:1904764) |
| 0.9 | 2.7 | GO:0015728 | mevalonate transport(GO:0015728) behavioral response to nutrient(GO:0051780) |
| 0.8 | 2.5 | GO:0007057 | spindle assembly involved in female meiosis I(GO:0007057) |
| 0.7 | 6.8 | GO:0019264 | glycine biosynthetic process from serine(GO:0019264) |
| 0.7 | 2.7 | GO:1903691 | positive regulation of wound healing, spreading of epidermal cells(GO:1903691) |
| 0.6 | 1.9 | GO:0000961 | negative regulation of mitochondrial RNA catabolic process(GO:0000961) |
| 0.6 | 1.9 | GO:0046168 | glycerol-3-phosphate catabolic process(GO:0046168) |
| 0.6 | 3.1 | GO:0046726 | positive regulation by virus of viral protein levels in host cell(GO:0046726) |
| 0.6 | 1.8 | GO:0001543 | ovarian follicle rupture(GO:0001543) |
| 0.6 | 0.6 | GO:0009405 | pathogenesis(GO:0009405) |
| 0.5 | 2.5 | GO:0015862 | uridine transport(GO:0015862) |
| 0.5 | 4.5 | GO:0072553 | terminal button organization(GO:0072553) |
| 0.5 | 3.3 | GO:1905098 | negative regulation of guanyl-nucleotide exchange factor activity(GO:1905098) |
| 0.4 | 1.3 | GO:0098507 | polynucleotide 5' dephosphorylation(GO:0098507) |
| 0.4 | 5.9 | GO:1901838 | positive regulation of transcription of nuclear large rRNA transcript from RNA polymerase I promoter(GO:1901838) |
| 0.4 | 1.6 | GO:0006421 | asparaginyl-tRNA aminoacylation(GO:0006421) |
| 0.4 | 3.4 | GO:0090063 | positive regulation of microtubule nucleation(GO:0090063) |
| 0.4 | 1.1 | GO:0032240 | negative regulation of nucleobase-containing compound transport(GO:0032240) negative regulation of RNA export from nucleus(GO:0046832) |
| 0.3 | 1.7 | GO:1990569 | UDP-N-acetylglucosamine transport(GO:0015788) UDP-N-acetylglucosamine transmembrane transport(GO:1990569) |
| 0.3 | 1.0 | GO:1904211 | membrane protein proteolysis involved in retrograde protein transport, ER to cytosol(GO:1904211) |
| 0.3 | 3.0 | GO:0042797 | 5S class rRNA transcription from RNA polymerase III type 1 promoter(GO:0042791) tRNA transcription from RNA polymerase III promoter(GO:0042797) |
| 0.3 | 1.0 | GO:2000393 | negative regulation of lamellipodium morphogenesis(GO:2000393) |
| 0.3 | 1.3 | GO:0048698 | negative regulation of collateral sprouting in absence of injury(GO:0048698) |
| 0.3 | 5.7 | GO:0015816 | glycine transport(GO:0015816) |
| 0.3 | 2.5 | GO:2000323 | negative regulation of glucocorticoid receptor signaling pathway(GO:2000323) |
| 0.3 | 4.6 | GO:0070257 | positive regulation of mucus secretion(GO:0070257) |
| 0.3 | 1.2 | GO:0097252 | oligodendrocyte apoptotic process(GO:0097252) |
| 0.3 | 5.4 | GO:0006610 | ribosomal protein import into nucleus(GO:0006610) |
| 0.3 | 1.5 | GO:0048254 | snoRNA localization(GO:0048254) |
| 0.3 | 2.9 | GO:1901315 | negative regulation of histone ubiquitination(GO:0033183) regulation of histone H2A K63-linked ubiquitination(GO:1901314) negative regulation of histone H2A K63-linked ubiquitination(GO:1901315) |
| 0.3 | 1.1 | GO:0090526 | regulation of gluconeogenesis involved in cellular glucose homeostasis(GO:0090526) |
| 0.3 | 2.7 | GO:0006552 | leucine catabolic process(GO:0006552) |
| 0.3 | 0.5 | GO:0009048 | dosage compensation(GO:0007549) dosage compensation by inactivation of X chromosome(GO:0009048) |
| 0.3 | 2.0 | GO:0061198 | fungiform papilla formation(GO:0061198) |
| 0.2 | 1.4 | GO:0006551 | leucine metabolic process(GO:0006551) branched-chain amino acid biosynthetic process(GO:0009082) leucine biosynthetic process(GO:0009098) valine biosynthetic process(GO:0009099) |
| 0.2 | 1.1 | GO:0030311 | poly-N-acetyllactosamine biosynthetic process(GO:0030311) |
| 0.2 | 1.3 | GO:0048817 | negative regulation of hair follicle maturation(GO:0048817) |
| 0.2 | 1.3 | GO:0072425 | signal transduction involved in G2 DNA damage checkpoint(GO:0072425) signal transduction involved in mitotic G2 DNA damage checkpoint(GO:0072434) |
| 0.2 | 0.6 | GO:0048627 | myoblast development(GO:0048627) |
| 0.2 | 1.2 | GO:0060399 | positive regulation of growth hormone receptor signaling pathway(GO:0060399) |
| 0.2 | 1.4 | GO:0006740 | NADPH regeneration(GO:0006740) |
| 0.2 | 1.6 | GO:0006616 | SRP-dependent cotranslational protein targeting to membrane, translocation(GO:0006616) |
| 0.2 | 0.8 | GO:0009956 | radial pattern formation(GO:0009956) |
| 0.2 | 0.8 | GO:0046110 | xanthine metabolic process(GO:0046110) |
| 0.2 | 0.6 | GO:0021722 | superior olivary nucleus development(GO:0021718) superior olivary nucleus maturation(GO:0021722) |
| 0.2 | 0.7 | GO:0090149 | mitochondrial membrane fission(GO:0090149) |
| 0.2 | 0.7 | GO:0031455 | glycine betaine biosynthetic process from choline(GO:0019285) glycine betaine metabolic process(GO:0031455) glycine betaine biosynthetic process(GO:0031456) |
| 0.2 | 2.3 | GO:0043697 | dedifferentiation(GO:0043696) cell dedifferentiation(GO:0043697) |
| 0.2 | 2.6 | GO:2000507 | cap-dependent translational initiation(GO:0002191) positive regulation of energy homeostasis(GO:2000507) |
| 0.2 | 0.5 | GO:0003220 | left ventricular cardiac muscle tissue morphogenesis(GO:0003220) cell proliferation involved in heart valve morphogenesis(GO:0003249) regulation of cell proliferation involved in heart valve morphogenesis(GO:0003250) |
| 0.2 | 2.3 | GO:0048280 | vesicle fusion with Golgi apparatus(GO:0048280) |
| 0.2 | 0.6 | GO:0019072 | viral genome packaging(GO:0019072) viral RNA genome packaging(GO:0019074) |
| 0.2 | 1.4 | GO:0060414 | aorta smooth muscle tissue morphogenesis(GO:0060414) |
| 0.2 | 0.5 | GO:0046901 | tetrahydrofolylpolyglutamate biosynthetic process(GO:0046901) |
| 0.2 | 1.5 | GO:0048386 | positive regulation of retinoic acid receptor signaling pathway(GO:0048386) |
| 0.2 | 0.9 | GO:0019470 | 4-hydroxyproline catabolic process(GO:0019470) |
| 0.2 | 1.1 | GO:0061484 | hematopoietic stem cell homeostasis(GO:0061484) |
| 0.1 | 0.6 | GO:1903660 | negative regulation of complement-dependent cytotoxicity(GO:1903660) |
| 0.1 | 0.9 | GO:0090158 | endoplasmic reticulum membrane organization(GO:0090158) |
| 0.1 | 0.4 | GO:0044205 | 'de novo' UMP biosynthetic process(GO:0044205) |
| 0.1 | 2.7 | GO:0010510 | regulation of acetyl-CoA biosynthetic process from pyruvate(GO:0010510) |
| 0.1 | 0.4 | GO:0010643 | cell communication by chemical coupling(GO:0010643) |
| 0.1 | 1.4 | GO:2000189 | positive regulation of cholesterol homeostasis(GO:2000189) |
| 0.1 | 0.4 | GO:0000967 | endonucleolytic cleavage to generate mature 5'-end of SSU-rRNA from (SSU-rRNA, 5.8S rRNA, LSU-rRNA)(GO:0000472) rRNA 5'-end processing(GO:0000967) ncRNA 5'-end processing(GO:0034471) |
| 0.1 | 1.5 | GO:0035583 | sequestering of TGFbeta in extracellular matrix(GO:0035583) |
| 0.1 | 2.0 | GO:0043402 | glucocorticoid mediated signaling pathway(GO:0043402) |
| 0.1 | 2.6 | GO:0000338 | protein deneddylation(GO:0000338) |
| 0.1 | 0.8 | GO:0009233 | menaquinone metabolic process(GO:0009233) |
| 0.1 | 0.5 | GO:0042000 | translocation of peptides or proteins into host(GO:0042000) translocation of peptides or proteins into host cell cytoplasm(GO:0044053) translocation of molecules into host(GO:0044417) translocation of peptides or proteins into other organism involved in symbiotic interaction(GO:0051808) translocation of molecules into other organism involved in symbiotic interaction(GO:0051836) |
| 0.1 | 1.5 | GO:0006189 | 'de novo' IMP biosynthetic process(GO:0006189) |
| 0.1 | 0.6 | GO:0010157 | response to chlorate(GO:0010157) |
| 0.1 | 0.3 | GO:0045347 | negative regulation of MHC class II biosynthetic process(GO:0045347) |
| 0.1 | 0.4 | GO:0006286 | base-excision repair, base-free sugar-phosphate removal(GO:0006286) |
| 0.1 | 0.8 | GO:0033484 | nitric oxide homeostasis(GO:0033484) |
| 0.1 | 0.6 | GO:0014053 | negative regulation of gamma-aminobutyric acid secretion(GO:0014053) aspartate secretion(GO:0061528) regulation of aspartate secretion(GO:1904448) positive regulation of aspartate secretion(GO:1904450) |
| 0.1 | 1.1 | GO:0007256 | activation of JNKK activity(GO:0007256) |
| 0.1 | 0.7 | GO:0070940 | dephosphorylation of RNA polymerase II C-terminal domain(GO:0070940) |
| 0.1 | 0.3 | GO:0050894 | determination of affect(GO:0050894) |
| 0.1 | 2.8 | GO:0045943 | positive regulation of transcription from RNA polymerase I promoter(GO:0045943) |
| 0.1 | 2.0 | GO:0007253 | cytoplasmic sequestering of NF-kappaB(GO:0007253) |
| 0.1 | 0.3 | GO:0015074 | DNA integration(GO:0015074) |
| 0.1 | 1.6 | GO:0001542 | ovulation from ovarian follicle(GO:0001542) |
| 0.1 | 1.0 | GO:2000491 | positive regulation of hepatic stellate cell activation(GO:2000491) |
| 0.1 | 0.4 | GO:0006272 | leading strand elongation(GO:0006272) |
| 0.1 | 0.3 | GO:1903033 | regulation of microtubule plus-end binding(GO:1903031) positive regulation of microtubule plus-end binding(GO:1903033) |
| 0.1 | 0.7 | GO:2000568 | memory T cell activation(GO:0035709) regulation of memory T cell activation(GO:2000567) positive regulation of memory T cell activation(GO:2000568) |
| 0.1 | 1.6 | GO:0021694 | cerebellar Purkinje cell layer formation(GO:0021694) cerebellar Purkinje cell differentiation(GO:0021702) |
| 0.1 | 0.6 | GO:1901907 | diadenosine polyphosphate catabolic process(GO:0015961) diphosphoinositol polyphosphate metabolic process(GO:0071543) diadenosine pentaphosphate metabolic process(GO:1901906) diadenosine pentaphosphate catabolic process(GO:1901907) diadenosine hexaphosphate metabolic process(GO:1901908) diadenosine hexaphosphate catabolic process(GO:1901909) adenosine 5'-(hexahydrogen pentaphosphate) metabolic process(GO:1901910) adenosine 5'-(hexahydrogen pentaphosphate) catabolic process(GO:1901911) |
| 0.1 | 0.7 | GO:1905150 | regulation of voltage-gated sodium channel activity(GO:1905150) |
| 0.1 | 1.8 | GO:0002566 | somatic diversification of immune receptors via somatic mutation(GO:0002566) somatic hypermutation of immunoglobulin genes(GO:0016446) |
| 0.1 | 2.6 | GO:0006337 | nucleosome disassembly(GO:0006337) |
| 0.1 | 0.7 | GO:0010499 | proteasomal ubiquitin-independent protein catabolic process(GO:0010499) |
| 0.1 | 0.9 | GO:1903764 | regulation of potassium ion export across plasma membrane(GO:1903764) |
| 0.1 | 0.8 | GO:0019255 | glucose 1-phosphate metabolic process(GO:0019255) |
| 0.1 | 0.5 | GO:0060528 | secretory columnal luminar epithelial cell differentiation involved in prostate glandular acinus development(GO:0060528) |
| 0.1 | 2.0 | GO:1903830 | magnesium ion transmembrane transport(GO:1903830) |
| 0.1 | 0.4 | GO:0071873 | response to norepinephrine(GO:0071873) cellular response to norepinephrine stimulus(GO:0071874) |
| 0.1 | 0.7 | GO:0032328 | alanine transport(GO:0032328) |
| 0.1 | 1.5 | GO:1904816 | positive regulation of protein localization to chromosome, telomeric region(GO:1904816) |
| 0.1 | 1.0 | GO:0033601 | positive regulation of mammary gland epithelial cell proliferation(GO:0033601) |
| 0.1 | 0.6 | GO:0043653 | mitochondrial fragmentation involved in apoptotic process(GO:0043653) |
| 0.1 | 0.3 | GO:0033140 | negative regulation of peptidyl-serine phosphorylation of STAT protein(GO:0033140) |
| 0.1 | 0.8 | GO:0034351 | regulation of glial cell apoptotic process(GO:0034350) negative regulation of glial cell apoptotic process(GO:0034351) |
| 0.1 | 5.8 | GO:0010501 | RNA secondary structure unwinding(GO:0010501) |
| 0.1 | 1.1 | GO:0002098 | tRNA wobble uridine modification(GO:0002098) |
| 0.1 | 0.3 | GO:0048631 | regulation of skeletal muscle tissue growth(GO:0048631) |
| 0.1 | 0.6 | GO:1904885 | beta-catenin destruction complex assembly(GO:1904885) |
| 0.1 | 1.2 | GO:0006085 | acetyl-CoA biosynthetic process(GO:0006085) |
| 0.1 | 0.7 | GO:0040032 | post-embryonic body morphogenesis(GO:0040032) |
| 0.1 | 0.4 | GO:0046504 | ether lipid biosynthetic process(GO:0008611) glycerol ether biosynthetic process(GO:0046504) ether biosynthetic process(GO:1901503) |
| 0.1 | 0.5 | GO:0086021 | SA node cell to atrial cardiac muscle cell communication by electrical coupling(GO:0086021) |
| 0.1 | 1.0 | GO:1902902 | negative regulation of autophagosome assembly(GO:1902902) |
| 0.1 | 0.7 | GO:0006983 | ER overload response(GO:0006983) |
| 0.1 | 2.5 | GO:0006750 | glutathione biosynthetic process(GO:0006750) |
| 0.1 | 1.5 | GO:0021680 | cerebellar Purkinje cell layer development(GO:0021680) |
| 0.1 | 0.6 | GO:0070358 | actin polymerization-dependent cell motility(GO:0070358) |
| 0.1 | 0.6 | GO:0098535 | de novo centriole assembly(GO:0098535) |
| 0.1 | 0.9 | GO:0019367 | fatty acid elongation, saturated fatty acid(GO:0019367) fatty acid elongation, unsaturated fatty acid(GO:0019368) fatty acid elongation, monounsaturated fatty acid(GO:0034625) fatty acid elongation, polyunsaturated fatty acid(GO:0034626) |
| 0.1 | 0.8 | GO:1902744 | negative regulation of lamellipodium assembly(GO:0010593) negative regulation of lamellipodium organization(GO:1902744) |
| 0.1 | 0.8 | GO:0007000 | nucleolus organization(GO:0007000) |
| 0.1 | 1.8 | GO:1904776 | regulation of protein localization to cell cortex(GO:1904776) positive regulation of protein localization to cell cortex(GO:1904778) |
| 0.1 | 1.8 | GO:0070816 | phosphorylation of RNA polymerase II C-terminal domain(GO:0070816) |
| 0.1 | 0.3 | GO:0009257 | 10-formyltetrahydrofolate biosynthetic process(GO:0009257) |
| 0.1 | 1.8 | GO:0003334 | keratinocyte development(GO:0003334) |
| 0.1 | 0.2 | GO:1904237 | regulation of substrate-dependent cell migration, cell attachment to substrate(GO:1904235) positive regulation of substrate-dependent cell migration, cell attachment to substrate(GO:1904237) |
| 0.1 | 0.5 | GO:0042866 | pyruvate biosynthetic process(GO:0042866) |
| 0.1 | 0.5 | GO:0009446 | putrescine biosynthetic process(GO:0009446) |
| 0.1 | 0.2 | GO:0033685 | negative regulation of luteinizing hormone secretion(GO:0033685) |
| 0.1 | 1.3 | GO:0006020 | inositol metabolic process(GO:0006020) |
| 0.1 | 3.0 | GO:0035774 | positive regulation of insulin secretion involved in cellular response to glucose stimulus(GO:0035774) |
| 0.1 | 1.5 | GO:0071361 | cellular response to ethanol(GO:0071361) |
| 0.1 | 1.0 | GO:2000675 | negative regulation of type B pancreatic cell apoptotic process(GO:2000675) |
| 0.1 | 1.3 | GO:0008283 | cell proliferation(GO:0008283) |
| 0.1 | 0.3 | GO:0006438 | valyl-tRNA aminoacylation(GO:0006438) |
| 0.1 | 0.8 | GO:0033211 | adiponectin-activated signaling pathway(GO:0033211) |
| 0.1 | 1.1 | GO:0007213 | G-protein coupled acetylcholine receptor signaling pathway(GO:0007213) |
| 0.1 | 0.9 | GO:0010839 | negative regulation of keratinocyte proliferation(GO:0010839) |
| 0.1 | 1.3 | GO:0016024 | CDP-diacylglycerol biosynthetic process(GO:0016024) |
| 0.1 | 0.5 | GO:0090309 | positive regulation of methylation-dependent chromatin silencing(GO:0090309) |
| 0.1 | 0.2 | GO:0072086 | specification of loop of Henle identity(GO:0072086) pattern specification involved in metanephros development(GO:0072268) |
| 0.1 | 1.5 | GO:0006646 | phosphatidylethanolamine biosynthetic process(GO:0006646) |
| 0.1 | 0.7 | GO:0000012 | single strand break repair(GO:0000012) |
| 0.1 | 1.4 | GO:0051639 | actin filament network formation(GO:0051639) |
| 0.1 | 0.7 | GO:0018230 | peptidyl-L-cysteine S-palmitoylation(GO:0018230) peptidyl-S-diacylglycerol-L-cysteine biosynthetic process from peptidyl-cysteine(GO:0018231) |
| 0.0 | 0.3 | GO:1900827 | positive regulation of cell communication by electrical coupling(GO:0010650) maintenance of protein location in membrane(GO:0072658) maintenance of protein location in plasma membrane(GO:0072660) positive regulation of membrane depolarization during cardiac muscle cell action potential(GO:1900827) |
| 0.0 | 1.1 | GO:0051382 | kinetochore assembly(GO:0051382) |
| 0.0 | 0.9 | GO:0051044 | positive regulation of membrane protein ectodomain proteolysis(GO:0051044) |
| 0.0 | 1.9 | GO:0000027 | ribosomal large subunit assembly(GO:0000027) |
| 0.0 | 0.6 | GO:0009414 | response to water deprivation(GO:0009414) |
| 0.0 | 0.5 | GO:0032096 | negative regulation of response to food(GO:0032096) negative regulation of appetite(GO:0032099) |
| 0.0 | 0.7 | GO:0030422 | production of siRNA involved in RNA interference(GO:0030422) |
| 0.0 | 0.6 | GO:0045046 | protein import into peroxisome membrane(GO:0045046) |
| 0.0 | 0.8 | GO:0009086 | methionine biosynthetic process(GO:0009086) |
| 0.0 | 1.0 | GO:0034975 | protein folding in endoplasmic reticulum(GO:0034975) |
| 0.0 | 2.3 | GO:0005980 | glycogen catabolic process(GO:0005980) |
| 0.0 | 0.1 | GO:0018171 | peptidyl-cysteine oxidation(GO:0018171) |
| 0.0 | 0.2 | GO:0042264 | peptidyl-aspartic acid hydroxylation(GO:0042264) |
| 0.0 | 0.6 | GO:0007030 | Golgi organization(GO:0007030) |
| 0.0 | 2.1 | GO:0031122 | cytoplasmic microtubule organization(GO:0031122) |
| 0.0 | 0.2 | GO:0048312 | intracellular distribution of mitochondria(GO:0048312) |
| 0.0 | 0.6 | GO:0006878 | cellular copper ion homeostasis(GO:0006878) |
| 0.0 | 1.6 | GO:0090140 | regulation of mitochondrial fission(GO:0090140) |
| 0.0 | 0.6 | GO:0071447 | cellular response to hydroperoxide(GO:0071447) |
| 0.0 | 0.7 | GO:0030575 | nuclear body organization(GO:0030575) |
| 0.0 | 0.8 | GO:0070987 | error-free translesion synthesis(GO:0070987) |
| 0.0 | 1.4 | GO:0010738 | regulation of protein kinase A signaling(GO:0010738) |
| 0.0 | 1.0 | GO:0072189 | ureter development(GO:0072189) |
| 0.0 | 3.5 | GO:0042771 | intrinsic apoptotic signaling pathway in response to DNA damage by p53 class mediator(GO:0042771) |
| 0.0 | 1.1 | GO:0034243 | regulation of transcription elongation from RNA polymerase II promoter(GO:0034243) |
| 0.0 | 0.8 | GO:0002710 | negative regulation of T cell mediated immunity(GO:0002710) |
| 0.0 | 3.0 | GO:0001895 | retina homeostasis(GO:0001895) |
| 0.0 | 3.7 | GO:0016266 | O-glycan processing(GO:0016266) |
| 0.0 | 0.6 | GO:0015871 | choline transport(GO:0015871) |
| 0.0 | 0.4 | GO:0031119 | tRNA pseudouridine synthesis(GO:0031119) |
| 0.0 | 0.4 | GO:0038145 | macrophage colony-stimulating factor signaling pathway(GO:0038145) |
| 0.0 | 0.5 | GO:0006782 | protoporphyrinogen IX biosynthetic process(GO:0006782) |
| 0.0 | 0.9 | GO:0032012 | regulation of ARF protein signal transduction(GO:0032012) |
| 0.0 | 0.6 | GO:0014870 | response to muscle inactivity(GO:0014870) |
| 0.0 | 0.5 | GO:0006089 | lactate metabolic process(GO:0006089) |
| 0.0 | 4.5 | GO:0006334 | nucleosome assembly(GO:0006334) |
| 0.0 | 2.1 | GO:0002755 | MyD88-dependent toll-like receptor signaling pathway(GO:0002755) |
| 0.0 | 0.6 | GO:0070831 | basement membrane assembly(GO:0070831) |
| 0.0 | 0.3 | GO:1903054 | negative regulation of extracellular matrix organization(GO:1903054) |
| 0.0 | 0.6 | GO:0030517 | negative regulation of axon extension(GO:0030517) |
| 0.0 | 0.1 | GO:1990164 | histone H2A phosphorylation(GO:1990164) |
| 0.0 | 0.1 | GO:2000672 | negative regulation of motor neuron apoptotic process(GO:2000672) |
| 0.0 | 0.3 | GO:1903071 | positive regulation of ER-associated ubiquitin-dependent protein catabolic process(GO:1903071) |
| 0.0 | 0.3 | GO:0038003 | opioid receptor signaling pathway(GO:0038003) |
| 0.0 | 0.3 | GO:1903416 | response to glycoside(GO:1903416) |
| 0.0 | 0.3 | GO:2000059 | negative regulation of protein ubiquitination involved in ubiquitin-dependent protein catabolic process(GO:2000059) |
| 0.0 | 0.2 | GO:0097167 | circadian regulation of translation(GO:0097167) |
| 0.0 | 0.8 | GO:0043968 | histone H2A acetylation(GO:0043968) |
| 0.0 | 1.0 | GO:0070884 | regulation of calcineurin-NFAT signaling cascade(GO:0070884) |
| 0.0 | 1.7 | GO:0018196 | peptidyl-asparagine modification(GO:0018196) protein N-linked glycosylation via asparagine(GO:0018279) |
| 0.0 | 0.4 | GO:1904714 | regulation of chaperone-mediated autophagy(GO:1904714) |
| 0.0 | 0.7 | GO:0070584 | mitochondrion morphogenesis(GO:0070584) |
| 0.0 | 0.1 | GO:0032264 | IMP salvage(GO:0032264) |
| 0.0 | 1.4 | GO:0071431 | tRNA export from nucleus(GO:0006409) tRNA-containing ribonucleoprotein complex export from nucleus(GO:0071431) |
| 0.0 | 2.1 | GO:0006027 | glycosaminoglycan catabolic process(GO:0006027) |
| 0.0 | 0.5 | GO:0043457 | regulation of cellular respiration(GO:0043457) |
| 0.0 | 0.9 | GO:0070911 | global genome nucleotide-excision repair(GO:0070911) |
| 0.0 | 1.4 | GO:0006270 | DNA replication initiation(GO:0006270) |
| 0.0 | 0.0 | GO:0090024 | negative regulation of granulocyte chemotaxis(GO:0071623) negative regulation of neutrophil chemotaxis(GO:0090024) negative regulation of neutrophil migration(GO:1902623) |
| 0.0 | 0.9 | GO:0061099 | negative regulation of protein tyrosine kinase activity(GO:0061099) |
| 0.0 | 0.2 | GO:0061178 | insulin secretion involved in cellular response to glucose stimulus(GO:0035773) regulation of insulin secretion involved in cellular response to glucose stimulus(GO:0061178) |
| 0.0 | 0.3 | GO:0009128 | purine nucleoside monophosphate catabolic process(GO:0009128) |
| 0.0 | 0.3 | GO:0032310 | prostaglandin secretion(GO:0032310) |
| 0.0 | 0.6 | GO:0031146 | SCF-dependent proteasomal ubiquitin-dependent protein catabolic process(GO:0031146) |
| 0.0 | 1.0 | GO:0000387 | spliceosomal snRNP assembly(GO:0000387) |
| 0.0 | 0.6 | GO:0051560 | mitochondrial calcium ion homeostasis(GO:0051560) |
| 0.0 | 0.1 | GO:2001023 | regulation of response to drug(GO:2001023) |
| 0.0 | 1.5 | GO:0021762 | substantia nigra development(GO:0021762) |
| 0.0 | 0.1 | GO:0035093 | spermatogenesis, exchange of chromosomal proteins(GO:0035093) |
| 0.0 | 0.3 | GO:0015812 | gamma-aminobutyric acid transport(GO:0015812) |
| 0.0 | 0.1 | GO:0009256 | 10-formyltetrahydrofolate metabolic process(GO:0009256) 10-formyltetrahydrofolate catabolic process(GO:0009258) |
| 0.0 | 2.9 | GO:2001237 | negative regulation of extrinsic apoptotic signaling pathway(GO:2001237) |
| 0.0 | 1.3 | GO:0006306 | DNA alkylation(GO:0006305) DNA methylation(GO:0006306) |
| 0.0 | 0.3 | GO:0006607 | NLS-bearing protein import into nucleus(GO:0006607) |
| 0.0 | 0.6 | GO:0000154 | rRNA modification(GO:0000154) |
| 0.0 | 0.4 | GO:0044804 | nucleophagy(GO:0044804) |
| 0.0 | 0.9 | GO:0006699 | bile acid biosynthetic process(GO:0006699) |
| 0.0 | 0.6 | GO:0036260 | 7-methylguanosine mRNA capping(GO:0006370) 7-methylguanosine RNA capping(GO:0009452) RNA capping(GO:0036260) |
| 0.0 | 0.1 | GO:0045346 | regulation of MHC class II biosynthetic process(GO:0045346) |
| 0.0 | 0.3 | GO:0035745 | T-helper 2 cell cytokine production(GO:0035745) |
| 0.0 | 0.2 | GO:0090160 | Golgi to lysosome transport(GO:0090160) |
| 0.0 | 3.9 | GO:0006367 | transcription initiation from RNA polymerase II promoter(GO:0006367) |
| 0.0 | 0.3 | GO:0071294 | cellular response to zinc ion(GO:0071294) |
| 0.0 | 1.5 | GO:0002455 | humoral immune response mediated by circulating immunoglobulin(GO:0002455) |
| 0.0 | 2.6 | GO:0002576 | platelet degranulation(GO:0002576) |
| 0.0 | 0.2 | GO:0006451 | selenocysteine incorporation(GO:0001514) translational readthrough(GO:0006451) |
| 0.0 | 0.2 | GO:0006568 | tryptophan metabolic process(GO:0006568) |
| 0.0 | 0.0 | GO:1902938 | regulation of intracellular calcium activated chloride channel activity(GO:1902938) |
| 0.0 | 0.2 | GO:0048026 | positive regulation of mRNA splicing, via spliceosome(GO:0048026) |
| 0.0 | 3.3 | GO:0008360 | regulation of cell shape(GO:0008360) |
| 0.0 | 0.2 | GO:0002440 | production of molecular mediator of immune response(GO:0002440) |
| 0.0 | 0.1 | GO:0010457 | centriole-centriole cohesion(GO:0010457) |
| 0.0 | 0.3 | GO:0007018 | microtubule-based movement(GO:0007018) |
| 0.0 | 0.4 | GO:0007099 | centriole replication(GO:0007099) |
| 0.0 | 0.6 | GO:0043086 | negative regulation of catalytic activity(GO:0043086) |
| 0.0 | 0.0 | GO:0072287 | metanephric distal tubule morphogenesis(GO:0072287) |
| 0.0 | 0.8 | GO:0030032 | lamellipodium assembly(GO:0030032) |
| 0.0 | 0.1 | GO:0071344 | diphosphate metabolic process(GO:0071344) |
Gene overrepresentation in cellular_component category:
| Log-likelihood per target | Total log-likelihood | Term | Description |
|---|---|---|---|
| 0.7 | 4.5 | GO:0034388 | Pwp2p-containing subcomplex of 90S preribosome(GO:0034388) |
| 0.7 | 6.8 | GO:0070552 | BRISC complex(GO:0070552) |
| 0.7 | 4.7 | GO:0098575 | lumenal side of lysosomal membrane(GO:0098575) |
| 0.6 | 5.1 | GO:0046696 | lipopolysaccharide receptor complex(GO:0046696) |
| 0.4 | 2.7 | GO:1905202 | 3-methylcrotonyl-CoA carboxylase complex, mitochondrial(GO:0002169) methylcrotonoyl-CoA carboxylase complex(GO:1905202) |
| 0.4 | 1.2 | GO:0009346 | citrate lyase complex(GO:0009346) |
| 0.4 | 1.1 | GO:1990723 | cytoplasmic periphery of the nuclear pore complex(GO:1990723) |
| 0.4 | 2.3 | GO:0008537 | proteasome activator complex(GO:0008537) |
| 0.3 | 1.3 | GO:0070939 | Dsl1p complex(GO:0070939) |
| 0.3 | 3.0 | GO:0000127 | transcription factor TFIIIC complex(GO:0000127) |
| 0.3 | 3.5 | GO:0098560 | cytoplasmic side of late endosome membrane(GO:0098560) |
| 0.3 | 3.1 | GO:0031465 | Cul4B-RING E3 ubiquitin ligase complex(GO:0031465) |
| 0.3 | 1.9 | GO:0009331 | glycerol-3-phosphate dehydrogenase complex(GO:0009331) |
| 0.3 | 1.3 | GO:0097362 | MCM8-MCM9 complex(GO:0097362) |
| 0.2 | 0.6 | GO:0034455 | t-UTP complex(GO:0034455) |
| 0.2 | 0.8 | GO:0031084 | BLOC-2 complex(GO:0031084) |
| 0.2 | 7.6 | GO:0016581 | NuRD complex(GO:0016581) CHD-type complex(GO:0090545) |
| 0.2 | 2.9 | GO:0005869 | dynactin complex(GO:0005869) |
| 0.2 | 0.3 | GO:0030686 | 90S preribosome(GO:0030686) |
| 0.2 | 1.8 | GO:0000439 | core TFIIH complex(GO:0000439) |
| 0.1 | 1.8 | GO:0070761 | pre-snoRNP complex(GO:0070761) |
| 0.1 | 0.6 | GO:0016533 | cyclin-dependent protein kinase 5 holoenzyme complex(GO:0016533) |
| 0.1 | 0.6 | GO:0005967 | mitochondrial pyruvate dehydrogenase complex(GO:0005967) |
| 0.1 | 1.6 | GO:0005786 | signal recognition particle, endoplasmic reticulum targeting(GO:0005786) |
| 0.1 | 3.6 | GO:0016281 | eukaryotic translation initiation factor 4F complex(GO:0016281) |
| 0.1 | 0.1 | GO:0005853 | eukaryotic translation elongation factor 1 complex(GO:0005853) |
| 0.1 | 0.5 | GO:1902912 | pyruvate kinase complex(GO:1902912) |
| 0.1 | 1.8 | GO:0097470 | ribbon synapse(GO:0097470) |
| 0.1 | 0.6 | GO:0032144 | 4-aminobutyrate transaminase complex(GO:0032144) |
| 0.1 | 0.6 | GO:0005606 | laminin-1 complex(GO:0005606) laminin-11 complex(GO:0043260) |
| 0.1 | 5.6 | GO:0016592 | mediator complex(GO:0016592) |
| 0.1 | 0.6 | GO:0098536 | deuterosome(GO:0098536) |
| 0.1 | 1.0 | GO:0097504 | Gemini of coiled bodies(GO:0097504) |
| 0.1 | 2.1 | GO:0016580 | Sin3 complex(GO:0016580) |
| 0.1 | 0.6 | GO:0033655 | host cell cytoplasm(GO:0030430) host cell cytoplasm part(GO:0033655) |
| 0.1 | 0.6 | GO:0034751 | aryl hydrocarbon receptor complex(GO:0034751) |
| 0.1 | 7.0 | GO:0012507 | ER to Golgi transport vesicle membrane(GO:0012507) |
| 0.1 | 1.7 | GO:0005671 | Ada2/Gcn5/Ada3 transcription activator complex(GO:0005671) |
| 0.1 | 0.6 | GO:0044294 | dendritic growth cone(GO:0044294) |
| 0.1 | 7.9 | GO:0005637 | nuclear inner membrane(GO:0005637) |
| 0.1 | 0.8 | GO:0072487 | MSL complex(GO:0072487) |
| 0.1 | 0.4 | GO:0098574 | cytoplasmic side of lysosomal membrane(GO:0098574) |
| 0.1 | 1.1 | GO:0042405 | nuclear inclusion body(GO:0042405) |
| 0.1 | 1.0 | GO:0072546 | ER membrane protein complex(GO:0072546) |
| 0.1 | 0.5 | GO:0001740 | Barr body(GO:0001740) |
| 0.1 | 0.4 | GO:0032444 | activin responsive factor complex(GO:0032444) |
| 0.1 | 1.8 | GO:0014731 | spectrin-associated cytoskeleton(GO:0014731) |
| 0.1 | 0.3 | GO:0030981 | cortical microtubule cytoskeleton(GO:0030981) |
| 0.1 | 0.4 | GO:1990682 | CSF1-CSF1R complex(GO:1990682) |
| 0.1 | 0.4 | GO:0005658 | alpha DNA polymerase:primase complex(GO:0005658) |
| 0.1 | 1.5 | GO:0001527 | microfibril(GO:0001527) fibril(GO:0043205) |
| 0.1 | 3.1 | GO:0000307 | cyclin-dependent protein kinase holoenzyme complex(GO:0000307) |
| 0.1 | 1.1 | GO:0000940 | condensed chromosome outer kinetochore(GO:0000940) |
| 0.1 | 0.9 | GO:0097025 | lateral loop(GO:0043219) MPP7-DLG1-LIN7 complex(GO:0097025) |
| 0.1 | 1.1 | GO:0097227 | sperm annulus(GO:0097227) |
| 0.1 | 0.3 | GO:1990037 | Lewy body core(GO:1990037) |
| 0.1 | 0.4 | GO:0034274 | Atg12-Atg5-Atg16 complex(GO:0034274) |
| 0.0 | 0.6 | GO:0030688 | preribosome, small subunit precursor(GO:0030688) |
| 0.0 | 0.9 | GO:0005652 | nuclear lamina(GO:0005652) |
| 0.0 | 1.5 | GO:0008074 | guanylate cyclase complex, soluble(GO:0008074) |
| 0.0 | 0.8 | GO:0005845 | mRNA cap binding complex(GO:0005845) RNA cap binding complex(GO:0034518) |
| 0.0 | 0.4 | GO:1990812 | growth cone filopodium(GO:1990812) |
| 0.0 | 2.6 | GO:0008180 | COP9 signalosome(GO:0008180) |
| 0.0 | 0.7 | GO:0070578 | RISC-loading complex(GO:0070578) |
| 0.0 | 1.1 | GO:0010369 | chromocenter(GO:0010369) |
| 0.0 | 0.5 | GO:0043203 | axon hillock(GO:0043203) |
| 0.0 | 0.2 | GO:0089701 | U2AF(GO:0089701) |
| 0.0 | 0.5 | GO:0002199 | zona pellucida receptor complex(GO:0002199) |
| 0.0 | 7.3 | GO:0034399 | nuclear periphery(GO:0034399) |
| 0.0 | 0.7 | GO:0002178 | palmitoyltransferase complex(GO:0002178) |
| 0.0 | 0.7 | GO:0005736 | DNA-directed RNA polymerase I complex(GO:0005736) |
| 0.0 | 0.2 | GO:0001652 | granular component(GO:0001652) |
| 0.0 | 0.3 | GO:0031080 | nuclear pore outer ring(GO:0031080) |
| 0.0 | 0.6 | GO:0000153 | cytoplasmic ubiquitin ligase complex(GO:0000153) |
| 0.0 | 1.0 | GO:0044322 | endoplasmic reticulum quality control compartment(GO:0044322) |
| 0.0 | 4.0 | GO:0005796 | Golgi lumen(GO:0005796) |
| 0.0 | 6.0 | GO:0001650 | fibrillar center(GO:0001650) |
| 0.0 | 0.1 | GO:0097058 | CRLF-CLCF1 complex(GO:0097058) |
| 0.0 | 2.1 | GO:0000118 | histone deacetylase complex(GO:0000118) |
| 0.0 | 0.1 | GO:0097543 | ciliary inversin compartment(GO:0097543) |
| 0.0 | 0.9 | GO:0005921 | gap junction(GO:0005921) |
| 0.0 | 0.1 | GO:0045323 | interleukin-1 receptor complex(GO:0045323) |
| 0.0 | 26.5 | GO:0005730 | nucleolus(GO:0005730) |
| 0.0 | 5.7 | GO:0005741 | mitochondrial outer membrane(GO:0005741) |
| 0.0 | 0.6 | GO:0031231 | integral component of peroxisomal membrane(GO:0005779) intrinsic component of peroxisomal membrane(GO:0031231) |
| 0.0 | 0.3 | GO:0031088 | platelet dense granule membrane(GO:0031088) |
| 0.0 | 0.9 | GO:0009925 | basal plasma membrane(GO:0009925) |
| 0.0 | 0.3 | GO:0001673 | male germ cell nucleus(GO:0001673) |
| 0.0 | 0.2 | GO:0032541 | cortical endoplasmic reticulum(GO:0032541) |
| 0.0 | 0.8 | GO:0005770 | late endosome(GO:0005770) |
| 0.0 | 0.7 | GO:0009295 | nucleoid(GO:0009295) mitochondrial nucleoid(GO:0042645) |
| 0.0 | 0.6 | GO:0031092 | platelet alpha granule membrane(GO:0031092) |
| 0.0 | 1.5 | GO:0030118 | clathrin coat(GO:0030118) |
| 0.0 | 0.2 | GO:0005577 | fibrinogen complex(GO:0005577) |
| 0.0 | 0.4 | GO:0043235 | receptor complex(GO:0043235) |
| 0.0 | 0.3 | GO:0017146 | NMDA selective glutamate receptor complex(GO:0017146) |
| 0.0 | 1.3 | GO:0016234 | inclusion body(GO:0016234) |
| 0.0 | 0.4 | GO:0071011 | precatalytic spliceosome(GO:0071011) |
| 0.0 | 0.5 | GO:0090544 | BAF-type complex(GO:0090544) |
| 0.0 | 1.0 | GO:0002102 | podosome(GO:0002102) |
| 0.0 | 1.7 | GO:0042641 | actomyosin(GO:0042641) |
| 0.0 | 0.2 | GO:0097433 | dense body(GO:0097433) |
| 0.0 | 4.7 | GO:0005874 | microtubule(GO:0005874) |
| 0.0 | 3.6 | GO:0005819 | spindle(GO:0005819) |
| 0.0 | 0.3 | GO:0005890 | sodium:potassium-exchanging ATPase complex(GO:0005890) |
| 0.0 | 0.1 | GO:0005952 | cAMP-dependent protein kinase complex(GO:0005952) |
| 0.0 | 0.0 | GO:0002133 | polycystin complex(GO:0002133) |
| 0.0 | 0.8 | GO:0010494 | cytoplasmic stress granule(GO:0010494) |
Gene overrepresentation in molecular_function category:
| Log-likelihood per target | Total log-likelihood | Term | Description |
|---|---|---|---|
| 0.9 | 2.7 | GO:0015130 | mevalonate transmembrane transporter activity(GO:0015130) |
| 0.9 | 5.1 | GO:0034186 | apolipoprotein A-I binding(GO:0034186) |
| 0.8 | 2.3 | GO:0098770 | FBXO family protein binding(GO:0098770) |
| 0.7 | 3.6 | GO:0102008 | cytosolic dipeptidase activity(GO:0102008) |
| 0.7 | 6.8 | GO:0004372 | glycine hydroxymethyltransferase activity(GO:0004372) threonine aldolase activity(GO:0004793) L-allo-threonine aldolase activity(GO:0008732) |
| 0.7 | 5.3 | GO:0044547 | DNA topoisomerase binding(GO:0044547) |
| 0.6 | 1.9 | GO:0004367 | glycerol-3-phosphate dehydrogenase [NAD+] activity(GO:0004367) |
| 0.5 | 1.4 | GO:0016652 | NAD(P)+ transhydrogenase activity(GO:0008746) oxidoreductase activity, acting on NAD(P)H, NAD(P) as acceptor(GO:0016652) |
| 0.4 | 2.7 | GO:0004485 | methylcrotonoyl-CoA carboxylase activity(GO:0004485) |
| 0.4 | 1.3 | GO:0004651 | polynucleotide 5'-phosphatase activity(GO:0004651) |
| 0.4 | 4.7 | GO:0055131 | C3HC4-type RING finger domain binding(GO:0055131) |
| 0.4 | 1.2 | GO:0003878 | ATP citrate synthase activity(GO:0003878) |
| 0.4 | 5.7 | GO:0015187 | glycine transmembrane transporter activity(GO:0015187) |
| 0.4 | 1.5 | GO:0004461 | lactose synthase activity(GO:0004461) |
| 0.3 | 1.7 | GO:0005462 | UDP-N-acetylglucosamine transmembrane transporter activity(GO:0005462) |
| 0.3 | 0.9 | GO:0003842 | 1-pyrroline-5-carboxylate dehydrogenase activity(GO:0003842) |
| 0.3 | 2.1 | GO:0004741 | [pyruvate dehydrogenase (lipoamide)] phosphatase activity(GO:0004741) |
| 0.3 | 0.8 | GO:0043849 | Ras palmitoyltransferase activity(GO:0043849) |
| 0.3 | 1.6 | GO:0004815 | aspartate-tRNA ligase activity(GO:0004815) |
| 0.3 | 0.8 | GO:0017130 | poly(C) RNA binding(GO:0017130) |
| 0.3 | 2.3 | GO:0061133 | endopeptidase activator activity(GO:0061133) |
| 0.2 | 2.5 | GO:0055104 | ligase inhibitor activity(GO:0055104) ubiquitin ligase inhibitor activity(GO:1990948) |
| 0.2 | 1.5 | GO:0008195 | phosphatidate phosphatase activity(GO:0008195) |
| 0.2 | 1.4 | GO:0052654 | branched-chain-amino-acid transaminase activity(GO:0004084) L-leucine transaminase activity(GO:0052654) L-valine transaminase activity(GO:0052655) L-isoleucine transaminase activity(GO:0052656) |
| 0.2 | 1.6 | GO:0005047 | signal recognition particle binding(GO:0005047) |
| 0.2 | 1.1 | GO:0008532 | N-acetyllactosaminide beta-1,3-N-acetylglucosaminyltransferase activity(GO:0008532) |
| 0.2 | 1.6 | GO:0004614 | phosphoglucomutase activity(GO:0004614) |
| 0.2 | 2.0 | GO:0038051 | glucocorticoid receptor activity(GO:0004883) glucocorticoid-activated RNA polymerase II transcription factor binding transcription factor activity(GO:0038051) |
| 0.2 | 0.6 | GO:1904713 | beta-catenin destruction complex binding(GO:1904713) |
| 0.2 | 0.8 | GO:0004031 | aldehyde oxidase activity(GO:0004031) |
| 0.2 | 1.8 | GO:0030267 | hydroxypyruvate reductase activity(GO:0016618) glyoxylate reductase (NADP) activity(GO:0030267) |
| 0.2 | 0.6 | GO:0016534 | cyclin-dependent protein kinase 5 activator activity(GO:0016534) |
| 0.2 | 2.3 | GO:0097322 | 7SK snRNA binding(GO:0097322) |
| 0.2 | 0.6 | GO:0042134 | rRNA primary transcript binding(GO:0042134) |
| 0.2 | 4.6 | GO:0045028 | G-protein coupled nucleotide receptor activity(GO:0001608) G-protein coupled purinergic nucleotide receptor activity(GO:0045028) |
| 0.2 | 2.8 | GO:0000182 | rDNA binding(GO:0000182) |
| 0.2 | 1.0 | GO:0019776 | Atg8 ligase activity(GO:0019776) |
| 0.2 | 1.5 | GO:0030023 | extracellular matrix constituent conferring elasticity(GO:0030023) |
| 0.2 | 1.3 | GO:0033857 | diphosphoinositol-pentakisphosphate kinase activity(GO:0033857) |
| 0.2 | 6.8 | GO:0008139 | nuclear localization sequence binding(GO:0008139) |
| 0.2 | 0.5 | GO:0004326 | tetrahydrofolylpolyglutamate synthase activity(GO:0004326) dihydrofolate synthase activity(GO:0008841) |
| 0.2 | 1.7 | GO:0060002 | plus-end directed microfilament motor activity(GO:0060002) |
| 0.1 | 0.6 | GO:0001884 | pyrimidine nucleoside binding(GO:0001884) UTP binding(GO:0002134) sulfonylurea receptor binding(GO:0017098) pyrimidine ribonucleoside binding(GO:0032551) |
| 0.1 | 0.6 | GO:0004740 | pyruvate dehydrogenase (acetyl-transferring) kinase activity(GO:0004740) |
| 0.1 | 1.0 | GO:0008597 | calcium-dependent protein serine/threonine phosphatase regulator activity(GO:0008597) |
| 0.1 | 1.1 | GO:0016300 | tRNA (uracil) methyltransferase activity(GO:0016300) |
| 0.1 | 3.1 | GO:0097602 | cullin family protein binding(GO:0097602) |
| 0.1 | 0.7 | GO:0070259 | tyrosyl-DNA phosphodiesterase activity(GO:0070259) |
| 0.1 | 11.6 | GO:0031491 | nucleosome binding(GO:0031491) |
| 0.1 | 2.9 | GO:0008353 | RNA polymerase II carboxy-terminal domain kinase activity(GO:0008353) |
| 0.1 | 0.5 | GO:0042781 | 3'-tRNA processing endoribonuclease activity(GO:0042781) |
| 0.1 | 0.6 | GO:0047298 | 4-aminobutyrate transaminase activity(GO:0003867) succinate-semialdehyde dehydrogenase binding(GO:0032145) (S)-3-amino-2-methylpropionate transaminase activity(GO:0047298) |
| 0.1 | 2.6 | GO:0008190 | eukaryotic initiation factor 4E binding(GO:0008190) |
| 0.1 | 1.1 | GO:0008172 | S-methyltransferase activity(GO:0008172) |
| 0.1 | 0.7 | GO:0023025 | MHC class Ib protein complex binding(GO:0023025) MHC class Ib protein binding, via antigen binding groove(GO:0023030) |
| 0.1 | 2.9 | GO:0034450 | ubiquitin-ubiquitin ligase activity(GO:0034450) |
| 0.1 | 0.8 | GO:0004699 | calcium-independent protein kinase C activity(GO:0004699) |
| 0.1 | 0.8 | GO:0032557 | pyrimidine ribonucleotide binding(GO:0032557) |
| 0.1 | 1.1 | GO:0004687 | myosin light chain kinase activity(GO:0004687) |
| 0.1 | 0.8 | GO:0051022 | GDP-dissociation inhibitor binding(GO:0051021) Rho GDP-dissociation inhibitor binding(GO:0051022) |
| 0.1 | 0.3 | GO:0031877 | somatostatin receptor binding(GO:0031877) |
| 0.1 | 0.8 | GO:0004844 | uracil DNA N-glycosylase activity(GO:0004844) deaminated base DNA N-glycosylase activity(GO:0097506) |
| 0.1 | 1.3 | GO:0004532 | 3'-5'-exoribonuclease activity(GO:0000175) exoribonuclease activity(GO:0004532) exoribonuclease activity, producing 5'-phosphomonoesters(GO:0016896) |
| 0.1 | 0.3 | GO:0031871 | proteinase activated receptor binding(GO:0031871) |
| 0.1 | 0.6 | GO:0052845 | endopolyphosphatase activity(GO:0000298) diphosphoinositol-polyphosphate diphosphatase activity(GO:0008486) bis(5'-adenosyl)-hexaphosphatase activity(GO:0034431) bis(5'-adenosyl)-pentaphosphatase activity(GO:0034432) inositol diphosphate tetrakisphosphate diphosphatase activity(GO:0052840) inositol bisdiphosphate tetrakisphosphate diphosphatase activity(GO:0052841) inositol diphosphate pentakisphosphate diphosphatase activity(GO:0052842) inositol-1-diphosphate-2,3,4,5,6-pentakisphosphate diphosphatase activity(GO:0052843) inositol-3-diphosphate-1,2,4,5,6-pentakisphosphate diphosphatase activity(GO:0052844) inositol-5-diphosphate-1,2,3,4,6-pentakisphosphate diphosphatase activity(GO:0052845) inositol-1,5-bisdiphosphate-2,3,4,6-tetrakisphosphate 1-diphosphatase activity(GO:0052846) inositol-1,5-bisdiphosphate-2,3,4,6-tetrakisphosphate 5-diphosphatase activity(GO:0052847) inositol-3,5-bisdiphosphate-2,3,4,6-tetrakisphosphate 5-diphosphatase activity(GO:0052848) |
| 0.1 | 1.5 | GO:0001094 | TFIID-class transcription factor binding(GO:0001094) |
| 0.1 | 0.6 | GO:0039552 | RIG-I binding(GO:0039552) |
| 0.1 | 1.2 | GO:0031386 | protein tag(GO:0031386) |
| 0.1 | 0.6 | GO:0005119 | smoothened binding(GO:0005119) |
| 0.1 | 1.0 | GO:0010859 | calcium-dependent cysteine-type endopeptidase inhibitor activity(GO:0010859) |
| 0.1 | 0.5 | GO:0030144 | alpha-1,6-mannosylglycoprotein 6-beta-N-acetylglucosaminyltransferase activity(GO:0030144) |
| 0.1 | 0.3 | GO:0004530 | deoxyribonuclease I activity(GO:0004530) |
| 0.1 | 0.5 | GO:0004743 | pyruvate kinase activity(GO:0004743) |
| 0.1 | 2.0 | GO:0015095 | magnesium ion transmembrane transporter activity(GO:0015095) |
| 0.1 | 0.4 | GO:0005011 | macrophage colony-stimulating factor receptor activity(GO:0005011) |
| 0.1 | 1.4 | GO:0032395 | MHC class II receptor activity(GO:0032395) |
| 0.1 | 4.1 | GO:0070840 | dynein complex binding(GO:0070840) |
| 0.1 | 3.1 | GO:0004653 | polypeptide N-acetylgalactosaminyltransferase activity(GO:0004653) |
| 0.1 | 0.5 | GO:0086020 | gap junction channel activity involved in SA node cell-atrial cardiac muscle cell electrical coupling(GO:0086020) |
| 0.1 | 0.6 | GO:0008174 | mRNA methyltransferase activity(GO:0008174) |
| 0.1 | 0.3 | GO:0016404 | 15-hydroxyprostaglandin dehydrogenase (NAD+) activity(GO:0016404) |
| 0.1 | 0.6 | GO:0009374 | biotin carboxylase activity(GO:0004075) biotin binding(GO:0009374) |
| 0.1 | 0.6 | GO:0070883 | pre-miRNA binding(GO:0070883) |
| 0.1 | 3.5 | GO:0031624 | ubiquitin conjugating enzyme binding(GO:0031624) |
| 0.1 | 0.8 | GO:0008020 | G-protein coupled photoreceptor activity(GO:0008020) |
| 0.1 | 4.4 | GO:0003899 | DNA-directed RNA polymerase activity(GO:0003899) |
| 0.1 | 0.5 | GO:0008508 | bile acid:sodium symporter activity(GO:0008508) |
| 0.1 | 0.9 | GO:0097016 | L27 domain binding(GO:0097016) |
| 0.1 | 0.3 | GO:0004329 | formate-tetrahydrofolate ligase activity(GO:0004329) |
| 0.1 | 2.5 | GO:0005086 | ARF guanyl-nucleotide exchange factor activity(GO:0005086) |
| 0.1 | 2.6 | GO:0070530 | K63-linked polyubiquitin binding(GO:0070530) |
| 0.1 | 0.6 | GO:0004749 | ribose phosphate diphosphokinase activity(GO:0004749) |
| 0.1 | 2.1 | GO:0016805 | dipeptidase activity(GO:0016805) |
| 0.1 | 0.7 | GO:0090599 | alpha-glucosidase activity(GO:0090599) |
| 0.1 | 0.2 | GO:0004597 | peptide-aspartate beta-dioxygenase activity(GO:0004597) |
| 0.1 | 2.1 | GO:0050750 | low-density lipoprotein particle receptor binding(GO:0050750) |
| 0.1 | 0.3 | GO:0004832 | valine-tRNA ligase activity(GO:0004832) |
| 0.1 | 1.6 | GO:0004725 | protein tyrosine phosphatase activity(GO:0004725) |
| 0.1 | 2.2 | GO:0008536 | Ran GTPase binding(GO:0008536) |
| 0.1 | 0.4 | GO:0016413 | O-acetyltransferase activity(GO:0016413) |
| 0.1 | 0.3 | GO:0000179 | rRNA (adenine-N6,N6-)-dimethyltransferase activity(GO:0000179) |
| 0.1 | 0.2 | GO:0097158 | pre-mRNA intronic pyrimidine-rich binding(GO:0097158) |
| 0.0 | 1.8 | GO:0046965 | retinoid X receptor binding(GO:0046965) |
| 0.0 | 2.1 | GO:0051959 | dynein light intermediate chain binding(GO:0051959) |
| 0.0 | 0.7 | GO:0051430 | corticotropin-releasing hormone receptor 1 binding(GO:0051430) |
| 0.0 | 0.2 | GO:0004995 | tachykinin receptor activity(GO:0004995) |
| 0.0 | 1.8 | GO:0005545 | 1-phosphatidylinositol binding(GO:0005545) |
| 0.0 | 1.5 | GO:0004383 | guanylate cyclase activity(GO:0004383) |
| 0.0 | 0.9 | GO:0003688 | DNA replication origin binding(GO:0003688) |
| 0.0 | 2.8 | GO:0048487 | beta-tubulin binding(GO:0048487) |
| 0.0 | 1.3 | GO:0003841 | 1-acylglycerol-3-phosphate O-acyltransferase activity(GO:0003841) |
| 0.0 | 1.5 | GO:0005337 | nucleoside transmembrane transporter activity(GO:0005337) |
| 0.0 | 0.3 | GO:0004800 | thyroxine 5'-deiodinase activity(GO:0004800) |
| 0.0 | 1.1 | GO:0031683 | G-protein beta/gamma-subunit complex binding(GO:0031683) |
| 0.0 | 1.2 | GO:0051371 | muscle alpha-actinin binding(GO:0051371) |
| 0.0 | 1.0 | GO:0102391 | decanoate--CoA ligase activity(GO:0102391) |
| 0.0 | 0.5 | GO:0016634 | oxidoreductase activity, acting on the CH-CH group of donors, oxygen as acceptor(GO:0016634) |
| 0.0 | 0.3 | GO:0015185 | gamma-aminobutyric acid:sodium symporter activity(GO:0005332) gamma-aminobutyric acid transmembrane transporter activity(GO:0015185) |
| 0.0 | 1.0 | GO:0034237 | protein kinase A regulatory subunit binding(GO:0034237) |
| 0.0 | 1.4 | GO:0070064 | proline-rich region binding(GO:0070064) |
| 0.0 | 2.0 | GO:0051539 | 4 iron, 4 sulfur cluster binding(GO:0051539) |
| 0.0 | 0.9 | GO:0042043 | neurexin family protein binding(GO:0042043) |
| 0.0 | 0.8 | GO:0008253 | 5'-nucleotidase activity(GO:0008253) |
| 0.0 | 1.1 | GO:0030296 | protein tyrosine kinase activator activity(GO:0030296) |
| 0.0 | 0.5 | GO:0008526 | phosphatidylinositol transporter activity(GO:0008526) |
| 0.0 | 3.3 | GO:0008186 | ATP-dependent RNA helicase activity(GO:0004004) RNA-dependent ATPase activity(GO:0008186) |
| 0.0 | 0.4 | GO:0008179 | adenylate cyclase binding(GO:0008179) |
| 0.0 | 2.2 | GO:0004864 | protein phosphatase inhibitor activity(GO:0004864) |
| 0.0 | 2.8 | GO:0004402 | histone acetyltransferase activity(GO:0004402) |
| 0.0 | 0.4 | GO:0051425 | PTB domain binding(GO:0051425) |
| 0.0 | 0.3 | GO:1990226 | histone methyltransferase binding(GO:1990226) |
| 0.0 | 0.3 | GO:0004985 | opioid receptor activity(GO:0004985) |
| 0.0 | 0.8 | GO:0004659 | prenyltransferase activity(GO:0004659) |
| 0.0 | 0.7 | GO:0048027 | mRNA 5'-UTR binding(GO:0048027) |
| 0.0 | 0.3 | GO:0004459 | L-lactate dehydrogenase activity(GO:0004459) |
| 0.0 | 0.2 | GO:0030628 | pre-mRNA 3'-splice site binding(GO:0030628) |
| 0.0 | 1.1 | GO:0043027 | cysteine-type endopeptidase inhibitor activity involved in apoptotic process(GO:0043027) |
| 0.0 | 0.3 | GO:1990239 | steroid hormone binding(GO:1990239) |
| 0.0 | 1.9 | GO:0035064 | methylated histone binding(GO:0035064) |
| 0.0 | 0.7 | GO:0000993 | RNA polymerase II core binding(GO:0000993) |
| 0.0 | 0.1 | GO:0008503 | benzodiazepine receptor activity(GO:0008503) |
| 0.0 | 0.7 | GO:0016881 | acid-amino acid ligase activity(GO:0016881) |
| 0.0 | 2.4 | GO:0000979 | RNA polymerase II core promoter sequence-specific DNA binding(GO:0000979) |
| 0.0 | 0.8 | GO:0030159 | receptor signaling complex scaffold activity(GO:0030159) |
| 0.0 | 0.4 | GO:0005522 | profilin binding(GO:0005522) |
| 0.0 | 0.5 | GO:0051537 | 2 iron, 2 sulfur cluster binding(GO:0051537) |
| 0.0 | 0.9 | GO:0015248 | sterol transporter activity(GO:0015248) |
| 0.0 | 2.2 | GO:0004386 | helicase activity(GO:0004386) |
| 0.0 | 0.3 | GO:0003906 | DNA-(apurinic or apyrimidinic site) lyase activity(GO:0003906) |
| 0.0 | 0.4 | GO:0009982 | pseudouridine synthase activity(GO:0009982) |
| 0.0 | 0.8 | GO:0001972 | retinoic acid binding(GO:0001972) |
| 0.0 | 0.1 | GO:0034584 | piRNA binding(GO:0034584) |
| 0.0 | 0.7 | GO:0005035 | tumor necrosis factor-activated receptor activity(GO:0005031) death receptor activity(GO:0005035) |
| 0.0 | 0.1 | GO:0016155 | formyltetrahydrofolate dehydrogenase activity(GO:0016155) |
| 0.0 | 0.7 | GO:0008188 | neuropeptide receptor activity(GO:0008188) |
| 0.0 | 0.8 | GO:0030676 | Rac guanyl-nucleotide exchange factor activity(GO:0030676) |
| 0.0 | 0.3 | GO:0016813 | hydrolase activity, acting on carbon-nitrogen (but not peptide) bonds, in linear amidines(GO:0016813) |
| 0.0 | 1.4 | GO:0031490 | chromatin DNA binding(GO:0031490) |
| 0.0 | 3.6 | GO:0005200 | structural constituent of cytoskeleton(GO:0005200) |
| 0.0 | 0.1 | GO:0005127 | ciliary neurotrophic factor receptor binding(GO:0005127) |
| 0.0 | 0.0 | GO:0004878 | complement component C5a receptor activity(GO:0004878) |
| 0.0 | 0.1 | GO:0001665 | alpha-N-acetylgalactosaminide alpha-2,6-sialyltransferase activity(GO:0001665) |
| 0.0 | 0.1 | GO:0016742 | hydroxymethyl-, formyl- and related transferase activity(GO:0016742) |
| 0.0 | 0.1 | GO:0047623 | AMP deaminase activity(GO:0003876) adenosine-phosphate deaminase activity(GO:0047623) |
| 0.0 | 0.1 | GO:0000990 | transcription factor activity, core RNA polymerase binding(GO:0000990) |
| 0.0 | 1.3 | GO:0051082 | unfolded protein binding(GO:0051082) |
| 0.0 | 0.4 | GO:0030331 | estrogen receptor binding(GO:0030331) |
| 0.0 | 0.2 | GO:0052629 | phosphatidylinositol-3,5-bisphosphate 3-phosphatase activity(GO:0052629) |
| 0.0 | 0.5 | GO:1990841 | promoter-specific chromatin binding(GO:1990841) |
| 0.0 | 0.2 | GO:0042834 | peptidoglycan binding(GO:0042834) |
| 0.0 | 0.2 | GO:0005131 | growth hormone receptor binding(GO:0005131) |
| 0.0 | 0.1 | GO:0000155 | phosphorelay sensor kinase activity(GO:0000155) |
| 0.0 | 0.8 | GO:0008235 | metalloexopeptidase activity(GO:0008235) |
| 0.0 | 0.9 | GO:0001784 | phosphotyrosine binding(GO:0001784) |
| 0.0 | 0.5 | GO:0044183 | protein binding involved in protein folding(GO:0044183) |
| 0.0 | 0.4 | GO:0043015 | gamma-tubulin binding(GO:0043015) |
| 0.0 | 6.3 | GO:0045296 | cadherin binding(GO:0045296) |
| 0.0 | 0.2 | GO:0035613 | RNA stem-loop binding(GO:0035613) |
| 0.0 | 0.3 | GO:0030515 | snoRNA binding(GO:0030515) |
| 0.0 | 0.1 | GO:0004572 | mannosyl-oligosaccharide 1,3-1,6-alpha-mannosidase activity(GO:0004572) |
Gene overrepresentation in C2:CP category:
| Log-likelihood per target | Total log-likelihood | Term | Description |
|---|---|---|---|
| 0.1 | 3.5 | PID P38 GAMMA DELTA PATHWAY | Signaling mediated by p38-gamma and p38-delta |
| 0.1 | 5.1 | PID TOLL ENDOGENOUS PATHWAY | Endogenous TLR signaling |
| 0.1 | 8.4 | PID AURORA B PATHWAY | Aurora B signaling |
| 0.1 | 10.0 | PID CMYB PATHWAY | C-MYB transcription factor network |
| 0.1 | 2.3 | PID ARF 3PATHWAY | Arf1 pathway |
| 0.1 | 9.2 | PID HDAC CLASSI PATHWAY | Signaling events mediated by HDAC Class I |
| 0.1 | 0.6 | SA G2 AND M PHASES | Cdc25 activates the cdc2/cyclin B complex to induce the G2/M transition. |
| 0.1 | 0.5 | PID WNT NONCANONICAL PATHWAY | Noncanonical Wnt signaling pathway |
| 0.1 | 3.7 | PID NCADHERIN PATHWAY | N-cadherin signaling events |
| 0.1 | 1.1 | PID FOXM1 PATHWAY | FOXM1 transcription factor network |
| 0.0 | 1.6 | PID LPA4 PATHWAY | LPA4-mediated signaling events |
| 0.0 | 1.1 | PID S1P S1P4 PATHWAY | S1P4 pathway |
| 0.0 | 1.3 | PID CIRCADIAN PATHWAY | Circadian rhythm pathway |
| 0.0 | 1.8 | PID RETINOIC ACID PATHWAY | Retinoic acid receptors-mediated signaling |
| 0.0 | 2.4 | NABA PROTEOGLYCANS | Genes encoding proteoglycans |
| 0.0 | 1.5 | PID SMAD2 3PATHWAY | Regulation of cytoplasmic and nuclear SMAD2/3 signaling |
| 0.0 | 2.0 | PID HDAC CLASSII PATHWAY | Signaling events mediated by HDAC Class II |
| 0.0 | 2.1 | PID SYNDECAN 2 PATHWAY | Syndecan-2-mediated signaling events |
| 0.0 | 1.6 | PID MAPK TRK PATHWAY | Trk receptor signaling mediated by the MAPK pathway |
| 0.0 | 2.5 | PID PLK1 PATHWAY | PLK1 signaling events |
| 0.0 | 1.8 | PID HNF3A PATHWAY | FOXA1 transcription factor network |
| 0.0 | 1.4 | SIG REGULATION OF THE ACTIN CYTOSKELETON BY RHO GTPASES | Genes related to regulation of the actin cytoskeleton |
| 0.0 | 2.7 | PID P53 REGULATION PATHWAY | p53 pathway |
| 0.0 | 2.9 | PID ERA GENOMIC PATHWAY | Validated nuclear estrogen receptor alpha network |
| 0.0 | 0.6 | PID INTEGRIN4 PATHWAY | Alpha6 beta4 integrin-ligand interactions |
| 0.0 | 3.1 | PID CDC42 PATHWAY | CDC42 signaling events |
| 0.0 | 1.8 | PID NFAT 3PATHWAY | Role of Calcineurin-dependent NFAT signaling in lymphocytes |
| 0.0 | 0.8 | PID INTEGRIN5 PATHWAY | Beta5 beta6 beta7 and beta8 integrin cell surface interactions |
| 0.0 | 1.0 | PID A6B1 A6B4 INTEGRIN PATHWAY | a6b1 and a6b4 Integrin signaling |
| 0.0 | 1.0 | PID ATM PATHWAY | ATM pathway |
| 0.0 | 0.6 | PID HEDGEHOG GLI PATHWAY | Hedgehog signaling events mediated by Gli proteins |
| 0.0 | 0.2 | ST JAK STAT PATHWAY | Jak-STAT Pathway |
| 0.0 | 0.7 | ST PHOSPHOINOSITIDE 3 KINASE PATHWAY | PI3K Pathway |
| 0.0 | 1.5 | PID VEGFR1 2 PATHWAY | Signaling events mediated by VEGFR1 and VEGFR2 |
| 0.0 | 1.8 | PID MYC ACTIV PATHWAY | Validated targets of C-MYC transcriptional activation |
| 0.0 | 0.3 | PID FRA PATHWAY | Validated transcriptional targets of AP1 family members Fra1 and Fra2 |
| 0.0 | 1.0 | PID ERBB1 DOWNSTREAM PATHWAY | ErbB1 downstream signaling |
| 0.0 | 0.4 | PID MET PATHWAY | Signaling events mediated by Hepatocyte Growth Factor Receptor (c-Met) |
Gene overrepresentation in C2:CP:REACTOME category:
| Log-likelihood per target | Total log-likelihood | Term | Description |
|---|---|---|---|
| 0.2 | 4.6 | REACTOME P2Y RECEPTORS | Genes involved in P2Y receptors |
| 0.2 | 5.8 | REACTOME PYRUVATE METABOLISM | Genes involved in Pyruvate metabolism |
| 0.1 | 2.1 | REACTOME IRAK2 MEDIATED ACTIVATION OF TAK1 COMPLEX UPON TLR7 8 OR 9 STIMULATION | Genes involved in IRAK2 mediated activation of TAK1 complex upon TLR7/8 or 9 stimulation |
| 0.1 | 4.9 | REACTOME FORMATION OF INCISION COMPLEX IN GG NER | Genes involved in Formation of incision complex in GG-NER |
| 0.1 | 5.6 | REACTOME GABA SYNTHESIS RELEASE REUPTAKE AND DEGRADATION | Genes involved in GABA synthesis, release, reuptake and degradation |
| 0.1 | 3.5 | REACTOME BRANCHED CHAIN AMINO ACID CATABOLISM | Genes involved in Branched-chain amino acid catabolism |
| 0.1 | 1.6 | REACTOME CDC6 ASSOCIATION WITH THE ORC ORIGIN COMPLEX | Genes involved in CDC6 association with the ORC:origin complex |
| 0.1 | 5.0 | REACTOME SULFUR AMINO ACID METABOLISM | Genes involved in Sulfur amino acid metabolism |
| 0.1 | 2.6 | REACTOME MTORC1 MEDIATED SIGNALLING | Genes involved in mTORC1-mediated signalling |
| 0.1 | 6.3 | REACTOME AMINO ACID TRANSPORT ACROSS THE PLASMA MEMBRANE | Genes involved in Amino acid transport across the plasma membrane |
| 0.1 | 2.7 | REACTOME CHYLOMICRON MEDIATED LIPID TRANSPORT | Genes involved in Chylomicron-mediated lipid transport |
| 0.1 | 2.9 | REACTOME G1 S SPECIFIC TRANSCRIPTION | Genes involved in G1/S-Specific Transcription |
| 0.1 | 2.6 | REACTOME ADENYLATE CYCLASE INHIBITORY PATHWAY | Genes involved in Adenylate cyclase inhibitory pathway |
| 0.1 | 3.9 | REACTOME FORMATION OF TUBULIN FOLDING INTERMEDIATES BY CCT TRIC | Genes involved in Formation of tubulin folding intermediates by CCT/TriC |
| 0.1 | 1.5 | REACTOME FORMATION OF ATP BY CHEMIOSMOTIC COUPLING | Genes involved in Formation of ATP by chemiosmotic coupling |
| 0.1 | 3.6 | REACTOME SYNTHESIS OF PA | Genes involved in Synthesis of PA |
| 0.1 | 1.8 | REACTOME RNA POL I TRANSCRIPTION INITIATION | Genes involved in RNA Polymerase I Transcription Initiation |
| 0.1 | 3.0 | REACTOME RNA POL III TRANSCRIPTION INITIATION FROM TYPE 2 PROMOTER | Genes involved in RNA Polymerase III Transcription Initiation From Type 2 Promoter |
| 0.1 | 1.9 | REACTOME MRNA CAPPING | Genes involved in mRNA Capping |
| 0.1 | 2.3 | REACTOME GLYCOGEN BREAKDOWN GLYCOGENOLYSIS | Genes involved in Glycogen breakdown (glycogenolysis) |
| 0.1 | 1.5 | REACTOME PURINE RIBONUCLEOSIDE MONOPHOSPHATE BIOSYNTHESIS | Genes involved in Purine ribonucleoside monophosphate biosynthesis |
| 0.1 | 3.1 | REACTOME FATTY ACYL COA BIOSYNTHESIS | Genes involved in Fatty Acyl-CoA Biosynthesis |
| 0.1 | 0.7 | REACTOME TRIGLYCERIDE BIOSYNTHESIS | Genes involved in Triglyceride Biosynthesis |
| 0.1 | 0.4 | REACTOME PEPTIDE CHAIN ELONGATION | Genes involved in Peptide chain elongation |
| 0.1 | 2.7 | REACTOME KERATAN SULFATE BIOSYNTHESIS | Genes involved in Keratan sulfate biosynthesis |
| 0.1 | 3.6 | REACTOME TRANSPORT OF VITAMINS NUCLEOSIDES AND RELATED MOLECULES | Genes involved in Transport of vitamins, nucleosides, and related molecules |
| 0.1 | 0.8 | REACTOME TRANSCRIPTIONAL REGULATION OF WHITE ADIPOCYTE DIFFERENTIATION | Genes involved in Transcriptional Regulation of White Adipocyte Differentiation |
| 0.0 | 1.0 | REACTOME THE NLRP3 INFLAMMASOME | Genes involved in The NLRP3 inflammasome |
| 0.0 | 4.0 | REACTOME METABOLISM OF NON CODING RNA | Genes involved in Metabolism of non-coding RNA |
| 0.0 | 1.4 | REACTOME ACTIVATION OF RAC | Genes involved in Activation of Rac |
| 0.0 | 0.9 | REACTOME IONOTROPIC ACTIVITY OF KAINATE RECEPTORS | Genes involved in Ionotropic activity of Kainate Receptors |
| 0.0 | 2.7 | REACTOME BMAL1 CLOCK NPAS2 ACTIVATES CIRCADIAN EXPRESSION | Genes involved in BMAL1:CLOCK/NPAS2 Activates Circadian Expression |
| 0.0 | 1.7 | REACTOME DOUBLE STRAND BREAK REPAIR | Genes involved in Double-Strand Break Repair |
| 0.0 | 3.0 | REACTOME NOTCH1 INTRACELLULAR DOMAIN REGULATES TRANSCRIPTION | Genes involved in NOTCH1 Intracellular Domain Regulates Transcription |
| 0.0 | 2.2 | REACTOME TRANSPORT TO THE GOLGI AND SUBSEQUENT MODIFICATION | Genes involved in Transport to the Golgi and subsequent modification |
| 0.0 | 2.9 | REACTOME NETRIN1 SIGNALING | Genes involved in Netrin-1 signaling |
| 0.0 | 1.1 | REACTOME MITOCHONDRIAL TRNA AMINOACYLATION | Genes involved in Mitochondrial tRNA aminoacylation |
| 0.0 | 1.6 | REACTOME SRP DEPENDENT COTRANSLATIONAL PROTEIN TARGETING TO MEMBRANE | Genes involved in SRP-dependent cotranslational protein targeting to membrane |
| 0.0 | 1.1 | REACTOME PRE NOTCH TRANSCRIPTION AND TRANSLATION | Genes involved in Pre-NOTCH Transcription and Translation |
| 0.0 | 0.6 | REACTOME G2 M DNA DAMAGE CHECKPOINT | Genes involved in G2/M DNA damage checkpoint |
| 0.0 | 1.0 | REACTOME NONSENSE MEDIATED DECAY ENHANCED BY THE EXON JUNCTION COMPLEX | Genes involved in Nonsense Mediated Decay Enhanced by the Exon Junction Complex |
| 0.0 | 0.5 | REACTOME BILE SALT AND ORGANIC ANION SLC TRANSPORTERS | Genes involved in Bile salt and organic anion SLC transporters |
| 0.0 | 3.0 | REACTOME O LINKED GLYCOSYLATION OF MUCINS | Genes involved in O-linked glycosylation of mucins |
| 0.0 | 3.2 | REACTOME LOSS OF NLP FROM MITOTIC CENTROSOMES | Genes involved in Loss of Nlp from mitotic centrosomes |
| 0.0 | 4.5 | REACTOME PPARA ACTIVATES GENE EXPRESSION | Genes involved in PPARA Activates Gene Expression |
| 0.0 | 0.8 | REACTOME GLUCURONIDATION | Genes involved in Glucuronidation |
| 0.0 | 1.0 | REACTOME DEADENYLATION OF MRNA | Genes involved in Deadenylation of mRNA |
| 0.0 | 0.9 | REACTOME CELL EXTRACELLULAR MATRIX INTERACTIONS | Genes involved in Cell-extracellular matrix interactions |
| 0.0 | 0.8 | REACTOME OTHER SEMAPHORIN INTERACTIONS | Genes involved in Other semaphorin interactions |
| 0.0 | 1.1 | REACTOME ERK MAPK TARGETS | Genes involved in ERK/MAPK targets |
| 0.0 | 1.2 | REACTOME VOLTAGE GATED POTASSIUM CHANNELS | Genes involved in Voltage gated Potassium channels |
| 0.0 | 1.0 | REACTOME METAL ION SLC TRANSPORTERS | Genes involved in Metal ion SLC transporters |
| 0.0 | 0.5 | REACTOME METABOLISM OF PORPHYRINS | Genes involved in Metabolism of porphyrins |
| 0.0 | 0.5 | REACTOME GAP JUNCTION ASSEMBLY | Genes involved in Gap junction assembly |
| 0.0 | 0.4 | REACTOME G ALPHA Z SIGNALLING EVENTS | Genes involved in G alpha (z) signalling events |
| 0.0 | 0.8 | REACTOME GLUCAGON SIGNALING IN METABOLIC REGULATION | Genes involved in Glucagon signaling in metabolic regulation |
| 0.0 | 0.8 | REACTOME SEMA4D IN SEMAPHORIN SIGNALING | Genes involved in Sema4D in semaphorin signaling |
| 0.0 | 0.4 | REACTOME CRMPS IN SEMA3A SIGNALING | Genes involved in CRMPs in Sema3A signaling |
| 0.0 | 0.3 | REACTOME PURINE CATABOLISM | Genes involved in Purine catabolism |
| 0.0 | 0.4 | REACTOME SIGNALING BY NODAL | Genes involved in Signaling by NODAL |
| 0.0 | 0.4 | REACTOME CITRIC ACID CYCLE TCA CYCLE | Genes involved in Citric acid cycle (TCA cycle) |
| 0.0 | 0.7 | REACTOME ANTIVIRAL MECHANISM BY IFN STIMULATED GENES | Genes involved in Antiviral mechanism by IFN-stimulated genes |
| 0.0 | 0.2 | REACTOME IL 6 SIGNALING | Genes involved in Interleukin-6 signaling |
| 0.0 | 0.4 | REACTOME CYTOSOLIC TRNA AMINOACYLATION | Genes involved in Cytosolic tRNA aminoacylation |