Project
SARS-CoV-2 Analysis Results (GEO series: GSE147507)
Navigation
Downloads
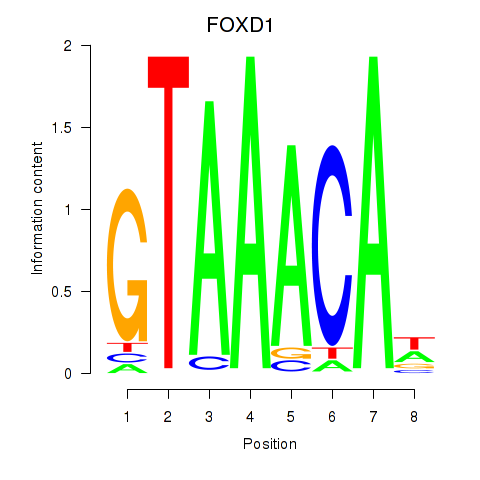
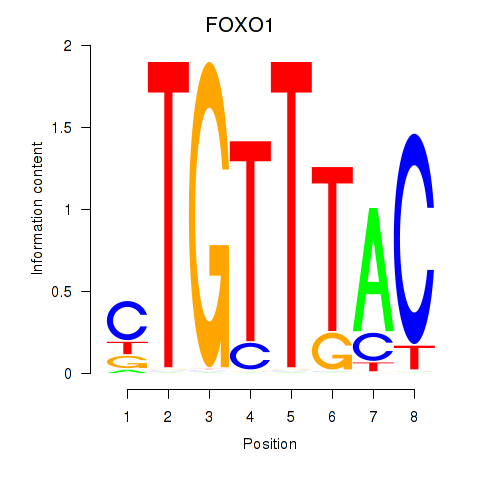
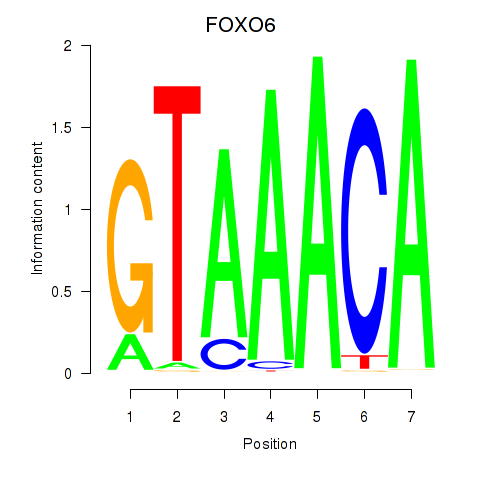
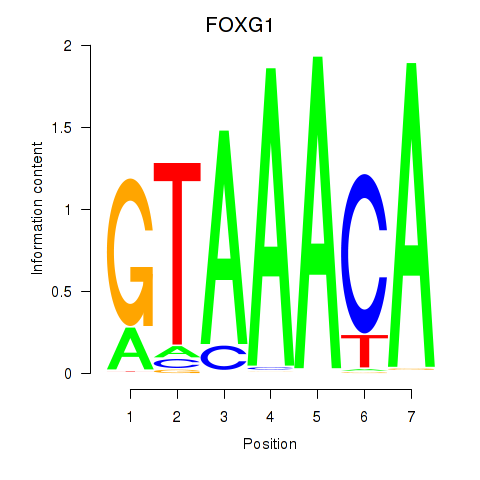
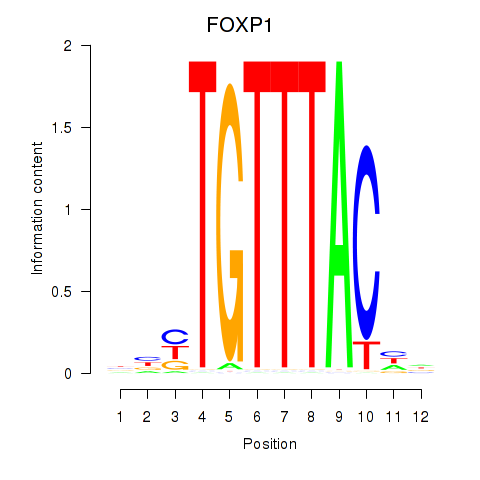
Results for FOXD1_FOXO1_FOXO6_FOXG1_FOXP1
Z-value: 1.23
Motif logo
Transcription factors associated with FOXD1_FOXO1_FOXO6_FOXG1_FOXP1
| Gene Symbol | Gene ID | Gene Info |
|---|---|---|
|
FOXD1
|
ENSG00000251493.2 | forkhead box D1 |
|
FOXO1
|
ENSG00000150907.6 | forkhead box O1 |
|
FOXO6
|
ENSG00000204060.4 | forkhead box O6 |
|
FOXG1
|
ENSG00000176165.7 | forkhead box G1 |
|
FOXP1
|
ENSG00000114861.14 | forkhead box P1 |
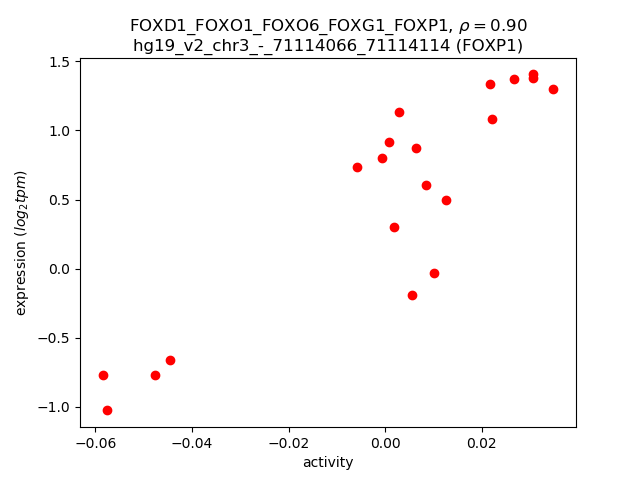
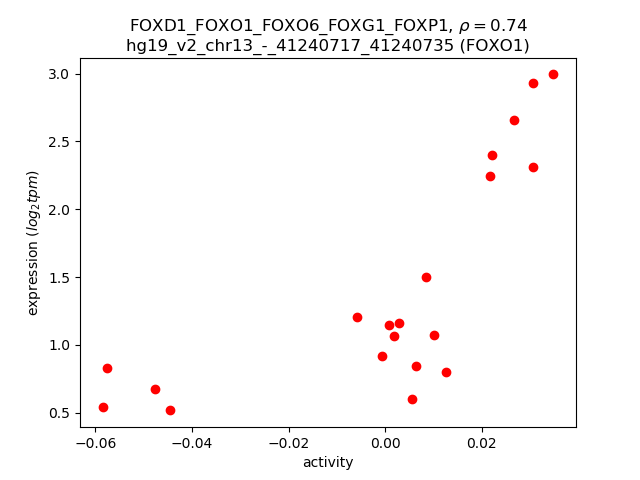
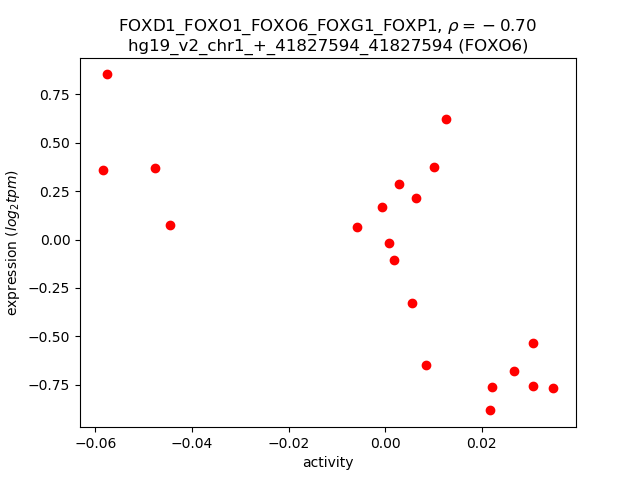
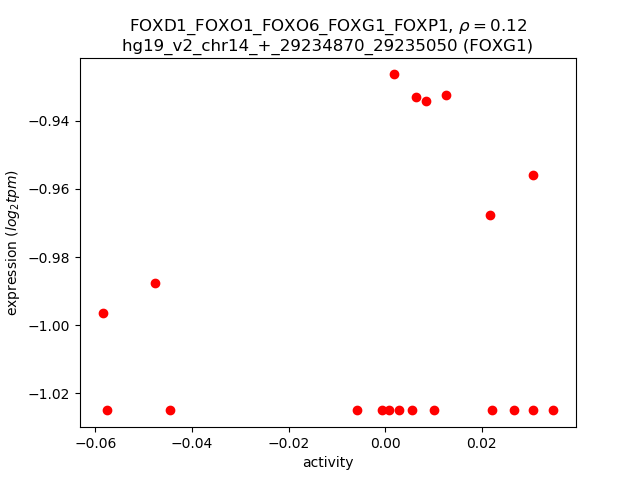
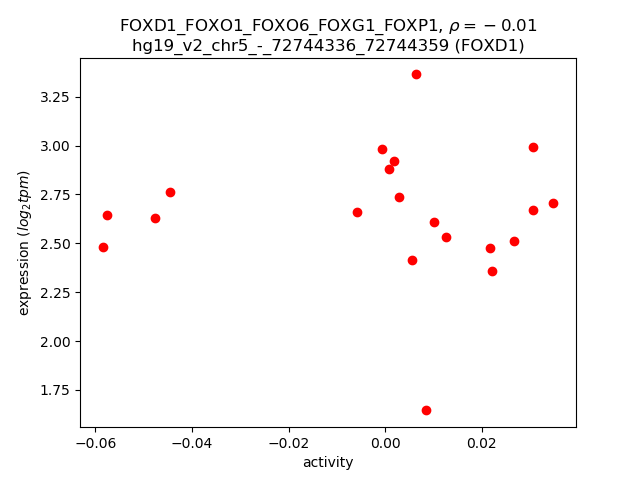
Activity-expression correlation:
| Gene | Promoter | Pearson corr. coef. | P-value | Plot |
|---|---|---|---|---|
| FOXP1 | hg19_v2_chr3_-_71114066_71114114 | 0.90 | 8.5e-08 | Click! |
| FOXO1 | hg19_v2_chr13_-_41240717_41240735 | 0.74 | 1.9e-04 | Click! |
| FOXO6 | hg19_v2_chr1_+_41827594_41827594 | -0.70 | 5.3e-04 | Click! |
| FOXG1 | hg19_v2_chr14_+_29234870_29235050 | 0.12 | 6.2e-01 | Click! |
| FOXD1 | hg19_v2_chr5_-_72744336_72744359 | -0.01 | 9.8e-01 | Click! |
Activity profile of FOXD1_FOXO1_FOXO6_FOXG1_FOXP1 motif
Sorted Z-values of FOXD1_FOXO1_FOXO6_FOXG1_FOXP1 motif
| Promoter | Log-likelihood | Transcript | Gene | Gene Info |
|---|---|---|---|---|
| chr10_+_75668916 | 6.72 |
ENST00000481390.1
|
PLAU
|
plasminogen activator, urokinase |
| chr1_+_145438469 | 6.72 |
ENST00000369317.4
|
TXNIP
|
thioredoxin interacting protein |
| chr1_-_27816556 | 6.24 |
ENST00000536657.1
|
WASF2
|
WAS protein family, member 2 |
| chr12_+_13349650 | 5.93 |
ENST00000256951.5
ENST00000431267.2 ENST00000542474.1 ENST00000544053.1 |
EMP1
|
epithelial membrane protein 1 |
| chr22_-_31688381 | 5.27 |
ENST00000487265.2
|
PIK3IP1
|
phosphoinositide-3-kinase interacting protein 1 |
| chr17_+_26662679 | 4.94 |
ENST00000578158.1
|
TNFAIP1
|
tumor necrosis factor, alpha-induced protein 1 (endothelial) |
| chr12_+_13349711 | 4.65 |
ENST00000538364.1
ENST00000396301.3 |
EMP1
|
epithelial membrane protein 1 |
| chr1_-_161337662 | 4.54 |
ENST00000367974.1
|
C1orf192
|
chromosome 1 open reading frame 192 |
| chr16_-_84150410 | 4.52 |
ENST00000569907.1
|
MBTPS1
|
membrane-bound transcription factor peptidase, site 1 |
| chr12_-_116714564 | 4.46 |
ENST00000548743.1
|
MED13L
|
mediator complex subunit 13-like |
| chr20_-_1309809 | 4.33 |
ENST00000360779.3
|
SDCBP2
|
syndecan binding protein (syntenin) 2 |
| chr17_-_8059638 | 4.21 |
ENST00000584202.1
ENST00000354903.5 ENST00000577253.1 |
PER1
|
period circadian clock 1 |
| chr5_+_72251857 | 4.20 |
ENST00000507345.2
ENST00000512348.1 ENST00000287761.6 |
FCHO2
|
FCH domain only 2 |
| chr22_-_31688431 | 3.96 |
ENST00000402249.3
ENST00000443175.1 ENST00000215912.5 ENST00000441972.1 |
PIK3IP1
|
phosphoinositide-3-kinase interacting protein 1 |
| chr1_+_116654376 | 3.92 |
ENST00000369500.3
|
MAB21L3
|
mab-21-like 3 (C. elegans) |
| chr1_+_152486950 | 3.72 |
ENST00000368790.3
|
CRCT1
|
cysteine-rich C-terminal 1 |
| chr1_-_209975494 | 3.68 |
ENST00000456314.1
|
IRF6
|
interferon regulatory factor 6 |
| chr15_-_34629922 | 3.64 |
ENST00000559484.1
ENST00000354181.3 ENST00000558589.1 ENST00000458406.2 |
SLC12A6
|
solute carrier family 12 (potassium/chloride transporter), member 6 |
| chr6_+_74405501 | 3.63 |
ENST00000437994.2
ENST00000422508.2 |
CD109
|
CD109 molecule |
| chr3_-_71179988 | 3.57 |
ENST00000491238.1
|
FOXP1
|
forkhead box P1 |
| chr15_+_101417919 | 3.53 |
ENST00000561338.1
|
ALDH1A3
|
aldehyde dehydrogenase 1 family, member A3 |
| chr15_-_34630234 | 3.51 |
ENST00000558667.1
ENST00000561120.1 ENST00000559236.1 ENST00000397702.2 |
SLC12A6
|
solute carrier family 12 (potassium/chloride transporter), member 6 |
| chr4_-_152149033 | 3.42 |
ENST00000514152.1
|
SH3D19
|
SH3 domain containing 19 |
| chr14_-_21493649 | 3.34 |
ENST00000553442.1
ENST00000555869.1 ENST00000556457.1 ENST00000397844.2 ENST00000554415.1 |
NDRG2
|
NDRG family member 2 |
| chr12_+_96588279 | 3.28 |
ENST00000552142.1
|
ELK3
|
ELK3, ETS-domain protein (SRF accessory protein 2) |
| chr5_-_16742330 | 3.24 |
ENST00000505695.1
ENST00000427430.2 |
MYO10
|
myosin X |
| chr7_+_134551583 | 3.23 |
ENST00000435928.1
|
CALD1
|
caldesmon 1 |
| chr1_-_1356628 | 3.23 |
ENST00000442470.1
ENST00000537107.1 |
ANKRD65
|
ankyrin repeat domain 65 |
| chr5_+_137673945 | 3.23 |
ENST00000513056.1
ENST00000511276.1 |
FAM53C
|
family with sequence similarity 53, member C |
| chr10_+_111985837 | 3.14 |
ENST00000393134.1
|
MXI1
|
MAX interactor 1, dimerization protein |
| chr6_+_74405804 | 3.13 |
ENST00000287097.5
|
CD109
|
CD109 molecule |
| chr11_+_13299186 | 3.04 |
ENST00000527998.1
ENST00000396441.3 ENST00000533520.1 ENST00000529825.1 ENST00000389707.4 ENST00000401424.1 ENST00000529388.1 ENST00000530357.1 ENST00000403290.1 ENST00000361003.4 ENST00000389708.3 ENST00000403510.3 ENST00000482049.1 |
ARNTL
|
aryl hydrocarbon receptor nuclear translocator-like |
| chr3_-_168865522 | 3.03 |
ENST00000464456.1
|
MECOM
|
MDS1 and EVI1 complex locus |
| chr6_+_30853002 | 2.97 |
ENST00000421124.2
ENST00000512725.1 |
DDR1
|
discoidin domain receptor tyrosine kinase 1 |
| chr1_-_1356719 | 2.94 |
ENST00000520296.1
|
ANKRD65
|
ankyrin repeat domain 65 |
| chr6_-_56707943 | 2.91 |
ENST00000370769.4
ENST00000421834.2 ENST00000312431.6 ENST00000361203.3 ENST00000523817.1 |
DST
|
dystonin |
| chr8_+_24151553 | 2.90 |
ENST00000265769.4
ENST00000540823.1 ENST00000397649.3 |
ADAM28
|
ADAM metallopeptidase domain 28 |
| chr6_-_56716686 | 2.89 |
ENST00000520645.1
|
DST
|
dystonin |
| chr14_-_69262916 | 2.88 |
ENST00000553375.1
|
ZFP36L1
|
ZFP36 ring finger protein-like 1 |
| chr1_+_24646002 | 2.87 |
ENST00000356046.2
|
GRHL3
|
grainyhead-like 3 (Drosophila) |
| chr6_-_30043539 | 2.86 |
ENST00000376751.3
ENST00000244360.6 |
RNF39
|
ring finger protein 39 |
| chr14_-_69262789 | 2.86 |
ENST00000557022.1
|
ZFP36L1
|
ZFP36 ring finger protein-like 1 |
| chr16_+_57680840 | 2.85 |
ENST00000563862.1
ENST00000564722.1 ENST00000569158.1 |
GPR56
|
G protein-coupled receptor 56 |
| chr1_+_24645865 | 2.83 |
ENST00000342072.4
|
GRHL3
|
grainyhead-like 3 (Drosophila) |
| chr5_+_137673200 | 2.82 |
ENST00000434981.2
|
FAM53C
|
family with sequence similarity 53, member C |
| chr8_-_131028869 | 2.77 |
ENST00000518283.1
ENST00000519110.1 |
FAM49B
|
family with sequence similarity 49, member B |
| chr19_-_58609570 | 2.75 |
ENST00000600845.1
ENST00000240727.6 ENST00000600897.1 ENST00000421612.2 ENST00000601063.1 ENST00000601144.1 |
ZSCAN18
|
zinc finger and SCAN domain containing 18 |
| chr10_+_63808970 | 2.74 |
ENST00000309334.5
|
ARID5B
|
AT rich interactive domain 5B (MRF1-like) |
| chr8_+_26150628 | 2.68 |
ENST00000523925.1
ENST00000315985.7 |
PPP2R2A
|
protein phosphatase 2, regulatory subunit B, alpha |
| chr21_-_35899113 | 2.68 |
ENST00000492600.1
ENST00000481448.1 ENST00000381132.2 |
RCAN1
|
regulator of calcineurin 1 |
| chr1_-_28503693 | 2.64 |
ENST00000373857.3
|
PTAFR
|
platelet-activating factor receptor |
| chr19_+_13134772 | 2.63 |
ENST00000587760.1
ENST00000585575.1 |
NFIX
|
nuclear factor I/X (CCAAT-binding transcription factor) |
| chr8_-_117886612 | 2.62 |
ENST00000520992.1
|
RAD21
|
RAD21 homolog (S. pombe) |
| chr16_-_84150392 | 2.61 |
ENST00000570012.1
|
MBTPS1
|
membrane-bound transcription factor peptidase, site 1 |
| chr1_+_203651937 | 2.60 |
ENST00000341360.2
|
ATP2B4
|
ATPase, Ca++ transporting, plasma membrane 4 |
| chr1_+_24645807 | 2.60 |
ENST00000361548.4
|
GRHL3
|
grainyhead-like 3 (Drosophila) |
| chr9_-_135819987 | 2.58 |
ENST00000298552.3
ENST00000403810.1 |
TSC1
|
tuberous sclerosis 1 |
| chr17_-_42580738 | 2.57 |
ENST00000585614.1
ENST00000591680.1 ENST00000434000.1 ENST00000588554.1 ENST00000592154.1 |
GPATCH8
|
G patch domain containing 8 |
| chr17_+_26662597 | 2.56 |
ENST00000544907.2
|
TNFAIP1
|
tumor necrosis factor, alpha-induced protein 1 (endothelial) |
| chr4_+_90032651 | 2.56 |
ENST00000603357.1
|
RP11-84C13.1
|
RP11-84C13.1 |
| chr7_-_140624499 | 2.56 |
ENST00000288602.6
|
BRAF
|
v-raf murine sarcoma viral oncogene homolog B |
| chr7_+_30174574 | 2.56 |
ENST00000409688.1
|
C7orf41
|
maturin, neural progenitor differentiation regulator homolog (Xenopus) |
| chr8_-_117886563 | 2.49 |
ENST00000519837.1
ENST00000522699.1 |
RAD21
|
RAD21 homolog (S. pombe) |
| chr1_+_24645915 | 2.47 |
ENST00000350501.5
|
GRHL3
|
grainyhead-like 3 (Drosophila) |
| chr5_-_142065612 | 2.46 |
ENST00000360966.5
ENST00000411960.1 |
FGF1
|
fibroblast growth factor 1 (acidic) |
| chr11_+_10476851 | 2.45 |
ENST00000396553.2
|
AMPD3
|
adenosine monophosphate deaminase 3 |
| chr16_+_57679859 | 2.45 |
ENST00000569494.1
ENST00000566169.1 |
GPR56
|
G protein-coupled receptor 56 |
| chr14_-_65569244 | 2.44 |
ENST00000557277.1
ENST00000556892.1 |
MAX
|
MYC associated factor X |
| chr1_+_24646263 | 2.44 |
ENST00000524724.1
|
GRHL3
|
grainyhead-like 3 (Drosophila) |
| chr5_-_40755987 | 2.41 |
ENST00000337702.4
|
TTC33
|
tetratricopeptide repeat domain 33 |
| chr16_+_4666475 | 2.40 |
ENST00000591895.1
|
MGRN1
|
mahogunin ring finger 1, E3 ubiquitin protein ligase |
| chr8_-_117886732 | 2.38 |
ENST00000517485.1
|
RAD21
|
RAD21 homolog (S. pombe) |
| chr11_+_117049910 | 2.36 |
ENST00000431081.2
ENST00000524842.1 |
SIDT2
|
SID1 transmembrane family, member 2 |
| chr4_-_111120132 | 2.35 |
ENST00000506625.1
|
ELOVL6
|
ELOVL fatty acid elongase 6 |
| chr11_+_34654011 | 2.34 |
ENST00000531794.1
|
EHF
|
ets homologous factor |
| chr5_-_64920115 | 2.33 |
ENST00000381018.3
ENST00000274327.7 |
TRIM23
|
tripartite motif containing 23 |
| chr2_-_176033066 | 2.33 |
ENST00000437522.1
|
ATF2
|
activating transcription factor 2 |
| chr14_-_36988882 | 2.33 |
ENST00000498187.2
|
NKX2-1
|
NK2 homeobox 1 |
| chr3_-_71294304 | 2.33 |
ENST00000498215.1
|
FOXP1
|
forkhead box P1 |
| chr3_-_71179699 | 2.31 |
ENST00000497355.1
|
FOXP1
|
forkhead box P1 |
| chr7_+_134576317 | 2.30 |
ENST00000424922.1
ENST00000495522.1 |
CALD1
|
caldesmon 1 |
| chr12_+_96588368 | 2.29 |
ENST00000547860.1
|
ELK3
|
ELK3, ETS-domain protein (SRF accessory protein 2) |
| chr5_-_42811986 | 2.29 |
ENST00000511224.1
ENST00000507920.1 ENST00000510965.1 |
SEPP1
|
selenoprotein P, plasma, 1 |
| chr17_+_38333263 | 2.28 |
ENST00000456989.2
ENST00000543876.1 ENST00000544503.1 ENST00000264644.6 ENST00000538884.1 |
RAPGEFL1
|
Rap guanine nucleotide exchange factor (GEF)-like 1 |
| chr9_-_115095229 | 2.27 |
ENST00000210227.4
|
PTBP3
|
polypyrimidine tract binding protein 3 |
| chr12_+_96588143 | 2.27 |
ENST00000228741.3
ENST00000547249.1 |
ELK3
|
ELK3, ETS-domain protein (SRF accessory protein 2) |
| chr1_-_27816641 | 2.26 |
ENST00000430629.2
|
WASF2
|
WAS protein family, member 2 |
| chr10_+_99400443 | 2.24 |
ENST00000370631.3
|
PI4K2A
|
phosphatidylinositol 4-kinase type 2 alpha |
| chr5_+_78532003 | 2.22 |
ENST00000396137.4
|
JMY
|
junction mediating and regulatory protein, p53 cofactor |
| chr2_+_175260514 | 2.22 |
ENST00000424069.1
ENST00000427038.1 |
SCRN3
|
secernin 3 |
| chr7_+_134464376 | 2.22 |
ENST00000454108.1
ENST00000361675.2 |
CALD1
|
caldesmon 1 |
| chr1_+_40862501 | 2.19 |
ENST00000539317.1
|
SMAP2
|
small ArfGAP2 |
| chr14_+_24584372 | 2.19 |
ENST00000559396.1
ENST00000558638.1 ENST00000561041.1 ENST00000559288.1 ENST00000558408.1 |
DCAF11
|
DDB1 and CUL4 associated factor 11 |
| chr16_+_57680811 | 2.19 |
ENST00000569101.1
|
GPR56
|
G protein-coupled receptor 56 |
| chr8_-_124553437 | 2.18 |
ENST00000517956.1
ENST00000443022.2 |
FBXO32
|
F-box protein 32 |
| chr12_-_28124903 | 2.17 |
ENST00000395872.1
ENST00000354417.3 ENST00000201015.4 |
PTHLH
|
parathyroid hormone-like hormone |
| chr11_-_85780853 | 2.15 |
ENST00000531930.1
ENST00000528398.1 |
PICALM
|
phosphatidylinositol binding clathrin assembly protein |
| chr8_+_24151620 | 2.13 |
ENST00000437154.2
|
ADAM28
|
ADAM metallopeptidase domain 28 |
| chr1_-_115301235 | 2.13 |
ENST00000525878.1
|
CSDE1
|
cold shock domain containing E1, RNA-binding |
| chr21_+_39668831 | 2.11 |
ENST00000419868.1
|
KCNJ15
|
potassium inwardly-rectifying channel, subfamily J, member 15 |
| chr6_+_108977520 | 2.11 |
ENST00000540898.1
|
FOXO3
|
forkhead box O3 |
| chr5_-_42812143 | 2.08 |
ENST00000514985.1
|
SEPP1
|
selenoprotein P, plasma, 1 |
| chr2_-_134326009 | 2.05 |
ENST00000409261.1
ENST00000409213.1 |
NCKAP5
|
NCK-associated protein 5 |
| chr3_+_50192457 | 2.04 |
ENST00000414301.1
ENST00000450338.1 |
SEMA3F
|
sema domain, immunoglobulin domain (Ig), short basic domain, secreted, (semaphorin) 3F |
| chr2_+_196521903 | 2.04 |
ENST00000541054.1
|
SLC39A10
|
solute carrier family 39 (zinc transporter), member 10 |
| chr4_-_74486217 | 2.04 |
ENST00000335049.5
ENST00000307439.5 |
RASSF6
|
Ras association (RalGDS/AF-6) domain family member 6 |
| chr4_-_74486347 | 2.04 |
ENST00000342081.3
|
RASSF6
|
Ras association (RalGDS/AF-6) domain family member 6 |
| chr15_-_34610962 | 2.02 |
ENST00000290209.5
|
SLC12A6
|
solute carrier family 12 (potassium/chloride transporter), member 6 |
| chr12_-_123187890 | 2.01 |
ENST00000328880.5
|
HCAR2
|
hydroxycarboxylic acid receptor 2 |
| chr10_-_103578162 | 1.99 |
ENST00000361464.3
ENST00000357797.5 ENST00000370094.3 |
MGEA5
|
meningioma expressed antigen 5 (hyaluronidase) |
| chr16_+_4896659 | 1.99 |
ENST00000592120.1
|
UBN1
|
ubinuclein 1 |
| chr12_-_123201337 | 1.99 |
ENST00000528880.2
|
HCAR3
|
hydroxycarboxylic acid receptor 3 |
| chr18_-_53257027 | 1.99 |
ENST00000568740.1
ENST00000564403.2 ENST00000537578.1 |
TCF4
|
transcription factor 4 |
| chr1_-_179112189 | 1.99 |
ENST00000512653.1
ENST00000344730.3 |
ABL2
|
c-abl oncogene 2, non-receptor tyrosine kinase |
| chr3_+_41236325 | 1.98 |
ENST00000426215.1
ENST00000405570.1 |
CTNNB1
|
catenin (cadherin-associated protein), beta 1, 88kDa |
| chr1_-_202927388 | 1.97 |
ENST00000426229.1
ENST00000367254.3 |
ADIPOR1
|
adiponectin receptor 1 |
| chr1_+_209878182 | 1.96 |
ENST00000367027.3
|
HSD11B1
|
hydroxysteroid (11-beta) dehydrogenase 1 |
| chr12_-_31479107 | 1.95 |
ENST00000542983.1
|
FAM60A
|
family with sequence similarity 60, member A |
| chr2_-_214016314 | 1.95 |
ENST00000434687.1
ENST00000374319.4 |
IKZF2
|
IKAROS family zinc finger 2 (Helios) |
| chr16_+_57679945 | 1.95 |
ENST00000568157.1
|
GPR56
|
G protein-coupled receptor 56 |
| chr17_-_39781054 | 1.92 |
ENST00000463128.1
|
KRT17
|
keratin 17 |
| chr5_-_131132658 | 1.91 |
ENST00000514667.1
ENST00000511848.1 ENST00000510461.1 |
CTC-432M15.3
FNIP1
|
Folliculin-interacting protein 1 folliculin interacting protein 1 |
| chr21_+_39668478 | 1.91 |
ENST00000398927.1
|
KCNJ15
|
potassium inwardly-rectifying channel, subfamily J, member 15 |
| chr1_-_207206092 | 1.90 |
ENST00000359470.5
ENST00000461135.2 |
C1orf116
|
chromosome 1 open reading frame 116 |
| chr7_-_84121858 | 1.89 |
ENST00000448879.1
|
SEMA3A
|
sema domain, immunoglobulin domain (Ig), short basic domain, secreted, (semaphorin) 3A |
| chr19_-_45909585 | 1.88 |
ENST00000593226.1
ENST00000418234.2 |
PPP1R13L
|
protein phosphatase 1, regulatory subunit 13 like |
| chr19_+_41725140 | 1.88 |
ENST00000359092.3
|
AXL
|
AXL receptor tyrosine kinase |
| chr17_-_39780819 | 1.86 |
ENST00000311208.8
|
KRT17
|
keratin 17 |
| chr7_+_90339169 | 1.85 |
ENST00000436577.2
|
CDK14
|
cyclin-dependent kinase 14 |
| chr2_+_158114051 | 1.84 |
ENST00000259056.4
|
GALNT5
|
UDP-N-acetyl-alpha-D-galactosamine:polypeptide N-acetylgalactosaminyltransferase 5 (GalNAc-T5) |
| chr12_-_46384334 | 1.83 |
ENST00000369367.3
ENST00000266589.6 ENST00000395453.2 ENST00000395454.2 |
SCAF11
|
SR-related CTD-associated factor 11 |
| chr4_-_74486109 | 1.82 |
ENST00000395777.2
|
RASSF6
|
Ras association (RalGDS/AF-6) domain family member 6 |
| chrX_-_15619076 | 1.80 |
ENST00000252519.3
|
ACE2
|
angiotensin I converting enzyme 2 |
| chr13_+_28712614 | 1.79 |
ENST00000380958.3
|
PAN3
|
PAN3 poly(A) specific ribonuclease subunit homolog (S. cerevisiae) |
| chr4_-_40632605 | 1.79 |
ENST00000514014.1
|
RBM47
|
RNA binding motif protein 47 |
| chr17_-_1508379 | 1.78 |
ENST00000412517.3
|
SLC43A2
|
solute carrier family 43 (amino acid system L transporter), member 2 |
| chr1_+_84630574 | 1.78 |
ENST00000413538.1
ENST00000417530.1 |
PRKACB
|
protein kinase, cAMP-dependent, catalytic, beta |
| chr4_-_111120334 | 1.77 |
ENST00000503885.1
|
ELOVL6
|
ELOVL fatty acid elongase 6 |
| chr12_-_28125638 | 1.76 |
ENST00000545234.1
|
PTHLH
|
parathyroid hormone-like hormone |
| chr12_-_76817036 | 1.75 |
ENST00000546946.1
|
OSBPL8
|
oxysterol binding protein-like 8 |
| chr7_-_112579673 | 1.75 |
ENST00000432572.1
|
C7orf60
|
chromosome 7 open reading frame 60 |
| chr17_-_39780634 | 1.74 |
ENST00000577817.2
|
KRT17
|
keratin 17 |
| chr3_+_107241882 | 1.74 |
ENST00000416476.2
|
BBX
|
bobby sox homolog (Drosophila) |
| chr17_-_65241281 | 1.73 |
ENST00000358691.5
ENST00000580168.1 |
HELZ
|
helicase with zinc finger |
| chr13_-_46716969 | 1.71 |
ENST00000435666.2
|
LCP1
|
lymphocyte cytosolic protein 1 (L-plastin) |
| chr8_+_128747757 | 1.70 |
ENST00000517291.1
|
MYC
|
v-myc avian myelocytomatosis viral oncogene homolog |
| chr10_+_115469134 | 1.69 |
ENST00000452490.2
|
CASP7
|
caspase 7, apoptosis-related cysteine peptidase |
| chr2_+_27665232 | 1.67 |
ENST00000543753.1
ENST00000288873.3 |
KRTCAP3
|
keratinocyte associated protein 3 |
| chr2_+_175260451 | 1.67 |
ENST00000458563.1
ENST00000409673.3 ENST00000272732.6 ENST00000435964.1 |
SCRN3
|
secernin 3 |
| chr1_+_198126209 | 1.64 |
ENST00000367383.1
|
NEK7
|
NIMA-related kinase 7 |
| chr15_-_56535464 | 1.64 |
ENST00000559447.2
ENST00000422057.1 ENST00000317318.6 ENST00000423270.1 |
RFX7
|
regulatory factor X, 7 |
| chr11_-_119999539 | 1.61 |
ENST00000541857.1
|
TRIM29
|
tripartite motif containing 29 |
| chr3_+_187930429 | 1.61 |
ENST00000420410.1
|
LPP
|
LIM domain containing preferred translocation partner in lipoma |
| chr14_-_36983034 | 1.60 |
ENST00000518529.2
|
SFTA3
|
surfactant associated 3 |
| chr11_-_119999611 | 1.60 |
ENST00000529044.1
|
TRIM29
|
tripartite motif containing 29 |
| chrX_+_146993648 | 1.60 |
ENST00000370470.1
|
FMR1
|
fragile X mental retardation 1 |
| chr11_-_102826434 | 1.59 |
ENST00000340273.4
ENST00000260302.3 |
MMP13
|
matrix metallopeptidase 13 (collagenase 3) |
| chr1_+_65730385 | 1.58 |
ENST00000263441.7
ENST00000395325.3 |
DNAJC6
|
DnaJ (Hsp40) homolog, subfamily C, member 6 |
| chr6_+_64345698 | 1.57 |
ENST00000506783.1
ENST00000481385.2 ENST00000515594.1 ENST00000494284.2 ENST00000262043.3 |
PHF3
|
PHD finger protein 3 |
| chr4_-_40632757 | 1.55 |
ENST00000511902.1
ENST00000505220.1 |
RBM47
|
RNA binding motif protein 47 |
| chr4_-_143227088 | 1.54 |
ENST00000511838.1
|
INPP4B
|
inositol polyphosphate-4-phosphatase, type II, 105kDa |
| chr8_+_21777243 | 1.53 |
ENST00000521303.1
|
XPO7
|
exportin 7 |
| chr12_-_29936731 | 1.53 |
ENST00000552618.1
ENST00000539277.1 ENST00000551659.1 |
TMTC1
|
transmembrane and tetratricopeptide repeat containing 1 |
| chr14_-_65569057 | 1.52 |
ENST00000555419.1
ENST00000341653.2 |
MAX
|
MYC associated factor X |
| chr15_-_31283618 | 1.52 |
ENST00000563714.1
|
MTMR10
|
myotubularin related protein 10 |
| chr11_-_57089774 | 1.50 |
ENST00000527207.1
|
TNKS1BP1
|
tankyrase 1 binding protein 1, 182kDa |
| chr3_-_71632894 | 1.50 |
ENST00000493089.1
|
FOXP1
|
forkhead box P1 |
| chr9_+_2159850 | 1.50 |
ENST00000416751.1
|
SMARCA2
|
SWI/SNF related, matrix associated, actin dependent regulator of chromatin, subfamily a, member 2 |
| chrX_+_135251835 | 1.49 |
ENST00000456445.1
|
FHL1
|
four and a half LIM domains 1 |
| chr1_+_179851999 | 1.49 |
ENST00000527391.1
|
TOR1AIP1
|
torsin A interacting protein 1 |
| chr1_+_111682058 | 1.49 |
ENST00000545121.1
|
CEPT1
|
choline/ethanolamine phosphotransferase 1 |
| chr1_+_3541543 | 1.48 |
ENST00000378344.2
ENST00000344579.5 |
TPRG1L
|
tumor protein p63 regulated 1-like |
| chr10_-_14050522 | 1.48 |
ENST00000342409.2
|
FRMD4A
|
FERM domain containing 4A |
| chr1_-_94079648 | 1.48 |
ENST00000370247.3
|
BCAR3
|
breast cancer anti-estrogen resistance 3 |
| chr5_-_142783365 | 1.47 |
ENST00000508760.1
|
NR3C1
|
nuclear receptor subfamily 3, group C, member 1 (glucocorticoid receptor) |
| chr6_-_131211534 | 1.46 |
ENST00000456097.2
|
EPB41L2
|
erythrocyte membrane protein band 4.1-like 2 |
| chr6_+_15401075 | 1.46 |
ENST00000541660.1
|
JARID2
|
jumonji, AT rich interactive domain 2 |
| chr8_+_128747661 | 1.45 |
ENST00000259523.6
|
MYC
|
v-myc avian myelocytomatosis viral oncogene homolog |
| chr2_+_27665289 | 1.45 |
ENST00000407293.1
|
KRTCAP3
|
keratinocyte associated protein 3 |
| chr7_+_107384142 | 1.44 |
ENST00000440859.3
|
CBLL1
|
Cbl proto-oncogene-like 1, E3 ubiquitin protein ligase |
| chr7_+_30174668 | 1.44 |
ENST00000415604.1
|
C7orf41
|
maturin, neural progenitor differentiation regulator homolog (Xenopus) |
| chr9_+_112852477 | 1.43 |
ENST00000480388.1
|
AKAP2
|
A kinase (PRKA) anchor protein 2 |
| chr20_-_43150601 | 1.43 |
ENST00000541235.1
ENST00000255175.1 ENST00000342374.4 |
SERINC3
|
serine incorporator 3 |
| chr13_-_41240717 | 1.43 |
ENST00000379561.5
|
FOXO1
|
forkhead box O1 |
| chr14_+_24584056 | 1.42 |
ENST00000561001.1
|
DCAF11
|
DDB1 and CUL4 associated factor 11 |
| chr3_+_172468505 | 1.42 |
ENST00000427830.1
ENST00000417960.1 ENST00000428567.1 ENST00000366090.2 ENST00000426894.1 |
ECT2
|
epithelial cell transforming sequence 2 oncogene |
| chr14_-_74551096 | 1.40 |
ENST00000350259.4
|
ALDH6A1
|
aldehyde dehydrogenase 6 family, member A1 |
| chr18_+_9475585 | 1.39 |
ENST00000585015.1
|
RALBP1
|
ralA binding protein 1 |
| chr5_-_150460539 | 1.38 |
ENST00000520931.1
ENST00000520695.1 ENST00000521591.1 ENST00000518977.1 |
TNIP1
|
TNFAIP3 interacting protein 1 |
| chr14_-_21493884 | 1.38 |
ENST00000556974.1
ENST00000554419.1 ENST00000298687.5 ENST00000397858.1 ENST00000360463.3 ENST00000350792.3 ENST00000397847.2 |
NDRG2
|
NDRG family member 2 |
| chr11_+_3968573 | 1.37 |
ENST00000532990.1
|
STIM1
|
stromal interaction molecule 1 |
| chr4_-_40632881 | 1.37 |
ENST00000511598.1
|
RBM47
|
RNA binding motif protein 47 |
| chr13_-_86373536 | 1.36 |
ENST00000400286.2
|
SLITRK6
|
SLIT and NTRK-like family, member 6 |
| chr3_+_50192537 | 1.36 |
ENST00000002829.3
|
SEMA3F
|
sema domain, immunoglobulin domain (Ig), short basic domain, secreted, (semaphorin) 3F |
| chr3_+_172468749 | 1.35 |
ENST00000366254.2
ENST00000415665.1 ENST00000438041.1 |
ECT2
|
epithelial cell transforming sequence 2 oncogene |
| chr4_-_69215467 | 1.33 |
ENST00000579690.1
|
YTHDC1
|
YTH domain containing 1 |
| chr11_-_46848393 | 1.33 |
ENST00000526496.1
|
CKAP5
|
cytoskeleton associated protein 5 |
| chr3_+_50192499 | 1.32 |
ENST00000413852.1
|
SEMA3F
|
sema domain, immunoglobulin domain (Ig), short basic domain, secreted, (semaphorin) 3F |
| chr2_-_74007193 | 1.32 |
ENST00000377706.4
ENST00000443070.1 ENST00000272444.3 |
DUSP11
|
dual specificity phosphatase 11 (RNA/RNP complex 1-interacting) |
| chr3_-_71114066 | 1.32 |
ENST00000485326.2
|
FOXP1
|
forkhead box P1 |
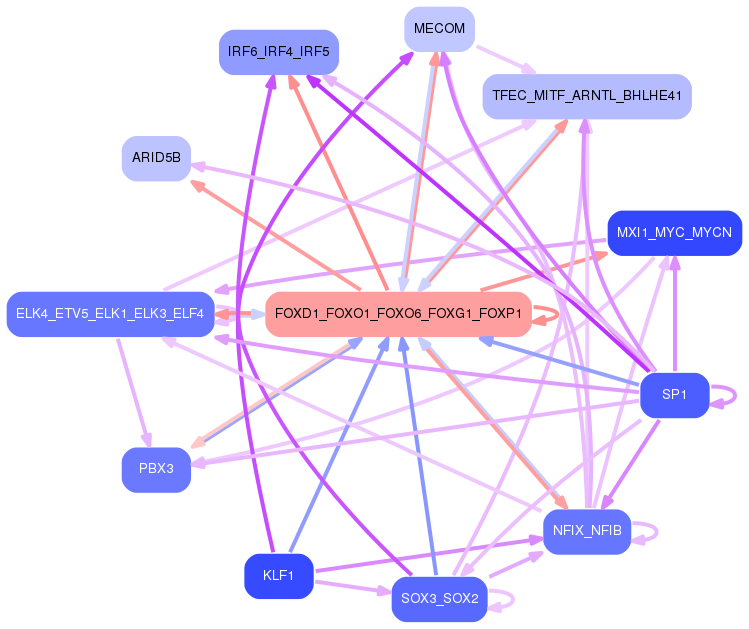
Network of associatons between targets according to the STRING database.

First level regulatory network of FOXD1_FOXO1_FOXO6_FOXG1_FOXP1
Gene Ontology Analysis
Gene overrepresentation in biological_process category:
| Log-likelihood per target | Total log-likelihood | Term | Description |
|---|---|---|---|
| 1.9 | 11.4 | GO:0032625 | interleukin-21 production(GO:0032625) interleukin-21 secretion(GO:0072619) |
| 1.8 | 9.2 | GO:0043553 | negative regulation of phosphatidylinositol 3-kinase activity(GO:0043553) |
| 1.8 | 9.2 | GO:0042539 | hypotonic salinity response(GO:0042539) cellular hypotonic salinity response(GO:0071477) |
| 1.7 | 6.7 | GO:2000097 | regulation of smooth muscle cell-matrix adhesion(GO:2000097) |
| 1.3 | 5.4 | GO:0090096 | regulation of metanephric cap mesenchymal cell proliferation(GO:0090095) positive regulation of metanephric cap mesenchymal cell proliferation(GO:0090096) |
| 1.1 | 5.7 | GO:0097403 | cellular response to raffinose(GO:0097403) response to raffinose(GO:1901545) |
| 1.1 | 8.0 | GO:0072675 | multinuclear osteoclast differentiation(GO:0072674) osteoclast fusion(GO:0072675) |
| 1.0 | 7.8 | GO:2000323 | negative regulation of glucocorticoid receptor signaling pathway(GO:2000323) |
| 0.9 | 2.7 | GO:0001544 | initiation of primordial ovarian follicle growth(GO:0001544) |
| 0.9 | 2.6 | GO:1904300 | positive regulation of neutrophil degranulation(GO:0043315) cellular response to gravity(GO:0071258) positive regulation of neutrophil activation(GO:1902565) regulation of transcytosis(GO:1904298) positive regulation of transcytosis(GO:1904300) regulation of maternal process involved in parturition(GO:1904301) positive regulation of maternal process involved in parturition(GO:1904303) response to 2-O-acetyl-1-O-hexadecyl-sn-glycero-3-phosphocholine(GO:1904316) cellular response to 2-O-acetyl-1-O-hexadecyl-sn-glycero-3-phosphocholine(GO:1904317) |
| 0.9 | 2.6 | GO:2000283 | regulation of cellular amine catabolic process(GO:0033241) negative regulation of cellular amine catabolic process(GO:0033242) negative regulation of the force of heart contraction(GO:0098736) regulation of arginine catabolic process(GO:1900081) negative regulation of arginine catabolic process(GO:1900082) regulation of citrulline biosynthetic process(GO:1903248) negative regulation of citrulline biosynthetic process(GO:1903249) negative regulation of cellular amino acid biosynthetic process(GO:2000283) |
| 0.8 | 3.4 | GO:0060166 | olfactory pit development(GO:0060166) |
| 0.8 | 2.5 | GO:1902362 | melanocyte apoptotic process(GO:1902362) |
| 0.8 | 3.9 | GO:1903615 | regulation of protein tyrosine phosphatase activity(GO:1903613) positive regulation of protein tyrosine phosphatase activity(GO:1903615) |
| 0.7 | 3.0 | GO:0032915 | positive regulation of transforming growth factor beta2 production(GO:0032915) |
| 0.7 | 2.2 | GO:0002276 | basophil activation involved in immune response(GO:0002276) |
| 0.7 | 4.2 | GO:2000301 | negative regulation of synaptic vesicle exocytosis(GO:2000301) |
| 0.6 | 1.9 | GO:0045081 | negative regulation of interleukin-10 biosynthetic process(GO:0045081) |
| 0.6 | 7.9 | GO:0045876 | positive regulation of sister chromatid cohesion(GO:0045876) |
| 0.6 | 4.1 | GO:0070966 | nuclear-transcribed mRNA catabolic process, no-go decay(GO:0070966) |
| 0.6 | 2.3 | GO:1903045 | neural crest cell migration involved in sympathetic nervous system development(GO:1903045) |
| 0.6 | 13.7 | GO:0090179 | planar cell polarity pathway involved in neural tube closure(GO:0090179) |
| 0.6 | 2.3 | GO:0002904 | positive regulation of B cell apoptotic process(GO:0002904) |
| 0.5 | 3.7 | GO:0035709 | memory T cell activation(GO:0035709) regulation of memory T cell activation(GO:2000567) positive regulation of memory T cell activation(GO:2000568) |
| 0.5 | 1.6 | GO:1990519 | pyrimidine nucleotide transport(GO:0006864) mitochondrial pyrimidine nucleotide import(GO:1990519) |
| 0.5 | 1.6 | GO:0098507 | polynucleotide 5' dephosphorylation(GO:0098507) |
| 0.5 | 2.6 | GO:0051029 | rRNA transport(GO:0051029) |
| 0.5 | 2.0 | GO:1904499 | glial cell fate determination(GO:0007403) canonical Wnt signaling pathway involved in positive regulation of cardiac outflow tract cell proliferation(GO:0061324) regulation of chromatin-mediated maintenance of transcription(GO:1904499) positive regulation of chromatin-mediated maintenance of transcription(GO:1904501) regulation of euchromatin binding(GO:1904793) |
| 0.5 | 4.7 | GO:1901166 | trunk segmentation(GO:0035290) trunk neural crest cell migration(GO:0036484) ventral trunk neural crest cell migration(GO:0036486) neural crest cell migration involved in autonomic nervous system development(GO:1901166) |
| 0.4 | 1.3 | GO:0001543 | ovarian follicle rupture(GO:0001543) |
| 0.4 | 7.0 | GO:0036500 | ATF6-mediated unfolded protein response(GO:0036500) |
| 0.4 | 1.6 | GO:1901350 | cell-cell signaling involved in cell-cell junction organization(GO:1901350) |
| 0.4 | 5.8 | GO:0008090 | retrograde axonal transport(GO:0008090) |
| 0.4 | 1.8 | GO:0003051 | angiotensin-mediated drinking behavior(GO:0003051) |
| 0.4 | 4.3 | GO:0019367 | fatty acid elongation, saturated fatty acid(GO:0019367) fatty acid elongation, unsaturated fatty acid(GO:0019368) fatty acid elongation, monounsaturated fatty acid(GO:0034625) fatty acid elongation, polyunsaturated fatty acid(GO:0034626) |
| 0.4 | 2.1 | GO:0033031 | positive regulation of neutrophil apoptotic process(GO:0033031) |
| 0.4 | 2.5 | GO:0006196 | AMP catabolic process(GO:0006196) |
| 0.3 | 1.4 | GO:0010909 | regulation of heparan sulfate proteoglycan biosynthetic process(GO:0010908) positive regulation of heparan sulfate proteoglycan biosynthetic process(GO:0010909) canonical Wnt signaling pathway involved in positive regulation of epithelial to mesenchymal transition(GO:0044334) positive regulation of proteoglycan biosynthetic process(GO:1902730) |
| 0.3 | 1.4 | GO:0035574 | histone H4-K20 demethylation(GO:0035574) |
| 0.3 | 10.1 | GO:0032060 | bleb assembly(GO:0032060) |
| 0.3 | 3.3 | GO:0097338 | response to clozapine(GO:0097338) |
| 0.3 | 6.0 | GO:0090361 | platelet-derived growth factor production(GO:0090360) regulation of platelet-derived growth factor production(GO:0090361) |
| 0.3 | 2.3 | GO:0061484 | hematopoietic stem cell homeostasis(GO:0061484) |
| 0.3 | 1.0 | GO:1903676 | regulation of cap-dependent translational initiation(GO:1903674) positive regulation of cap-dependent translational initiation(GO:1903676) |
| 0.3 | 2.6 | GO:0070358 | actin polymerization-dependent cell motility(GO:0070358) |
| 0.3 | 4.5 | GO:0071763 | nuclear membrane organization(GO:0071763) |
| 0.3 | 1.6 | GO:0042998 | positive regulation of Golgi to plasma membrane protein transport(GO:0042998) |
| 0.3 | 2.2 | GO:1902962 | regulation of metalloendopeptidase activity involved in amyloid precursor protein catabolic process(GO:1902962) negative regulation of metalloendopeptidase activity involved in amyloid precursor protein catabolic process(GO:1902963) |
| 0.3 | 1.2 | GO:0019859 | pyrimidine nucleobase catabolic process(GO:0006208) thymine catabolic process(GO:0006210) thymine metabolic process(GO:0019859) |
| 0.3 | 4.4 | GO:0033227 | dsRNA transport(GO:0033227) |
| 0.3 | 1.7 | GO:2000669 | negative regulation of dendritic cell apoptotic process(GO:2000669) |
| 0.3 | 7.1 | GO:0051798 | positive regulation of hair follicle development(GO:0051798) |
| 0.3 | 8.6 | GO:0010592 | positive regulation of lamellipodium assembly(GO:0010592) |
| 0.3 | 2.5 | GO:1901509 | regulation of endothelial tube morphogenesis(GO:1901509) |
| 0.3 | 1.6 | GO:0060005 | vestibular reflex(GO:0060005) |
| 0.3 | 0.8 | GO:0008057 | eye pigment granule organization(GO:0008057) |
| 0.3 | 1.3 | GO:0085032 | modulation of signal transduction in other organism(GO:0044501) modulation by symbiont of host signal transduction pathway(GO:0052027) modulation of signal transduction in other organism involved in symbiotic interaction(GO:0052250) modulation by symbiont of host I-kappaB kinase/NF-kappaB cascade(GO:0085032) |
| 0.3 | 1.8 | GO:0070417 | cellular response to cold(GO:0070417) |
| 0.3 | 1.0 | GO:0019074 | viral genome packaging(GO:0019072) viral RNA genome packaging(GO:0019074) |
| 0.3 | 0.8 | GO:1904017 | cellular response to Thyroglobulin triiodothyronine(GO:1904017) |
| 0.2 | 1.0 | GO:0048698 | negative regulation of collateral sprouting in absence of injury(GO:0048698) |
| 0.2 | 1.2 | GO:0043335 | protein unfolding(GO:0043335) |
| 0.2 | 1.2 | GO:1904693 | midbrain morphogenesis(GO:1904693) |
| 0.2 | 0.9 | GO:0009956 | radial pattern formation(GO:0009956) |
| 0.2 | 1.6 | GO:2001034 | positive regulation of double-strand break repair via nonhomologous end joining(GO:2001034) |
| 0.2 | 2.8 | GO:0021759 | globus pallidus development(GO:0021759) |
| 0.2 | 2.7 | GO:0070884 | regulation of calcineurin-NFAT signaling cascade(GO:0070884) |
| 0.2 | 1.3 | GO:0018032 | protein amidation(GO:0018032) |
| 0.2 | 2.6 | GO:0016554 | cytidine to uridine editing(GO:0016554) |
| 0.2 | 3.0 | GO:0033210 | leptin-mediated signaling pathway(GO:0033210) |
| 0.2 | 0.6 | GO:1990108 | protein linear deubiquitination(GO:1990108) |
| 0.2 | 6.2 | GO:0002347 | response to tumor cell(GO:0002347) |
| 0.2 | 7.6 | GO:0035024 | negative regulation of Rho protein signal transduction(GO:0035024) |
| 0.2 | 1.2 | GO:2001153 | regulation of renal water transport(GO:2001151) positive regulation of renal water transport(GO:2001153) |
| 0.2 | 0.6 | GO:1904404 | cellular response to vitamin B1(GO:0071301) response to formaldehyde(GO:1904404) |
| 0.2 | 1.0 | GO:0006696 | ergosterol biosynthetic process(GO:0006696) ergosterol metabolic process(GO:0008204) |
| 0.2 | 1.8 | GO:0010606 | positive regulation of cytoplasmic mRNA processing body assembly(GO:0010606) |
| 0.2 | 1.0 | GO:2000638 | regulation of SREBP signaling pathway(GO:2000638) negative regulation of SREBP signaling pathway(GO:2000639) |
| 0.2 | 0.6 | GO:0003274 | endocardial cushion fusion(GO:0003274) |
| 0.2 | 3.4 | GO:0051044 | positive regulation of membrane protein ectodomain proteolysis(GO:0051044) |
| 0.2 | 0.9 | GO:0032489 | aminophospholipid transport(GO:0015917) regulation of Cdc42 protein signal transduction(GO:0032489) regulation of high-density lipoprotein particle assembly(GO:0090107) |
| 0.2 | 1.7 | GO:0072733 | response to staurosporine(GO:0072733) cellular response to staurosporine(GO:0072734) |
| 0.2 | 1.4 | GO:0009597 | detection of virus(GO:0009597) |
| 0.2 | 2.8 | GO:0014894 | response to muscle inactivity involved in regulation of muscle adaptation(GO:0014877) response to denervation involved in regulation of muscle adaptation(GO:0014894) |
| 0.2 | 1.2 | GO:0030951 | establishment or maintenance of microtubule cytoskeleton polarity(GO:0030951) |
| 0.2 | 0.7 | GO:0061053 | somite development(GO:0061053) |
| 0.2 | 3.5 | GO:0051988 | regulation of attachment of spindle microtubules to kinetochore(GO:0051988) |
| 0.2 | 1.9 | GO:0006657 | CDP-choline pathway(GO:0006657) |
| 0.2 | 1.9 | GO:0090232 | positive regulation of spindle checkpoint(GO:0090232) |
| 0.2 | 0.8 | GO:0035720 | intraciliary anterograde transport(GO:0035720) |
| 0.2 | 2.4 | GO:0030336 | negative regulation of cell migration(GO:0030336) |
| 0.2 | 0.9 | GO:1901668 | regulation of superoxide dismutase activity(GO:1901668) |
| 0.2 | 2.8 | GO:2001224 | positive regulation of neuron migration(GO:2001224) |
| 0.2 | 1.1 | GO:0051661 | maintenance of centrosome location(GO:0051661) |
| 0.1 | 0.4 | GO:0046521 | sphingoid catabolic process(GO:0046521) |
| 0.1 | 1.8 | GO:0048298 | positive regulation of isotype switching to IgA isotypes(GO:0048298) |
| 0.1 | 1.8 | GO:0090204 | protein localization to nuclear pore(GO:0090204) |
| 0.1 | 5.3 | GO:0048268 | clathrin coat assembly(GO:0048268) |
| 0.1 | 0.4 | GO:0031204 | posttranslational protein targeting to membrane, translocation(GO:0031204) |
| 0.1 | 1.6 | GO:0016191 | synaptic vesicle uncoating(GO:0016191) |
| 0.1 | 0.7 | GO:0032755 | positive regulation of interleukin-6 production(GO:0032755) |
| 0.1 | 0.8 | GO:0002725 | negative regulation of T cell cytokine production(GO:0002725) |
| 0.1 | 1.9 | GO:0043951 | negative regulation of cAMP-mediated signaling(GO:0043951) |
| 0.1 | 0.5 | GO:1904222 | regulation of CDP-diacylglycerol-serine O-phosphatidyltransferase activity(GO:1904217) positive regulation of CDP-diacylglycerol-serine O-phosphatidyltransferase activity(GO:1904219) positive regulation of serine C-palmitoyltransferase activity(GO:1904222) |
| 0.1 | 0.8 | GO:0090521 | glomerular visceral epithelial cell migration(GO:0090521) |
| 0.1 | 3.0 | GO:0071803 | positive regulation of podosome assembly(GO:0071803) |
| 0.1 | 1.5 | GO:0000389 | mRNA 3'-splice site recognition(GO:0000389) |
| 0.1 | 0.9 | GO:0097428 | protein maturation by iron-sulfur cluster transfer(GO:0097428) |
| 0.1 | 2.7 | GO:0007084 | mitotic nuclear envelope reassembly(GO:0007084) |
| 0.1 | 0.4 | GO:1901143 | insulin catabolic process(GO:1901143) |
| 0.1 | 1.8 | GO:1904776 | regulation of protein localization to cell cortex(GO:1904776) positive regulation of protein localization to cell cortex(GO:1904778) |
| 0.1 | 1.4 | GO:0032237 | activation of store-operated calcium channel activity(GO:0032237) positive regulation of store-operated calcium channel activity(GO:1901341) |
| 0.1 | 0.7 | GO:0098886 | modification of dendritic spine(GO:0098886) |
| 0.1 | 4.7 | GO:0060644 | mammary gland epithelial cell differentiation(GO:0060644) |
| 0.1 | 0.5 | GO:0032207 | regulation of telomere maintenance via recombination(GO:0032207) negative regulation of telomere maintenance via recombination(GO:0032208) negative regulation of single strand break repair(GO:1903517) negative regulation of beta-galactosidase activity(GO:1903770) telomere single strand break repair(GO:1903823) negative regulation of telomere single strand break repair(GO:1903824) |
| 0.1 | 0.7 | GO:0035063 | nuclear speck organization(GO:0035063) |
| 0.1 | 0.5 | GO:0002282 | microglial cell activation involved in immune response(GO:0002282) |
| 0.1 | 1.8 | GO:0046007 | negative regulation of activated T cell proliferation(GO:0046007) |
| 0.1 | 4.4 | GO:0042994 | cytoplasmic sequestering of transcription factor(GO:0042994) |
| 0.1 | 0.2 | GO:0038161 | prolactin signaling pathway(GO:0038161) |
| 0.1 | 2.7 | GO:0038063 | collagen-activated tyrosine kinase receptor signaling pathway(GO:0038063) |
| 0.1 | 4.2 | GO:0071425 | hematopoietic stem cell proliferation(GO:0071425) |
| 0.1 | 1.6 | GO:0038007 | netrin-activated signaling pathway(GO:0038007) |
| 0.1 | 0.6 | GO:0021691 | cerebellar Purkinje cell layer maturation(GO:0021691) |
| 0.1 | 0.6 | GO:0036089 | cleavage furrow formation(GO:0036089) |
| 0.1 | 1.5 | GO:0021702 | cerebellar Purkinje cell layer formation(GO:0021694) cerebellar Purkinje cell differentiation(GO:0021702) |
| 0.1 | 0.4 | GO:0048625 | myoblast fate commitment(GO:0048625) |
| 0.1 | 0.7 | GO:0006987 | activation of signaling protein activity involved in unfolded protein response(GO:0006987) |
| 0.1 | 2.6 | GO:1904355 | positive regulation of telomere capping(GO:1904355) |
| 0.1 | 0.3 | GO:0007388 | anterior compartment pattern formation(GO:0007387) posterior compartment specification(GO:0007388) |
| 0.1 | 0.8 | GO:0097264 | self proteolysis(GO:0097264) |
| 0.1 | 0.7 | GO:0051005 | negative regulation of lipoprotein lipase activity(GO:0051005) |
| 0.1 | 0.7 | GO:0001957 | intramembranous ossification(GO:0001957) direct ossification(GO:0036072) |
| 0.1 | 0.3 | GO:0098939 | dendritic transport of mitochondrion(GO:0098939) anterograde dendritic transport of mitochondrion(GO:0098972) |
| 0.1 | 0.1 | GO:1902299 | pre-replicative complex assembly involved in nuclear cell cycle DNA replication(GO:0006267) pre-replicative complex assembly(GO:0036388) pre-replicative complex assembly involved in cell cycle DNA replication(GO:1902299) |
| 0.1 | 1.0 | GO:0042048 | olfactory behavior(GO:0042048) |
| 0.1 | 0.4 | GO:0051684 | maintenance of Golgi location(GO:0051684) |
| 0.1 | 1.7 | GO:0033148 | positive regulation of intracellular estrogen receptor signaling pathway(GO:0033148) |
| 0.1 | 2.3 | GO:0006044 | N-acetylglucosamine metabolic process(GO:0006044) |
| 0.1 | 1.0 | GO:0006686 | sphingomyelin biosynthetic process(GO:0006686) |
| 0.1 | 1.8 | GO:0003417 | growth plate cartilage development(GO:0003417) |
| 0.1 | 0.5 | GO:1904694 | negative regulation of vascular smooth muscle contraction(GO:1904694) |
| 0.1 | 3.1 | GO:0033119 | negative regulation of RNA splicing(GO:0033119) |
| 0.1 | 0.8 | GO:0001867 | complement activation, lectin pathway(GO:0001867) |
| 0.1 | 1.5 | GO:0010614 | negative regulation of cardiac muscle hypertrophy(GO:0010614) |
| 0.1 | 0.4 | GO:0070495 | negative regulation of dopamine uptake involved in synaptic transmission(GO:0051585) norepinephrine uptake(GO:0051620) regulation of norepinephrine uptake(GO:0051621) negative regulation of norepinephrine uptake(GO:0051622) negative regulation of catecholamine uptake involved in synaptic transmission(GO:0051945) regulation of thrombin receptor signaling pathway(GO:0070494) negative regulation of thrombin receptor signaling pathway(GO:0070495) regulation of glutathione peroxidase activity(GO:1903282) positive regulation of glutathione peroxidase activity(GO:1903284) positive regulation of hydrogen peroxide catabolic process(GO:1903285) positive regulation of peroxidase activity(GO:2000470) |
| 0.1 | 2.0 | GO:0006704 | glucocorticoid biosynthetic process(GO:0006704) |
| 0.1 | 0.3 | GO:1902310 | positive regulation of peptidyl-serine dephosphorylation(GO:1902310) |
| 0.1 | 0.6 | GO:0046952 | ketone body catabolic process(GO:0046952) |
| 0.1 | 0.4 | GO:0038098 | sequestering of BMP from receptor via BMP binding(GO:0038098) |
| 0.1 | 1.8 | GO:0061436 | establishment of skin barrier(GO:0061436) |
| 0.1 | 0.9 | GO:0018243 | protein O-linked glycosylation via threonine(GO:0018243) |
| 0.1 | 2.8 | GO:0002076 | osteoblast development(GO:0002076) |
| 0.1 | 0.2 | GO:0098502 | base-excision repair, base-free sugar-phosphate removal(GO:0006286) DNA dephosphorylation(GO:0098502) |
| 0.1 | 0.6 | GO:0038110 | interleukin-2-mediated signaling pathway(GO:0038110) |
| 0.1 | 0.6 | GO:0034333 | adherens junction assembly(GO:0034333) |
| 0.1 | 0.5 | GO:1902261 | positive regulation of delayed rectifier potassium channel activity(GO:1902261) |
| 0.1 | 3.0 | GO:0006376 | mRNA splice site selection(GO:0006376) |
| 0.1 | 0.5 | GO:1903760 | regulation of voltage-gated potassium channel activity involved in ventricular cardiac muscle cell action potential repolarization(GO:1903760) |
| 0.1 | 0.3 | GO:0045591 | positive regulation of regulatory T cell differentiation(GO:0045591) negative regulation of respiratory burst involved in inflammatory response(GO:0060266) |
| 0.1 | 0.8 | GO:0090091 | positive regulation of extracellular matrix disassembly(GO:0090091) |
| 0.1 | 0.4 | GO:0014846 | esophagus smooth muscle contraction(GO:0014846) |
| 0.1 | 0.4 | GO:0032096 | negative regulation of response to food(GO:0032096) negative regulation of appetite(GO:0032099) |
| 0.1 | 0.3 | GO:0051835 | positive regulation of synapse structural plasticity(GO:0051835) |
| 0.1 | 0.8 | GO:0006707 | cholesterol catabolic process(GO:0006707) sterol catabolic process(GO:0016127) |
| 0.1 | 0.4 | GO:0021993 | initiation of neural tube closure(GO:0021993) |
| 0.1 | 2.2 | GO:0010800 | positive regulation of peptidyl-threonine phosphorylation(GO:0010800) |
| 0.1 | 0.8 | GO:1904352 | positive regulation of protein catabolic process in the vacuole(GO:1904352) |
| 0.1 | 0.5 | GO:0032876 | negative regulation of DNA endoreduplication(GO:0032876) |
| 0.1 | 1.0 | GO:0043374 | CD8-positive, alpha-beta T cell differentiation(GO:0043374) |
| 0.1 | 2.6 | GO:0016577 | histone demethylation(GO:0016577) |
| 0.1 | 0.4 | GO:0061739 | protein lipidation involved in autophagosome assembly(GO:0061739) |
| 0.1 | 0.3 | GO:0090285 | negative regulation of protein glycosylation in Golgi(GO:0090285) |
| 0.1 | 0.5 | GO:0010216 | maintenance of DNA methylation(GO:0010216) |
| 0.1 | 0.5 | GO:0002175 | protein localization to paranode region of axon(GO:0002175) |
| 0.1 | 1.2 | GO:0046827 | positive regulation of protein export from nucleus(GO:0046827) |
| 0.1 | 0.2 | GO:0008050 | female courtship behavior(GO:0008050) |
| 0.1 | 1.1 | GO:0070933 | histone H4 deacetylation(GO:0070933) |
| 0.1 | 0.4 | GO:1901621 | negative regulation of smoothened signaling pathway involved in dorsal/ventral neural tube patterning(GO:1901621) |
| 0.1 | 0.3 | GO:0060666 | dichotomous subdivision of terminal units involved in salivary gland branching(GO:0060666) |
| 0.1 | 0.5 | GO:0010724 | regulation of definitive erythrocyte differentiation(GO:0010724) |
| 0.1 | 3.0 | GO:0010107 | potassium ion import(GO:0010107) |
| 0.1 | 2.2 | GO:0043268 | positive regulation of potassium ion transport(GO:0043268) |
| 0.1 | 6.1 | GO:0048678 | response to axon injury(GO:0048678) |
| 0.1 | 0.4 | GO:0098773 | skin epidermis development(GO:0098773) |
| 0.1 | 1.6 | GO:0070201 | regulation of establishment of protein localization(GO:0070201) |
| 0.1 | 0.3 | GO:2000691 | regulation of cardiac muscle cell myoblast differentiation(GO:2000690) negative regulation of cardiac muscle cell myoblast differentiation(GO:2000691) |
| 0.1 | 1.0 | GO:0045589 | regulation of regulatory T cell differentiation(GO:0045589) |
| 0.1 | 0.6 | GO:0033299 | secretion of lysosomal enzymes(GO:0033299) |
| 0.1 | 0.1 | GO:0097151 | positive regulation of inhibitory postsynaptic potential(GO:0097151) modulation of inhibitory postsynaptic potential(GO:0098828) |
| 0.0 | 0.7 | GO:0048706 | embryonic skeletal system development(GO:0048706) |
| 0.0 | 2.4 | GO:0000083 | regulation of transcription involved in G1/S transition of mitotic cell cycle(GO:0000083) |
| 0.0 | 0.6 | GO:2000675 | negative regulation of type B pancreatic cell apoptotic process(GO:2000675) |
| 0.0 | 0.3 | GO:0034316 | negative regulation of Arp2/3 complex-mediated actin nucleation(GO:0034316) |
| 0.0 | 0.4 | GO:2000158 | positive regulation of ubiquitin-specific protease activity(GO:2000158) |
| 0.0 | 0.2 | GO:0001842 | neural fold formation(GO:0001842) |
| 0.0 | 0.4 | GO:0003025 | regulation of systemic arterial blood pressure by baroreceptor feedback(GO:0003025) vagus nerve development(GO:0021564) |
| 0.0 | 1.2 | GO:0006646 | phosphatidylethanolamine biosynthetic process(GO:0006646) |
| 0.0 | 0.6 | GO:0045475 | locomotor rhythm(GO:0045475) |
| 0.0 | 1.9 | GO:0000245 | spliceosomal complex assembly(GO:0000245) |
| 0.0 | 0.2 | GO:0045208 | MAPK phosphatase export from nucleus(GO:0045208) MAPK phosphatase export from nucleus, leptomycin B sensitive(GO:0045209) |
| 0.0 | 0.0 | GO:0060621 | negative regulation of very-low-density lipoprotein particle remodeling(GO:0010903) negative regulation of cholesterol import(GO:0060621) negative regulation of sterol import(GO:2000910) |
| 0.0 | 0.4 | GO:0021603 | cranial nerve formation(GO:0021603) |
| 0.0 | 0.4 | GO:0002051 | osteoblast fate commitment(GO:0002051) |
| 0.0 | 0.2 | GO:0006499 | N-terminal protein myristoylation(GO:0006499) |
| 0.0 | 0.5 | GO:0035331 | negative regulation of hippo signaling(GO:0035331) |
| 0.0 | 2.3 | GO:0010863 | positive regulation of phospholipase C activity(GO:0010863) |
| 0.0 | 0.7 | GO:0045717 | negative regulation of fatty acid biosynthetic process(GO:0045717) |
| 0.0 | 0.7 | GO:0043578 | nuclear matrix organization(GO:0043578) nuclear matrix anchoring at nuclear membrane(GO:0090292) |
| 0.0 | 0.9 | GO:0048642 | negative regulation of skeletal muscle tissue development(GO:0048642) |
| 0.0 | 0.5 | GO:0090646 | mitochondrial tRNA processing(GO:0090646) |
| 0.0 | 0.3 | GO:0032696 | negative regulation of interleukin-13 production(GO:0032696) negative regulation of interleukin-4 production(GO:0032713) |
| 0.0 | 0.4 | GO:0070779 | gamma-aminobutyric acid biosynthetic process(GO:0009449) D-aspartate transport(GO:0070777) D-aspartate import(GO:0070779) |
| 0.0 | 0.4 | GO:0000079 | regulation of cyclin-dependent protein serine/threonine kinase activity(GO:0000079) regulation of cyclin-dependent protein kinase activity(GO:1904029) |
| 0.0 | 1.2 | GO:0060074 | synapse maturation(GO:0060074) |
| 0.0 | 0.6 | GO:0048593 | camera-type eye morphogenesis(GO:0048593) |
| 0.0 | 0.6 | GO:0006610 | ribosomal protein import into nucleus(GO:0006610) |
| 0.0 | 2.0 | GO:0006336 | DNA replication-independent nucleosome assembly(GO:0006336) |
| 0.0 | 0.1 | GO:0006335 | DNA replication-dependent nucleosome assembly(GO:0006335) DNA replication-dependent nucleosome organization(GO:0034723) |
| 0.0 | 0.3 | GO:0090050 | positive regulation of cell migration involved in sprouting angiogenesis(GO:0090050) |
| 0.0 | 0.7 | GO:0043010 | camera-type eye development(GO:0043010) |
| 0.0 | 0.2 | GO:0072592 | oxygen metabolic process(GO:0072592) |
| 0.0 | 0.1 | GO:0042704 | uterine wall breakdown(GO:0042704) |
| 0.0 | 0.2 | GO:0093001 | glycolysis from storage polysaccharide through glucose-1-phosphate(GO:0093001) |
| 0.0 | 0.5 | GO:0002227 | innate immune response in mucosa(GO:0002227) |
| 0.0 | 0.6 | GO:0001919 | regulation of receptor recycling(GO:0001919) |
| 0.0 | 0.3 | GO:2000480 | negative regulation of cAMP-dependent protein kinase activity(GO:2000480) |
| 0.0 | 0.1 | GO:0006424 | glutamyl-tRNA aminoacylation(GO:0006424) |
| 0.0 | 0.2 | GO:1902952 | positive regulation of dendritic spine maintenance(GO:1902952) |
| 0.0 | 1.6 | GO:0006611 | protein export from nucleus(GO:0006611) |
| 0.0 | 0.1 | GO:0030718 | germ-line stem cell population maintenance(GO:0030718) |
| 0.0 | 0.1 | GO:0010430 | fatty acid omega-oxidation(GO:0010430) |
| 0.0 | 1.0 | GO:0031581 | hemidesmosome assembly(GO:0031581) |
| 0.0 | 1.2 | GO:0070536 | protein K63-linked deubiquitination(GO:0070536) |
| 0.0 | 2.6 | GO:1900181 | negative regulation of protein localization to nucleus(GO:1900181) |
| 0.0 | 0.2 | GO:0010603 | regulation of cytoplasmic mRNA processing body assembly(GO:0010603) |
| 0.0 | 0.2 | GO:0072008 | glomerular mesangial cell differentiation(GO:0072008) glomerular mesangial cell development(GO:0072144) |
| 0.0 | 0.4 | GO:0010457 | centriole-centriole cohesion(GO:0010457) |
| 0.0 | 0.2 | GO:0071985 | multivesicular body sorting pathway(GO:0071985) |
| 0.0 | 0.3 | GO:1901725 | regulation of histone deacetylase activity(GO:1901725) |
| 0.0 | 0.2 | GO:0010507 | negative regulation of autophagy(GO:0010507) |
| 0.0 | 0.1 | GO:0009233 | menaquinone metabolic process(GO:0009233) |
| 0.0 | 0.6 | GO:0010801 | negative regulation of peptidyl-threonine phosphorylation(GO:0010801) |
| 0.0 | 2.5 | GO:0016266 | O-glycan processing(GO:0016266) |
| 0.0 | 0.1 | GO:0033037 | polysaccharide localization(GO:0033037) |
| 0.0 | 0.1 | GO:0006556 | S-adenosylmethionine biosynthetic process(GO:0006556) |
| 0.0 | 0.9 | GO:0090162 | establishment of epithelial cell polarity(GO:0090162) |
| 0.0 | 1.3 | GO:0015804 | neutral amino acid transport(GO:0015804) |
| 0.0 | 1.7 | GO:0015914 | phospholipid transport(GO:0015914) |
| 0.0 | 0.2 | GO:0001881 | receptor recycling(GO:0001881) |
| 0.0 | 0.5 | GO:1902593 | protein import into nucleus(GO:0006606) protein targeting to nucleus(GO:0044744) single-organism nuclear import(GO:1902593) |
| 0.0 | 0.2 | GO:0001768 | establishment of T cell polarity(GO:0001768) |
| 0.0 | 0.4 | GO:0000338 | protein deneddylation(GO:0000338) |
| 0.0 | 1.3 | GO:0045197 | establishment or maintenance of epithelial cell apical/basal polarity(GO:0045197) |
| 0.0 | 1.3 | GO:1901224 | positive regulation of NIK/NF-kappaB signaling(GO:1901224) |
| 0.0 | 1.0 | GO:0046676 | negative regulation of insulin secretion(GO:0046676) |
| 0.0 | 0.3 | GO:0043248 | proteasome assembly(GO:0043248) |
| 0.0 | 0.9 | GO:0006882 | cellular zinc ion homeostasis(GO:0006882) |
| 0.0 | 0.1 | GO:1904885 | beta-catenin destruction complex assembly(GO:1904885) |
| 0.0 | 0.0 | GO:0035106 | negative regulation of luteinizing hormone secretion(GO:0033685) operant conditioning(GO:0035106) |
| 0.0 | 0.5 | GO:0071539 | protein localization to centrosome(GO:0071539) |
| 0.0 | 0.4 | GO:0044705 | mating behavior(GO:0007617) multi-organism reproductive behavior(GO:0044705) |
| 0.0 | 1.0 | GO:0030318 | melanocyte differentiation(GO:0030318) |
| 0.0 | 0.5 | GO:0043555 | regulation of translation in response to stress(GO:0043555) |
| 0.0 | 0.1 | GO:0016098 | monoterpenoid metabolic process(GO:0016098) |
| 0.0 | 1.7 | GO:0007032 | endosome organization(GO:0007032) |
| 0.0 | 0.1 | GO:0048739 | cardiac muscle fiber development(GO:0048739) |
| 0.0 | 0.2 | GO:0055014 | atrial cardiac muscle cell differentiation(GO:0055011) atrial cardiac muscle cell development(GO:0055014) |
| 0.0 | 0.3 | GO:0090084 | negative regulation of inclusion body assembly(GO:0090084) |
| 0.0 | 0.2 | GO:0010818 | T cell chemotaxis(GO:0010818) |
| 0.0 | 0.6 | GO:0007176 | regulation of epidermal growth factor-activated receptor activity(GO:0007176) |
| 0.0 | 0.5 | GO:0071526 | semaphorin-plexin signaling pathway(GO:0071526) |
| 0.0 | 0.2 | GO:0097119 | postsynaptic density protein 95 clustering(GO:0097119) |
| 0.0 | 0.2 | GO:0048386 | positive regulation of retinoic acid receptor signaling pathway(GO:0048386) |
| 0.0 | 0.4 | GO:0015937 | coenzyme A biosynthetic process(GO:0015937) |
| 0.0 | 0.2 | GO:0045329 | carnitine biosynthetic process(GO:0045329) |
| 0.0 | 0.2 | GO:0018231 | peptidyl-L-cysteine S-palmitoylation(GO:0018230) peptidyl-S-diacylglycerol-L-cysteine biosynthetic process from peptidyl-cysteine(GO:0018231) |
| 0.0 | 0.3 | GO:0030048 | actin filament-based movement(GO:0030048) |
| 0.0 | 0.1 | GO:0032024 | positive regulation of insulin secretion(GO:0032024) |
| 0.0 | 0.3 | GO:0045116 | protein neddylation(GO:0045116) |
| 0.0 | 1.8 | GO:0043484 | regulation of RNA splicing(GO:0043484) |
| 0.0 | 0.9 | GO:0036092 | phosphatidylinositol-3-phosphate biosynthetic process(GO:0036092) |
| 0.0 | 0.1 | GO:0045995 | regulation of embryonic development(GO:0045995) |
| 0.0 | 0.9 | GO:0008088 | axo-dendritic transport(GO:0008088) |
| 0.0 | 1.4 | GO:0042633 | molting cycle(GO:0042303) hair cycle(GO:0042633) |
| 0.0 | 0.1 | GO:0007039 | protein catabolic process in the vacuole(GO:0007039) |
| 0.0 | 0.1 | GO:0002870 | lymphocyte anergy(GO:0002249) regulation of T cell anergy(GO:0002667) T cell anergy(GO:0002870) regulation of lymphocyte anergy(GO:0002911) |
| 0.0 | 0.1 | GO:0038061 | NIK/NF-kappaB signaling(GO:0038061) |
| 0.0 | 0.1 | GO:2000726 | negative regulation of cardiac muscle cell differentiation(GO:2000726) |
| 0.0 | 0.1 | GO:0003199 | endocardial cushion to mesenchymal transition involved in heart valve formation(GO:0003199) |
| 0.0 | 0.1 | GO:0002759 | regulation of antimicrobial humoral response(GO:0002759) |
| 0.0 | 0.1 | GO:1903715 | regulation of aerobic respiration(GO:1903715) |
| 0.0 | 0.2 | GO:0006957 | complement activation, alternative pathway(GO:0006957) |
| 0.0 | 0.0 | GO:0043987 | histone H3-S10 phosphorylation(GO:0043987) histone H3-S28 phosphorylation(GO:0043988) |
| 0.0 | 0.4 | GO:0046856 | phosphatidylinositol dephosphorylation(GO:0046856) |
| 0.0 | 0.1 | GO:0036150 | phosphatidylserine acyl-chain remodeling(GO:0036150) |
| 0.0 | 0.3 | GO:0051639 | actin filament network formation(GO:0051639) |
| 0.0 | 0.2 | GO:0032802 | low-density lipoprotein particle receptor catabolic process(GO:0032802) |
| 0.0 | 0.3 | GO:0043651 | epoxygenase P450 pathway(GO:0019373) linoleic acid metabolic process(GO:0043651) |
| 0.0 | 0.5 | GO:0099601 | regulation of neurotransmitter receptor activity(GO:0099601) |
| 0.0 | 0.0 | GO:0046116 | queuosine biosynthetic process(GO:0008616) queuosine metabolic process(GO:0046116) |
| 0.0 | 0.4 | GO:0043984 | histone H4-K16 acetylation(GO:0043984) |
| 0.0 | 0.6 | GO:0010501 | RNA secondary structure unwinding(GO:0010501) |
| 0.0 | 0.1 | GO:0051764 | actin crosslink formation(GO:0051764) |
Gene overrepresentation in cellular_component category:
| Log-likelihood per target | Total log-likelihood | Term | Description |
|---|---|---|---|
| 1.0 | 5.8 | GO:0031673 | H zone(GO:0031673) |
| 0.8 | 7.9 | GO:0000798 | nuclear cohesin complex(GO:0000798) |
| 0.6 | 9.6 | GO:0030478 | actin cap(GO:0030478) |
| 0.6 | 3.4 | GO:0097149 | centralspindlin complex(GO:0097149) |
| 0.5 | 1.6 | GO:1902737 | dendritic filopodium(GO:1902737) |
| 0.5 | 2.6 | GO:0033596 | TSC1-TSC2 complex(GO:0033596) |
| 0.5 | 8.5 | GO:0031209 | SCAR complex(GO:0031209) |
| 0.5 | 1.4 | GO:0036457 | keratohyalin granule(GO:0036457) |
| 0.4 | 2.2 | GO:0035838 | growing cell tip(GO:0035838) |
| 0.4 | 1.8 | GO:0031251 | PAN complex(GO:0031251) |
| 0.4 | 3.4 | GO:0070369 | beta-catenin-TCF7L2 complex(GO:0070369) |
| 0.4 | 2.2 | GO:0070381 | endosome to plasma membrane transport vesicle(GO:0070381) |
| 0.3 | 1.9 | GO:0000308 | cytoplasmic cyclin-dependent protein kinase holoenzyme complex(GO:0000308) |
| 0.3 | 4.1 | GO:0070937 | CRD-mediated mRNA stability complex(GO:0070937) |
| 0.3 | 0.8 | GO:0097444 | spine apparatus(GO:0097444) |
| 0.2 | 1.0 | GO:0097629 | extrinsic component of omegasome membrane(GO:0097629) |
| 0.2 | 3.3 | GO:0097427 | microtubule bundle(GO:0097427) |
| 0.2 | 5.2 | GO:0005952 | cAMP-dependent protein kinase complex(GO:0005952) |
| 0.2 | 1.1 | GO:0090571 | RNA polymerase II transcription repressor complex(GO:0090571) |
| 0.2 | 3.1 | GO:0033391 | chromatoid body(GO:0033391) |
| 0.2 | 3.2 | GO:0032433 | filopodium tip(GO:0032433) |
| 0.2 | 7.1 | GO:0031092 | platelet alpha granule membrane(GO:0031092) |
| 0.2 | 0.5 | GO:0044609 | DBIRD complex(GO:0044609) |
| 0.1 | 1.0 | GO:1990452 | Parkin-FBXW7-Cul1 ubiquitin ligase complex(GO:1990452) |
| 0.1 | 2.5 | GO:0071438 | invadopodium membrane(GO:0071438) |
| 0.1 | 0.9 | GO:1990130 | Iml1 complex(GO:1990130) |
| 0.1 | 1.4 | GO:0032541 | cortical endoplasmic reticulum(GO:0032541) |
| 0.1 | 1.6 | GO:0001940 | male pronucleus(GO:0001940) |
| 0.1 | 1.7 | GO:0033643 | host cell part(GO:0033643) |
| 0.1 | 0.5 | GO:0097454 | Schwann cell microvillus(GO:0097454) |
| 0.1 | 2.2 | GO:0005671 | Ada2/Gcn5/Ada3 transcription activator complex(GO:0005671) |
| 0.1 | 4.8 | GO:0071339 | MLL1/2 complex(GO:0044665) MLL1 complex(GO:0071339) |
| 0.1 | 4.7 | GO:0080008 | Cul4-RING E3 ubiquitin ligase complex(GO:0080008) |
| 0.1 | 1.0 | GO:0005610 | laminin-5 complex(GO:0005610) |
| 0.1 | 0.7 | GO:0070435 | Shc-EGFR complex(GO:0070435) |
| 0.1 | 1.8 | GO:0008091 | spectrin(GO:0008091) |
| 0.1 | 4.3 | GO:0016592 | mediator complex(GO:0016592) |
| 0.1 | 2.5 | GO:0001891 | phagocytic cup(GO:0001891) |
| 0.1 | 2.1 | GO:0030014 | CCR4-NOT complex(GO:0030014) |
| 0.1 | 1.1 | GO:0033018 | sarcoplasmic reticulum lumen(GO:0033018) |
| 0.1 | 4.1 | GO:0035861 | site of double-strand break(GO:0035861) |
| 0.1 | 0.4 | GO:0031466 | Cul5-RING ubiquitin ligase complex(GO:0031466) |
| 0.1 | 7.6 | GO:0031463 | Cul3-RING ubiquitin ligase complex(GO:0031463) |
| 0.1 | 2.4 | GO:0016580 | Sin3 complex(GO:0016580) |
| 0.1 | 2.8 | GO:0097228 | sperm principal piece(GO:0097228) |
| 0.1 | 0.6 | GO:0098642 | network-forming collagen trimer(GO:0098642) collagen network(GO:0098645) |
| 0.1 | 0.9 | GO:0001520 | outer dense fiber(GO:0001520) |
| 0.1 | 0.5 | GO:0030678 | mitochondrial ribonuclease P complex(GO:0030678) |
| 0.1 | 1.6 | GO:0042599 | lamellar body(GO:0042599) |
| 0.1 | 0.9 | GO:0035253 | ciliary rootlet(GO:0035253) |
| 0.1 | 0.6 | GO:0070022 | transforming growth factor beta receptor homodimeric complex(GO:0070022) |
| 0.1 | 0.8 | GO:0005828 | kinetochore microtubule(GO:0005828) |
| 0.1 | 1.0 | GO:0031588 | nucleotide-activated protein kinase complex(GO:0031588) |
| 0.1 | 0.5 | GO:0031462 | Cul2-RING ubiquitin ligase complex(GO:0031462) |
| 0.1 | 0.1 | GO:0042585 | germinal vesicle(GO:0042585) |
| 0.1 | 2.1 | GO:0005921 | gap junction(GO:0005921) |
| 0.0 | 6.3 | GO:0000118 | histone deacetylase complex(GO:0000118) |
| 0.0 | 0.4 | GO:0030870 | Mre11 complex(GO:0030870) |
| 0.0 | 0.5 | GO:0014701 | junctional sarcoplasmic reticulum membrane(GO:0014701) |
| 0.0 | 1.0 | GO:0000164 | protein phosphatase type 1 complex(GO:0000164) |
| 0.0 | 0.4 | GO:0044294 | dendritic growth cone(GO:0044294) |
| 0.0 | 4.8 | GO:0005637 | nuclear inner membrane(GO:0005637) |
| 0.0 | 1.2 | GO:0071682 | endocytic vesicle lumen(GO:0071682) |
| 0.0 | 0.5 | GO:0043219 | lateral loop(GO:0043219) |
| 0.0 | 5.6 | GO:0005905 | clathrin-coated pit(GO:0005905) |
| 0.0 | 0.1 | GO:0034657 | GID complex(GO:0034657) |
| 0.0 | 2.3 | GO:0045171 | intercellular bridge(GO:0045171) |
| 0.0 | 1.8 | GO:0005720 | nuclear heterochromatin(GO:0005720) |
| 0.0 | 0.5 | GO:0034992 | microtubule organizing center attachment site(GO:0034992) LINC complex(GO:0034993) |
| 0.0 | 0.4 | GO:0072487 | MSL complex(GO:0072487) |
| 0.0 | 0.1 | GO:0044530 | supraspliceosomal complex(GO:0044530) |
| 0.0 | 1.2 | GO:0005923 | bicellular tight junction(GO:0005923) |
| 0.0 | 0.2 | GO:0070701 | mucus layer(GO:0070701) |
| 0.0 | 0.3 | GO:0005797 | Golgi medial cisterna(GO:0005797) |
| 0.0 | 1.7 | GO:0000159 | protein phosphatase type 2A complex(GO:0000159) |
| 0.0 | 0.2 | GO:0030485 | smooth muscle contractile fiber(GO:0030485) |
| 0.0 | 0.1 | GO:0048269 | methionine adenosyltransferase complex(GO:0048269) |
| 0.0 | 1.0 | GO:0035371 | microtubule plus-end(GO:0035371) |
| 0.0 | 0.2 | GO:0097440 | apical dendrite(GO:0097440) |
| 0.0 | 0.6 | GO:0070938 | contractile ring(GO:0070938) |
| 0.0 | 0.2 | GO:0005579 | membrane attack complex(GO:0005579) |
| 0.0 | 0.1 | GO:0016938 | kinesin I complex(GO:0016938) |
| 0.0 | 0.5 | GO:0016342 | catenin complex(GO:0016342) |
| 0.0 | 2.2 | GO:0019005 | SCF ubiquitin ligase complex(GO:0019005) |
| 0.0 | 0.1 | GO:0036387 | nuclear pre-replicative complex(GO:0005656) pre-replicative complex(GO:0036387) |
| 0.0 | 3.7 | GO:0005882 | intermediate filament(GO:0005882) |
| 0.0 | 0.1 | GO:0070939 | Dsl1p complex(GO:0070939) |
| 0.0 | 0.3 | GO:0008541 | proteasome regulatory particle, lid subcomplex(GO:0008541) |
| 0.0 | 1.8 | GO:0002102 | podosome(GO:0002102) |
| 0.0 | 0.6 | GO:0016327 | apicolateral plasma membrane(GO:0016327) |
| 0.0 | 4.0 | GO:0071013 | catalytic step 2 spliceosome(GO:0071013) |
| 0.0 | 0.7 | GO:0070971 | endoplasmic reticulum exit site(GO:0070971) |
| 0.0 | 6.0 | GO:0005795 | Golgi stack(GO:0005795) |
| 0.0 | 1.7 | GO:0001917 | photoreceptor inner segment(GO:0001917) |
| 0.0 | 0.2 | GO:0061700 | Seh1-associated complex(GO:0035859) GATOR2 complex(GO:0061700) |
| 0.0 | 0.3 | GO:0002116 | semaphorin receptor complex(GO:0002116) |
| 0.0 | 0.5 | GO:0008385 | IkappaB kinase complex(GO:0008385) |
| 0.0 | 0.8 | GO:0032040 | small-subunit processome(GO:0032040) |
| 0.0 | 0.4 | GO:0005862 | muscle thin filament tropomyosin(GO:0005862) |
| 0.0 | 0.4 | GO:0017146 | NMDA selective glutamate receptor complex(GO:0017146) |
| 0.0 | 0.6 | GO:0035098 | ESC/E(Z) complex(GO:0035098) |
| 0.0 | 0.2 | GO:0044666 | MLL3/4 complex(GO:0044666) |
| 0.0 | 1.7 | GO:0055038 | recycling endosome membrane(GO:0055038) |
| 0.0 | 0.5 | GO:0030904 | retromer complex(GO:0030904) |
| 0.0 | 4.7 | GO:0031234 | extrinsic component of cytoplasmic side of plasma membrane(GO:0031234) |
| 0.0 | 0.5 | GO:0000242 | pericentriolar material(GO:0000242) |
| 0.0 | 3.1 | GO:0005643 | nuclear pore(GO:0005643) |
| 0.0 | 2.7 | GO:0070821 | tertiary granule membrane(GO:0070821) |
| 0.0 | 0.3 | GO:0071437 | invadopodium(GO:0071437) |
| 0.0 | 4.0 | GO:0030176 | integral component of endoplasmic reticulum membrane(GO:0030176) |
| 0.0 | 0.4 | GO:0043203 | axon hillock(GO:0043203) |
| 0.0 | 0.4 | GO:0035145 | exon-exon junction complex(GO:0035145) |
| 0.0 | 1.1 | GO:0000786 | nucleosome(GO:0000786) |
| 0.0 | 3.1 | GO:0098791 | Golgi subcompartment(GO:0098791) |
| 0.0 | 0.4 | GO:0031597 | cytosolic proteasome complex(GO:0031597) |
| 0.0 | 0.3 | GO:0097512 | cardiac myofibril(GO:0097512) |
| 0.0 | 0.3 | GO:0032039 | integrator complex(GO:0032039) |
| 0.0 | 0.4 | GO:0030118 | clathrin coat(GO:0030118) |
| 0.0 | 0.9 | GO:0045335 | phagocytic vesicle(GO:0045335) |
| 0.0 | 0.5 | GO:0030669 | clathrin-coated endocytic vesicle membrane(GO:0030669) |
| 0.0 | 0.5 | GO:0005839 | proteasome core complex(GO:0005839) |
| 0.0 | 0.5 | GO:0031941 | filamentous actin(GO:0031941) |
| 0.0 | 0.0 | GO:0032173 | septin ring(GO:0005940) septin collar(GO:0032173) |
| 0.0 | 0.8 | GO:0030864 | cortical actin cytoskeleton(GO:0030864) |
| 0.0 | 0.4 | GO:0005614 | interstitial matrix(GO:0005614) |
| 0.0 | 3.3 | GO:0001726 | ruffle(GO:0001726) |
| 0.0 | 0.2 | GO:0032426 | stereocilium tip(GO:0032426) |
| 0.0 | 0.9 | GO:0008023 | transcription elongation factor complex(GO:0008023) |
| 0.0 | 0.2 | GO:0097470 | ribbon synapse(GO:0097470) |
| 0.0 | 2.3 | GO:0101002 | ficolin-1-rich granule(GO:0101002) ficolin-1-rich granule lumen(GO:1904813) |
| 0.0 | 4.6 | GO:0005769 | early endosome(GO:0005769) |
| 0.0 | 0.5 | GO:0005669 | transcription factor TFIID complex(GO:0005669) |
| 0.0 | 0.1 | GO:0001673 | male germ cell nucleus(GO:0001673) |
| 0.0 | 1.6 | GO:0000932 | cytoplasmic mRNA processing body(GO:0000932) |
| 0.0 | 0.4 | GO:0008180 | COP9 signalosome(GO:0008180) |
| 0.0 | 1.4 | GO:0016605 | PML body(GO:0016605) |
Gene overrepresentation in molecular_function category:
| Log-likelihood per target | Total log-likelihood | Term | Description |
|---|---|---|---|
| 3.1 | 9.2 | GO:0036313 | phosphatidylinositol 3-kinase catalytic subunit binding(GO:0036313) |
| 2.0 | 7.8 | GO:0032422 | purine-rich negative regulatory element binding(GO:0032422) |
| 1.0 | 3.0 | GO:0097003 | adipokinetic hormone receptor activity(GO:0097003) |
| 0.9 | 2.6 | GO:0036487 | nitric-oxide synthase inhibitor activity(GO:0036487) |
| 0.7 | 4.4 | GO:0051033 | nucleic acid transmembrane transporter activity(GO:0051032) RNA transmembrane transporter activity(GO:0051033) |
| 0.7 | 9.2 | GO:0015379 | potassium:chloride symporter activity(GO:0015379) potassium ion symporter activity(GO:0022820) |
| 0.7 | 2.0 | GO:0003845 | 11-beta-hydroxysteroid dehydrogenase [NAD(P)] activity(GO:0003845) |
| 0.6 | 3.7 | GO:0023025 | MHC class Ib protein complex binding(GO:0023025) MHC class Ib protein binding, via antigen binding groove(GO:0023030) |
| 0.6 | 2.2 | GO:0035651 | AP-3 adaptor complex binding(GO:0035651) |
| 0.5 | 1.6 | GO:0015218 | pyrimidine nucleotide transmembrane transporter activity(GO:0015218) |
| 0.5 | 1.6 | GO:0004651 | polynucleotide 5'-phosphatase activity(GO:0004651) |
| 0.4 | 2.7 | GO:0008597 | calcium-dependent protein serine/threonine phosphatase regulator activity(GO:0008597) |
| 0.4 | 2.6 | GO:0004992 | platelet activating factor receptor activity(GO:0004992) |
| 0.4 | 1.5 | GO:0004142 | diacylglycerol cholinephosphotransferase activity(GO:0004142) ethanolaminephosphotransferase activity(GO:0004307) |
| 0.4 | 3.0 | GO:0042289 | MHC class II protein binding(GO:0042289) |
| 0.4 | 4.3 | GO:0102337 | fatty acid elongase activity(GO:0009922) 3-oxo-arachidoyl-CoA synthase activity(GO:0102336) 3-oxo-cerotoyl-CoA synthase activity(GO:0102337) 3-oxo-lignoceronyl-CoA synthase activity(GO:0102338) |
| 0.3 | 1.4 | GO:0035575 | histone demethylase activity (H4-K20 specific)(GO:0035575) |
| 0.3 | 2.3 | GO:0042030 | ATPase inhibitor activity(GO:0042030) |
| 0.3 | 3.2 | GO:0060002 | plus-end directed microfilament motor activity(GO:0060002) |
| 0.3 | 1.5 | GO:0000386 | second spliceosomal transesterification activity(GO:0000386) |
| 0.3 | 9.6 | GO:0005523 | tropomyosin binding(GO:0005523) |
| 0.3 | 0.8 | GO:0030617 | transforming growth factor beta receptor, inhibitory cytoplasmic mediator activity(GO:0030617) |
| 0.3 | 7.6 | GO:0017049 | GTP-Rho binding(GO:0017049) |
| 0.3 | 1.5 | GO:0016316 | phosphatidylinositol-3,4-bisphosphate 4-phosphatase activity(GO:0016316) inositol-1,3,4-trisphosphate 4-phosphatase activity(GO:0017161) inositol-3,4-bisphosphate 4-phosphatase activity(GO:0052828) |
| 0.3 | 2.3 | GO:0004563 | beta-N-acetylhexosaminidase activity(GO:0004563) |
| 0.3 | 1.0 | GO:0004310 | farnesyl-diphosphate farnesyltransferase activity(GO:0004310) squalene synthase activity(GO:0051996) |
| 0.2 | 0.7 | GO:0033149 | FFAT motif binding(GO:0033149) |
| 0.2 | 0.9 | GO:0090556 | apolipoprotein A-I receptor activity(GO:0034188) phosphatidylserine-translocating ATPase activity(GO:0090556) |
| 0.2 | 10.8 | GO:0051010 | microtubule plus-end binding(GO:0051010) |
| 0.2 | 1.6 | GO:0034046 | poly(G) binding(GO:0034046) |
| 0.2 | 17.9 | GO:0070888 | E-box binding(GO:0070888) |
| 0.2 | 2.3 | GO:0003876 | AMP deaminase activity(GO:0003876) adenosine-phosphate deaminase activity(GO:0047623) |
| 0.2 | 1.8 | GO:0008241 | peptidyl-dipeptidase activity(GO:0008241) |
| 0.2 | 3.5 | GO:0001758 | retinal dehydrogenase activity(GO:0001758) |
| 0.2 | 1.3 | GO:0004598 | peptidylglycine monooxygenase activity(GO:0004504) peptidylamidoglycolate lyase activity(GO:0004598) |
| 0.2 | 0.6 | GO:0061663 | NEDD8 ligase activity(GO:0061663) |
| 0.2 | 1.0 | GO:0071074 | eukaryotic initiation factor eIF2 binding(GO:0071074) |
| 0.2 | 1.2 | GO:0008195 | phosphatidate phosphatase activity(GO:0008195) |
| 0.2 | 2.1 | GO:0071532 | ankyrin repeat binding(GO:0071532) |
| 0.2 | 2.7 | GO:0038062 | protein tyrosine kinase collagen receptor activity(GO:0038062) |
| 0.2 | 1.2 | GO:0043426 | MRF binding(GO:0043426) |
| 0.2 | 7.5 | GO:0038191 | neuropilin binding(GO:0038191) |
| 0.2 | 1.6 | GO:0008525 | phosphatidylcholine transporter activity(GO:0008525) |
| 0.2 | 3.4 | GO:0001161 | intronic transcription regulatory region sequence-specific DNA binding(GO:0001161) intronic transcription regulatory region DNA binding(GO:0044213) |
| 0.2 | 2.2 | GO:0032050 | clathrin heavy chain binding(GO:0032050) |
| 0.2 | 1.2 | GO:0042577 | lipid phosphatase activity(GO:0042577) |
| 0.2 | 2.1 | GO:1990247 | N6-methyladenosine-containing RNA binding(GO:1990247) |
| 0.2 | 14.5 | GO:0050681 | androgen receptor binding(GO:0050681) |
| 0.1 | 0.6 | GO:0008260 | 3-oxoacid CoA-transferase activity(GO:0008260) |
| 0.1 | 0.6 | GO:0005026 | transforming growth factor beta receptor activity, type II(GO:0005026) |
| 0.1 | 3.3 | GO:0004691 | cAMP-dependent protein kinase activity(GO:0004691) |
| 0.1 | 2.7 | GO:0008140 | cAMP response element binding protein binding(GO:0008140) |
| 0.1 | 3.3 | GO:0015467 | G-protein activated inward rectifier potassium channel activity(GO:0015467) |
| 0.1 | 2.8 | GO:0008603 | cAMP-dependent protein kinase regulator activity(GO:0008603) |
| 0.1 | 0.7 | GO:0010465 | nerve growth factor receptor activity(GO:0010465) |
| 0.1 | 1.0 | GO:0047493 | sphingomyelin synthase activity(GO:0033188) ceramide cholinephosphotransferase activity(GO:0047493) |
| 0.1 | 5.3 | GO:0051428 | peptide hormone receptor binding(GO:0051428) |
| 0.1 | 0.6 | GO:0005173 | stem cell factor receptor binding(GO:0005173) |
| 0.1 | 1.5 | GO:0008142 | oxysterol binding(GO:0008142) |
| 0.1 | 4.1 | GO:0032452 | histone demethylase activity(GO:0032452) |
| 0.1 | 1.8 | GO:0042731 | PH domain binding(GO:0042731) |
| 0.1 | 3.1 | GO:0048156 | tau protein binding(GO:0048156) |
| 0.1 | 1.6 | GO:0071253 | connexin binding(GO:0071253) |
| 0.1 | 1.7 | GO:0071933 | Arp2/3 complex binding(GO:0071933) |
| 0.1 | 0.4 | GO:0031626 | beta-endorphin binding(GO:0031626) |
| 0.1 | 5.1 | GO:0005521 | lamin binding(GO:0005521) |
| 0.1 | 0.6 | GO:0008267 | poly-glutamine tract binding(GO:0008267) |
| 0.1 | 2.6 | GO:0032794 | GTPase activating protein binding(GO:0032794) |
| 0.1 | 1.3 | GO:0030280 | structural constituent of epidermis(GO:0030280) |
| 0.1 | 1.0 | GO:0050816 | phosphothreonine binding(GO:0050816) |
| 0.1 | 3.6 | GO:0035925 | mRNA 3'-UTR AU-rich region binding(GO:0035925) |
| 0.1 | 3.9 | GO:0016805 | dipeptidase activity(GO:0016805) |
| 0.1 | 0.5 | GO:1902379 | receptor tyrosine kinase-like orphan receptor binding(GO:0005115) chemoattractant activity involved in axon guidance(GO:1902379) |
| 0.1 | 2.0 | GO:0015194 | L-serine transmembrane transporter activity(GO:0015194) serine transmembrane transporter activity(GO:0022889) |
| 0.1 | 15.3 | GO:0031490 | chromatin DNA binding(GO:0031490) |
| 0.1 | 8.7 | GO:0001786 | phosphatidylserine binding(GO:0001786) |
| 0.1 | 3.2 | GO:0098641 | cadherin binding involved in cell-cell adhesion(GO:0098641) |
| 0.1 | 2.8 | GO:0044548 | S100 protein binding(GO:0044548) |
| 0.1 | 4.8 | GO:0005385 | zinc ion transmembrane transporter activity(GO:0005385) |
| 0.1 | 2.5 | GO:0008239 | dipeptidyl-peptidase activity(GO:0008239) |
| 0.1 | 0.3 | GO:0060001 | minus-end directed microfilament motor activity(GO:0060001) |
| 0.1 | 1.6 | GO:0005049 | nuclear export signal receptor activity(GO:0005049) |
| 0.1 | 1.2 | GO:0030911 | TPR domain binding(GO:0030911) |
| 0.1 | 0.6 | GO:0004694 | eukaryotic translation initiation factor 2alpha kinase activity(GO:0004694) |
| 0.1 | 4.5 | GO:0050431 | transforming growth factor beta binding(GO:0050431) |
| 0.1 | 0.5 | GO:0004105 | choline-phosphate cytidylyltransferase activity(GO:0004105) |
| 0.1 | 1.3 | GO:0035374 | chondroitin sulfate binding(GO:0035374) |
| 0.1 | 1.9 | GO:0008432 | JUN kinase binding(GO:0008432) |
| 0.1 | 1.7 | GO:0005537 | mannose binding(GO:0005537) |
| 0.1 | 0.6 | GO:0031730 | CCR5 chemokine receptor binding(GO:0031730) |
| 0.1 | 0.7 | GO:0048408 | epidermal growth factor binding(GO:0048408) |
| 0.1 | 1.7 | GO:0050321 | tau-protein kinase activity(GO:0050321) |
| 0.1 | 2.5 | GO:0017160 | Ral GTPase binding(GO:0017160) |
| 0.1 | 1.3 | GO:0016176 | superoxide-generating NADPH oxidase activator activity(GO:0016176) |
| 0.1 | 0.5 | GO:0070137 | ubiquitin-like protein-specific endopeptidase activity(GO:0070137) SUMO-specific endopeptidase activity(GO:0070139) |
| 0.1 | 1.2 | GO:0052629 | phosphatidylinositol-3,5-bisphosphate 3-phosphatase activity(GO:0052629) |
| 0.1 | 1.6 | GO:0070016 | armadillo repeat domain binding(GO:0070016) |
| 0.1 | 0.3 | GO:0019834 | phospholipase A2 inhibitor activity(GO:0019834) |
| 0.1 | 1.8 | GO:0004535 | poly(A)-specific ribonuclease activity(GO:0004535) |
| 0.1 | 0.4 | GO:0017050 | sphinganine kinase activity(GO:0008481) D-erythro-sphingosine kinase activity(GO:0017050) |
| 0.1 | 1.6 | GO:0034237 | protein kinase A regulatory subunit binding(GO:0034237) |
| 0.1 | 2.5 | GO:0004653 | polypeptide N-acetylgalactosaminyltransferase activity(GO:0004653) |
| 0.1 | 0.4 | GO:0042835 | BRE binding(GO:0042835) |
| 0.1 | 0.6 | GO:0010859 | calcium-dependent cysteine-type endopeptidase inhibitor activity(GO:0010859) |
| 0.1 | 0.4 | GO:0004594 | pantothenate kinase activity(GO:0004594) |
| 0.1 | 2.4 | GO:0005085 | guanyl-nucleotide exchange factor activity(GO:0005085) |
| 0.1 | 0.7 | GO:1990380 | Lys48-specific deubiquitinase activity(GO:1990380) |
| 0.1 | 0.3 | GO:0004616 | phosphogluconate dehydrogenase (decarboxylating) activity(GO:0004616) |
| 0.1 | 0.4 | GO:0005119 | smoothened binding(GO:0005119) |
| 0.0 | 0.2 | GO:0008336 | gamma-butyrobetaine dioxygenase activity(GO:0008336) |
| 0.0 | 2.7 | GO:0003785 | actin monomer binding(GO:0003785) |
| 0.0 | 0.3 | GO:0019788 | NEDD8 transferase activity(GO:0019788) |
| 0.0 | 0.4 | GO:0035800 | deubiquitinase activator activity(GO:0035800) |
| 0.0 | 0.4 | GO:0008449 | N-acetylglucosamine-6-sulfatase activity(GO:0008449) |
| 0.0 | 1.4 | GO:0001223 | transcription coactivator binding(GO:0001223) |
| 0.0 | 1.7 | GO:0097200 | cysteine-type endopeptidase activity involved in execution phase of apoptosis(GO:0097200) |
| 0.0 | 2.2 | GO:0030332 | cyclin binding(GO:0030332) |
| 0.0 | 2.5 | GO:0000987 | RNA polymerase II core promoter proximal region sequence-specific DNA binding(GO:0000978) core promoter proximal region sequence-specific DNA binding(GO:0000987) core promoter proximal region DNA binding(GO:0001159) |
| 0.0 | 0.5 | GO:0009881 | photoreceptor activity(GO:0009881) |
| 0.0 | 0.3 | GO:0004647 | phosphoserine phosphatase activity(GO:0004647) |
| 0.0 | 0.5 | GO:0097016 | L27 domain binding(GO:0097016) |
| 0.0 | 0.8 | GO:0015280 | ligand-gated sodium channel activity(GO:0015280) |
| 0.0 | 0.3 | GO:0034236 | protein kinase A catalytic subunit binding(GO:0034236) |
| 0.0 | 0.1 | GO:0042134 | rRNA primary transcript binding(GO:0042134) |
| 0.0 | 0.4 | GO:0015501 | glutamate:sodium symporter activity(GO:0015501) |
| 0.0 | 1.2 | GO:0000062 | fatty-acyl-CoA binding(GO:0000062) |
| 0.0 | 0.5 | GO:0003964 | telomerase activity(GO:0003720) RNA-directed DNA polymerase activity(GO:0003964) |
| 0.0 | 0.5 | GO:0003810 | protein-glutamine gamma-glutamyltransferase activity(GO:0003810) |
| 0.0 | 0.2 | GO:0004709 | MAP kinase kinase kinase activity(GO:0004709) |
| 0.0 | 0.2 | GO:0003953 | NAD+ nucleosidase activity(GO:0003953) |
| 0.0 | 0.4 | GO:0031697 | beta-1 adrenergic receptor binding(GO:0031697) |
| 0.0 | 0.4 | GO:0016015 | morphogen activity(GO:0016015) |
| 0.0 | 0.2 | GO:0045294 | alpha-catenin binding(GO:0045294) |
| 0.0 | 0.5 | GO:0001075 | transcription factor activity, RNA polymerase II core promoter sequence-specific binding involved in preinitiation complex assembly(GO:0001075) |
| 0.0 | 9.7 | GO:0004252 | serine-type endopeptidase activity(GO:0004252) |
| 0.0 | 0.5 | GO:0016018 | cyclosporin A binding(GO:0016018) |
| 0.0 | 1.3 | GO:0015175 | neutral amino acid transmembrane transporter activity(GO:0015175) |
| 0.0 | 2.1 | GO:0018024 | histone-lysine N-methyltransferase activity(GO:0018024) |
| 0.0 | 3.0 | GO:0004004 | ATP-dependent RNA helicase activity(GO:0004004) |
| 0.0 | 0.4 | GO:0070878 | primary miRNA binding(GO:0070878) |
| 0.0 | 3.0 | GO:0017048 | Rho GTPase binding(GO:0017048) |
| 0.0 | 0.6 | GO:0005095 | GTPase inhibitor activity(GO:0005095) |
| 0.0 | 0.1 | GO:0004818 | glutamate-tRNA ligase activity(GO:0004818) |
| 0.0 | 1.1 | GO:0017025 | TBP-class protein binding(GO:0017025) |
| 0.0 | 0.1 | GO:0004031 | aldehyde oxidase activity(GO:0004031) |
| 0.0 | 0.6 | GO:0033130 | acetylcholine receptor binding(GO:0033130) |
| 0.0 | 2.5 | GO:0019003 | GDP binding(GO:0019003) |
| 0.0 | 0.5 | GO:0004526 | ribonuclease P activity(GO:0004526) |
| 0.0 | 0.5 | GO:0086080 | protein binding involved in heterotypic cell-cell adhesion(GO:0086080) |
| 0.0 | 0.8 | GO:0017056 | structural constituent of nuclear pore(GO:0017056) |
| 0.0 | 0.1 | GO:1904713 | beta-catenin destruction complex binding(GO:1904713) |
| 0.0 | 14.1 | GO:0045296 | cadherin binding(GO:0045296) |
| 0.0 | 3.7 | GO:0004386 | helicase activity(GO:0004386) |
| 0.0 | 0.3 | GO:0004652 | polynucleotide adenylyltransferase activity(GO:0004652) |
| 0.0 | 0.2 | GO:0004499 | N,N-dimethylaniline monooxygenase activity(GO:0004499) |
| 0.0 | 0.2 | GO:0042608 | T cell receptor binding(GO:0042608) |
| 0.0 | 0.2 | GO:0003872 | 6-phosphofructokinase activity(GO:0003872) |
| 0.0 | 0.1 | GO:0004719 | protein-L-isoaspartate (D-aspartate) O-methyltransferase activity(GO:0004719) |
| 0.0 | 0.7 | GO:0071889 | 14-3-3 protein binding(GO:0071889) |
| 0.0 | 0.1 | GO:0034584 | piRNA binding(GO:0034584) |
| 0.0 | 0.9 | GO:0001972 | retinoic acid binding(GO:0001972) |
| 0.0 | 0.3 | GO:0019871 | sodium channel inhibitor activity(GO:0019871) |
| 0.0 | 0.6 | GO:0043325 | phosphatidylinositol-3,4-bisphosphate binding(GO:0043325) |
| 0.0 | 0.1 | GO:0004877 | complement component C4b binding(GO:0001855) complement component C4b receptor activity(GO:0001861) complement component C3b receptor activity(GO:0004877) |
| 0.0 | 0.2 | GO:0004839 | ubiquitin activating enzyme activity(GO:0004839) |
| 0.0 | 0.2 | GO:0030267 | hydroxypyruvate reductase activity(GO:0016618) glyoxylate reductase (NADP) activity(GO:0030267) |
| 0.0 | 0.7 | GO:0070577 | lysine-acetylated histone binding(GO:0070577) |
| 0.0 | 0.9 | GO:0019894 | kinesin binding(GO:0019894) |
| 0.0 | 0.4 | GO:0043027 | cysteine-type endopeptidase inhibitor activity involved in apoptotic process(GO:0043027) |
| 0.0 | 0.4 | GO:0032041 | histone deacetylase activity (H3-K14 specific)(GO:0031078) NAD-dependent histone deacetylase activity (H3-K14 specific)(GO:0032041) |
| 0.0 | 0.5 | GO:0070628 | proteasome binding(GO:0070628) |
| 0.0 | 0.8 | GO:0042169 | SH2 domain binding(GO:0042169) |
| 0.0 | 0.4 | GO:0008392 | arachidonic acid monooxygenase activity(GO:0008391) arachidonic acid epoxygenase activity(GO:0008392) |
| 0.0 | 0.7 | GO:0008198 | ferrous iron binding(GO:0008198) |
| 0.0 | 0.3 | GO:0017154 | semaphorin receptor activity(GO:0017154) |
| 0.0 | 0.5 | GO:0061631 | ubiquitin conjugating enzyme activity(GO:0061631) ubiquitin-like protein conjugating enzyme activity(GO:0061650) |
| 0.0 | 0.2 | GO:0005547 | phosphatidylinositol-3,4,5-trisphosphate binding(GO:0005547) |
| 0.0 | 0.2 | GO:0003906 | DNA-(apurinic or apyrimidinic site) lyase activity(GO:0003906) |
| 0.0 | 0.1 | GO:0003726 | double-stranded RNA adenosine deaminase activity(GO:0003726) |
| 0.0 | 0.1 | GO:0050659 | N-acetylgalactosamine 4-sulfate 6-O-sulfotransferase activity(GO:0050659) |
| 0.0 | 0.4 | GO:0030676 | Rac guanyl-nucleotide exchange factor activity(GO:0030676) |
| 0.0 | 3.7 | GO:0008022 | protein C-terminus binding(GO:0008022) |
| 0.0 | 0.3 | GO:0005212 | structural constituent of eye lens(GO:0005212) |
| 0.0 | 0.4 | GO:0017166 | vinculin binding(GO:0017166) |
| 0.0 | 0.2 | GO:0022833 | mechanically-gated ion channel activity(GO:0008381) mechanically gated channel activity(GO:0022833) |
| 0.0 | 4.5 | GO:0061630 | ubiquitin protein ligase activity(GO:0061630) |
| 0.0 | 0.2 | GO:0098748 | clathrin adaptor activity(GO:0035615) endocytic adaptor activity(GO:0098748) |
| 0.0 | 1.7 | GO:0036459 | thiol-dependent ubiquitinyl hydrolase activity(GO:0036459) |
| 0.0 | 4.2 | GO:0004842 | ubiquitin-protein transferase activity(GO:0004842) |
| 0.0 | 0.3 | GO:0008139 | nuclear localization sequence binding(GO:0008139) |
| 0.0 | 0.2 | GO:0043395 | heparan sulfate proteoglycan binding(GO:0043395) |
| 0.0 | 0.1 | GO:0042975 | peroxisome proliferator activated receptor binding(GO:0042975) |
| 0.0 | 0.2 | GO:0042923 | neuropeptide binding(GO:0042923) |
| 0.0 | 0.1 | GO:0004013 | adenosylhomocysteinase activity(GO:0004013) trialkylsulfonium hydrolase activity(GO:0016802) |
| 0.0 | 0.0 | GO:0008479 | queuine tRNA-ribosyltransferase activity(GO:0008479) |
| 0.0 | 0.2 | GO:0005041 | low-density lipoprotein receptor activity(GO:0005041) |
| 0.0 | 0.3 | GO:0000993 | RNA polymerase II core binding(GO:0000993) |
| 0.0 | 0.7 | GO:0042393 | histone binding(GO:0042393) |
| 0.0 | 0.0 | GO:0070653 | high-density lipoprotein particle receptor binding(GO:0070653) |
| 0.0 | 0.2 | GO:0005092 | GDP-dissociation inhibitor activity(GO:0005092) |
Gene overrepresentation in C2:CP category:
| Log-likelihood per target | Total log-likelihood | Term | Description |
|---|---|---|---|
| 0.2 | 7.5 | PID CIRCADIAN PATHWAY | Circadian rhythm pathway |
| 0.2 | 11.4 | PID MYC PATHWAY | C-MYC pathway |
| 0.1 | 4.9 | PID INTEGRIN A9B1 PATHWAY | Alpha9 beta1 integrin signaling events |
| 0.1 | 11.8 | PID INTEGRIN A4B1 PATHWAY | Alpha4 beta1 integrin signaling events |
| 0.1 | 4.9 | PID HEDGEHOG 2PATHWAY | Signaling events mediated by the Hedgehog family |
| 0.1 | 11.8 | PID ECADHERIN NASCENT AJ PATHWAY | E-cadherin signaling in the nascent adherens junction |
| 0.1 | 21.6 | PID MYC REPRESS PATHWAY | Validated targets of C-MYC transcriptional repression |
| 0.1 | 7.6 | PID AVB3 OPN PATHWAY | Osteopontin-mediated events |
| 0.1 | 3.0 | SA PTEN PATHWAY | PTEN is a tumor suppressor that dephosphorylates the lipid messenger phosphatidylinositol triphosphate. |
| 0.1 | 1.9 | ST G ALPHA S PATHWAY | G alpha s Pathway |
| 0.1 | 2.3 | PID WNT CANONICAL PATHWAY | Canonical Wnt signaling pathway |
| 0.1 | 2.2 | PID VEGFR1 PATHWAY | VEGFR1 specific signals |
| 0.1 | 1.7 | SA CASPASE CASCADE | Apoptosis is mediated by caspases, cysteine proteases arranged in a proteolytic cascade. |
| 0.1 | 0.5 | ST JNK MAPK PATHWAY | JNK MAPK Pathway |
| 0.1 | 2.5 | ST TUMOR NECROSIS FACTOR PATHWAY | Tumor Necrosis Factor Pathway. |
| 0.1 | 4.2 | PID TGFBR PATHWAY | TGF-beta receptor signaling |
| 0.1 | 1.0 | PID INTEGRIN4 PATHWAY | Alpha6 beta4 integrin-ligand interactions |
| 0.0 | 1.9 | ST PHOSPHOINOSITIDE 3 KINASE PATHWAY | PI3K Pathway |
| 0.0 | 0.6 | ST IL 13 PATHWAY | Interleukin 13 (IL-13) Pathway |
| 0.0 | 11.6 | NABA ECM AFFILIATED | Genes encoding proteins affiliated structurally or functionally to extracellular matrix proteins |
| 0.0 | 1.5 | PID HNF3A PATHWAY | FOXA1 transcription factor network |
| 0.0 | 2.1 | PID DELTA NP63 PATHWAY | Validated transcriptional targets of deltaNp63 isoforms |
| 0.0 | 0.5 | PID P38 ALPHA BETA PATHWAY | Regulation of p38-alpha and p38-beta |
| 0.0 | 1.8 | PID RETINOIC ACID PATHWAY | Retinoic acid receptors-mediated signaling |
| 0.0 | 0.7 | PID RANBP2 PATHWAY | Sumoylation by RanBP2 regulates transcriptional repression |
| 0.0 | 1.3 | PID CDC42 REG PATHWAY | Regulation of CDC42 activity |
| 0.0 | 2.9 | PID CASPASE PATHWAY | Caspase cascade in apoptosis |
| 0.0 | 1.9 | SIG PIP3 SIGNALING IN CARDIAC MYOCTES | Genes related to PIP3 signaling in cardiac myocytes |
| 0.0 | 1.1 | PID NFKAPPAB CANONICAL PATHWAY | Canonical NF-kappaB pathway |
| 0.0 | 1.5 | PID KIT PATHWAY | Signaling events mediated by Stem cell factor receptor (c-Kit) |
| 0.0 | 2.5 | PID PLK1 PATHWAY | PLK1 signaling events |
| 0.0 | 3.0 | PID TELOMERASE PATHWAY | Regulation of Telomerase |
| 0.0 | 1.8 | PID P53 REGULATION PATHWAY | p53 pathway |
| 0.0 | 1.2 | PID FGF PATHWAY | FGF signaling pathway |
| 0.0 | 2.0 | PID REG GR PATHWAY | Glucocorticoid receptor regulatory network |
| 0.0 | 0.7 | PID ARF 3PATHWAY | Arf1 pathway |
| 0.0 | 1.1 | SIG BCR SIGNALING PATHWAY | Members of the BCR signaling pathway |
| 0.0 | 3.1 | PID ERBB1 DOWNSTREAM PATHWAY | ErbB1 downstream signaling |
| 0.0 | 0.4 | PID FOXO PATHWAY | FoxO family signaling |
| 0.0 | 0.4 | PID S1P S1P1 PATHWAY | S1P1 pathway |
| 0.0 | 0.6 | PID HES HEY PATHWAY | Notch-mediated HES/HEY network |
| 0.0 | 0.6 | PID TAP63 PATHWAY | Validated transcriptional targets of TAp63 isoforms |
| 0.0 | 1.2 | PID NOTCH PATHWAY | Notch signaling pathway |
| 0.0 | 1.5 | PID BETA CATENIN NUC PATHWAY | Regulation of nuclear beta catenin signaling and target gene transcription |
| 0.0 | 0.2 | PID IL8 CXCR2 PATHWAY | IL8- and CXCR2-mediated signaling events |
| 0.0 | 1.2 | PID P53 DOWNSTREAM PATHWAY | Direct p53 effectors |
| 0.0 | 0.6 | PID AJDISS 2PATHWAY | Posttranslational regulation of adherens junction stability and dissassembly |
Gene overrepresentation in C2:CP:REACTOME category:
| Log-likelihood per target | Total log-likelihood | Term | Description |
|---|---|---|---|
| 0.3 | 7.0 | REACTOME ACTIVATION OF CHAPERONES BY ATF6 ALPHA | Genes involved in Activation of Chaperones by ATF6-alpha |
| 0.3 | 6.5 | REACTOME THE NLRP3 INFLAMMASOME | Genes involved in The NLRP3 inflammasome |
| 0.2 | 5.8 | REACTOME DESTABILIZATION OF MRNA BY BRF1 | Genes involved in Destabilization of mRNA by Butyrate Response Factor 1 (BRF1) |
| 0.2 | 3.8 | REACTOME SYNTHESIS OF PIPS AT THE EARLY ENDOSOME MEMBRANE | Genes involved in Synthesis of PIPs at the early endosome membrane |
| 0.2 | 2.4 | REACTOME SIGNALING BY ACTIVATED POINT MUTANTS OF FGFR1 | Genes involved in Signaling by activated point mutants of FGFR1 |
| 0.1 | 1.2 | REACTOME SOS MEDIATED SIGNALLING | Genes involved in SOS-mediated signalling |
| 0.1 | 3.6 | REACTOME REGULATION OF RHEB GTPASE ACTIVITY BY AMPK | Genes involved in Regulation of Rheb GTPase activity by AMPK |
| 0.1 | 3.2 | REACTOME APOPTOTIC CLEAVAGE OF CELL ADHESION PROTEINS | Genes involved in Apoptotic cleavage of cell adhesion proteins |
| 0.1 | 4.8 | REACTOME ZINC TRANSPORTERS | Genes involved in Zinc transporters |
| 0.1 | 2.5 | REACTOME SIGNALLING TO P38 VIA RIT AND RIN | Genes involved in Signalling to p38 via RIT and RIN |
| 0.1 | 2.7 | REACTOME ACTIVATION OF THE AP1 FAMILY OF TRANSCRIPTION FACTORS | Genes involved in Activation of the AP-1 family of transcription factors |
| 0.1 | 4.3 | REACTOME SYNTHESIS OF VERY LONG CHAIN FATTY ACYL COAS | Genes involved in Synthesis of very long-chain fatty acyl-CoAs |
| 0.1 | 7.5 | REACTOME BMAL1 CLOCK NPAS2 ACTIVATES CIRCADIAN EXPRESSION | Genes involved in BMAL1:CLOCK/NPAS2 Activates Circadian Expression |
| 0.1 | 5.3 | REACTOME PKA MEDIATED PHOSPHORYLATION OF CREB | Genes involved in PKA-mediated phosphorylation of CREB |
| 0.1 | 3.9 | REACTOME SEMA3A PAK DEPENDENT AXON REPULSION | Genes involved in Sema3A PAK dependent Axon repulsion |
| 0.1 | 0.7 | REACTOME SHC MEDIATED SIGNALLING | Genes involved in SHC-mediated signalling |
| 0.1 | 11.1 | REACTOME CYCLIN E ASSOCIATED EVENTS DURING G1 S TRANSITION | Genes involved in Cyclin E associated events during G1/S transition |
| 0.1 | 2.6 | REACTOME SYNTHESIS OF PE | Genes involved in Synthesis of PE |
| 0.1 | 2.9 | REACTOME OTHER SEMAPHORIN INTERACTIONS | Genes involved in Other semaphorin interactions |
| 0.1 | 6.6 | REACTOME SMOOTH MUSCLE CONTRACTION | Genes involved in Smooth Muscle Contraction |
| 0.1 | 9.9 | REACTOME MEIOTIC SYNAPSIS | Genes involved in Meiotic Synapsis |
| 0.1 | 2.0 | REACTOME RECRUITMENT OF NUMA TO MITOTIC CENTROSOMES | Genes involved in Recruitment of NuMA to mitotic centrosomes |
| 0.1 | 1.3 | REACTOME ELEVATION OF CYTOSOLIC CA2 LEVELS | Genes involved in Elevation of cytosolic Ca2+ levels |
| 0.1 | 2.3 | REACTOME PURINE SALVAGE | Genes involved in Purine salvage |
| 0.1 | 2.6 | REACTOME DCC MEDIATED ATTRACTIVE SIGNALING | Genes involved in DCC mediated attractive signaling |
| 0.1 | 3.5 | REACTOME PIP3 ACTIVATES AKT SIGNALING | Genes involved in PIP3 activates AKT signaling |
| 0.1 | 0.6 | REACTOME LYSOSOME VESICLE BIOGENESIS | Genes involved in Lysosome Vesicle Biogenesis |
| 0.1 | 2.9 | REACTOME NETRIN1 SIGNALING | Genes involved in Netrin-1 signaling |
| 0.1 | 1.3 | REACTOME CRMPS IN SEMA3A SIGNALING | Genes involved in CRMPs in Sema3A signaling |
| 0.1 | 1.9 | REACTOME G0 AND EARLY G1 | Genes involved in G0 and Early G1 |
| 0.1 | 0.9 | REACTOME TRANSCRIPTIONAL REGULATION OF WHITE ADIPOCYTE DIFFERENTIATION | Genes involved in Transcriptional Regulation of White Adipocyte Differentiation |
| 0.1 | 6.8 | REACTOME GOLGI ASSOCIATED VESICLE BIOGENESIS | Genes involved in Golgi Associated Vesicle Biogenesis |
| 0.1 | 3.3 | REACTOME INHIBITION OF VOLTAGE GATED CA2 CHANNELS VIA GBETA GAMMA SUBUNITS | Genes involved in Inhibition of voltage gated Ca2+ channels via Gbeta/gamma subunits |
| 0.1 | 0.9 | REACTOME MRNA DECAY BY 5 TO 3 EXORIBONUCLEASE | Genes involved in mRNA Decay by 5' to 3' Exoribonuclease |
| 0.1 | 1.4 | REACTOME CREB PHOSPHORYLATION THROUGH THE ACTIVATION OF CAMKII | Genes involved in CREB phosphorylation through the activation of CaMKII |
| 0.1 | 6.2 | REACTOME INTERFERON GAMMA SIGNALING | Genes involved in Interferon gamma signaling |
| 0.0 | 2.5 | REACTOME SIGNALING BY ROBO RECEPTOR | Genes involved in Signaling by Robo receptor |
| 0.0 | 1.8 | REACTOME REGULATION OF MRNA STABILITY BY PROTEINS THAT BIND AU RICH ELEMENTS | Genes involved in Regulation of mRNA Stability by Proteins that Bind AU-rich Elements |
| 0.0 | 1.6 | REACTOME CELL EXTRACELLULAR MATRIX INTERACTIONS | Genes involved in Cell-extracellular matrix interactions |
| 0.0 | 1.5 | REACTOME DEGRADATION OF THE EXTRACELLULAR MATRIX | Genes involved in Degradation of the extracellular matrix |
| 0.0 | 1.7 | REACTOME CASPASE MEDIATED CLEAVAGE OF CYTOSKELETAL PROTEINS | Genes involved in Caspase-mediated cleavage of cytoskeletal proteins |
| 0.0 | 2.1 | REACTOME DEADENYLATION OF MRNA | Genes involved in Deadenylation of mRNA |
| 0.0 | 1.0 | REACTOME APOPTOTIC CLEAVAGE OF CELLULAR PROTEINS | Genes involved in Apoptotic cleavage of cellular proteins |
| 0.0 | 2.1 | REACTOME SPHINGOLIPID DE NOVO BIOSYNTHESIS | Genes involved in Sphingolipid de novo biosynthesis |
| 0.0 | 6.1 | REACTOME PPARA ACTIVATES GENE EXPRESSION | Genes involved in PPARA Activates Gene Expression |
| 0.0 | 0.9 | REACTOME GAP JUNCTION ASSEMBLY | Genes involved in Gap junction assembly |
| 0.0 | 1.8 | REACTOME STEROID HORMONES | Genes involved in Steroid hormones |
| 0.0 | 1.7 | REACTOME SIGNALING BY BMP | Genes involved in Signaling by BMP |
| 0.0 | 0.6 | REACTOME PERK REGULATED GENE EXPRESSION | Genes involved in PERK regulated gene expression |
| 0.0 | 1.7 | REACTOME SYNTHESIS OF PIPS AT THE PLASMA MEMBRANE | Genes involved in Synthesis of PIPs at the plasma membrane |
| 0.0 | 1.5 | REACTOME KINESINS | Genes involved in Kinesins |
| 0.0 | 0.5 | REACTOME CREB PHOSPHORYLATION THROUGH THE ACTIVATION OF RAS | Genes involved in CREB phosphorylation through the activation of Ras |
| 0.0 | 0.9 | REACTOME BRANCHED CHAIN AMINO ACID CATABOLISM | Genes involved in Branched-chain amino acid catabolism |
| 0.0 | 3.1 | REACTOME O LINKED GLYCOSYLATION OF MUCINS | Genes involved in O-linked glycosylation of mucins |
| 0.0 | 3.6 | REACTOME CLASS B 2 SECRETIN FAMILY RECEPTORS | Genes involved in Class B/2 (Secretin family receptors) |
| 0.0 | 0.5 | REACTOME GAP JUNCTION DEGRADATION | Genes involved in Gap junction degradation |
| 0.0 | 0.4 | REACTOME TRAF6 MEDIATED IRF7 ACTIVATION | Genes involved in TRAF6 mediated IRF7 activation |
| 0.0 | 0.6 | REACTOME TGF BETA RECEPTOR SIGNALING IN EMT EPITHELIAL TO MESENCHYMAL TRANSITION | Genes involved in TGF-beta receptor signaling in EMT (epithelial to mesenchymal transition) |
| 0.0 | 0.5 | REACTOME SYNTHESIS OF PC | Genes involved in Synthesis of PC |
| 0.0 | 1.4 | REACTOME MYOGENESIS | Genes involved in Myogenesis |
| 0.0 | 0.7 | REACTOME NEGATIVE REGULATORS OF RIG I MDA5 SIGNALING | Genes involved in Negative regulators of RIG-I/MDA5 signaling |
| 0.0 | 0.8 | REACTOME NEP NS2 INTERACTS WITH THE CELLULAR EXPORT MACHINERY | Genes involved in NEP/NS2 Interacts with the Cellular Export Machinery |
| 0.0 | 4.1 | REACTOME ANTIGEN PROCESSING UBIQUITINATION PROTEASOME DEGRADATION | Genes involved in Antigen processing: Ubiquitination & Proteasome degradation |
| 0.0 | 0.5 | REACTOME INFLUENZA VIRAL RNA TRANSCRIPTION AND REPLICATION | Genes involved in Influenza Viral RNA Transcription and Replication |
| 0.0 | 0.5 | REACTOME RNA POL II TRANSCRIPTION PRE INITIATION AND PROMOTER OPENING | Genes involved in RNA Polymerase II Transcription Pre-Initiation And Promoter Opening |
| 0.0 | 0.3 | REACTOME PROCESSING OF INTRONLESS PRE MRNAS | Genes involved in Processing of Intronless Pre-mRNAs |
| 0.0 | 1.5 | REACTOME MRNA SPLICING | Genes involved in mRNA Splicing |
| 0.0 | 1.3 | REACTOME MITOTIC PROMETAPHASE | Genes involved in Mitotic Prometaphase |
| 0.0 | 2.5 | REACTOME NONSENSE MEDIATED DECAY ENHANCED BY THE EXON JUNCTION COMPLEX | Genes involved in Nonsense Mediated Decay Enhanced by the Exon Junction Complex |
| 0.0 | 1.2 | REACTOME G ALPHA1213 SIGNALLING EVENTS | Genes involved in G alpha (12/13) signalling events |
| 0.0 | 0.2 | REACTOME BASE FREE SUGAR PHOSPHATE REMOVAL VIA THE SINGLE NUCLEOTIDE REPLACEMENT PATHWAY | Genes involved in Base-free sugar-phosphate removal via the single-nucleotide replacement pathway |
| 0.0 | 0.3 | REACTOME RNA POL III TRANSCRIPTION INITIATION FROM TYPE 3 PROMOTER | Genes involved in RNA Polymerase III Transcription Initiation From Type 3 Promoter |