Project
SARS-CoV-2 Analysis Results (GEO series: GSE147507)
Navigation
Downloads
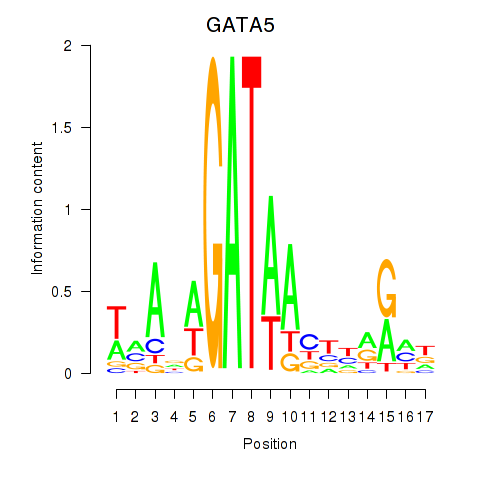
Results for GATA5
Z-value: 0.90
Motif logo
Transcription factors associated with GATA5
| Gene Symbol | Gene ID | Gene Info |
|---|---|---|
|
GATA5
|
ENSG00000130700.6 | GATA binding protein 5 |
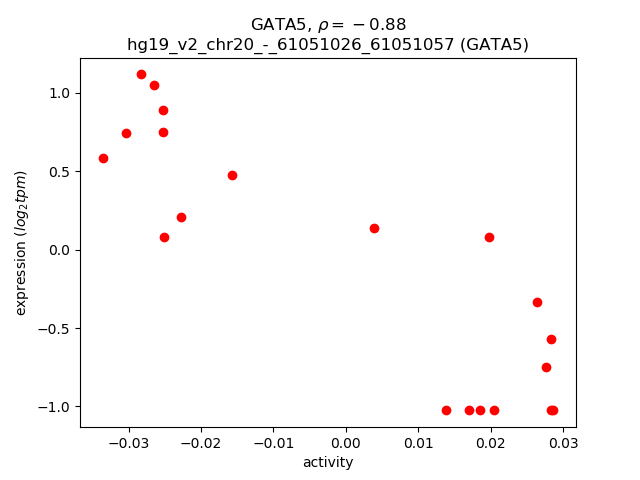
Activity-expression correlation:
| Gene | Promoter | Pearson corr. coef. | P-value | Plot |
|---|---|---|---|---|
| GATA5 | hg19_v2_chr20_-_61051026_61051057 | -0.88 | 3.6e-07 | Click! |
Activity profile of GATA5 motif
Sorted Z-values of GATA5 motif
| Promoter | Log-likelihood | Transcript | Gene | Gene Info |
|---|---|---|---|---|
| chr1_+_79115503 | 2.93 |
ENST00000370747.4
ENST00000438486.1 ENST00000545124.1 |
IFI44
|
interferon-induced protein 44 |
| chr4_-_110723134 | 2.59 |
ENST00000510800.1
ENST00000512148.1 |
CFI
|
complement factor I |
| chr5_+_147443534 | 2.26 |
ENST00000398454.1
ENST00000359874.3 ENST00000508733.1 ENST00000256084.7 |
SPINK5
|
serine peptidase inhibitor, Kazal type 5 |
| chr10_+_118187379 | 2.17 |
ENST00000369230.3
|
PNLIPRP3
|
pancreatic lipase-related protein 3 |
| chr4_-_110723335 | 2.12 |
ENST00000394634.2
|
CFI
|
complement factor I |
| chr3_+_118905564 | 2.03 |
ENST00000460625.1
|
UPK1B
|
uroplakin 1B |
| chr17_-_74639886 | 1.97 |
ENST00000156626.7
|
ST6GALNAC1
|
ST6 (alpha-N-acetyl-neuraminyl-2,3-beta-galactosyl-1,3)-N-acetylgalactosaminide alpha-2,6-sialyltransferase 1 |
| chr4_-_110723194 | 1.96 |
ENST00000394635.3
|
CFI
|
complement factor I |
| chrX_-_73061339 | 1.74 |
ENST00000602863.1
|
XIST
|
X inactive specific transcript (non-protein coding) |
| chr21_+_39668478 | 1.72 |
ENST00000398927.1
|
KCNJ15
|
potassium inwardly-rectifying channel, subfamily J, member 15 |
| chr1_+_174844645 | 1.69 |
ENST00000486220.1
|
RABGAP1L
|
RAB GTPase activating protein 1-like |
| chr6_+_106988986 | 1.65 |
ENST00000457437.1
ENST00000535438.1 |
AIM1
|
absent in melanoma 1 |
| chr6_+_31916733 | 1.60 |
ENST00000483004.1
|
CFB
|
complement factor B |
| chrM_+_3299 | 1.48 |
ENST00000361390.2
|
MT-ND1
|
mitochondrially encoded NADH dehydrogenase 1 |
| chrM_+_10053 | 1.33 |
ENST00000361227.2
|
MT-ND3
|
mitochondrially encoded NADH dehydrogenase 3 |
| chr10_-_98031265 | 1.14 |
ENST00000224337.5
ENST00000371176.2 |
BLNK
|
B-cell linker |
| chrM_+_10758 | 1.10 |
ENST00000361381.2
|
MT-ND4
|
mitochondrially encoded NADH dehydrogenase 4 |
| chr20_+_22034809 | 1.10 |
ENST00000449427.1
|
RP11-125P18.1
|
RP11-125P18.1 |
| chr14_-_61748550 | 0.97 |
ENST00000555868.1
|
TMEM30B
|
transmembrane protein 30B |
| chr13_-_46756351 | 0.94 |
ENST00000323076.2
|
LCP1
|
lymphocyte cytosolic protein 1 (L-plastin) |
| chr1_+_24645807 | 0.94 |
ENST00000361548.4
|
GRHL3
|
grainyhead-like 3 (Drosophila) |
| chr1_+_24645865 | 0.92 |
ENST00000342072.4
|
GRHL3
|
grainyhead-like 3 (Drosophila) |
| chr4_-_47983519 | 0.84 |
ENST00000358519.4
ENST00000544810.1 ENST00000402813.3 |
CNGA1
|
cyclic nucleotide gated channel alpha 1 |
| chr1_+_104159999 | 0.83 |
ENST00000414303.2
ENST00000423678.1 |
AMY2A
|
amylase, alpha 2A (pancreatic) |
| chr8_-_97247759 | 0.82 |
ENST00000518406.1
ENST00000523920.1 ENST00000287022.5 |
UQCRB
|
ubiquinol-cytochrome c reductase binding protein |
| chr5_-_39270725 | 0.77 |
ENST00000512138.1
ENST00000512982.1 ENST00000540520.1 |
FYB
|
FYN binding protein |
| chr1_-_27481401 | 0.76 |
ENST00000263980.3
|
SLC9A1
|
solute carrier family 9, subfamily A (NHE1, cation proton antiporter 1), member 1 |
| chrM_+_10464 | 0.76 |
ENST00000361335.1
|
MT-ND4L
|
mitochondrially encoded NADH dehydrogenase 4L |
| chr11_-_33891362 | 0.75 |
ENST00000395833.3
|
LMO2
|
LIM domain only 2 (rhombotin-like 1) |
| chr14_+_61995722 | 0.75 |
ENST00000556347.1
|
RP11-47I22.4
|
RP11-47I22.4 |
| chr4_-_83769996 | 0.70 |
ENST00000511338.1
|
SEC31A
|
SEC31 homolog A (S. cerevisiae) |
| chr11_-_61734599 | 0.68 |
ENST00000532601.1
|
FTH1
|
ferritin, heavy polypeptide 1 |
| chr2_+_182850551 | 0.68 |
ENST00000452904.1
ENST00000409137.3 ENST00000280295.3 |
PPP1R1C
|
protein phosphatase 1, regulatory (inhibitor) subunit 1C |
| chr4_-_83765613 | 0.67 |
ENST00000503937.1
|
SEC31A
|
SEC31 homolog A (S. cerevisiae) |
| chr2_+_102615416 | 0.67 |
ENST00000393414.2
|
IL1R2
|
interleukin 1 receptor, type II |
| chr1_+_24645915 | 0.65 |
ENST00000350501.5
|
GRHL3
|
grainyhead-like 3 (Drosophila) |
| chr3_+_177545563 | 0.64 |
ENST00000434309.1
|
RP11-91K9.1
|
RP11-91K9.1 |
| chr19_-_19739321 | 0.64 |
ENST00000588461.1
|
LPAR2
|
lysophosphatidic acid receptor 2 |
| chr3_-_183145873 | 0.63 |
ENST00000447025.2
ENST00000414362.2 ENST00000328913.3 |
MCF2L2
|
MCF.2 cell line derived transforming sequence-like 2 |
| chr1_+_150954493 | 0.63 |
ENST00000368947.4
|
ANXA9
|
annexin A9 |
| chr5_+_145316120 | 0.62 |
ENST00000359120.4
|
SH3RF2
|
SH3 domain containing ring finger 2 |
| chr1_-_100643765 | 0.62 |
ENST00000370137.1
ENST00000370138.1 ENST00000342895.3 |
LRRC39
|
leucine rich repeat containing 39 |
| chr17_-_74639730 | 0.60 |
ENST00000589992.1
|
ST6GALNAC1
|
ST6 (alpha-N-acetyl-neuraminyl-2,3-beta-galactosyl-1,3)-N-acetylgalactosaminide alpha-2,6-sialyltransferase 1 |
| chr8_+_9046503 | 0.59 |
ENST00000512942.2
|
RP11-10A14.5
|
RP11-10A14.5 |
| chr1_+_78245466 | 0.58 |
ENST00000477627.2
|
FAM73A
|
family with sequence similarity 73, member A |
| chrX_+_1733876 | 0.57 |
ENST00000381241.3
|
ASMT
|
acetylserotonin O-methyltransferase |
| chr15_-_49912987 | 0.57 |
ENST00000560246.1
ENST00000558594.1 |
FAM227B
|
family with sequence similarity 227, member B |
| chr8_+_55466915 | 0.55 |
ENST00000522711.2
|
RP11-53M11.3
|
RP11-53M11.3 |
| chr1_+_171454639 | 0.54 |
ENST00000392078.3
ENST00000426496.2 |
PRRC2C
|
proline-rich coiled-coil 2C |
| chr1_+_171454659 | 0.53 |
ENST00000367742.3
ENST00000338920.4 |
PRRC2C
|
proline-rich coiled-coil 2C |
| chr22_+_21213771 | 0.53 |
ENST00000439214.1
|
SNAP29
|
synaptosomal-associated protein, 29kDa |
| chr15_-_49912944 | 0.53 |
ENST00000559905.1
|
FAM227B
|
family with sequence similarity 227, member B |
| chr3_-_143567262 | 0.53 |
ENST00000474151.1
ENST00000316549.6 |
SLC9A9
|
solute carrier family 9, subfamily A (NHE9, cation proton antiporter 9), member 9 |
| chr2_+_102928009 | 0.53 |
ENST00000404917.2
ENST00000447231.1 |
IL1RL1
|
interleukin 1 receptor-like 1 |
| chr15_-_49913126 | 0.52 |
ENST00000561064.1
ENST00000299338.6 |
FAM227B
|
family with sequence similarity 227, member B |
| chr1_+_207277590 | 0.51 |
ENST00000367070.3
|
C4BPA
|
complement component 4 binding protein, alpha |
| chr3_+_101659682 | 0.51 |
ENST00000465215.1
|
RP11-221J22.1
|
RP11-221J22.1 |
| chr7_+_18330035 | 0.49 |
ENST00000413509.2
|
HDAC9
|
histone deacetylase 9 |
| chr18_-_21891460 | 0.49 |
ENST00000357041.4
|
OSBPL1A
|
oxysterol binding protein-like 1A |
| chr11_+_128563652 | 0.47 |
ENST00000527786.2
|
FLI1
|
Fli-1 proto-oncogene, ETS transcription factor |
| chr4_+_57276661 | 0.47 |
ENST00000598320.1
|
AC068620.1
|
Uncharacterized protein |
| chr8_+_93895865 | 0.47 |
ENST00000391681.1
|
AC117834.1
|
AC117834.1 |
| chr18_-_5419797 | 0.46 |
ENST00000542146.1
ENST00000427684.2 |
EPB41L3
|
erythrocyte membrane protein band 4.1-like 3 |
| chr10_+_90484301 | 0.45 |
ENST00000404190.1
|
LIPK
|
lipase, family member K |
| chr4_+_155484155 | 0.45 |
ENST00000509493.1
|
FGB
|
fibrinogen beta chain |
| chr18_+_21032781 | 0.44 |
ENST00000339486.3
|
RIOK3
|
RIO kinase 3 |
| chr6_-_137365402 | 0.44 |
ENST00000541547.1
|
IL20RA
|
interleukin 20 receptor, alpha |
| chr9_-_70490107 | 0.44 |
ENST00000377395.4
ENST00000429800.2 ENST00000430059.2 ENST00000377384.1 ENST00000382405.3 |
CBWD5
|
COBW domain containing 5 |
| chr13_-_107214291 | 0.43 |
ENST00000375926.1
|
ARGLU1
|
arginine and glutamate rich 1 |
| chr13_+_102142296 | 0.42 |
ENST00000376162.3
|
ITGBL1
|
integrin, beta-like 1 (with EGF-like repeat domains) |
| chr15_+_66874502 | 0.42 |
ENST00000558797.1
|
RP11-321F6.1
|
HCG2003567; Uncharacterized protein |
| chr8_-_42360015 | 0.42 |
ENST00000522707.1
|
SLC20A2
|
solute carrier family 20 (phosphate transporter), member 2 |
| chr4_-_137842536 | 0.41 |
ENST00000512039.1
|
RP11-138I17.1
|
RP11-138I17.1 |
| chr10_+_75668916 | 0.40 |
ENST00000481390.1
|
PLAU
|
plasminogen activator, urokinase |
| chr14_-_105420241 | 0.40 |
ENST00000557457.1
|
AHNAK2
|
AHNAK nucleoprotein 2 |
| chr7_+_143771275 | 0.38 |
ENST00000408898.2
|
OR2A25
|
olfactory receptor, family 2, subfamily A, member 25 |
| chr16_+_82068873 | 0.36 |
ENST00000566213.1
|
HSD17B2
|
hydroxysteroid (17-beta) dehydrogenase 2 |
| chr5_+_140753444 | 0.36 |
ENST00000517434.1
|
PCDHGA6
|
protocadherin gamma subfamily A, 6 |
| chr1_+_156123318 | 0.36 |
ENST00000368285.3
|
SEMA4A
|
sema domain, immunoglobulin domain (Ig), transmembrane domain (TM) and short cytoplasmic domain, (semaphorin) 4A |
| chr5_+_38445641 | 0.35 |
ENST00000397210.3
ENST00000506135.1 ENST00000508131.1 |
EGFLAM
|
EGF-like, fibronectin type III and laminin G domains |
| chr3_+_44916098 | 0.34 |
ENST00000296125.4
|
TGM4
|
transglutaminase 4 |
| chr21_-_31852663 | 0.34 |
ENST00000390689.2
|
KRTAP19-1
|
keratin associated protein 19-1 |
| chr5_+_140602904 | 0.34 |
ENST00000515856.2
ENST00000239449.4 |
PCDHB14
|
protocadherin beta 14 |
| chrX_+_1734051 | 0.34 |
ENST00000381229.4
ENST00000381233.3 |
ASMT
|
acetylserotonin O-methyltransferase |
| chr3_-_156878540 | 0.34 |
ENST00000461804.1
|
CCNL1
|
cyclin L1 |
| chr10_+_115999004 | 0.33 |
ENST00000603594.1
|
VWA2
|
von Willebrand factor A domain containing 2 |
| chr10_-_46342675 | 0.32 |
ENST00000492347.1
|
AGAP4
|
ArfGAP with GTPase domain, ankyrin repeat and PH domain 4 |
| chr2_+_62132781 | 0.32 |
ENST00000311832.5
|
COMMD1
|
copper metabolism (Murr1) domain containing 1 |
| chr22_-_29107919 | 0.31 |
ENST00000434810.1
ENST00000456369.1 |
CHEK2
|
checkpoint kinase 2 |
| chr2_+_102927962 | 0.31 |
ENST00000233954.1
ENST00000393393.3 ENST00000410040.1 |
IL1RL1
IL18R1
|
interleukin 1 receptor-like 1 interleukin 18 receptor 1 |
| chr11_+_114310164 | 0.31 |
ENST00000544196.1
ENST00000539754.1 ENST00000539275.1 |
REXO2
|
RNA exonuclease 2 |
| chr12_-_102455846 | 0.30 |
ENST00000545679.1
|
CCDC53
|
coiled-coil domain containing 53 |
| chr12_-_30887948 | 0.30 |
ENST00000433722.2
|
CAPRIN2
|
caprin family member 2 |
| chr8_-_121825088 | 0.29 |
ENST00000520717.1
|
SNTB1
|
syntrophin, beta 1 (dystrophin-associated protein A1, 59kDa, basic component 1) |
| chr12_-_102455902 | 0.28 |
ENST00000240079.6
|
CCDC53
|
coiled-coil domain containing 53 |
| chr18_+_48918368 | 0.28 |
ENST00000583982.1
ENST00000578152.1 ENST00000583609.1 ENST00000435144.1 ENST00000580841.1 |
RP11-267C16.1
|
RP11-267C16.1 |
| chr3_-_178969403 | 0.28 |
ENST00000314235.5
ENST00000392685.2 |
KCNMB3
|
potassium large conductance calcium-activated channel, subfamily M beta member 3 |
| chr13_+_107029084 | 0.28 |
ENST00000444865.1
|
LINC00460
|
long intergenic non-protein coding RNA 460 |
| chr10_+_15085895 | 0.27 |
ENST00000378228.3
|
OLAH
|
oleoyl-ACP hydrolase |
| chr1_+_171939240 | 0.27 |
ENST00000523513.1
|
DNM3
|
dynamin 3 |
| chr10_+_15085936 | 0.27 |
ENST00000378217.3
|
OLAH
|
oleoyl-ACP hydrolase |
| chr11_+_114310102 | 0.27 |
ENST00000265881.5
|
REXO2
|
RNA exonuclease 2 |
| chr17_+_41322483 | 0.27 |
ENST00000341165.6
ENST00000586650.1 ENST00000422280.1 |
NBR1
|
neighbor of BRCA1 gene 1 |
| chrX_+_100645812 | 0.26 |
ENST00000427805.2
ENST00000553110.3 ENST00000392994.3 ENST00000409338.1 ENST00000409170.3 |
RPL36A
RPL36A-HNRNPH2
|
ribosomal protein L36a RPL36A-HNRNPH2 readthrough |
| chr13_+_107028897 | 0.25 |
ENST00000439790.1
ENST00000435024.1 |
LINC00460
|
long intergenic non-protein coding RNA 460 |
| chr21_-_30047095 | 0.25 |
ENST00000452028.1
ENST00000433310.2 |
AF131217.1
|
AF131217.1 |
| chr21_+_25801041 | 0.25 |
ENST00000453784.2
ENST00000423581.1 |
AP000476.1
|
AP000476.1 |
| chr11_-_14379997 | 0.24 |
ENST00000526063.1
ENST00000532814.1 |
RRAS2
|
related RAS viral (r-ras) oncogene homolog 2 |
| chr10_+_103911926 | 0.24 |
ENST00000605788.1
ENST00000405356.1 |
NOLC1
|
nucleolar and coiled-body phosphoprotein 1 |
| chr13_-_45048386 | 0.24 |
ENST00000472477.1
|
TSC22D1
|
TSC22 domain family, member 1 |
| chr6_+_76599809 | 0.24 |
ENST00000430435.1
|
MYO6
|
myosin VI |
| chr7_+_134331550 | 0.24 |
ENST00000344924.3
ENST00000418040.1 ENST00000393132.2 |
BPGM
|
2,3-bisphosphoglycerate mutase |
| chr11_+_118754475 | 0.23 |
ENST00000292174.4
|
CXCR5
|
chemokine (C-X-C motif) receptor 5 |
| chr10_-_5638048 | 0.23 |
ENST00000478294.1
|
RP13-463N16.6
|
RP13-463N16.6 |
| chr20_-_44333658 | 0.23 |
ENST00000330523.5
ENST00000335769.2 |
WFDC10B
|
WAP four-disulfide core domain 10B |
| chr15_+_100106126 | 0.23 |
ENST00000558812.1
ENST00000338042.6 |
MEF2A
|
myocyte enhancer factor 2A |
| chr1_-_203274418 | 0.22 |
ENST00000457348.1
|
RP11-134P9.1
|
long intergenic non-protein coding RNA 1136 |
| chr4_+_155484103 | 0.22 |
ENST00000302068.4
|
FGB
|
fibrinogen beta chain |
| chr15_+_45028719 | 0.22 |
ENST00000560442.1
ENST00000558329.1 ENST00000561043.1 |
TRIM69
|
tripartite motif containing 69 |
| chr14_-_45252031 | 0.22 |
ENST00000556405.1
|
RP11-398E10.1
|
RP11-398E10.1 |
| chr12_-_45270077 | 0.22 |
ENST00000551601.1
ENST00000549027.1 ENST00000452445.2 |
NELL2
|
NEL-like 2 (chicken) |
| chr4_+_72897521 | 0.22 |
ENST00000308744.6
ENST00000344413.5 |
NPFFR2
|
neuropeptide FF receptor 2 |
| chr12_+_10331605 | 0.21 |
ENST00000298530.3
|
TMEM52B
|
transmembrane protein 52B |
| chr7_-_123197733 | 0.21 |
ENST00000470123.1
ENST00000471770.1 |
NDUFA5
|
NADH dehydrogenase (ubiquinone) 1 alpha subcomplex, 5 |
| chr12_-_45270151 | 0.21 |
ENST00000429094.2
|
NELL2
|
NEL-like 2 (chicken) |
| chr9_+_91933407 | 0.21 |
ENST00000375807.3
ENST00000339901.4 |
SECISBP2
|
SECIS binding protein 2 |
| chr6_-_43027105 | 0.21 |
ENST00000230413.5
ENST00000487429.1 ENST00000489623.1 ENST00000468957.1 |
MRPL2
|
mitochondrial ribosomal protein L2 |
| chr12_+_75874580 | 0.21 |
ENST00000456650.3
|
GLIPR1
|
GLI pathogenesis-related 1 |
| chr6_-_133055896 | 0.20 |
ENST00000367927.5
ENST00000425515.2 ENST00000207771.3 ENST00000392393.3 ENST00000450865.2 ENST00000392394.2 |
VNN3
|
vanin 3 |
| chr7_-_86688990 | 0.20 |
ENST00000450689.2
|
KIAA1324L
|
KIAA1324-like |
| chr3_+_184080387 | 0.20 |
ENST00000455712.1
|
POLR2H
|
polymerase (RNA) II (DNA directed) polypeptide H |
| chr10_+_53806501 | 0.20 |
ENST00000373975.2
|
PRKG1
|
protein kinase, cGMP-dependent, type I |
| chr16_+_31366455 | 0.19 |
ENST00000268296.4
|
ITGAX
|
integrin, alpha X (complement component 3 receptor 4 subunit) |
| chr8_-_101730061 | 0.19 |
ENST00000519100.1
|
PABPC1
|
poly(A) binding protein, cytoplasmic 1 |
| chr15_+_100106244 | 0.19 |
ENST00000557942.1
|
MEF2A
|
myocyte enhancer factor 2A |
| chr11_+_18433840 | 0.19 |
ENST00000541669.1
ENST00000280704.4 |
LDHC
|
lactate dehydrogenase C |
| chr2_-_109605663 | 0.19 |
ENST00000409271.1
ENST00000258443.2 ENST00000376651.1 |
EDAR
|
ectodysplasin A receptor |
| chr4_-_48782259 | 0.19 |
ENST00000507711.1
ENST00000358350.4 ENST00000537810.1 ENST00000264319.7 |
FRYL
|
FRY-like |
| chr6_-_33290580 | 0.19 |
ENST00000446511.1
ENST00000446403.1 ENST00000414083.2 ENST00000266000.6 ENST00000374542.5 |
DAXX
|
death-domain associated protein |
| chr1_-_89357179 | 0.18 |
ENST00000448623.1
ENST00000418217.1 ENST00000370500.5 |
GTF2B
|
general transcription factor IIB |
| chr6_-_117150198 | 0.18 |
ENST00000310357.3
ENST00000368549.3 ENST00000530250.1 |
GPRC6A
|
G protein-coupled receptor, family C, group 6, member A |
| chr1_+_207277632 | 0.18 |
ENST00000421786.1
|
C4BPA
|
complement component 4 binding protein, alpha |
| chr3_-_10334585 | 0.18 |
ENST00000430179.1
ENST00000449238.2 ENST00000437422.2 ENST00000287656.7 ENST00000457360.1 ENST00000439975.2 ENST00000446937.2 |
GHRL
|
ghrelin/obestatin prepropeptide |
| chr6_-_135271219 | 0.17 |
ENST00000367847.2
ENST00000367845.2 |
ALDH8A1
|
aldehyde dehydrogenase 8 family, member A1 |
| chr20_+_56964169 | 0.17 |
ENST00000475243.1
|
VAPB
|
VAMP (vesicle-associated membrane protein)-associated protein B and C |
| chr12_-_45269769 | 0.17 |
ENST00000548826.1
|
NELL2
|
NEL-like 2 (chicken) |
| chr3_+_14061155 | 0.17 |
ENST00000532924.1
|
TPRXL
|
tetra-peptide repeat homeobox-like |
| chrX_-_70326455 | 0.17 |
ENST00000374251.5
|
CXorf65
|
chromosome X open reading frame 65 |
| chr2_+_166150541 | 0.17 |
ENST00000283256.6
|
SCN2A
|
sodium channel, voltage-gated, type II, alpha subunit |
| chr2_+_179149636 | 0.17 |
ENST00000409631.1
|
OSBPL6
|
oxysterol binding protein-like 6 |
| chr11_+_22694123 | 0.16 |
ENST00000534801.1
|
GAS2
|
growth arrest-specific 2 |
| chr12_-_45269430 | 0.16 |
ENST00000395487.2
|
NELL2
|
NEL-like 2 (chicken) |
| chr1_-_248802559 | 0.16 |
ENST00000317450.3
|
OR2T35
|
olfactory receptor, family 2, subfamily T, member 35 |
| chr19_+_9296279 | 0.16 |
ENST00000344248.2
|
OR7D2
|
olfactory receptor, family 7, subfamily D, member 2 |
| chr16_+_31366536 | 0.16 |
ENST00000562522.1
|
ITGAX
|
integrin, alpha X (complement component 3 receptor 4 subunit) |
| chr12_-_54582655 | 0.16 |
ENST00000504338.1
ENST00000514685.1 ENST00000504797.1 ENST00000513838.1 ENST00000505128.1 ENST00000337581.3 ENST00000503306.1 ENST00000243112.5 ENST00000514196.1 ENST00000506169.1 ENST00000507904.1 ENST00000508394.2 |
SMUG1
|
single-strand-selective monofunctional uracil-DNA glycosylase 1 |
| chr7_+_142448053 | 0.16 |
ENST00000422143.2
|
TRBV29-1
|
T cell receptor beta variable 29-1 |
| chr6_-_135271260 | 0.15 |
ENST00000265605.2
|
ALDH8A1
|
aldehyde dehydrogenase 8 family, member A1 |
| chrX_-_117119243 | 0.15 |
ENST00000539496.1
ENST00000469946.1 |
KLHL13
|
kelch-like family member 13 |
| chr4_-_65275162 | 0.15 |
ENST00000381210.3
ENST00000507440.1 |
TECRL
|
trans-2,3-enoyl-CoA reductase-like |
| chr19_-_9226439 | 0.15 |
ENST00000293614.1
ENST00000541538.1 |
OR7G1
|
olfactory receptor, family 7, subfamily G, member 1 |
| chr11_+_57308979 | 0.14 |
ENST00000457912.1
|
SMTNL1
|
smoothelin-like 1 |
| chr18_-_3874752 | 0.14 |
ENST00000534970.1
|
DLGAP1
|
discs, large (Drosophila) homolog-associated protein 1 |
| chrX_-_72097698 | 0.14 |
ENST00000373530.1
|
DMRTC1
|
DMRT-like family C1 |
| chr3_-_178984759 | 0.14 |
ENST00000349697.2
ENST00000497599.1 |
KCNMB3
|
potassium large conductance calcium-activated channel, subfamily M beta member 3 |
| chr13_-_99910620 | 0.14 |
ENST00000416594.1
|
GPR18
|
G protein-coupled receptor 18 |
| chr1_-_150669500 | 0.13 |
ENST00000271732.3
|
GOLPH3L
|
golgi phosphoprotein 3-like |
| chr17_-_74547256 | 0.13 |
ENST00000589145.1
|
CYGB
|
cytoglobin |
| chr19_-_9213982 | 0.13 |
ENST00000305456.2
|
OR7G2
|
olfactory receptor, family 7, subfamily G, member 2 |
| chr8_+_28196157 | 0.13 |
ENST00000522209.1
|
PNOC
|
prepronociceptin |
| chr19_-_14889349 | 0.13 |
ENST00000315576.3
ENST00000392967.2 ENST00000346057.1 ENST00000353876.1 ENST00000353005.1 |
EMR2
|
egf-like module containing, mucin-like, hormone receptor-like 2 |
| chr1_-_158656488 | 0.13 |
ENST00000368147.4
|
SPTA1
|
spectrin, alpha, erythrocytic 1 (elliptocytosis 2) |
| chr6_+_33043703 | 0.13 |
ENST00000418931.2
ENST00000535465.1 |
HLA-DPB1
|
major histocompatibility complex, class II, DP beta 1 |
| chr20_+_32254286 | 0.13 |
ENST00000330271.4
|
ACTL10
|
actin-like 10 |
| chr19_-_57967854 | 0.13 |
ENST00000321039.3
|
VN1R1
|
vomeronasal 1 receptor 1 |
| chr3_+_46283944 | 0.12 |
ENST00000452454.1
ENST00000457243.1 |
CCR3
|
chemokine (C-C motif) receptor 3 |
| chr20_+_58571419 | 0.12 |
ENST00000244049.3
ENST00000350849.6 ENST00000456106.1 |
CDH26
|
cadherin 26 |
| chr3_+_46283863 | 0.12 |
ENST00000545097.1
ENST00000541018.1 |
CCR3
|
chemokine (C-C motif) receptor 3 |
| chr1_+_149239529 | 0.12 |
ENST00000457216.2
|
RP11-403I13.4
|
RP11-403I13.4 |
| chr15_+_100106155 | 0.12 |
ENST00000557785.1
ENST00000558049.1 ENST00000449277.2 |
MEF2A
|
myocyte enhancer factor 2A |
| chr12_+_92817735 | 0.12 |
ENST00000378485.1
|
CLLU1
|
chronic lymphocytic leukemia up-regulated 1 |
| chr14_+_23025534 | 0.12 |
ENST00000557595.1
|
AE000662.92
|
Uncharacterized protein |
| chr13_-_99910673 | 0.12 |
ENST00000397473.2
ENST00000397470.2 |
GPR18
|
G protein-coupled receptor 18 |
| chr6_-_32557610 | 0.12 |
ENST00000360004.5
|
HLA-DRB1
|
major histocompatibility complex, class II, DR beta 1 |
| chr3_+_46283916 | 0.11 |
ENST00000395940.2
|
CCR3
|
chemokine (C-C motif) receptor 3 |
| chr1_+_248616077 | 0.11 |
ENST00000342927.3
|
OR2T2
|
olfactory receptor, family 2, subfamily T, member 2 |
| chr11_+_101785727 | 0.11 |
ENST00000263468.8
|
KIAA1377
|
KIAA1377 |
| chr20_-_1448358 | 0.10 |
ENST00000381658.4
|
NSFL1C
|
NSFL1 (p97) cofactor (p47) |
| chr5_+_140593509 | 0.10 |
ENST00000341948.4
|
PCDHB13
|
protocadherin beta 13 |
| chr4_+_71570430 | 0.10 |
ENST00000417478.2
|
RUFY3
|
RUN and FYVE domain containing 3 |
| chrX_-_154060946 | 0.10 |
ENST00000369529.1
|
SMIM9
|
small integral membrane protein 9 |
| chr10_-_49482907 | 0.09 |
ENST00000374201.3
ENST00000407470.4 |
FRMPD2
|
FERM and PDZ domain containing 2 |
| chr17_+_53344945 | 0.09 |
ENST00000575345.1
|
HLF
|
hepatic leukemia factor |
| chr13_+_32313658 | 0.09 |
ENST00000380314.1
ENST00000298386.2 |
RXFP2
|
relaxin/insulin-like family peptide receptor 2 |
| chr10_-_45803286 | 0.09 |
ENST00000536058.1
|
OR13A1
|
olfactory receptor, family 13, subfamily A, member 1 |
| chr3_-_49837254 | 0.09 |
ENST00000412678.2
ENST00000343366.4 ENST00000487256.1 |
CDHR4
|
cadherin-related family member 4 |
| chr6_+_42018614 | 0.09 |
ENST00000465926.1
ENST00000482432.1 |
TAF8
|
TAF8 RNA polymerase II, TATA box binding protein (TBP)-associated factor, 43kDa |
| chr17_-_45908875 | 0.09 |
ENST00000351111.2
ENST00000414011.1 |
MRPL10
|
mitochondrial ribosomal protein L10 |
| chr21_-_19858196 | 0.09 |
ENST00000422787.1
|
TMPRSS15
|
transmembrane protease, serine 15 |
| chr16_+_31539183 | 0.09 |
ENST00000302312.4
|
AHSP
|
alpha hemoglobin stabilizing protein |
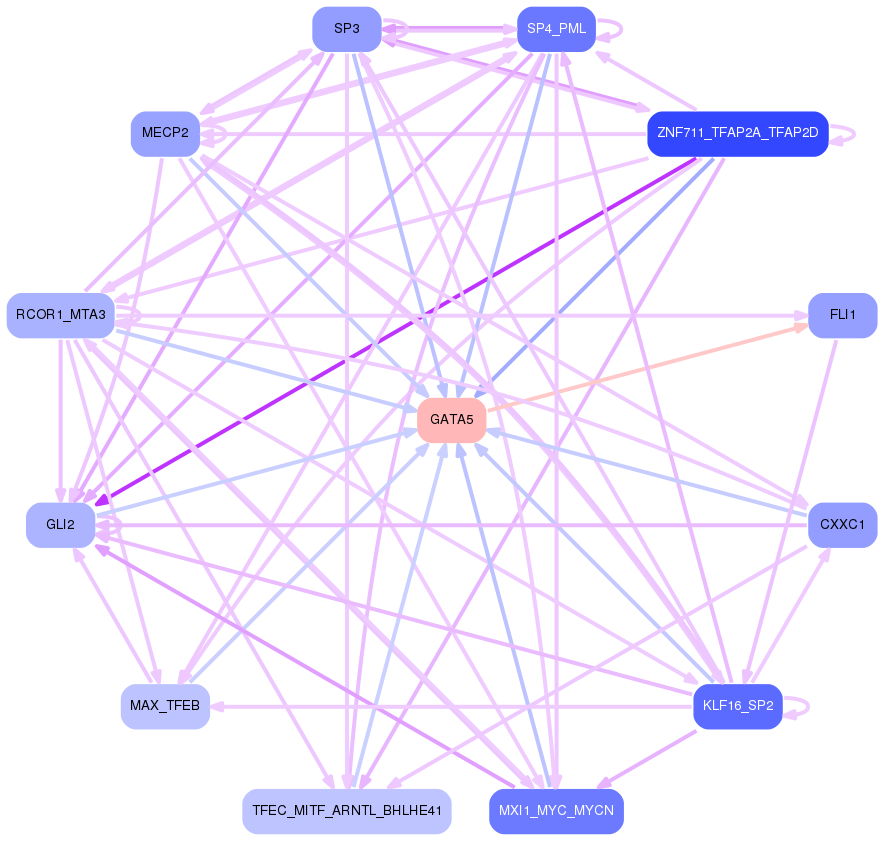
Network of associatons between targets according to the STRING database.

First level regulatory network of GATA5
Gene Ontology Analysis
Gene overrepresentation in biological_process category:
| Log-likelihood per target | Total log-likelihood | Term | Description |
|---|---|---|---|
| 0.3 | 2.3 | GO:0002784 | regulation of antimicrobial peptide production(GO:0002784) regulation of antibacterial peptide production(GO:0002786) |
| 0.3 | 0.9 | GO:0030187 | melatonin metabolic process(GO:0030186) melatonin biosynthetic process(GO:0030187) |
| 0.2 | 0.7 | GO:0086092 | regulation of the force of heart contraction by cardiac conduction(GO:0086092) |
| 0.2 | 0.7 | GO:0050712 | negative regulation of interleukin-1 alpha production(GO:0032690) negative regulation of interleukin-1 alpha secretion(GO:0050712) |
| 0.1 | 0.8 | GO:0044245 | polysaccharide digestion(GO:0044245) |
| 0.1 | 2.6 | GO:0001574 | ganglioside biosynthetic process(GO:0001574) |
| 0.1 | 0.8 | GO:0038172 | interleukin-33-mediated signaling pathway(GO:0038172) |
| 0.1 | 0.5 | GO:0016240 | autophagosome docking(GO:0016240) |
| 0.1 | 0.3 | GO:1903925 | signal transduction involved in intra-S DNA damage checkpoint(GO:0072428) response to bisphenol A(GO:1903925) cellular response to bisphenol A(GO:1903926) |
| 0.1 | 2.5 | GO:0090179 | planar cell polarity pathway involved in neural tube closure(GO:0090179) |
| 0.1 | 0.4 | GO:2000097 | regulation of smooth muscle cell-matrix adhesion(GO:2000097) |
| 0.1 | 0.3 | GO:0098884 | postsynaptic neurotransmitter receptor internalization(GO:0098884) |
| 0.1 | 0.4 | GO:0039534 | negative regulation of MDA-5 signaling pathway(GO:0039534) |
| 0.1 | 0.7 | GO:0097577 | intracellular sequestering of iron ion(GO:0006880) sequestering of iron ion(GO:0097577) |
| 0.1 | 0.8 | GO:0097033 | respiratory chain complex III assembly(GO:0017062) mitochondrial respiratory chain complex III assembly(GO:0034551) mitochondrial respiratory chain complex III biogenesis(GO:0097033) |
| 0.1 | 8.9 | GO:0030449 | regulation of complement activation(GO:0030449) |
| 0.1 | 0.3 | GO:0002305 | gamma-delta intraepithelial T cell differentiation(GO:0002304) CD8-positive, gamma-delta intraepithelial T cell differentiation(GO:0002305) |
| 0.1 | 0.2 | GO:0019516 | lactate oxidation(GO:0019516) |
| 0.1 | 0.2 | GO:0072737 | response to diamide(GO:0072737) cellular response to diamide(GO:0072738) |
| 0.1 | 1.4 | GO:0090110 | cargo loading into COPII-coated vesicle(GO:0090110) |
| 0.1 | 4.9 | GO:0006120 | mitochondrial electron transport, NADH to ubiquinone(GO:0006120) |
| 0.1 | 0.2 | GO:0043456 | regulation of pentose-phosphate shunt(GO:0043456) |
| 0.1 | 0.2 | GO:1990768 | positive regulation of growth rate(GO:0040010) regulation of gastric mucosal blood circulation(GO:1904344) positive regulation of gastric mucosal blood circulation(GO:1904346) gastric mucosal blood circulation(GO:1990768) |
| 0.1 | 0.5 | GO:0055005 | ventricular cardiac myofibril assembly(GO:0055005) ERK5 cascade(GO:0070375) |
| 0.1 | 0.5 | GO:0002175 | protein localization to paranode region of axon(GO:0002175) |
| 0.0 | 0.8 | GO:0070050 | neuron cellular homeostasis(GO:0070050) |
| 0.0 | 0.7 | GO:0043152 | induction of bacterial agglutination(GO:0043152) |
| 0.0 | 0.8 | GO:0070863 | positive regulation of protein exit from endoplasmic reticulum(GO:0070863) |
| 0.0 | 0.9 | GO:0071803 | positive regulation of podosome assembly(GO:0071803) |
| 0.0 | 0.4 | GO:2000622 | regulation of nuclear-transcribed mRNA catabolic process, nonsense-mediated decay(GO:2000622) negative regulation of nuclear-transcribed mRNA catabolic process, nonsense-mediated decay(GO:2000623) |
| 0.0 | 0.3 | GO:0042905 | 9-cis-retinoic acid biosynthetic process(GO:0042904) 9-cis-retinoic acid metabolic process(GO:0042905) |
| 0.0 | 0.5 | GO:1990118 | sodium ion import across plasma membrane(GO:0098719) sodium ion import into cell(GO:1990118) |
| 0.0 | 1.7 | GO:0010107 | potassium ion import(GO:0010107) |
| 0.0 | 0.3 | GO:0007161 | calcium-independent cell-matrix adhesion(GO:0007161) |
| 0.0 | 0.4 | GO:0001778 | plasma membrane repair(GO:0001778) |
| 0.0 | 0.4 | GO:0044341 | sodium-dependent phosphate transport(GO:0044341) |
| 0.0 | 0.8 | GO:0042789 | mRNA transcription from RNA polymerase II promoter(GO:0042789) |
| 0.0 | 0.5 | GO:0090050 | positive regulation of cell migration involved in sprouting angiogenesis(GO:0090050) |
| 0.0 | 0.2 | GO:1904798 | positive regulation of core promoter binding(GO:1904798) |
| 0.0 | 0.8 | GO:0022400 | regulation of rhodopsin mediated signaling pathway(GO:0022400) |
| 0.0 | 0.2 | GO:0007000 | nucleolus organization(GO:0007000) |
| 0.0 | 0.4 | GO:0006703 | estrogen biosynthetic process(GO:0006703) |
| 0.0 | 0.1 | GO:0019236 | response to pheromone(GO:0019236) |
| 0.0 | 0.6 | GO:0007202 | activation of phospholipase C activity(GO:0007202) |
| 0.0 | 0.8 | GO:0006607 | NLS-bearing protein import into nucleus(GO:0006607) |
| 0.0 | 0.3 | GO:0019800 | peptide cross-linking via chondroitin 4-sulfate glycosaminoglycan(GO:0019800) |
| 0.0 | 0.5 | GO:0035855 | megakaryocyte development(GO:0035855) |
| 0.0 | 0.7 | GO:1900087 | positive regulation of G1/S transition of mitotic cell cycle(GO:1900087) |
| 0.0 | 0.1 | GO:0043376 | regulation of CD8-positive, alpha-beta T cell differentiation(GO:0043376) |
| 0.0 | 0.2 | GO:0006987 | activation of signaling protein activity involved in unfolded protein response(GO:0006987) |
| 0.0 | 0.2 | GO:0060087 | relaxation of vascular smooth muscle(GO:0060087) |
| 0.0 | 1.7 | GO:0031338 | regulation of vesicle fusion(GO:0031338) |
| 0.0 | 0.6 | GO:0006633 | fatty acid biosynthetic process(GO:0006633) |
| 0.0 | 0.2 | GO:0015939 | pantothenate metabolic process(GO:0015939) |
| 0.0 | 0.2 | GO:0060662 | tube lumen cavitation(GO:0060605) salivary gland cavitation(GO:0060662) |
| 0.0 | 0.7 | GO:0006699 | bile acid biosynthetic process(GO:0006699) |
| 0.0 | 0.2 | GO:0005513 | detection of calcium ion(GO:0005513) |
| 0.0 | 0.2 | GO:0008627 | intrinsic apoptotic signaling pathway in response to osmotic stress(GO:0008627) |
| 0.0 | 0.1 | GO:0048194 | Golgi vesicle budding(GO:0048194) |
| 0.0 | 0.2 | GO:0015671 | oxygen transport(GO:0015671) |
Gene overrepresentation in cellular_component category:
| Log-likelihood per target | Total log-likelihood | Term | Description |
|---|---|---|---|
| 0.3 | 2.3 | GO:0097209 | epidermal lamellar body(GO:0097209) |
| 0.2 | 0.7 | GO:0070288 | intracellular ferritin complex(GO:0008043) ferritin complex(GO:0070288) |
| 0.1 | 0.3 | GO:0098844 | postsynaptic endocytic zone membrane(GO:0098844) |
| 0.1 | 0.5 | GO:0020018 | ciliary pocket(GO:0020016) ciliary pocket membrane(GO:0020018) |
| 0.1 | 4.9 | GO:0005747 | mitochondrial respiratory chain complex I(GO:0005747) NADH dehydrogenase complex(GO:0030964) respiratory chain complex I(GO:0045271) |
| 0.1 | 0.8 | GO:0045275 | mitochondrial respiratory chain complex III(GO:0005750) respiratory chain complex III(GO:0045275) |
| 0.1 | 1.4 | GO:0030127 | COPII vesicle coat(GO:0030127) |
| 0.0 | 0.7 | GO:0005577 | fibrinogen complex(GO:0005577) |
| 0.0 | 0.4 | GO:0030688 | preribosome, small subunit precursor(GO:0030688) |
| 0.0 | 0.8 | GO:0042622 | photoreceptor outer segment membrane(GO:0042622) |
| 0.0 | 0.9 | GO:0001891 | phagocytic cup(GO:0001891) |
| 0.0 | 0.2 | GO:1990730 | VCP-NSFL1C complex(GO:1990730) |
| 0.0 | 0.6 | GO:0033270 | paranode region of axon(GO:0033270) |
| 0.0 | 0.7 | GO:0090533 | cation-transporting ATPase complex(GO:0090533) |
| 0.0 | 0.1 | GO:0032437 | cuticular plate(GO:0032437) |
| 0.0 | 0.2 | GO:0097550 | transcriptional preinitiation complex(GO:0097550) |
| 0.0 | 0.3 | GO:0043235 | receptor complex(GO:0043235) |
| 0.0 | 0.2 | GO:0016461 | unconventional myosin complex(GO:0016461) |
| 0.0 | 0.3 | GO:0005614 | interstitial matrix(GO:0005614) |
Gene overrepresentation in molecular_function category:
| Log-likelihood per target | Total log-likelihood | Term | Description |
|---|---|---|---|
| 0.3 | 0.8 | GO:0002113 | interleukin-33 binding(GO:0002113) |
| 0.3 | 2.6 | GO:0001665 | alpha-N-acetylgalactosaminide alpha-2,6-sialyltransferase activity(GO:0001665) |
| 0.3 | 0.8 | GO:0086040 | sodium:proton antiporter activity involved in regulation of cardiac muscle cell membrane potential(GO:0086040) |
| 0.2 | 0.8 | GO:0004556 | alpha-amylase activity(GO:0004556) |
| 0.1 | 0.7 | GO:0004910 | interleukin-1, Type II, blocking receptor activity(GO:0004910) |
| 0.1 | 0.6 | GO:0016296 | oleoyl-[acyl-carrier-protein] hydrolase activity(GO:0004320) myristoyl-[acyl-carrier-protein] hydrolase activity(GO:0016295) palmitoyl-[acyl-carrier-protein] hydrolase activity(GO:0016296) acyl-[acyl-carrier-protein] hydrolase activity(GO:0016297) |
| 0.1 | 0.8 | GO:0016681 | ubiquinol-cytochrome-c reductase activity(GO:0008121) oxidoreductase activity, acting on diphenols and related substances as donors, cytochrome as acceptor(GO:0016681) |
| 0.1 | 0.9 | GO:0008172 | S-methyltransferase activity(GO:0008172) |
| 0.1 | 0.3 | GO:0031798 | type 1 metabotropic glutamate receptor binding(GO:0031798) |
| 0.1 | 2.6 | GO:0004806 | triglyceride lipase activity(GO:0004806) |
| 0.1 | 0.2 | GO:0060001 | minus-end directed microfilament motor activity(GO:0060001) |
| 0.1 | 4.9 | GO:0008137 | NADH dehydrogenase (ubiquinone) activity(GO:0008137) NADH dehydrogenase (quinone) activity(GO:0050136) |
| 0.1 | 1.7 | GO:0015467 | G-protein activated inward rectifier potassium channel activity(GO:0015467) |
| 0.1 | 0.4 | GO:0042015 | interleukin-20 binding(GO:0042015) |
| 0.1 | 6.8 | GO:0005044 | scavenger receptor activity(GO:0005044) |
| 0.1 | 0.2 | GO:0004619 | bisphosphoglycerate mutase activity(GO:0004082) phosphoglycerate mutase activity(GO:0004619) 2,3-bisphosphoglycerate-dependent phosphoglycerate mutase activity(GO:0046538) |
| 0.1 | 0.2 | GO:0016608 | growth hormone-releasing hormone activity(GO:0016608) ghrelin receptor binding(GO:0031768) |
| 0.1 | 0.2 | GO:0033149 | FFAT motif binding(GO:0033149) |
| 0.1 | 0.6 | GO:0070915 | lysophosphatidic acid receptor activity(GO:0070915) |
| 0.1 | 0.7 | GO:0004322 | ferroxidase activity(GO:0004322) oxidoreductase activity, oxidizing metal ions, oxygen as acceptor(GO:0016724) |
| 0.1 | 0.8 | GO:0043855 | intracellular cyclic nucleotide activated cation channel activity(GO:0005221) cyclic nucleotide-gated ion channel activity(GO:0043855) |
| 0.0 | 0.4 | GO:0015319 | sodium:inorganic phosphate symporter activity(GO:0015319) |
| 0.0 | 0.7 | GO:0004865 | protein serine/threonine phosphatase inhibitor activity(GO:0004865) |
| 0.0 | 0.5 | GO:0015386 | potassium:proton antiporter activity(GO:0015386) |
| 0.0 | 1.6 | GO:0001848 | complement binding(GO:0001848) |
| 0.0 | 0.1 | GO:0016503 | pheromone receptor activity(GO:0016503) |
| 0.0 | 1.2 | GO:0005068 | transmembrane receptor protein tyrosine kinase adaptor activity(GO:0005068) |
| 0.0 | 0.2 | GO:0004692 | cGMP-dependent protein kinase activity(GO:0004692) |
| 0.0 | 0.2 | GO:0017159 | pantetheine hydrolase activity(GO:0017159) |
| 0.0 | 0.1 | GO:0047888 | fatty acid peroxidase activity(GO:0047888) |
| 0.0 | 0.1 | GO:0001515 | opioid peptide activity(GO:0001515) |
| 0.0 | 0.4 | GO:0089720 | caspase binding(GO:0089720) |
| 0.0 | 0.2 | GO:0000702 | oxidized base lesion DNA N-glycosylase activity(GO:0000702) |
| 0.0 | 0.4 | GO:0019957 | C-C chemokine binding(GO:0019957) |
| 0.0 | 0.2 | GO:0035368 | selenocysteine insertion sequence binding(GO:0035368) |
| 0.0 | 0.3 | GO:0003810 | protein-glutamine gamma-glutamyltransferase activity(GO:0003810) |
| 0.0 | 0.4 | GO:0004303 | estradiol 17-beta-dehydrogenase activity(GO:0004303) |
| 0.0 | 0.0 | GO:0004089 | carbonate dehydratase activity(GO:0004089) |
| 0.0 | 0.7 | GO:0015464 | acetylcholine receptor activity(GO:0015464) |
| 0.0 | 0.2 | GO:0001042 | RNA polymerase I core binding(GO:0001042) |
| 0.0 | 0.1 | GO:1902271 | D3 vitamins binding(GO:1902271) |
| 0.0 | 0.1 | GO:0005499 | vitamin D binding(GO:0005499) |
| 0.0 | 0.2 | GO:0004459 | L-lactate dehydrogenase activity(GO:0004459) |
| 0.0 | 0.2 | GO:0016494 | C-X-C chemokine receptor activity(GO:0016494) |
| 0.0 | 0.1 | GO:0030492 | hemoglobin binding(GO:0030492) |
| 0.0 | 0.6 | GO:0008157 | protein phosphatase 1 binding(GO:0008157) |
| 0.0 | 0.5 | GO:0031078 | histone deacetylase activity (H3-K14 specific)(GO:0031078) NAD-dependent histone deacetylase activity (H3-K14 specific)(GO:0032041) |
| 0.0 | 2.5 | GO:0031490 | chromatin DNA binding(GO:0031490) |
| 0.0 | 2.1 | GO:0004867 | serine-type endopeptidase inhibitor activity(GO:0004867) |
| 0.0 | 0.7 | GO:0015248 | sterol transporter activity(GO:0015248) |
| 0.0 | 1.3 | GO:0098811 | transcriptional activator activity, RNA polymerase II transcription factor binding(GO:0001190) transcriptional repressor activity, RNA polymerase II activating transcription factor binding(GO:0098811) |
| 0.0 | 1.2 | GO:0048306 | calcium-dependent protein binding(GO:0048306) |
| 0.0 | 0.2 | GO:0031628 | opioid receptor binding(GO:0031628) |
| 0.0 | 0.6 | GO:0000175 | 3'-5'-exoribonuclease activity(GO:0000175) |
| 0.0 | 0.5 | GO:0005484 | SNAP receptor activity(GO:0005484) |
Gene overrepresentation in C2:CP category:
| Log-likelihood per target | Total log-likelihood | Term | Description |
|---|---|---|---|
| 0.0 | 1.6 | ST G ALPHA S PATHWAY | G alpha s Pathway |
| 0.0 | 1.7 | PID INTEGRIN A9B1 PATHWAY | Alpha9 beta1 integrin signaling events |
| 0.0 | 1.1 | SA B CELL RECEPTOR COMPLEXES | Antigen binding to B cell receptors activates protein tyrosine kinases, such as the Src family, which ultimate activate MAP kinases. |
| 0.0 | 0.8 | PID RHODOPSIN PATHWAY | Visual signal transduction: Rods |
| 0.0 | 1.1 | PID INTEGRIN2 PATHWAY | Beta2 integrin cell surface interactions |
| 0.0 | 1.3 | PID P38 ALPHA BETA DOWNSTREAM PATHWAY | Signaling mediated by p38-alpha and p38-beta |
| 0.0 | 0.7 | PID CD40 PATHWAY | CD40/CD40L signaling |
Gene overrepresentation in C2:CP:REACTOME category:
| Log-likelihood per target | Total log-likelihood | Term | Description |
|---|---|---|---|
| 0.3 | 9.0 | REACTOME REGULATION OF COMPLEMENT CASCADE | Genes involved in Regulation of Complement cascade |
| 0.1 | 0.8 | REACTOME DIGESTION OF DIETARY CARBOHYDRATE | Genes involved in Digestion of dietary carbohydrate |
| 0.0 | 0.7 | REACTOME COMMON PATHWAY | Genes involved in Common Pathway |
| 0.0 | 0.8 | REACTOME HYALURONAN UPTAKE AND DEGRADATION | Genes involved in Hyaluronan uptake and degradation |
| 0.0 | 1.3 | REACTOME ANTIGEN PRESENTATION FOLDING ASSEMBLY AND PEPTIDE LOADING OF CLASS I MHC | Genes involved in Antigen Presentation: Folding, assembly and peptide loading of class I MHC |
| 0.0 | 1.7 | REACTOME INHIBITION OF VOLTAGE GATED CA2 CHANNELS VIA GBETA GAMMA SUBUNITS | Genes involved in Inhibition of voltage gated Ca2+ channels via Gbeta/gamma subunits |
| 0.0 | 1.1 | REACTOME REGULATION OF SIGNALING BY CBL | Genes involved in Regulation of signaling by CBL |
| 0.0 | 0.9 | REACTOME GENERATION OF SECOND MESSENGER MOLECULES | Genes involved in Generation of second messenger molecules |
| 0.0 | 0.8 | REACTOME IRON UPTAKE AND TRANSPORT | Genes involved in Iron uptake and transport |
| 0.0 | 1.0 | REACTOME RESPIRATORY ELECTRON TRANSPORT | Genes involved in Respiratory electron transport |
| 0.0 | 0.4 | REACTOME OTHER SEMAPHORIN INTERACTIONS | Genes involved in Other semaphorin interactions |
| 0.0 | 0.5 | REACTOME ERK MAPK TARGETS | Genes involved in ERK/MAPK targets |