Project
SARS-CoV-2 Analysis Results (GEO series: GSE147507)
Navigation
Downloads
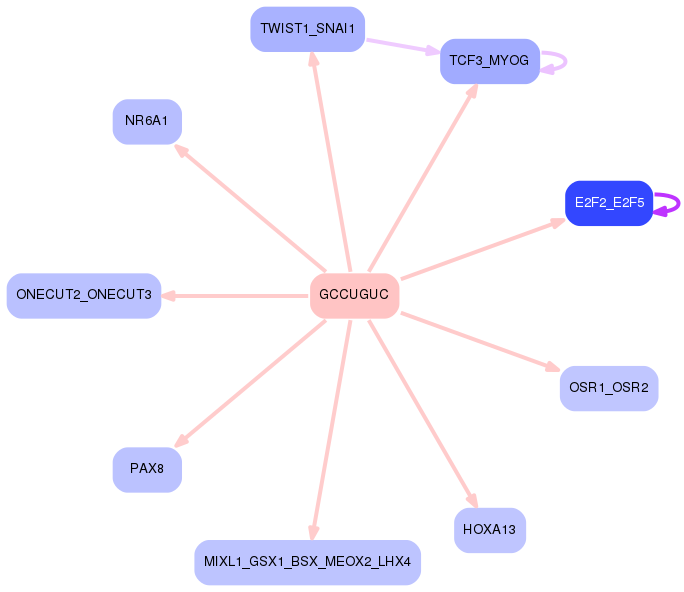
Results for GCCUGUC
Z-value: 0.31
Motif logo

miRNA associated with seed GCCUGUC
| Name | miRBASE accession |
|---|---|
|
hsa-miR-214-5p
|
MIMAT0004564 |
Activity profile of GCCUGUC motif
Sorted Z-values of GCCUGUC motif
| Promoter | Log-likelihood | Transcript | Gene | Gene Info |
|---|---|---|---|---|
| chr20_+_10199468 | 0.43 |
ENST00000254976.2
ENST00000304886.2 |
SNAP25
|
synaptosomal-associated protein, 25kDa |
| chr1_-_23857698 | 0.30 |
ENST00000361729.2
|
E2F2
|
E2F transcription factor 2 |
| chr10_-_71892555 | 0.28 |
ENST00000307864.1
|
AIFM2
|
apoptosis-inducing factor, mitochondrion-associated, 2 |
| chr14_-_35182994 | 0.27 |
ENST00000341223.3
|
CFL2
|
cofilin 2 (muscle) |
| chr2_+_27070964 | 0.27 |
ENST00000288699.6
|
DPYSL5
|
dihydropyrimidinase-like 5 |
| chr10_+_101088836 | 0.26 |
ENST00000356713.4
|
CNNM1
|
cyclin M1 |
| chr7_-_35077653 | 0.26 |
ENST00000310974.4
|
DPY19L1
|
dpy-19-like 1 (C. elegans) |
| chr11_-_57283159 | 0.21 |
ENST00000533263.1
ENST00000278426.3 |
SLC43A1
|
solute carrier family 43 (amino acid system L transporter), member 1 |
| chr1_+_39957292 | 0.20 |
ENST00000331593.5
|
BMP8A
|
bone morphogenetic protein 8a |
| chr6_-_39197226 | 0.19 |
ENST00000359534.3
|
KCNK5
|
potassium channel, subfamily K, member 5 |
| chr2_-_19558373 | 0.18 |
ENST00000272223.2
|
OSR1
|
odd-skipped related transciption factor 1 |
| chr15_-_65715401 | 0.18 |
ENST00000352385.2
|
IGDCC4
|
immunoglobulin superfamily, DCC subclass, member 4 |
| chr11_+_76494253 | 0.18 |
ENST00000333090.4
|
TSKU
|
tsukushi, small leucine rich proteoglycan |
| chr2_+_36582857 | 0.18 |
ENST00000280527.2
|
CRIM1
|
cysteine rich transmembrane BMP regulator 1 (chordin-like) |
| chr16_-_85722530 | 0.17 |
ENST00000253462.3
|
GINS2
|
GINS complex subunit 2 (Psf2 homolog) |
| chr11_+_14665263 | 0.17 |
ENST00000282096.4
|
PDE3B
|
phosphodiesterase 3B, cGMP-inhibited |
| chr7_-_27239703 | 0.17 |
ENST00000222753.4
|
HOXA13
|
homeobox A13 |
| chr2_+_25015968 | 0.16 |
ENST00000380834.2
ENST00000473706.1 |
CENPO
|
centromere protein O |
| chrX_-_71351678 | 0.16 |
ENST00000609883.1
ENST00000545866.1 |
RGAG4
|
retrotransposon gag domain containing 4 |
| chr10_-_118032697 | 0.16 |
ENST00000439649.3
|
GFRA1
|
GDNF family receptor alpha 1 |
| chr6_+_17281573 | 0.14 |
ENST00000379052.5
|
RBM24
|
RNA binding motif protein 24 |
| chr9_-_74980113 | 0.14 |
ENST00000376962.5
ENST00000376960.4 ENST00000237937.3 |
ZFAND5
|
zinc finger, AN1-type domain 5 |
| chr1_-_244013384 | 0.14 |
ENST00000366539.1
|
AKT3
|
v-akt murine thymoma viral oncogene homolog 3 |
| chr11_+_48002076 | 0.14 |
ENST00000418331.2
ENST00000440289.2 |
PTPRJ
|
protein tyrosine phosphatase, receptor type, J |
| chr2_-_197457335 | 0.13 |
ENST00000260983.3
|
HECW2
|
HECT, C2 and WW domain containing E3 ubiquitin protein ligase 2 |
| chr5_+_167718604 | 0.12 |
ENST00000265293.4
|
WWC1
|
WW and C2 domain containing 1 |
| chr3_-_114790179 | 0.12 |
ENST00000462705.1
|
ZBTB20
|
zinc finger and BTB domain containing 20 |
| chr1_+_245133062 | 0.12 |
ENST00000366523.1
|
EFCAB2
|
EF-hand calcium binding domain 2 |
| chr19_+_39616410 | 0.11 |
ENST00000602004.1
ENST00000599470.1 ENST00000321944.4 ENST00000593480.1 ENST00000358301.3 ENST00000593690.1 ENST00000599386.1 |
PAK4
|
p21 protein (Cdc42/Rac)-activated kinase 4 |
| chr6_+_44187242 | 0.11 |
ENST00000393844.1
|
SLC29A1
|
solute carrier family 29 (equilibrative nucleoside transporter), member 1 |
| chr17_-_36956155 | 0.10 |
ENST00000269554.3
|
PIP4K2B
|
phosphatidylinositol-5-phosphate 4-kinase, type II, beta |
| chr7_-_19157248 | 0.10 |
ENST00000242261.5
|
TWIST1
|
twist family bHLH transcription factor 1 |
| chr2_-_217560248 | 0.09 |
ENST00000233813.4
|
IGFBP5
|
insulin-like growth factor binding protein 5 |
| chr2_-_220025548 | 0.09 |
ENST00000356853.5
|
NHEJ1
|
nonhomologous end-joining factor 1 |
| chr17_+_2240775 | 0.09 |
ENST00000268989.3
ENST00000426855.2 |
SGSM2
|
small G protein signaling modulator 2 |
| chr12_-_56652111 | 0.08 |
ENST00000267116.7
|
ANKRD52
|
ankyrin repeat domain 52 |
| chr9_-_117568365 | 0.08 |
ENST00000374045.4
|
TNFSF15
|
tumor necrosis factor (ligand) superfamily, member 15 |
| chr17_+_30264014 | 0.08 |
ENST00000322652.5
ENST00000580398.1 |
SUZ12
|
SUZ12 polycomb repressive complex 2 subunit |
| chr17_+_46184911 | 0.08 |
ENST00000580219.1
ENST00000452859.2 ENST00000393405.2 ENST00000439357.2 ENST00000359238.2 |
SNX11
|
sorting nexin 11 |
| chr5_-_146833485 | 0.07 |
ENST00000398514.3
|
DPYSL3
|
dihydropyrimidinase-like 3 |
| chr12_-_54673871 | 0.07 |
ENST00000209875.4
|
CBX5
|
chromobox homolog 5 |
| chr1_+_180199393 | 0.07 |
ENST00000263726.2
|
LHX4
|
LIM homeobox 4 |
| chr12_-_121342170 | 0.07 |
ENST00000353487.2
|
SPPL3
|
signal peptide peptidase like 3 |
| chr2_-_97535708 | 0.07 |
ENST00000305476.5
|
SEMA4C
|
sema domain, immunoglobulin domain (Ig), transmembrane domain (TM) and short cytoplasmic domain, (semaphorin) 4C |
| chr3_+_152017181 | 0.07 |
ENST00000498502.1
ENST00000324196.5 ENST00000545754.1 ENST00000357472.3 |
MBNL1
|
muscleblind-like splicing regulator 1 |
| chrX_+_24483338 | 0.06 |
ENST00000379162.4
ENST00000441463.2 |
PDK3
|
pyruvate dehydrogenase kinase, isozyme 3 |
| chrX_+_49644470 | 0.06 |
ENST00000508866.2
|
USP27X
|
ubiquitin specific peptidase 27, X-linked |
| chr3_+_32859510 | 0.06 |
ENST00000383763.5
|
TRIM71
|
tripartite motif containing 71, E3 ubiquitin protein ligase |
| chr5_-_137090028 | 0.06 |
ENST00000314940.4
|
HNRNPA0
|
heterogeneous nuclear ribonucleoprotein A0 |
| chr11_-_6704513 | 0.06 |
ENST00000532203.1
ENST00000288937.6 |
MRPL17
|
mitochondrial ribosomal protein L17 |
| chr11_-_6633799 | 0.06 |
ENST00000299424.4
|
TAF10
|
TAF10 RNA polymerase II, TATA box binding protein (TBP)-associated factor, 30kDa |
| chr10_+_124913793 | 0.05 |
ENST00000368865.4
ENST00000538238.1 ENST00000368859.2 |
BUB3
|
BUB3 mitotic checkpoint protein |
| chr22_-_42466782 | 0.05 |
ENST00000396398.3
ENST00000403363.1 ENST00000402937.1 |
NAGA
|
N-acetylgalactosaminidase, alpha- |
| chr19_+_41768401 | 0.05 |
ENST00000352456.3
ENST00000595018.1 ENST00000597725.1 |
HNRNPUL1
|
heterogeneous nuclear ribonucleoprotein U-like 1 |
| chr14_+_75348592 | 0.05 |
ENST00000334220.4
|
DLST
|
dihydrolipoamide S-succinyltransferase (E2 component of 2-oxo-glutarate complex) |
| chr17_-_39890893 | 0.05 |
ENST00000393939.2
ENST00000347901.4 ENST00000341193.5 ENST00000310778.5 |
HAP1
|
huntingtin-associated protein 1 |
| chr15_+_77712993 | 0.04 |
ENST00000336216.4
ENST00000381714.3 ENST00000558651.1 |
HMG20A
|
high mobility group 20A |
| chr4_+_55095264 | 0.04 |
ENST00000257290.5
|
PDGFRA
|
platelet-derived growth factor receptor, alpha polypeptide |
| chr8_+_59323823 | 0.04 |
ENST00000399598.2
|
UBXN2B
|
UBX domain protein 2B |
| chr11_-_6624801 | 0.04 |
ENST00000534343.1
ENST00000254605.6 |
RRP8
|
ribosomal RNA processing 8, methyltransferase, homolog (yeast) |
| chr8_-_71316021 | 0.04 |
ENST00000452400.2
|
NCOA2
|
nuclear receptor coactivator 2 |
| chr5_-_66492562 | 0.03 |
ENST00000256447.4
|
CD180
|
CD180 molecule |
| chr14_-_77787198 | 0.03 |
ENST00000261534.4
|
POMT2
|
protein-O-mannosyltransferase 2 |
| chr14_+_60715928 | 0.03 |
ENST00000395076.4
|
PPM1A
|
protein phosphatase, Mg2+/Mn2+ dependent, 1A |
| chr1_+_145524891 | 0.03 |
ENST00000369304.3
|
ITGA10
|
integrin, alpha 10 |
| chr2_+_191273052 | 0.03 |
ENST00000417958.1
ENST00000432036.1 ENST00000392328.1 |
MFSD6
|
major facilitator superfamily domain containing 6 |
| chr14_-_76127519 | 0.03 |
ENST00000256319.6
|
C14orf1
|
chromosome 14 open reading frame 1 |
| chr1_+_117602925 | 0.02 |
ENST00000369466.4
|
TTF2
|
transcription termination factor, RNA polymerase II |
| chr12_-_42632016 | 0.02 |
ENST00000442791.3
ENST00000327791.4 ENST00000534854.2 ENST00000380788.3 ENST00000380790.4 |
YAF2
|
YY1 associated factor 2 |
| chr5_+_95187934 | 0.02 |
ENST00000357880.3
ENST00000436592.1 |
C5orf27
|
chromosome 5 open reading frame 27 |
| chr19_+_1752372 | 0.02 |
ENST00000382349.4
|
ONECUT3
|
one cut homeobox 3 |
| chr20_-_23030296 | 0.02 |
ENST00000377103.2
|
THBD
|
thrombomodulin |
| chr15_-_89456593 | 0.02 |
ENST00000558029.1
ENST00000539437.1 ENST00000542878.1 ENST00000268151.7 ENST00000566497.1 |
MFGE8
|
milk fat globule-EGF factor 8 protein |
| chr1_+_205012293 | 0.02 |
ENST00000331830.4
|
CNTN2
|
contactin 2 (axonal) |
| chr15_-_50558223 | 0.01 |
ENST00000267845.3
|
HDC
|
histidine decarboxylase |
| chr17_+_30677136 | 0.01 |
ENST00000394670.4
ENST00000321233.6 ENST00000394673.2 ENST00000341711.6 ENST00000579634.1 ENST00000580759.1 ENST00000342555.6 ENST00000577908.1 ENST00000394679.5 ENST00000582165.1 |
ZNF207
|
zinc finger protein 207 |
| chr16_-_15982440 | 0.01 |
ENST00000575938.1
ENST00000573396.1 ENST00000573968.1 ENST00000575744.1 ENST00000573429.1 ENST00000255759.6 ENST00000575073.1 |
FOPNL
|
FGFR1OP N-terminal like |
| chr2_-_114036488 | 0.01 |
ENST00000263335.7
ENST00000397647.3 ENST00000348715.5 ENST00000429538.3 |
PAX8
|
paired box 8 |
| chr6_+_44238203 | 0.01 |
ENST00000451188.2
|
TMEM151B
|
transmembrane protein 151B |
| chr9_-_127533519 | 0.01 |
ENST00000487099.2
ENST00000344523.4 ENST00000373584.3 |
NR6A1
|
nuclear receptor subfamily 6, group A, member 1 |
| chr1_+_27153173 | 0.01 |
ENST00000374142.4
|
ZDHHC18
|
zinc finger, DHHC-type containing 18 |
| chr10_+_99473455 | 0.01 |
ENST00000285605.6
|
MARVELD1
|
MARVEL domain containing 1 |
| chr15_+_92937058 | 0.01 |
ENST00000268164.3
|
ST8SIA2
|
ST8 alpha-N-acetyl-neuraminide alpha-2,8-sialyltransferase 2 |
| chr1_-_203055129 | 0.01 |
ENST00000241651.4
|
MYOG
|
myogenin (myogenic factor 4) |
| chr6_-_75994536 | 0.01 |
ENST00000475111.2
ENST00000230461.6 |
TMEM30A
|
transmembrane protein 30A |
| chr17_-_45266542 | 0.01 |
ENST00000531206.1
ENST00000527547.1 ENST00000446365.2 ENST00000575483.1 ENST00000066544.3 |
CDC27
|
cell division cycle 27 |
| chr7_-_127983877 | 0.01 |
ENST00000415472.2
ENST00000478061.1 ENST00000223073.2 ENST00000459726.1 |
RBM28
|
RNA binding motif protein 28 |
| chrX_+_117861535 | 0.01 |
ENST00000371666.3
ENST00000371642.1 |
IL13RA1
|
interleukin 13 receptor, alpha 1 |
| chr7_-_130080977 | 0.00 |
ENST00000223208.5
|
CEP41
|
centrosomal protein 41kDa |
| chr19_+_30433110 | 0.00 |
ENST00000542441.2
ENST00000392271.1 |
URI1
|
URI1, prefoldin-like chaperone |
| chr2_-_211036051 | 0.00 |
ENST00000418791.1
ENST00000452086.1 ENST00000281772.9 |
KANSL1L
|
KAT8 regulatory NSL complex subunit 1-like |
| chr9_+_77112244 | 0.00 |
ENST00000376896.3
|
RORB
|
RAR-related orphan receptor B |
| chr14_-_99947168 | 0.00 |
ENST00000331768.5
|
SETD3
|
SET domain containing 3 |
| chr3_-_196756646 | 0.00 |
ENST00000439320.1
ENST00000296351.4 ENST00000296350.5 |
MFI2
|
antigen p97 (melanoma associated) identified by monoclonal antibodies 133.2 and 96.5 |
Network of associatons between targets according to the STRING database.

First level regulatory network of GCCUGUC
Gene Ontology Analysis
Gene overrepresentation in biological_process category:
| Log-likelihood per target | Total log-likelihood | Term | Description |
|---|---|---|---|
| 0.1 | 0.4 | GO:1990926 | short-term synaptic potentiation(GO:1990926) |
| 0.1 | 0.3 | GO:1990086 | lens fiber cell apoptotic process(GO:1990086) |
| 0.0 | 0.2 | GO:0023016 | osmosensory signaling pathway(GO:0007231) signal transduction by trans-phosphorylation(GO:0023016) kidney smooth muscle tissue development(GO:0072194) pattern specification involved in metanephros development(GO:0072268) |
| 0.0 | 0.1 | GO:2000276 | negative regulation of peroxisome proliferator activated receptor signaling pathway(GO:0035359) negative regulation of oxidative phosphorylation uncoupler activity(GO:2000276) |
| 0.0 | 0.1 | GO:1904204 | regulation of skeletal muscle hypertrophy(GO:1904204) |
| 0.0 | 0.3 | GO:0018317 | protein C-linked glycosylation(GO:0018103) peptidyl-tryptophan modification(GO:0018211) protein C-linked glycosylation via tryptophan(GO:0018317) protein C-linked glycosylation via 2'-alpha-mannosyl-L-tryptophan(GO:0018406) |
| 0.0 | 0.1 | GO:0021526 | medial motor column neuron differentiation(GO:0021526) |
| 0.0 | 0.0 | GO:0031587 | positive regulation of inositol 1,4,5-trisphosphate-sensitive calcium-release channel activity(GO:0031587) |
| 0.0 | 0.1 | GO:0034499 | late endosome to Golgi transport(GO:0034499) |
| 0.0 | 0.1 | GO:0015862 | uridine transport(GO:0015862) |
| 0.0 | 0.2 | GO:0000727 | double-strand break repair via break-induced replication(GO:0000727) |
| 0.0 | 0.2 | GO:0002024 | diet induced thermogenesis(GO:0002024) |
| 0.0 | 0.3 | GO:0030043 | actin filament fragmentation(GO:0030043) |
| 0.0 | 0.2 | GO:0033629 | negative regulation of cell adhesion mediated by integrin(GO:0033629) |
| 0.0 | 0.0 | GO:1904017 | cellular response to Thyroglobulin triiodothyronine(GO:1904017) |
| 0.0 | 0.2 | GO:0021960 | anterior commissure morphogenesis(GO:0021960) |
| 0.0 | 0.2 | GO:0030322 | stabilization of membrane potential(GO:0030322) |
Gene overrepresentation in cellular_component category:
| Log-likelihood per target | Total log-likelihood | Term | Description |
|---|---|---|---|
| 0.1 | 0.4 | GO:0070032 | synaptobrevin 2-SNAP-25-syntaxin-1a-complexin I complex(GO:0070032) |
| 0.0 | 0.2 | GO:0000811 | GINS complex(GO:0000811) |
| 0.0 | 0.1 | GO:1990298 | mitotic checkpoint complex(GO:0033597) bub1-bub3 complex(GO:1990298) |
| 0.0 | 0.1 | GO:0071458 | integral component of cytoplasmic side of endoplasmic reticulum membrane(GO:0071458) |
| 0.0 | 0.1 | GO:0032807 | DNA ligase IV complex(GO:0032807) |
Gene overrepresentation in molecular_function category:
| Log-likelihood per target | Total log-likelihood | Term | Description |
|---|---|---|---|
| 0.1 | 0.3 | GO:0004174 | electron-transferring-flavoprotein dehydrogenase activity(GO:0004174) oxidoreductase activity, acting on the CH-NH group of donors, quinone or similar compound as acceptor(GO:0016649) |
| 0.1 | 0.2 | GO:0005010 | insulin-like growth factor-activated receptor activity(GO:0005010) |
| 0.1 | 0.2 | GO:0004119 | cGMP-inhibited cyclic-nucleotide phosphodiesterase activity(GO:0004119) |
| 0.0 | 0.1 | GO:0016309 | 1-phosphatidylinositol-5-phosphate 4-kinase activity(GO:0016309) |
| 0.0 | 0.2 | GO:0016167 | glial cell-derived neurotrophic factor receptor activity(GO:0016167) |
| 0.0 | 0.1 | GO:0001069 | regulatory region RNA binding(GO:0001069) |
| 0.0 | 0.1 | GO:0004740 | pyruvate dehydrogenase (acetyl-transferring) kinase activity(GO:0004740) |
| 0.0 | 0.2 | GO:0070700 | BMP receptor binding(GO:0070700) |
| 0.0 | 0.1 | GO:0070097 | delta-catenin binding(GO:0070097) |
| 0.0 | 0.1 | GO:0042500 | aspartic endopeptidase activity, intramembrane cleaving(GO:0042500) |
| 0.0 | 0.0 | GO:0005018 | platelet-derived growth factor alpha-receptor activity(GO:0005018) |
Gene overrepresentation in C2:CP category:
| Log-likelihood per target | Total log-likelihood | Term | Description |
|---|---|---|---|
| 0.0 | 0.3 | SA REG CASCADE OF CYCLIN EXPR | Expression of cyclins regulates progression through the cell cycle by activating cyclin-dependent kinases. |
Gene overrepresentation in C2:CP:REACTOME category:
| Log-likelihood per target | Total log-likelihood | Term | Description |
|---|---|---|---|
| 0.0 | 0.3 | REACTOME CDC6 ASSOCIATION WITH THE ORC ORIGIN COMPLEX | Genes involved in CDC6 association with the ORC:origin complex |
| 0.0 | 0.4 | REACTOME ACETYLCHOLINE NEUROTRANSMITTER RELEASE CYCLE | Genes involved in Acetylcholine Neurotransmitter Release Cycle |