Project
SARS-CoV-2 Analysis Results (GEO series: GSE147507)
Navigation
Downloads
Results for NFIX_NFIB
Z-value: 2.70
Motif logo

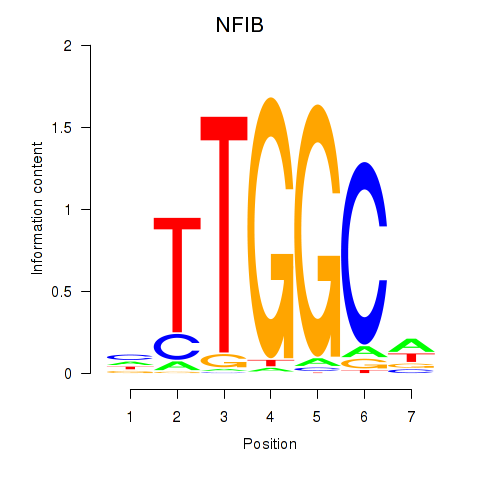
Transcription factors associated with NFIX_NFIB
| Gene Symbol | Gene ID | Gene Info |
|---|---|---|
|
NFIX
|
ENSG00000008441.12 | nuclear factor I X |
|
NFIB
|
ENSG00000147862.10 | nuclear factor I B |
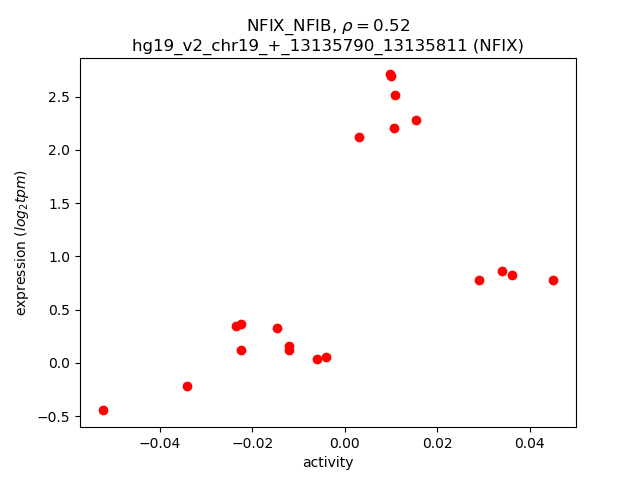
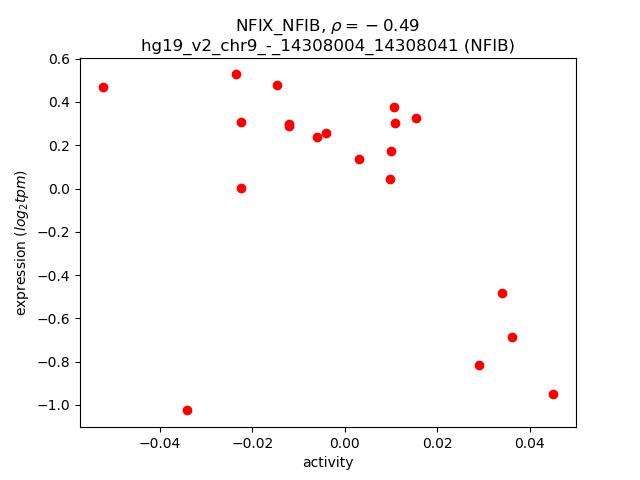
Activity-expression correlation:
| Gene | Promoter | Pearson corr. coef. | P-value | Plot |
|---|---|---|---|---|
| NFIX | hg19_v2_chr19_+_13135790_13135811 | 0.52 | 1.8e-02 | Click! |
| NFIB | hg19_v2_chr9_-_14308004_14308041 | -0.49 | 2.8e-02 | Click! |
Activity profile of NFIX_NFIB motif
Sorted Z-values of NFIX_NFIB motif
| Promoter | Log-likelihood | Transcript | Gene | Gene Info |
|---|---|---|---|---|
| chr14_+_75745477 | 8.23 |
ENST00000303562.4
ENST00000554617.1 ENST00000554212.1 ENST00000535987.1 ENST00000555242.1 |
FOS
|
FBJ murine osteosarcoma viral oncogene homolog |
| chr9_+_130911723 | 7.25 |
ENST00000277480.2
ENST00000373013.2 ENST00000540948.1 |
LCN2
|
lipocalin 2 |
| chr9_+_130911770 | 6.36 |
ENST00000372998.1
|
LCN2
|
lipocalin 2 |
| chr6_-_32145861 | 4.89 |
ENST00000336984.6
|
AGPAT1
|
1-acylglycerol-3-phosphate O-acyltransferase 1 |
| chr12_-_52914155 | 4.63 |
ENST00000549420.1
ENST00000551275.1 ENST00000546577.1 |
KRT5
|
keratin 5 |
| chr12_-_52911718 | 4.35 |
ENST00000548409.1
|
KRT5
|
keratin 5 |
| chr22_-_51066521 | 4.19 |
ENST00000395621.3
ENST00000395619.3 ENST00000356098.5 ENST00000216124.5 ENST00000453344.2 ENST00000547307.1 ENST00000547805.1 |
ARSA
|
arylsulfatase A |
| chr7_-_41742697 | 4.03 |
ENST00000242208.4
|
INHBA
|
inhibin, beta A |
| chr10_-_95360983 | 3.94 |
ENST00000371464.3
|
RBP4
|
retinol binding protein 4, plasma |
| chr1_+_209878182 | 3.86 |
ENST00000367027.3
|
HSD11B1
|
hydroxysteroid (11-beta) dehydrogenase 1 |
| chr2_+_228678550 | 3.82 |
ENST00000409189.3
ENST00000358813.4 |
CCL20
|
chemokine (C-C motif) ligand 20 |
| chr14_+_75746781 | 3.80 |
ENST00000555347.1
|
FOS
|
FBJ murine osteosarcoma viral oncogene homolog |
| chr1_-_155162658 | 3.76 |
ENST00000368389.2
ENST00000368396.4 ENST00000343256.5 ENST00000342482.4 ENST00000368398.3 ENST00000368390.3 ENST00000337604.5 ENST00000368392.3 ENST00000438413.1 ENST00000368393.3 ENST00000457295.2 ENST00000338684.5 ENST00000368395.1 |
MUC1
|
mucin 1, cell surface associated |
| chr17_-_39743139 | 3.41 |
ENST00000167586.6
|
KRT14
|
keratin 14 |
| chr1_+_207277590 | 3.37 |
ENST00000367070.3
|
C4BPA
|
complement component 4 binding protein, alpha |
| chr19_+_45973120 | 3.24 |
ENST00000592811.1
ENST00000586615.1 |
FOSB
|
FBJ murine osteosarcoma viral oncogene homolog B |
| chr19_-_42947121 | 3.23 |
ENST00000601181.1
|
CXCL17
|
chemokine (C-X-C motif) ligand 17 |
| chr14_+_24780656 | 3.19 |
ENST00000553481.1
ENST00000345363.3 |
LTB4R
|
leukotriene B4 receptor |
| chr18_+_61144160 | 3.18 |
ENST00000489441.1
ENST00000424602.1 |
SERPINB5
|
serpin peptidase inhibitor, clade B (ovalbumin), member 5 |
| chr20_-_43883197 | 3.16 |
ENST00000338380.2
|
SLPI
|
secretory leukocyte peptidase inhibitor |
| chr2_+_169926047 | 3.11 |
ENST00000428522.1
ENST00000450153.1 ENST00000421653.1 |
DHRS9
|
dehydrogenase/reductase (SDR family) member 9 |
| chr3_+_193853927 | 3.08 |
ENST00000232424.3
|
HES1
|
hes family bHLH transcription factor 1 |
| chr1_+_150480551 | 3.08 |
ENST00000369049.4
ENST00000369047.4 |
ECM1
|
extracellular matrix protein 1 |
| chr14_+_96722152 | 3.07 |
ENST00000216629.6
|
BDKRB1
|
bradykinin receptor B1 |
| chr1_-_209792111 | 3.04 |
ENST00000455193.1
|
LAMB3
|
laminin, beta 3 |
| chr5_+_147443534 | 3.03 |
ENST00000398454.1
ENST00000359874.3 ENST00000508733.1 ENST00000256084.7 |
SPINK5
|
serine peptidase inhibitor, Kazal type 5 |
| chr16_+_67197288 | 2.95 |
ENST00000264009.8
ENST00000421453.1 |
HSF4
|
heat shock transcription factor 4 |
| chr17_-_39093672 | 2.94 |
ENST00000209718.3
ENST00000436344.3 ENST00000485751.1 |
KRT23
|
keratin 23 (histone deacetylase inducible) |
| chr1_+_150480576 | 2.93 |
ENST00000346569.6
|
ECM1
|
extracellular matrix protein 1 |
| chr8_+_124194875 | 2.84 |
ENST00000522648.1
ENST00000276699.6 |
FAM83A
|
family with sequence similarity 83, member A |
| chr2_-_166651152 | 2.73 |
ENST00000431484.1
ENST00000412248.1 |
GALNT3
|
UDP-N-acetyl-alpha-D-galactosamine:polypeptide N-acetylgalactosaminyltransferase 3 (GalNAc-T3) |
| chr2_-_166651191 | 2.67 |
ENST00000392701.3
|
GALNT3
|
UDP-N-acetyl-alpha-D-galactosamine:polypeptide N-acetylgalactosaminyltransferase 3 (GalNAc-T3) |
| chr17_+_7344057 | 2.65 |
ENST00000575398.1
ENST00000575082.1 |
FGF11
|
fibroblast growth factor 11 |
| chr11_-_65641044 | 2.55 |
ENST00000527378.1
|
EFEMP2
|
EGF containing fibulin-like extracellular matrix protein 2 |
| chr19_+_11455900 | 2.52 |
ENST00000588790.1
|
CCDC159
|
coiled-coil domain containing 159 |
| chr5_+_167181917 | 2.48 |
ENST00000519204.1
|
TENM2
|
teneurin transmembrane protein 2 |
| chr20_-_48770244 | 2.43 |
ENST00000371650.5
ENST00000371652.4 ENST00000557021.1 |
TMEM189
|
transmembrane protein 189 |
| chr5_+_31193847 | 2.42 |
ENST00000514738.1
ENST00000265071.2 |
CDH6
|
cadherin 6, type 2, K-cadherin (fetal kidney) |
| chr19_-_14228541 | 2.41 |
ENST00000590853.1
ENST00000308677.4 |
PRKACA
|
protein kinase, cAMP-dependent, catalytic, alpha |
| chr9_-_139948487 | 2.39 |
ENST00000355097.2
|
ENTPD2
|
ectonucleoside triphosphate diphosphohydrolase 2 |
| chr20_+_6748311 | 2.38 |
ENST00000378827.4
|
BMP2
|
bone morphogenetic protein 2 |
| chr8_+_124194752 | 2.37 |
ENST00000318462.6
|
FAM83A
|
family with sequence similarity 83, member A |
| chr18_+_61143994 | 2.30 |
ENST00000382771.4
|
SERPINB5
|
serpin peptidase inhibitor, clade B (ovalbumin), member 5 |
| chr1_-_17307173 | 2.26 |
ENST00000438542.1
ENST00000375535.3 |
MFAP2
|
microfibrillar-associated protein 2 |
| chr2_+_240323439 | 2.20 |
ENST00000428471.1
ENST00000413029.1 |
AC062017.1
|
Uncharacterized protein |
| chr1_+_68150744 | 2.20 |
ENST00000370986.4
ENST00000370985.3 |
GADD45A
|
growth arrest and DNA-damage-inducible, alpha |
| chr2_-_46385 | 2.15 |
ENST00000327669.4
|
FAM110C
|
family with sequence similarity 110, member C |
| chr1_-_153363452 | 2.14 |
ENST00000368732.1
ENST00000368733.3 |
S100A8
|
S100 calcium binding protein A8 |
| chr14_+_96722539 | 2.14 |
ENST00000553356.1
|
BDKRB1
|
bradykinin receptor B1 |
| chr11_+_18287721 | 2.13 |
ENST00000356524.4
|
SAA1
|
serum amyloid A1 |
| chr19_-_54663473 | 2.13 |
ENST00000222224.3
|
LENG1
|
leukocyte receptor cluster (LRC) member 1 |
| chr3_-_49851313 | 2.13 |
ENST00000333486.3
|
UBA7
|
ubiquitin-like modifier activating enzyme 7 |
| chr14_-_100772862 | 2.12 |
ENST00000359232.3
|
SLC25A29
|
solute carrier family 25 (mitochondrial carnitine/acylcarnitine carrier), member 29 |
| chr11_+_123986069 | 2.12 |
ENST00000456829.2
ENST00000361352.5 ENST00000449321.1 ENST00000392748.1 ENST00000360334.4 ENST00000392744.4 |
VWA5A
|
von Willebrand factor A domain containing 5A |
| chr11_+_34654011 | 2.09 |
ENST00000531794.1
|
EHF
|
ets homologous factor |
| chr12_+_52450298 | 2.09 |
ENST00000550582.2
|
NR4A1
|
nuclear receptor subfamily 4, group A, member 1 |
| chr1_-_39407450 | 2.08 |
ENST00000372990.1
|
RHBDL2
|
rhomboid, veinlet-like 2 (Drosophila) |
| chr5_-_134914673 | 2.07 |
ENST00000512158.1
|
CXCL14
|
chemokine (C-X-C motif) ligand 14 |
| chr5_+_167182003 | 2.07 |
ENST00000520394.1
|
TENM2
|
teneurin transmembrane protein 2 |
| chr17_-_39780634 | 2.06 |
ENST00000577817.2
|
KRT17
|
keratin 17 |
| chr14_-_100772767 | 2.05 |
ENST00000392908.3
ENST00000539621.1 |
SLC25A29
|
solute carrier family 25 (mitochondrial carnitine/acylcarnitine carrier), member 29 |
| chr21_-_28215332 | 2.05 |
ENST00000517777.1
|
ADAMTS1
|
ADAM metallopeptidase with thrombospondin type 1 motif, 1 |
| chr3_+_9975497 | 2.03 |
ENST00000397170.3
ENST00000383811.3 ENST00000452070.1 ENST00000326434.5 |
CRELD1
|
cysteine-rich with EGF-like domains 1 |
| chr6_-_30712313 | 2.02 |
ENST00000376377.2
ENST00000259874.5 |
IER3
|
immediate early response 3 |
| chr10_+_135340859 | 2.02 |
ENST00000252945.3
ENST00000421586.1 ENST00000418356.1 |
CYP2E1
|
cytochrome P450, family 2, subfamily E, polypeptide 1 |
| chr1_-_230850043 | 2.00 |
ENST00000366667.4
|
AGT
|
angiotensinogen (serpin peptidase inhibitor, clade A, member 8) |
| chr17_+_3572087 | 1.98 |
ENST00000248378.5
ENST00000397133.2 |
EMC6
|
ER membrane protein complex subunit 6 |
| chr20_+_36974759 | 1.98 |
ENST00000217407.2
|
LBP
|
lipopolysaccharide binding protein |
| chr1_+_20915409 | 1.97 |
ENST00000375071.3
|
CDA
|
cytidine deaminase |
| chr17_-_39769005 | 1.96 |
ENST00000301653.4
ENST00000593067.1 |
KRT16
|
keratin 16 |
| chr19_-_10213335 | 1.96 |
ENST00000592641.1
ENST00000253109.4 |
ANGPTL6
|
angiopoietin-like 6 |
| chr7_+_149535455 | 1.95 |
ENST00000223210.4
ENST00000460379.1 |
ZNF862
|
zinc finger protein 862 |
| chr1_+_44399347 | 1.95 |
ENST00000477048.1
ENST00000471394.2 |
ARTN
|
artemin |
| chr19_+_5914213 | 1.93 |
ENST00000222125.5
ENST00000452990.2 ENST00000588865.1 |
CAPS
|
calcyphosine |
| chr1_+_44399466 | 1.93 |
ENST00000498139.2
ENST00000491846.1 |
ARTN
|
artemin |
| chr9_+_35673853 | 1.92 |
ENST00000378357.4
|
CA9
|
carbonic anhydrase IX |
| chr19_-_6720686 | 1.91 |
ENST00000245907.6
|
C3
|
complement component 3 |
| chr1_-_32169920 | 1.89 |
ENST00000373672.3
ENST00000373668.3 |
COL16A1
|
collagen, type XVI, alpha 1 |
| chr17_+_25958174 | 1.89 |
ENST00000313648.6
ENST00000577392.1 ENST00000584661.1 ENST00000413914.2 |
LGALS9
|
lectin, galactoside-binding, soluble, 9 |
| chr19_+_35609380 | 1.87 |
ENST00000604621.1
|
FXYD3
|
FXYD domain containing ion transport regulator 3 |
| chr10_+_88728189 | 1.87 |
ENST00000416348.1
|
ADIRF
|
adipogenesis regulatory factor |
| chr7_+_141490017 | 1.86 |
ENST00000247883.4
|
TAS2R5
|
taste receptor, type 2, member 5 |
| chr1_+_1167594 | 1.84 |
ENST00000379198.2
|
B3GALT6
|
UDP-Gal:betaGal beta 1,3-galactosyltransferase polypeptide 6 |
| chr2_+_85804614 | 1.84 |
ENST00000263864.5
ENST00000409760.1 |
VAMP8
|
vesicle-associated membrane protein 8 |
| chr9_-_140115775 | 1.81 |
ENST00000391553.1
ENST00000392827.1 |
RNF208
|
ring finger protein 208 |
| chr8_-_49833978 | 1.81 |
ENST00000020945.1
|
SNAI2
|
snail family zinc finger 2 |
| chr8_+_97597148 | 1.80 |
ENST00000521590.1
|
SDC2
|
syndecan 2 |
| chr19_-_40324767 | 1.80 |
ENST00000601972.1
ENST00000430012.2 ENST00000323039.5 ENST00000348817.3 |
DYRK1B
|
dual-specificity tyrosine-(Y)-phosphorylation regulated kinase 1B |
| chr6_-_159420780 | 1.80 |
ENST00000449822.1
|
RSPH3
|
radial spoke 3 homolog (Chlamydomonas) |
| chr10_-_10836919 | 1.79 |
ENST00000602763.1
ENST00000415590.2 ENST00000434919.2 |
SFTA1P
|
surfactant associated 1, pseudogene |
| chr19_+_55851221 | 1.79 |
ENST00000255613.3
ENST00000539076.1 |
SUV420H2
AC020922.1
|
suppressor of variegation 4-20 homolog 2 (Drosophila) Uncharacterized protein |
| chr1_-_182360498 | 1.78 |
ENST00000417584.2
|
GLUL
|
glutamate-ammonia ligase |
| chr6_+_30848557 | 1.78 |
ENST00000460944.2
ENST00000324771.8 |
DDR1
|
discoidin domain receptor tyrosine kinase 1 |
| chr6_-_42981651 | 1.78 |
ENST00000244711.3
|
MEA1
|
male-enhanced antigen 1 |
| chr11_-_119999611 | 1.74 |
ENST00000529044.1
|
TRIM29
|
tripartite motif containing 29 |
| chr10_-_126138622 | 1.74 |
ENST00000451024.3
|
NKX1-2
|
NK1 homeobox 2 |
| chr1_+_86889769 | 1.74 |
ENST00000370565.4
|
CLCA2
|
chloride channel accessory 2 |
| chr14_+_75746340 | 1.74 |
ENST00000555686.1
ENST00000555672.1 |
FOS
|
FBJ murine osteosarcoma viral oncogene homolog |
| chr1_+_44398943 | 1.73 |
ENST00000372359.5
ENST00000414809.3 |
ARTN
|
artemin |
| chr11_+_18287801 | 1.72 |
ENST00000532858.1
ENST00000405158.2 |
SAA1
|
serum amyloid A1 |
| chr19_-_46916805 | 1.71 |
ENST00000307522.3
|
CCDC8
|
coiled-coil domain containing 8 |
| chr7_-_94953878 | 1.71 |
ENST00000222381.3
|
PON1
|
paraoxonase 1 |
| chr19_-_43032532 | 1.70 |
ENST00000403461.1
ENST00000352591.5 ENST00000358394.3 ENST00000403444.3 ENST00000308072.4 ENST00000599389.1 ENST00000351134.3 ENST00000161559.6 |
CEACAM1
|
carcinoembryonic antigen-related cell adhesion molecule 1 (biliary glycoprotein) |
| chr12_-_28124903 | 1.70 |
ENST00000395872.1
ENST00000354417.3 ENST00000201015.4 |
PTHLH
|
parathyroid hormone-like hormone |
| chr2_-_113594279 | 1.69 |
ENST00000416750.1
ENST00000418817.1 ENST00000263341.2 |
IL1B
|
interleukin 1, beta |
| chr1_-_39407467 | 1.69 |
ENST00000540558.1
|
RHBDL2
|
rhomboid, veinlet-like 2 (Drosophila) |
| chr5_-_172198190 | 1.68 |
ENST00000239223.3
|
DUSP1
|
dual specificity phosphatase 1 |
| chr1_+_153003671 | 1.68 |
ENST00000307098.4
|
SPRR1B
|
small proline-rich protein 1B |
| chr2_-_152382500 | 1.68 |
ENST00000434685.1
|
NEB
|
nebulin |
| chrX_+_134654540 | 1.68 |
ENST00000370752.4
|
DDX26B
|
DEAD/H (Asp-Glu-Ala-Asp/His) box polypeptide 26B |
| chr5_+_148206156 | 1.67 |
ENST00000305988.4
|
ADRB2
|
adrenoceptor beta 2, surface |
| chr15_+_40733387 | 1.66 |
ENST00000416165.1
|
BAHD1
|
bromo adjacent homology domain containing 1 |
| chr2_-_96192450 | 1.64 |
ENST00000609975.1
|
RP11-440D17.3
|
RP11-440D17.3 |
| chr1_+_6845384 | 1.64 |
ENST00000303635.7
|
CAMTA1
|
calmodulin binding transcription activator 1 |
| chr11_+_308143 | 1.64 |
ENST00000399817.4
|
IFITM2
|
interferon induced transmembrane protein 2 |
| chr5_-_150948414 | 1.63 |
ENST00000261800.5
|
FAT2
|
FAT atypical cadherin 2 |
| chr8_-_11710979 | 1.63 |
ENST00000415599.2
|
CTSB
|
cathepsin B |
| chr1_-_6550625 | 1.62 |
ENST00000377725.1
ENST00000340850.5 |
PLEKHG5
|
pleckstrin homology domain containing, family G (with RhoGef domain) member 5 |
| chr1_-_32169761 | 1.62 |
ENST00000271069.6
|
COL16A1
|
collagen, type XVI, alpha 1 |
| chr22_+_40390930 | 1.61 |
ENST00000333407.6
|
FAM83F
|
family with sequence similarity 83, member F |
| chr1_+_153746683 | 1.61 |
ENST00000271857.2
|
SLC27A3
|
solute carrier family 27 (fatty acid transporter), member 3 |
| chr10_-_64576105 | 1.61 |
ENST00000242480.3
ENST00000411732.1 |
EGR2
|
early growth response 2 |
| chr16_-_79634595 | 1.61 |
ENST00000326043.4
ENST00000393350.1 |
MAF
|
v-maf avian musculoaponeurotic fibrosarcoma oncogene homolog |
| chr1_-_204183071 | 1.61 |
ENST00000308302.3
|
GOLT1A
|
golgi transport 1A |
| chr12_-_10875831 | 1.59 |
ENST00000279550.7
ENST00000228251.4 |
YBX3
|
Y box binding protein 3 |
| chr21_-_28217721 | 1.59 |
ENST00000284984.3
|
ADAMTS1
|
ADAM metallopeptidase with thrombospondin type 1 motif, 1 |
| chr4_-_74964904 | 1.59 |
ENST00000508487.2
|
CXCL2
|
chemokine (C-X-C motif) ligand 2 |
| chr8_-_145060593 | 1.59 |
ENST00000313059.5
ENST00000524918.1 ENST00000313028.7 ENST00000525773.1 |
PARP10
|
poly (ADP-ribose) polymerase family, member 10 |
| chr19_+_17581253 | 1.58 |
ENST00000252595.7
ENST00000598424.1 |
SLC27A1
|
solute carrier family 27 (fatty acid transporter), member 1 |
| chr3_-_172241250 | 1.58 |
ENST00000420541.2
ENST00000241261.2 |
TNFSF10
|
tumor necrosis factor (ligand) superfamily, member 10 |
| chr1_+_79115503 | 1.58 |
ENST00000370747.4
ENST00000438486.1 ENST00000545124.1 |
IFI44
|
interferon-induced protein 44 |
| chr8_-_49834299 | 1.58 |
ENST00000396822.1
|
SNAI2
|
snail family zinc finger 2 |
| chr19_+_36134528 | 1.56 |
ENST00000591135.1
|
ETV2
|
ets variant 2 |
| chr14_-_24036943 | 1.55 |
ENST00000556843.1
ENST00000397120.3 ENST00000557189.1 |
AP1G2
|
adaptor-related protein complex 1, gamma 2 subunit |
| chr19_-_15529790 | 1.55 |
ENST00000596195.1
ENST00000595067.1 ENST00000595465.2 ENST00000397410.5 ENST00000600247.1 |
AKAP8L
|
A kinase (PRKA) anchor protein 8-like |
| chr19_+_15783879 | 1.55 |
ENST00000551607.1
|
CYP4F12
|
cytochrome P450, family 4, subfamily F, polypeptide 12 |
| chr1_-_182360918 | 1.54 |
ENST00000339526.4
|
GLUL
|
glutamate-ammonia ligase |
| chr12_+_121078355 | 1.53 |
ENST00000316803.3
|
CABP1
|
calcium binding protein 1 |
| chr17_-_8055747 | 1.53 |
ENST00000317276.4
ENST00000581703.1 |
PER1
|
period circadian clock 1 |
| chr19_+_10196781 | 1.52 |
ENST00000253110.11
|
C19orf66
|
chromosome 19 open reading frame 66 |
| chr1_-_1167411 | 1.50 |
ENST00000263741.7
|
SDF4
|
stromal cell derived factor 4 |
| chr1_+_1846519 | 1.48 |
ENST00000378604.3
|
CALML6
|
calmodulin-like 6 |
| chr1_-_209979465 | 1.48 |
ENST00000542854.1
|
IRF6
|
interferon regulatory factor 6 |
| chr1_+_207277632 | 1.48 |
ENST00000421786.1
|
C4BPA
|
complement component 4 binding protein, alpha |
| chr12_-_53574418 | 1.47 |
ENST00000379843.3
ENST00000453446.2 ENST00000437073.1 |
CSAD
|
cysteine sulfinic acid decarboxylase |
| chr1_-_1167346 | 1.47 |
ENST00000545427.1
ENST00000360001.6 |
SDF4
|
stromal cell derived factor 4 |
| chr10_-_123357598 | 1.46 |
ENST00000358487.5
ENST00000369058.3 ENST00000369060.4 ENST00000359354.2 |
FGFR2
|
fibroblast growth factor receptor 2 |
| chr22_+_30792980 | 1.46 |
ENST00000403484.1
ENST00000405717.3 ENST00000402592.3 |
SEC14L2
|
SEC14-like 2 (S. cerevisiae) |
| chr10_+_115312766 | 1.45 |
ENST00000351270.3
|
HABP2
|
hyaluronan binding protein 2 |
| chr15_-_75199178 | 1.45 |
ENST00000563119.1
ENST00000457294.2 |
FAM219B
|
family with sequence similarity 219, member B |
| chr1_-_26680570 | 1.45 |
ENST00000475866.2
|
AIM1L
|
absent in melanoma 1-like |
| chr1_+_32674675 | 1.45 |
ENST00000409358.1
|
DCDC2B
|
doublecortin domain containing 2B |
| chr11_-_66056596 | 1.44 |
ENST00000471387.2
ENST00000359461.6 ENST00000376901.4 |
YIF1A
|
Yip1 interacting factor homolog A (S. cerevisiae) |
| chr1_-_205912577 | 1.43 |
ENST00000367135.3
ENST00000367134.2 |
SLC26A9
|
solute carrier family 26 (anion exchanger), member 9 |
| chr17_-_39661849 | 1.43 |
ENST00000246635.3
ENST00000336861.3 ENST00000587544.1 ENST00000587435.1 |
KRT13
|
keratin 13 |
| chr12_-_54785054 | 1.43 |
ENST00000352268.6
ENST00000549962.1 |
ZNF385A
|
zinc finger protein 385A |
| chr12_-_53574376 | 1.43 |
ENST00000267085.4
ENST00000379850.3 ENST00000379846.1 ENST00000424990.1 |
CSAD
|
cysteine sulfinic acid decarboxylase |
| chrX_-_73061339 | 1.41 |
ENST00000602863.1
|
XIST
|
X inactive specific transcript (non-protein coding) |
| chr11_-_18270182 | 1.40 |
ENST00000528349.1
ENST00000526900.1 ENST00000529528.1 ENST00000414546.2 ENST00000256733.4 |
SAA2
|
serum amyloid A2 |
| chr11_+_64008525 | 1.40 |
ENST00000449942.2
|
FKBP2
|
FK506 binding protein 2, 13kDa |
| chr19_-_460996 | 1.40 |
ENST00000264554.6
|
SHC2
|
SHC (Src homology 2 domain containing) transforming protein 2 |
| chr17_+_74261277 | 1.39 |
ENST00000327490.6
|
UBALD2
|
UBA-like domain containing 2 |
| chr11_-_104827425 | 1.39 |
ENST00000393150.3
|
CASP4
|
caspase 4, apoptosis-related cysteine peptidase |
| chr11_+_117947782 | 1.38 |
ENST00000522307.1
ENST00000523251.1 ENST00000437212.3 ENST00000522824.1 ENST00000522151.1 |
TMPRSS4
|
transmembrane protease, serine 4 |
| chr6_+_150690133 | 1.38 |
ENST00000392255.3
ENST00000500320.3 |
IYD
|
iodotyrosine deiodinase |
| chr14_+_23790655 | 1.38 |
ENST00000397276.2
|
PABPN1
|
poly(A) binding protein, nuclear 1 |
| chr3_+_99357319 | 1.38 |
ENST00000452013.1
ENST00000261037.3 ENST00000273342.4 |
COL8A1
|
collagen, type VIII, alpha 1 |
| chr22_+_30792846 | 1.38 |
ENST00000312932.9
ENST00000428195.1 |
SEC14L2
|
SEC14-like 2 (S. cerevisiae) |
| chr5_+_176784837 | 1.37 |
ENST00000408923.3
|
RGS14
|
regulator of G-protein signaling 14 |
| chr17_+_42427826 | 1.37 |
ENST00000586443.1
|
GRN
|
granulin |
| chr13_-_95364389 | 1.37 |
ENST00000376945.2
|
SOX21
|
SRY (sex determining region Y)-box 21 |
| chr19_-_3062881 | 1.36 |
ENST00000586742.1
|
AES
|
amino-terminal enhancer of split |
| chr1_+_155100342 | 1.36 |
ENST00000368406.2
|
EFNA1
|
ephrin-A1 |
| chr19_+_46002868 | 1.35 |
ENST00000396735.2
|
PPM1N
|
protein phosphatase, Mg2+/Mn2+ dependent, 1N (putative) |
| chr9_+_6215799 | 1.35 |
ENST00000417746.2
ENST00000456383.2 |
IL33
|
interleukin 33 |
| chr10_-_5660118 | 1.35 |
ENST00000427341.1
|
RP11-336A10.4
|
RP11-336A10.4 |
| chr11_+_57310114 | 1.35 |
ENST00000527972.1
ENST00000399154.2 |
SMTNL1
|
smoothelin-like 1 |
| chr1_-_209979375 | 1.35 |
ENST00000367021.3
|
IRF6
|
interferon regulatory factor 6 |
| chr9_+_133320339 | 1.34 |
ENST00000372394.1
ENST00000372393.3 ENST00000422569.1 |
ASS1
|
argininosuccinate synthase 1 |
| chr3_+_133465228 | 1.34 |
ENST00000482271.1
ENST00000264998.3 |
TF
|
transferrin |
| chr12_+_6493199 | 1.33 |
ENST00000228918.4
|
LTBR
|
lymphotoxin beta receptor (TNFR superfamily, member 3) |
| chr19_-_56663250 | 1.33 |
ENST00000376271.1
|
AC024580.1
|
Uncharacterized protein |
| chr11_-_119999539 | 1.32 |
ENST00000541857.1
|
TRIM29
|
tripartite motif containing 29 |
| chr3_-_48471454 | 1.32 |
ENST00000296440.6
ENST00000448774.2 |
PLXNB1
|
plexin B1 |
| chr19_+_10381769 | 1.32 |
ENST00000423829.2
ENST00000588645.1 |
ICAM1
|
intercellular adhesion molecule 1 |
| chr19_-_12845550 | 1.32 |
ENST00000242784.4
|
C19orf43
|
chromosome 19 open reading frame 43 |
| chr7_+_45927956 | 1.31 |
ENST00000275525.3
ENST00000457280.1 |
IGFBP1
|
insulin-like growth factor binding protein 1 |
| chr1_+_158979792 | 1.31 |
ENST00000359709.3
ENST00000430894.2 |
IFI16
|
interferon, gamma-inducible protein 16 |
| chr10_-_101825151 | 1.31 |
ENST00000441382.1
|
CPN1
|
carboxypeptidase N, polypeptide 1 |
| chr8_+_143761874 | 1.31 |
ENST00000301258.4
ENST00000513264.1 |
PSCA
|
prostate stem cell antigen |
| chr12_-_8815215 | 1.31 |
ENST00000544889.1
ENST00000543369.1 |
MFAP5
|
microfibrillar associated protein 5 |
| chr1_-_153013588 | 1.31 |
ENST00000360379.3
|
SPRR2D
|
small proline-rich protein 2D |
| chr5_-_180236811 | 1.30 |
ENST00000446023.2
|
MGAT1
|
mannosyl (alpha-1,3-)-glycoprotein beta-1,2-N-acetylglucosaminyltransferase |
| chrX_+_102469997 | 1.29 |
ENST00000372695.5
ENST00000372691.3 |
BEX4
|
brain expressed, X-linked 4 |
| chr11_-_61646054 | 1.29 |
ENST00000527379.1
|
FADS3
|
fatty acid desaturase 3 |
| chr5_-_141249154 | 1.29 |
ENST00000357517.5
ENST00000536585.1 |
PCDH1
|
protocadherin 1 |
| chr2_-_157189180 | 1.29 |
ENST00000539077.1
ENST00000424077.1 ENST00000426264.1 ENST00000339562.4 ENST00000421709.1 |
NR4A2
|
nuclear receptor subfamily 4, group A, member 2 |
| chr14_+_24641062 | 1.29 |
ENST00000311457.3
ENST00000557806.1 ENST00000559919.1 |
REC8
|
REC8 meiotic recombination protein |
| chr12_-_122238913 | 1.29 |
ENST00000537157.1
|
AC084018.1
|
AC084018.1 |
| chr8_+_95653427 | 1.29 |
ENST00000454170.2
|
ESRP1
|
epithelial splicing regulatory protein 1 |
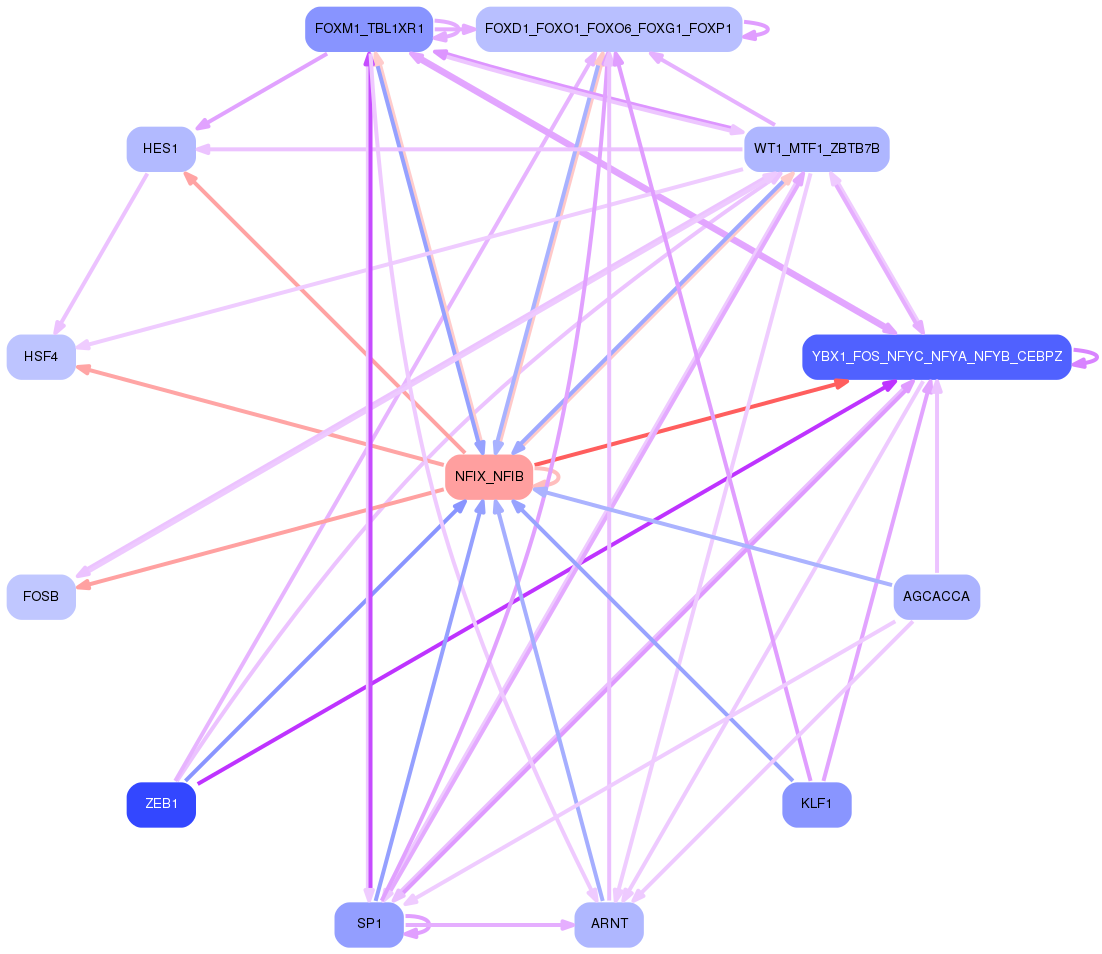
Network of associatons between targets according to the STRING database.

First level regulatory network of NFIX_NFIB
Gene Ontology Analysis
Gene overrepresentation in biological_process category:
| Log-likelihood per target | Total log-likelihood | Term | Description |
|---|---|---|---|
| 2.9 | 14.4 | GO:0015891 | iron chelate transport(GO:0015688) siderophore transport(GO:0015891) |
| 1.7 | 1.7 | GO:0002859 | negative regulation of response to tumor cell(GO:0002835) negative regulation of immune response to tumor cell(GO:0002838) negative regulation of natural killer cell mediated immune response to tumor cell(GO:0002856) negative regulation of natural killer cell mediated cytotoxicity directed against tumor cell target(GO:0002859) |
| 1.6 | 4.9 | GO:1990575 | mitochondrial L-ornithine transmembrane transport(GO:1990575) |
| 1.6 | 14.5 | GO:0001661 | conditioned taste aversion(GO:0001661) |
| 1.6 | 4.7 | GO:0045360 | regulation of interleukin-1 biosynthetic process(GO:0045360) positive regulation of interleukin-1 biosynthetic process(GO:0045362) |
| 1.3 | 4.0 | GO:0060279 | regulation of ovulation(GO:0060278) positive regulation of ovulation(GO:0060279) |
| 1.1 | 3.4 | GO:0070563 | negative regulation of vitamin D receptor signaling pathway(GO:0070563) |
| 1.1 | 3.4 | GO:2000974 | negative regulation of auditory receptor cell differentiation(GO:0045608) negative regulation of pro-B cell differentiation(GO:2000974) |
| 1.0 | 3.1 | GO:0051040 | regulation of calcium-independent cell-cell adhesion(GO:0051040) |
| 1.0 | 5.9 | GO:0097021 | lymphocyte migration into lymphoid organs(GO:0097021) |
| 0.9 | 4.7 | GO:0042412 | taurine biosynthetic process(GO:0042412) |
| 0.9 | 2.6 | GO:1904328 | regulation of myofibroblast contraction(GO:1904328) myofibroblast contraction(GO:1990764) |
| 0.9 | 3.5 | GO:0006542 | glutamine biosynthetic process(GO:0006542) |
| 0.8 | 2.5 | GO:0015920 | lipopolysaccharide transport(GO:0015920) |
| 0.8 | 2.5 | GO:0003273 | cell migration involved in endocardial cushion formation(GO:0003273) |
| 0.8 | 2.4 | GO:0046521 | sphingoid catabolic process(GO:0046521) |
| 0.8 | 2.4 | GO:0035602 | fibroblast growth factor receptor signaling pathway involved in negative regulation of apoptotic process in bone marrow(GO:0035602) fibroblast growth factor receptor signaling pathway involved in hemopoiesis(GO:0035603) fibroblast growth factor receptor signaling pathway involved in positive regulation of cell proliferation in bone marrow(GO:0035604) fibroblast growth factor receptor signaling pathway involved in mammary gland specification(GO:0060595) mammary gland bud formation(GO:0060615) branch elongation involved in salivary gland morphogenesis(GO:0060667) mesenchymal cell differentiation involved in lung development(GO:0060915) |
| 0.8 | 4.0 | GO:0061737 | leukotriene signaling pathway(GO:0061737) |
| 0.8 | 3.9 | GO:0048807 | female genitalia morphogenesis(GO:0048807) |
| 0.8 | 4.6 | GO:0009181 | purine nucleoside diphosphate catabolic process(GO:0009137) purine ribonucleoside diphosphate catabolic process(GO:0009181) |
| 0.8 | 5.3 | GO:0002784 | regulation of antimicrobial peptide production(GO:0002784) regulation of antibacterial peptide production(GO:0002786) |
| 0.7 | 3.0 | GO:0003331 | regulation of extracellular matrix constituent secretion(GO:0003330) positive regulation of extracellular matrix constituent secretion(GO:0003331) |
| 0.7 | 5.9 | GO:0018242 | protein O-linked glycosylation via serine(GO:0018242) |
| 0.7 | 0.7 | GO:1904294 | positive regulation of ERAD pathway(GO:1904294) |
| 0.7 | 2.1 | GO:0021569 | rhombomere 3 development(GO:0021569) |
| 0.7 | 4.1 | GO:0045110 | intermediate filament bundle assembly(GO:0045110) |
| 0.7 | 2.0 | GO:1904247 | positive regulation of polynucleotide adenylyltransferase activity(GO:1904247) |
| 0.7 | 2.0 | GO:0070446 | cellular response to caloric restriction(GO:0061433) negative regulation of oligodendrocyte progenitor proliferation(GO:0070446) |
| 0.7 | 2.0 | GO:0042450 | arginine biosynthetic process via ornithine(GO:0042450) |
| 0.7 | 2.0 | GO:0019858 | cytosine metabolic process(GO:0019858) |
| 0.6 | 1.9 | GO:0001798 | positive regulation of type IIa hypersensitivity(GO:0001798) positive regulation of type II hypersensitivity(GO:0002894) |
| 0.6 | 0.6 | GO:2000777 | positive regulation of proteasomal ubiquitin-dependent protein catabolic process involved in cellular response to hypoxia(GO:2000777) |
| 0.6 | 1.9 | GO:2001190 | natural killer cell tolerance induction(GO:0002519) positive regulation of T cell activation via T cell receptor contact with antigen bound to MHC molecule on antigen presenting cell(GO:2001190) |
| 0.6 | 2.5 | GO:1904106 | protein localization to microvillus(GO:1904106) |
| 0.6 | 1.8 | GO:1903595 | positive regulation of histamine secretion by mast cell(GO:1903595) |
| 0.6 | 1.8 | GO:0042308 | negative regulation of protein import into nucleus(GO:0042308) negative regulation of protein import(GO:1904590) |
| 0.6 | 1.8 | GO:0001579 | medium-chain fatty acid transport(GO:0001579) |
| 0.6 | 1.8 | GO:0051866 | general adaptation syndrome(GO:0051866) |
| 0.6 | 1.7 | GO:0030070 | insulin processing(GO:0030070) |
| 0.6 | 1.7 | GO:0002025 | vasodilation by norepinephrine-epinephrine involved in regulation of systemic arterial blood pressure(GO:0002025) |
| 0.5 | 0.5 | GO:1903800 | positive regulation of production of miRNAs involved in gene silencing by miRNA(GO:1903800) |
| 0.5 | 3.2 | GO:0032730 | positive regulation of interleukin-1 alpha production(GO:0032730) |
| 0.5 | 1.6 | GO:0060796 | regulation of transcription involved in primary germ layer cell fate commitment(GO:0060796) |
| 0.5 | 2.1 | GO:0009615 | response to virus(GO:0009615) |
| 0.5 | 0.5 | GO:0009822 | alkaloid catabolic process(GO:0009822) |
| 0.5 | 1.5 | GO:1903526 | negative regulation of membrane tubulation(GO:1903526) |
| 0.5 | 0.5 | GO:0017186 | peptidyl-pyroglutamic acid biosynthetic process, using glutaminyl-peptide cyclotransferase(GO:0017186) |
| 0.5 | 1.5 | GO:1904784 | NLRP1 inflammasome complex assembly(GO:1904784) |
| 0.5 | 0.5 | GO:0043449 | cellular alkene metabolic process(GO:0043449) |
| 0.5 | 2.3 | GO:0034443 | negative regulation of lipoprotein oxidation(GO:0034443) |
| 0.5 | 4.5 | GO:0045959 | regulation of complement activation, classical pathway(GO:0030450) negative regulation of complement activation, classical pathway(GO:0045959) |
| 0.4 | 4.4 | GO:0002480 | antigen processing and presentation of exogenous peptide antigen via MHC class I, TAP-independent(GO:0002480) |
| 0.4 | 3.5 | GO:1902714 | negative regulation of interferon-gamma secretion(GO:1902714) |
| 0.4 | 0.9 | GO:0002925 | positive regulation of humoral immune response mediated by circulating immunoglobulin(GO:0002925) |
| 0.4 | 3.0 | GO:1903575 | cornified envelope assembly(GO:1903575) |
| 0.4 | 1.3 | GO:1900108 | negative regulation of nodal signaling pathway(GO:1900108) |
| 0.4 | 2.1 | GO:0042360 | vitamin E metabolic process(GO:0042360) |
| 0.4 | 2.1 | GO:0070213 | protein auto-ADP-ribosylation(GO:0070213) |
| 0.4 | 15.2 | GO:0031581 | hemidesmosome assembly(GO:0031581) |
| 0.4 | 1.3 | GO:0043012 | regulation of fusion of sperm to egg plasma membrane(GO:0043012) |
| 0.4 | 2.1 | GO:0019464 | glycine catabolic process(GO:0006546) glycine decarboxylation via glycine cleavage system(GO:0019464) |
| 0.4 | 2.9 | GO:0016098 | monoterpenoid metabolic process(GO:0016098) |
| 0.4 | 0.4 | GO:0014718 | positive regulation of satellite cell activation involved in skeletal muscle regeneration(GO:0014718) |
| 0.4 | 1.2 | GO:1902630 | regulation of membrane hyperpolarization(GO:1902630) |
| 0.4 | 0.4 | GO:0044034 | negative stranded viral RNA replication(GO:0039689) multi-organism biosynthetic process(GO:0044034) |
| 0.4 | 1.2 | GO:0048250 | mitochondrial iron ion transport(GO:0048250) |
| 0.4 | 0.8 | GO:1990167 | protein K27-linked deubiquitination(GO:1990167) |
| 0.4 | 2.8 | GO:1902164 | regulation of DNA damage response, signal transduction by p53 class mediator resulting in transcription of p21 class mediator(GO:1902162) positive regulation of DNA damage response, signal transduction by p53 class mediator resulting in transcription of p21 class mediator(GO:1902164) |
| 0.4 | 1.2 | GO:0015993 | molecular hydrogen transport(GO:0015993) |
| 0.4 | 4.8 | GO:0090324 | negative regulation of oxidative phosphorylation(GO:0090324) |
| 0.4 | 2.4 | GO:0042335 | cuticle development(GO:0042335) |
| 0.4 | 1.2 | GO:2000824 | negative regulation of androgen receptor activity(GO:2000824) |
| 0.4 | 1.9 | GO:0043553 | negative regulation of phosphatidylinositol 3-kinase activity(GO:0043553) |
| 0.4 | 2.7 | GO:0008291 | acetylcholine metabolic process(GO:0008291) acetate ester metabolic process(GO:1900619) |
| 0.4 | 1.1 | GO:1901207 | regulation of heart looping(GO:1901207) |
| 0.4 | 1.9 | GO:1904158 | axonemal central apparatus assembly(GO:1904158) |
| 0.4 | 1.1 | GO:1904640 | response to methionine(GO:1904640) |
| 0.4 | 1.1 | GO:2000157 | regulation of protein K48-linked deubiquitination(GO:1903093) negative regulation of protein K48-linked deubiquitination(GO:1903094) negative regulation of ubiquitin-specific protease activity(GO:2000157) |
| 0.4 | 1.1 | GO:0002731 | negative regulation of dendritic cell cytokine production(GO:0002731) |
| 0.4 | 1.4 | GO:0018352 | protein-pyridoxal-5-phosphate linkage(GO:0018352) |
| 0.4 | 1.1 | GO:0042938 | dipeptide transport(GO:0042938) |
| 0.3 | 0.7 | GO:2000465 | regulation of glycogen (starch) synthase activity(GO:2000465) |
| 0.3 | 3.4 | GO:0042905 | 9-cis-retinoic acid biosynthetic process(GO:0042904) 9-cis-retinoic acid metabolic process(GO:0042905) |
| 0.3 | 3.1 | GO:0048050 | post-embryonic eye morphogenesis(GO:0048050) |
| 0.3 | 5.8 | GO:0001660 | fever generation(GO:0001660) |
| 0.3 | 3.0 | GO:0033629 | negative regulation of cell adhesion mediated by integrin(GO:0033629) |
| 0.3 | 0.3 | GO:0060584 | regulation of prostaglandin-endoperoxide synthase activity(GO:0060584) positive regulation of prostaglandin-endoperoxide synthase activity(GO:0060585) |
| 0.3 | 2.0 | GO:0015015 | heparan sulfate proteoglycan biosynthetic process, enzymatic modification(GO:0015015) |
| 0.3 | 2.0 | GO:0001575 | globoside metabolic process(GO:0001575) |
| 0.3 | 1.7 | GO:0007525 | somatic muscle development(GO:0007525) |
| 0.3 | 6.0 | GO:0061302 | smooth muscle cell-matrix adhesion(GO:0061302) |
| 0.3 | 1.0 | GO:0002940 | tRNA N2-guanine methylation(GO:0002940) |
| 0.3 | 4.3 | GO:2000210 | positive regulation of anoikis(GO:2000210) |
| 0.3 | 1.0 | GO:0061727 | methylglyoxal catabolic process to D-lactate via S-lactoyl-glutathione(GO:0019243) methylglyoxal catabolic process(GO:0051596) methylglyoxal catabolic process to lactate(GO:0061727) |
| 0.3 | 1.6 | GO:0002586 | regulation of antigen processing and presentation of peptide antigen via MHC class II(GO:0002586) |
| 0.3 | 1.0 | GO:1901076 | positive regulation of engulfment of apoptotic cell(GO:1901076) |
| 0.3 | 1.6 | GO:0032571 | response to vitamin K(GO:0032571) |
| 0.3 | 1.3 | GO:0035419 | activation of MAPK activity involved in innate immune response(GO:0035419) |
| 0.3 | 2.5 | GO:0036018 | cellular response to erythropoietin(GO:0036018) |
| 0.3 | 2.2 | GO:2000503 | positive regulation of natural killer cell chemotaxis(GO:2000503) |
| 0.3 | 0.3 | GO:0034198 | cellular response to amino acid starvation(GO:0034198) |
| 0.3 | 1.9 | GO:0043128 | regulation of 1-phosphatidylinositol 4-kinase activity(GO:0043126) positive regulation of 1-phosphatidylinositol 4-kinase activity(GO:0043128) |
| 0.3 | 1.2 | GO:0030241 | skeletal muscle myosin thick filament assembly(GO:0030241) |
| 0.3 | 7.9 | GO:2000404 | regulation of T cell migration(GO:2000404) |
| 0.3 | 0.3 | GO:0060158 | phospholipase C-activating dopamine receptor signaling pathway(GO:0060158) |
| 0.3 | 1.2 | GO:0071542 | dopaminergic neuron differentiation(GO:0071542) |
| 0.3 | 1.2 | GO:2001287 | negative regulation of caveolin-mediated endocytosis(GO:2001287) |
| 0.3 | 2.1 | GO:0006526 | arginine biosynthetic process(GO:0006526) |
| 0.3 | 3.3 | GO:0097167 | circadian regulation of translation(GO:0097167) |
| 0.3 | 0.9 | GO:0071109 | superior temporal gyrus development(GO:0071109) |
| 0.3 | 1.5 | GO:0046813 | receptor-mediated virion attachment to host cell(GO:0046813) |
| 0.3 | 0.6 | GO:0007266 | Rho protein signal transduction(GO:0007266) |
| 0.3 | 1.2 | GO:0060447 | bud outgrowth involved in lung branching(GO:0060447) |
| 0.3 | 0.3 | GO:0009212 | dTTP biosynthetic process(GO:0006235) pyrimidine deoxyribonucleoside triphosphate biosynthetic process(GO:0009212) |
| 0.3 | 1.2 | GO:0035582 | sequestering of BMP in extracellular matrix(GO:0035582) |
| 0.3 | 0.9 | GO:0045819 | positive regulation of glycogen catabolic process(GO:0045819) |
| 0.3 | 6.3 | GO:0097264 | self proteolysis(GO:0097264) |
| 0.3 | 0.9 | GO:0097325 | melanocyte proliferation(GO:0097325) melanocyte apoptotic process(GO:1902362) |
| 0.3 | 0.3 | GO:0032497 | detection of lipopolysaccharide(GO:0032497) |
| 0.3 | 1.9 | GO:1903232 | melanosome assembly(GO:1903232) |
| 0.3 | 0.6 | GO:0034165 | positive regulation of toll-like receptor 9 signaling pathway(GO:0034165) |
| 0.3 | 0.8 | GO:0061713 | neural crest cell migration involved in heart formation(GO:0003147) anterior neural tube closure(GO:0061713) |
| 0.3 | 0.3 | GO:0018879 | biphenyl metabolic process(GO:0018879) |
| 0.3 | 0.8 | GO:1900425 | negative regulation of defense response to bacterium(GO:1900425) |
| 0.3 | 0.3 | GO:1900037 | regulation of cellular response to hypoxia(GO:1900037) |
| 0.3 | 1.1 | GO:0043456 | regulation of pentose-phosphate shunt(GO:0043456) |
| 0.3 | 1.9 | GO:0008218 | bioluminescence(GO:0008218) |
| 0.3 | 0.5 | GO:1901074 | regulation of engulfment of apoptotic cell(GO:1901074) |
| 0.3 | 0.8 | GO:0072086 | specification of loop of Henle identity(GO:0072086) |
| 0.3 | 1.1 | GO:0051131 | chaperone-mediated protein complex assembly(GO:0051131) |
| 0.3 | 1.6 | GO:0051122 | hepoxilin metabolic process(GO:0051121) hepoxilin biosynthetic process(GO:0051122) |
| 0.3 | 1.8 | GO:0071461 | cellular response to redox state(GO:0071461) |
| 0.3 | 1.8 | GO:0003199 | endocardial cushion to mesenchymal transition involved in heart valve formation(GO:0003199) |
| 0.3 | 0.3 | GO:0033198 | response to ATP(GO:0033198) |
| 0.3 | 0.3 | GO:0060648 | mammary gland bud morphogenesis(GO:0060648) |
| 0.3 | 0.5 | GO:0023021 | termination of signal transduction(GO:0023021) |
| 0.3 | 0.5 | GO:0002690 | positive regulation of leukocyte chemotaxis(GO:0002690) |
| 0.3 | 1.3 | GO:1904636 | response to ionomycin(GO:1904636) cellular response to ionomycin(GO:1904637) |
| 0.3 | 0.5 | GO:2000646 | positive regulation of receptor catabolic process(GO:2000646) |
| 0.2 | 2.2 | GO:0018916 | nitrobenzene metabolic process(GO:0018916) |
| 0.2 | 2.2 | GO:0051552 | flavone metabolic process(GO:0051552) |
| 0.2 | 3.0 | GO:0048298 | positive regulation of isotype switching to IgA isotypes(GO:0048298) |
| 0.2 | 0.5 | GO:1901656 | glycoside transport(GO:1901656) |
| 0.2 | 1.5 | GO:1900220 | semaphorin-plexin signaling pathway involved in bone trabecula morphogenesis(GO:1900220) |
| 0.2 | 1.0 | GO:2000969 | positive regulation of alpha-amino-3-hydroxy-5-methyl-4-isoxazole propionate selective glutamate receptor activity(GO:2000969) |
| 0.2 | 0.7 | GO:0046603 | negative regulation of mitotic centrosome separation(GO:0046603) |
| 0.2 | 1.2 | GO:0002536 | respiratory burst involved in inflammatory response(GO:0002536) regulation of respiratory burst involved in inflammatory response(GO:0060264) negative regulation of respiratory burst involved in inflammatory response(GO:0060266) |
| 0.2 | 1.0 | GO:0072244 | metanephric glomerular epithelium development(GO:0072244) metanephric glomerular visceral epithelial cell differentiation(GO:0072248) metanephric glomerular visceral epithelial cell development(GO:0072249) metanephric glomerular epithelial cell differentiation(GO:0072312) metanephric glomerular epithelial cell development(GO:0072313) |
| 0.2 | 1.7 | GO:1902174 | positive regulation of keratinocyte apoptotic process(GO:1902174) |
| 0.2 | 0.7 | GO:0021912 | regulation of transcription from RNA polymerase II promoter involved in spinal cord motor neuron fate specification(GO:0021912) |
| 0.2 | 0.5 | GO:0015872 | dopamine transport(GO:0015872) |
| 0.2 | 1.9 | GO:0002826 | negative regulation of T-helper 1 type immune response(GO:0002826) |
| 0.2 | 1.0 | GO:0060011 | Sertoli cell proliferation(GO:0060011) |
| 0.2 | 0.7 | GO:0008052 | sensory organ boundary specification(GO:0008052) formation of organ boundary(GO:0010160) taste bud development(GO:0061193) |
| 0.2 | 0.7 | GO:0002728 | negative regulation of natural killer cell cytokine production(GO:0002728) |
| 0.2 | 0.7 | GO:0051029 | rRNA transport(GO:0051029) |
| 0.2 | 0.5 | GO:0031959 | mineralocorticoid receptor signaling pathway(GO:0031959) |
| 0.2 | 6.0 | GO:0006704 | glucocorticoid biosynthetic process(GO:0006704) |
| 0.2 | 0.5 | GO:1901203 | positive regulation of extracellular matrix assembly(GO:1901203) |
| 0.2 | 0.5 | GO:0032479 | regulation of type I interferon production(GO:0032479) |
| 0.2 | 0.7 | GO:0038183 | bile acid signaling pathway(GO:0038183) |
| 0.2 | 0.5 | GO:0006788 | heme oxidation(GO:0006788) |
| 0.2 | 2.1 | GO:0009449 | gamma-aminobutyric acid biosynthetic process(GO:0009449) |
| 0.2 | 2.3 | GO:1902219 | negative regulation of intrinsic apoptotic signaling pathway in response to osmotic stress(GO:1902219) |
| 0.2 | 0.7 | GO:0097187 | dentinogenesis(GO:0097187) |
| 0.2 | 0.7 | GO:0048663 | neuron fate commitment(GO:0048663) |
| 0.2 | 0.9 | GO:0006003 | fructose 2,6-bisphosphate metabolic process(GO:0006003) |
| 0.2 | 1.4 | GO:0061074 | regulation of neural retina development(GO:0061074) |
| 0.2 | 0.7 | GO:0051919 | positive regulation of fibrinolysis(GO:0051919) |
| 0.2 | 0.5 | GO:0044179 | hemolysis by symbiont of host erythrocytes(GO:0019836) hemolysis in other organism(GO:0044179) hemolysis in other organism involved in symbiotic interaction(GO:0052331) |
| 0.2 | 0.7 | GO:0003245 | cardiac muscle tissue growth involved in heart morphogenesis(GO:0003245) histone H3-K9 deacetylation(GO:1990619) |
| 0.2 | 2.7 | GO:0032020 | ISG15-protein conjugation(GO:0032020) |
| 0.2 | 0.2 | GO:0043200 | response to amino acid(GO:0043200) |
| 0.2 | 2.6 | GO:0046598 | positive regulation of viral entry into host cell(GO:0046598) |
| 0.2 | 0.9 | GO:1902723 | negative regulation of skeletal muscle cell proliferation(GO:0014859) negative regulation of skeletal muscle satellite cell proliferation(GO:1902723) |
| 0.2 | 1.5 | GO:0071847 | TNFSF11-mediated signaling pathway(GO:0071847) |
| 0.2 | 0.7 | GO:1902463 | protein localization to cell leading edge(GO:1902463) |
| 0.2 | 0.7 | GO:0006258 | UDP-glucose catabolic process(GO:0006258) |
| 0.2 | 1.5 | GO:0098704 | fructose import(GO:0032445) carbohydrate import into cell(GO:0097319) carbohydrate import across plasma membrane(GO:0098704) fructose import across plasma membrane(GO:1990539) |
| 0.2 | 0.7 | GO:0071672 | negative regulation of smooth muscle cell chemotaxis(GO:0071672) |
| 0.2 | 0.7 | GO:1990523 | bone regeneration(GO:1990523) |
| 0.2 | 1.1 | GO:0030311 | poly-N-acetyllactosamine biosynthetic process(GO:0030311) |
| 0.2 | 5.4 | GO:0061436 | establishment of skin barrier(GO:0061436) |
| 0.2 | 0.2 | GO:0060268 | negative regulation of respiratory burst(GO:0060268) |
| 0.2 | 0.6 | GO:1990709 | maintenance of synapse structure(GO:0099558) presynaptic active zone organization(GO:1990709) |
| 0.2 | 2.3 | GO:0044821 | meiotic telomere tethering at nuclear periphery(GO:0044821) meiotic attachment of telomere to nuclear envelope(GO:0070197) chromosome attachment to the nuclear envelope(GO:0097240) |
| 0.2 | 1.3 | GO:1904274 | tricellular tight junction assembly(GO:1904274) |
| 0.2 | 0.8 | GO:0060133 | somatotropin secreting cell development(GO:0060133) |
| 0.2 | 0.4 | GO:0045667 | regulation of osteoblast differentiation(GO:0045667) |
| 0.2 | 2.5 | GO:0050885 | neuromuscular process controlling balance(GO:0050885) |
| 0.2 | 1.1 | GO:0002415 | immunoglobulin transcytosis in epithelial cells mediated by polymeric immunoglobulin receptor(GO:0002415) |
| 0.2 | 5.3 | GO:0046597 | negative regulation of viral entry into host cell(GO:0046597) |
| 0.2 | 0.6 | GO:0061428 | negative regulation of transcription from RNA polymerase II promoter in response to hypoxia(GO:0061428) |
| 0.2 | 1.0 | GO:0038018 | Wnt receptor catabolic process(GO:0038018) |
| 0.2 | 1.9 | GO:0072719 | cellular response to cisplatin(GO:0072719) |
| 0.2 | 0.6 | GO:0007352 | zygotic specification of dorsal/ventral axis(GO:0007352) |
| 0.2 | 0.4 | GO:0014805 | smooth muscle adaptation(GO:0014805) |
| 0.2 | 1.4 | GO:2000490 | negative regulation of hepatic stellate cell activation(GO:2000490) |
| 0.2 | 0.4 | GO:0060856 | establishment of blood-brain barrier(GO:0060856) |
| 0.2 | 1.6 | GO:1902952 | positive regulation of dendritic spine maintenance(GO:1902952) |
| 0.2 | 3.7 | GO:0006957 | complement activation, alternative pathway(GO:0006957) |
| 0.2 | 0.2 | GO:0033591 | response to L-ascorbic acid(GO:0033591) |
| 0.2 | 0.6 | GO:0009078 | alanine metabolic process(GO:0006522) alanine catabolic process(GO:0006524) pyruvate family amino acid metabolic process(GO:0009078) pyruvate family amino acid catabolic process(GO:0009080) |
| 0.2 | 1.4 | GO:0010940 | positive regulation of necrotic cell death(GO:0010940) |
| 0.2 | 0.4 | GO:0034059 | response to anoxia(GO:0034059) |
| 0.2 | 0.6 | GO:1901873 | regulation of post-translational protein modification(GO:1901873) |
| 0.2 | 0.2 | GO:2000211 | regulation of glutamate metabolic process(GO:2000211) |
| 0.2 | 0.8 | GO:0060940 | epithelial to mesenchymal transition involved in cardiac fibroblast development(GO:0060940) |
| 0.2 | 0.6 | GO:0006624 | vacuolar protein processing(GO:0006624) |
| 0.2 | 0.2 | GO:2000272 | negative regulation of receptor activity(GO:2000272) |
| 0.2 | 1.6 | GO:0033029 | regulation of neutrophil apoptotic process(GO:0033029) |
| 0.2 | 0.6 | GO:0002933 | lipid hydroxylation(GO:0002933) |
| 0.2 | 2.0 | GO:0043435 | response to corticotropin-releasing hormone(GO:0043435) cellular response to corticotropin-releasing hormone stimulus(GO:0071376) |
| 0.2 | 0.6 | GO:1903778 | protein localization to vacuolar membrane(GO:1903778) |
| 0.2 | 0.6 | GO:0000711 | meiotic DNA repair synthesis(GO:0000711) |
| 0.2 | 0.6 | GO:0002416 | IgG immunoglobulin transcytosis in epithelial cells mediated by FcRn immunoglobulin receptor(GO:0002416) |
| 0.2 | 0.8 | GO:0046166 | glyceraldehyde-3-phosphate biosynthetic process(GO:0046166) |
| 0.2 | 2.7 | GO:0006228 | UTP biosynthetic process(GO:0006228) |
| 0.2 | 0.6 | GO:0043315 | positive regulation of neutrophil degranulation(GO:0043315) cellular response to gravity(GO:0071258) positive regulation of neutrophil activation(GO:1902565) regulation of transcytosis(GO:1904298) positive regulation of transcytosis(GO:1904300) regulation of maternal process involved in parturition(GO:1904301) positive regulation of maternal process involved in parturition(GO:1904303) response to 2-O-acetyl-1-O-hexadecyl-sn-glycero-3-phosphocholine(GO:1904316) cellular response to 2-O-acetyl-1-O-hexadecyl-sn-glycero-3-phosphocholine(GO:1904317) |
| 0.2 | 0.6 | GO:0016561 | protein import into peroxisome matrix, translocation(GO:0016561) |
| 0.2 | 1.1 | GO:0006701 | progesterone biosynthetic process(GO:0006701) |
| 0.2 | 0.4 | GO:0090306 | spindle assembly involved in female meiosis(GO:0007056) spindle assembly involved in meiosis(GO:0090306) |
| 0.2 | 1.0 | GO:1900106 | hyaluranon cable assembly(GO:0036118) regulation of hyaluranon cable assembly(GO:1900104) positive regulation of hyaluranon cable assembly(GO:1900106) |
| 0.2 | 0.2 | GO:1904668 | positive regulation of ubiquitin protein ligase activity(GO:1904668) |
| 0.2 | 0.8 | GO:0010757 | negative regulation of plasminogen activation(GO:0010757) |
| 0.2 | 1.7 | GO:0046618 | drug export(GO:0046618) |
| 0.2 | 1.1 | GO:0045229 | cell envelope organization(GO:0043163) external encapsulating structure organization(GO:0045229) |
| 0.2 | 1.1 | GO:0048489 | synaptic vesicle transport(GO:0048489) synaptic vesicle localization(GO:0097479) establishment of synaptic vesicle localization(GO:0097480) |
| 0.2 | 4.5 | GO:0016024 | CDP-diacylglycerol biosynthetic process(GO:0016024) |
| 0.2 | 2.6 | GO:0033034 | positive regulation of myeloid cell apoptotic process(GO:0033034) |
| 0.2 | 0.7 | GO:0070893 | transposon integration(GO:0070893) regulation of transposon integration(GO:0070894) negative regulation of transposon integration(GO:0070895) |
| 0.2 | 1.3 | GO:0090649 | response to oxygen-glucose deprivation(GO:0090649) cellular response to oxygen-glucose deprivation(GO:0090650) |
| 0.2 | 0.7 | GO:0071442 | positive regulation of histone H3-K14 acetylation(GO:0071442) |
| 0.2 | 0.4 | GO:0045687 | positive regulation of glial cell differentiation(GO:0045687) |
| 0.2 | 3.6 | GO:0090026 | positive regulation of monocyte chemotaxis(GO:0090026) |
| 0.2 | 0.9 | GO:0097460 | ferrous iron import into cell(GO:0097460) ferrous iron import across plasma membrane(GO:0098707) |
| 0.2 | 0.4 | GO:0071260 | cellular response to mechanical stimulus(GO:0071260) |
| 0.2 | 1.8 | GO:1902177 | positive regulation of oxidative stress-induced intrinsic apoptotic signaling pathway(GO:1902177) |
| 0.2 | 0.7 | GO:0090214 | spongiotrophoblast layer developmental growth(GO:0090214) |
| 0.2 | 3.6 | GO:0009812 | flavonoid metabolic process(GO:0009812) |
| 0.2 | 0.2 | GO:0014870 | response to inactivity(GO:0014854) response to muscle inactivity(GO:0014870) |
| 0.2 | 0.2 | GO:0071169 | establishment of protein localization to chromatin(GO:0071169) |
| 0.2 | 0.5 | GO:0046495 | nicotinamide riboside catabolic process(GO:0006738) nicotinamide riboside metabolic process(GO:0046495) pyridine nucleoside metabolic process(GO:0070637) pyridine nucleoside catabolic process(GO:0070638) |
| 0.2 | 0.7 | GO:0009298 | GDP-mannose biosynthetic process(GO:0009298) |
| 0.2 | 0.3 | GO:0060903 | positive regulation of meiosis I(GO:0060903) |
| 0.2 | 0.2 | GO:0020027 | hemoglobin metabolic process(GO:0020027) |
| 0.2 | 0.3 | GO:0035606 | peptidyl-cysteine S-trans-nitrosylation(GO:0035606) |
| 0.2 | 0.5 | GO:0006434 | seryl-tRNA aminoacylation(GO:0006434) |
| 0.2 | 3.1 | GO:0031639 | plasminogen activation(GO:0031639) |
| 0.2 | 1.0 | GO:0060681 | branch elongation involved in ureteric bud branching(GO:0060681) |
| 0.2 | 0.2 | GO:0006620 | posttranslational protein targeting to membrane(GO:0006620) |
| 0.2 | 0.9 | GO:0008050 | female courtship behavior(GO:0008050) |
| 0.2 | 1.0 | GO:0042531 | positive regulation of tyrosine phosphorylation of STAT protein(GO:0042531) |
| 0.2 | 0.8 | GO:0060708 | spongiotrophoblast differentiation(GO:0060708) |
| 0.2 | 0.5 | GO:0048242 | regulation of epinephrine secretion(GO:0014060) negative regulation of epinephrine secretion(GO:0032811) epidermal growth factor-activated receptor transactivation by G-protein coupled receptor signaling pathway(GO:0035625) epinephrine secretion(GO:0048242) |
| 0.2 | 1.5 | GO:0018094 | protein polyglycylation(GO:0018094) |
| 0.2 | 4.5 | GO:0050716 | positive regulation of interleukin-1 secretion(GO:0050716) |
| 0.2 | 1.3 | GO:0038060 | nitric oxide-cGMP-mediated signaling pathway(GO:0038060) |
| 0.2 | 0.2 | GO:0071879 | positive regulation of adrenergic receptor signaling pathway(GO:0071879) |
| 0.2 | 1.5 | GO:0009227 | UDP-N-acetylglucosamine catabolic process(GO:0006049) nucleotide-sugar catabolic process(GO:0009227) |
| 0.2 | 0.3 | GO:0036506 | maintenance of unfolded protein(GO:0036506) maintenance of unfolded protein involved in ERAD pathway(GO:1904378) |
| 0.2 | 0.2 | GO:0002583 | regulation of antigen processing and presentation of peptide antigen(GO:0002583) |
| 0.2 | 0.3 | GO:0048241 | epinephrine transport(GO:0048241) |
| 0.2 | 0.7 | GO:0009956 | radial pattern formation(GO:0009956) |
| 0.2 | 0.3 | GO:0035905 | ascending aorta development(GO:0035905) ascending aorta morphogenesis(GO:0035910) |
| 0.2 | 0.5 | GO:0035469 | determination of pancreatic left/right asymmetry(GO:0035469) |
| 0.2 | 1.3 | GO:1990834 | response to odorant(GO:1990834) |
| 0.2 | 2.1 | GO:1901409 | positive regulation of phosphorylation of RNA polymerase II C-terminal domain(GO:1901409) |
| 0.2 | 1.8 | GO:0098795 | mRNA cleavage involved in gene silencing by miRNA(GO:0035279) mRNA cleavage involved in gene silencing(GO:0098795) |
| 0.2 | 2.9 | GO:0036159 | inner dynein arm assembly(GO:0036159) |
| 0.2 | 0.5 | GO:0016256 | N-glycan processing to lysosome(GO:0016256) |
| 0.2 | 0.2 | GO:0051402 | neuron apoptotic process(GO:0051402) |
| 0.2 | 0.5 | GO:0061485 | memory T cell proliferation(GO:0061485) |
| 0.2 | 0.3 | GO:0033861 | negative regulation of NAD(P)H oxidase activity(GO:0033861) |
| 0.2 | 0.5 | GO:0030327 | prenylated protein catabolic process(GO:0030327) |
| 0.2 | 0.6 | GO:0097067 | cellular response to thyroid hormone stimulus(GO:0097067) |
| 0.2 | 0.8 | GO:0018125 | peptidyl-cysteine methylation(GO:0018125) |
| 0.2 | 0.8 | GO:0006696 | ergosterol biosynthetic process(GO:0006696) ergosterol metabolic process(GO:0008204) |
| 0.2 | 0.5 | GO:0060697 | positive regulation of phospholipid catabolic process(GO:0060697) |
| 0.2 | 0.2 | GO:0040019 | positive regulation of embryonic development(GO:0040019) |
| 0.2 | 0.8 | GO:0061051 | positive regulation of cell growth involved in cardiac muscle cell development(GO:0061051) |
| 0.2 | 0.2 | GO:1900226 | negative regulation of NLRP3 inflammasome complex assembly(GO:1900226) |
| 0.2 | 0.3 | GO:0045590 | negative regulation of regulatory T cell differentiation(GO:0045590) |
| 0.2 | 1.1 | GO:0010133 | proline catabolic process to glutamate(GO:0010133) |
| 0.2 | 0.5 | GO:0002227 | innate immune response in mucosa(GO:0002227) |
| 0.2 | 0.3 | GO:0071864 | regulation of cell proliferation in bone marrow(GO:0071863) positive regulation of cell proliferation in bone marrow(GO:0071864) |
| 0.2 | 1.4 | GO:0060770 | negative regulation of epithelial cell proliferation involved in prostate gland development(GO:0060770) |
| 0.2 | 1.7 | GO:0042670 | retinal cone cell differentiation(GO:0042670) retinal cone cell development(GO:0046549) |
| 0.2 | 0.6 | GO:1901994 | negative regulation of meiotic cell cycle phase transition(GO:1901994) |
| 0.2 | 4.7 | GO:0001580 | detection of chemical stimulus involved in sensory perception of bitter taste(GO:0001580) |
| 0.1 | 1.0 | GO:1901164 | negative regulation of trophoblast cell migration(GO:1901164) |
| 0.1 | 0.6 | GO:0021849 | neuroblast division in subventricular zone(GO:0021849) |
| 0.1 | 0.6 | GO:0019859 | pyrimidine nucleobase catabolic process(GO:0006208) thymine catabolic process(GO:0006210) thymine metabolic process(GO:0019859) |
| 0.1 | 0.9 | GO:0035437 | protein retention in ER lumen(GO:0006621) maintenance of protein localization in endoplasmic reticulum(GO:0035437) |
| 0.1 | 0.6 | GO:0060023 | soft palate development(GO:0060023) |
| 0.1 | 3.2 | GO:0071850 | mitotic cell cycle arrest(GO:0071850) |
| 0.1 | 1.0 | GO:0006102 | isocitrate metabolic process(GO:0006102) |
| 0.1 | 2.3 | GO:0043587 | tongue morphogenesis(GO:0043587) |
| 0.1 | 0.6 | GO:0090119 | vesicle-mediated cholesterol transport(GO:0090119) |
| 0.1 | 1.0 | GO:2000609 | regulation of thyroid hormone generation(GO:2000609) |
| 0.1 | 5.5 | GO:0019731 | antibacterial humoral response(GO:0019731) |
| 0.1 | 2.0 | GO:0032074 | negative regulation of nuclease activity(GO:0032074) |
| 0.1 | 0.7 | GO:0070417 | cellular response to cold(GO:0070417) |
| 0.1 | 0.3 | GO:0032764 | negative regulation of mast cell cytokine production(GO:0032764) negative regulation of mitotic cell cycle DNA replication(GO:1903464) |
| 0.1 | 0.1 | GO:0016188 | synaptic vesicle maturation(GO:0016188) |
| 0.1 | 0.6 | GO:0010533 | regulation of activation of Janus kinase activity(GO:0010533) |
| 0.1 | 0.1 | GO:0045792 | negative regulation of cell size(GO:0045792) |
| 0.1 | 1.7 | GO:0036066 | protein O-linked fucosylation(GO:0036066) |
| 0.1 | 0.4 | GO:0002793 | positive regulation of peptide secretion(GO:0002793) |
| 0.1 | 2.7 | GO:0001542 | ovulation from ovarian follicle(GO:0001542) |
| 0.1 | 1.6 | GO:0032927 | positive regulation of activin receptor signaling pathway(GO:0032927) |
| 0.1 | 0.1 | GO:1902218 | regulation of intrinsic apoptotic signaling pathway in response to osmotic stress(GO:1902218) |
| 0.1 | 0.3 | GO:0046985 | positive regulation of hemoglobin biosynthetic process(GO:0046985) |
| 0.1 | 0.4 | GO:0051037 | regulation of transcription involved in meiotic cell cycle(GO:0051037) |
| 0.1 | 3.3 | GO:0071243 | cellular response to arsenic-containing substance(GO:0071243) |
| 0.1 | 0.1 | GO:0044266 | multicellular organismal protein catabolic process(GO:0044254) protein digestion(GO:0044256) multicellular organismal macromolecule catabolic process(GO:0044266) |
| 0.1 | 0.1 | GO:0061153 | trachea submucosa development(GO:0061152) trachea gland development(GO:0061153) |
| 0.1 | 0.6 | GO:1903121 | regulation of TRAIL-activated apoptotic signaling pathway(GO:1903121) positive regulation of TRAIL-activated apoptotic signaling pathway(GO:1903984) |
| 0.1 | 0.7 | GO:0000720 | pyrimidine dimer repair by nucleotide-excision repair(GO:0000720) |
| 0.1 | 0.6 | GO:2000435 | regulation of protein neddylation(GO:2000434) negative regulation of protein neddylation(GO:2000435) |
| 0.1 | 0.3 | GO:0071623 | negative regulation of granulocyte chemotaxis(GO:0071623) negative regulation of neutrophil chemotaxis(GO:0090024) negative regulation of neutrophil migration(GO:1902623) |
| 0.1 | 0.1 | GO:0046782 | regulation of viral transcription(GO:0046782) |
| 0.1 | 1.1 | GO:0043585 | nose morphogenesis(GO:0043585) |
| 0.1 | 0.4 | GO:0000454 | snoRNA guided rRNA pseudouridine synthesis(GO:0000454) |
| 0.1 | 1.0 | GO:1904925 | positive regulation of macromitophagy(GO:1901526) positive regulation of mitophagy in response to mitochondrial depolarization(GO:1904925) |
| 0.1 | 1.2 | GO:2000553 | positive regulation of T-helper 2 cell cytokine production(GO:2000553) |
| 0.1 | 2.7 | GO:0006751 | glutathione catabolic process(GO:0006751) |
| 0.1 | 0.4 | GO:0007023 | post-chaperonin tubulin folding pathway(GO:0007023) |
| 0.1 | 0.5 | GO:0061209 | cell proliferation involved in mesonephros development(GO:0061209) mesenchymal cell proliferation involved in ureteric bud development(GO:0072138) |
| 0.1 | 0.7 | GO:0051970 | negative regulation of transmission of nerve impulse(GO:0051970) |
| 0.1 | 1.4 | GO:0045054 | constitutive secretory pathway(GO:0045054) |
| 0.1 | 0.3 | GO:1904886 | beta-catenin destruction complex disassembly(GO:1904886) |
| 0.1 | 0.7 | GO:0060332 | positive regulation of response to interferon-gamma(GO:0060332) positive regulation of interferon-gamma-mediated signaling pathway(GO:0060335) |
| 0.1 | 0.1 | GO:0014901 | regulation of satellite cell activation involved in skeletal muscle regeneration(GO:0014717) satellite cell activation involved in skeletal muscle regeneration(GO:0014901) |
| 0.1 | 1.1 | GO:0060754 | positive regulation of mast cell chemotaxis(GO:0060754) |
| 0.1 | 0.1 | GO:0002314 | germinal center B cell differentiation(GO:0002314) |
| 0.1 | 0.5 | GO:0007290 | spermatid nucleus elongation(GO:0007290) |
| 0.1 | 1.6 | GO:0043407 | negative regulation of MAP kinase activity(GO:0043407) |
| 0.1 | 0.4 | GO:0002378 | immunoglobulin biosynthetic process(GO:0002378) |
| 0.1 | 0.8 | GO:0030421 | defecation(GO:0030421) |
| 0.1 | 0.4 | GO:0010591 | regulation of lamellipodium assembly(GO:0010591) |
| 0.1 | 1.2 | GO:0051897 | positive regulation of protein kinase B signaling(GO:0051897) |
| 0.1 | 2.4 | GO:0009650 | UV protection(GO:0009650) |
| 0.1 | 0.7 | GO:0061107 | seminal vesicle development(GO:0061107) |
| 0.1 | 0.5 | GO:0043129 | surfactant homeostasis(GO:0043129) |
| 0.1 | 0.4 | GO:0051026 | chiasma assembly(GO:0051026) |
| 0.1 | 1.7 | GO:2000680 | rubidium ion transport(GO:0035826) regulation of rubidium ion transport(GO:2000680) |
| 0.1 | 1.8 | GO:0032732 | positive regulation of interleukin-1 production(GO:0032732) |
| 0.1 | 0.3 | GO:0071655 | granulocyte colony-stimulating factor production(GO:0071611) regulation of granulocyte colony-stimulating factor production(GO:0071655) positive regulation of granulocyte colony-stimulating factor production(GO:0071657) positive regulation of macrophage colony-stimulating factor production(GO:1901258) |
| 0.1 | 0.5 | GO:1990637 | response to prolactin(GO:1990637) |
| 0.1 | 0.4 | GO:0001886 | endothelial cell morphogenesis(GO:0001886) |
| 0.1 | 0.4 | GO:1904798 | positive regulation of core promoter binding(GO:1904798) |
| 0.1 | 0.7 | GO:0007171 | activation of transmembrane receptor protein tyrosine kinase activity(GO:0007171) |
| 0.1 | 0.4 | GO:0014846 | esophagus smooth muscle contraction(GO:0014846) |
| 0.1 | 0.8 | GO:0006651 | diacylglycerol biosynthetic process(GO:0006651) |
| 0.1 | 0.9 | GO:2000035 | regulation of stem cell division(GO:2000035) |
| 0.1 | 0.6 | GO:0009404 | toxin metabolic process(GO:0009404) |
| 0.1 | 0.4 | GO:0048210 | Golgi vesicle fusion to target membrane(GO:0048210) |
| 0.1 | 0.9 | GO:0035272 | exocrine system development(GO:0035272) |
| 0.1 | 0.8 | GO:0018032 | protein amidation(GO:0018032) |
| 0.1 | 0.3 | GO:0038179 | neurotrophin signaling pathway(GO:0038179) |
| 0.1 | 0.6 | GO:0050755 | chemokine metabolic process(GO:0050755) |
| 0.1 | 0.1 | GO:0018277 | protein deamination(GO:0018277) |
| 0.1 | 0.4 | GO:1903215 | negative regulation of protein targeting to mitochondrion(GO:1903215) |
| 0.1 | 1.1 | GO:1902035 | positive regulation of hematopoietic stem cell proliferation(GO:1902035) |
| 0.1 | 0.5 | GO:1905224 | clathrin-coated pit assembly(GO:1905224) |
| 0.1 | 0.8 | GO:0019229 | regulation of vasoconstriction(GO:0019229) |
| 0.1 | 0.5 | GO:0051138 | positive regulation of NK T cell differentiation(GO:0051138) |
| 0.1 | 1.0 | GO:0061370 | testosterone biosynthetic process(GO:0061370) |
| 0.1 | 2.0 | GO:0032119 | sequestering of zinc ion(GO:0032119) |
| 0.1 | 0.5 | GO:0050918 | positive chemotaxis(GO:0050918) |
| 0.1 | 0.2 | GO:0072034 | renal vesicle induction(GO:0072034) |
| 0.1 | 1.9 | GO:0030223 | neutrophil differentiation(GO:0030223) |
| 0.1 | 0.2 | GO:0098743 | cell aggregation(GO:0098743) |
| 0.1 | 0.1 | GO:0006705 | mineralocorticoid biosynthetic process(GO:0006705) mineralocorticoid metabolic process(GO:0008212) |
| 0.1 | 1.0 | GO:2001206 | positive regulation of osteoclast development(GO:2001206) |
| 0.1 | 0.9 | GO:0071725 | toll-like receptor TLR1:TLR2 signaling pathway(GO:0038123) response to triacyl bacterial lipopeptide(GO:0071725) cellular response to triacyl bacterial lipopeptide(GO:0071727) |
| 0.1 | 4.5 | GO:0051281 | positive regulation of release of sequestered calcium ion into cytosol(GO:0051281) |
| 0.1 | 1.7 | GO:0045721 | negative regulation of gluconeogenesis(GO:0045721) |
| 0.1 | 0.4 | GO:0080121 | coenzyme A transport(GO:0015880) coenzyme A transmembrane transport(GO:0035349) adenosine 3',5'-bisphosphate transmembrane transport(GO:0071106) AMP transport(GO:0080121) |
| 0.1 | 0.4 | GO:0070175 | positive regulation of enamel mineralization(GO:0070175) |
| 0.1 | 0.1 | GO:0051660 | establishment of centrosome localization(GO:0051660) |
| 0.1 | 0.4 | GO:0006982 | response to lipid hydroperoxide(GO:0006982) |
| 0.1 | 0.2 | GO:0003352 | regulation of cilium movement(GO:0003352) |
| 0.1 | 0.5 | GO:0022614 | membrane to membrane docking(GO:0022614) |
| 0.1 | 0.5 | GO:0070427 | nucleotide-binding oligomerization domain containing 1 signaling pathway(GO:0070427) |
| 0.1 | 3.7 | GO:0043567 | regulation of insulin-like growth factor receptor signaling pathway(GO:0043567) |
| 0.1 | 0.4 | GO:0030186 | melatonin metabolic process(GO:0030186) melatonin biosynthetic process(GO:0030187) |
| 0.1 | 0.8 | GO:0021759 | globus pallidus development(GO:0021759) |
| 0.1 | 0.5 | GO:0090238 | positive regulation of arachidonic acid secretion(GO:0090238) |
| 0.1 | 1.7 | GO:0007258 | JUN phosphorylation(GO:0007258) |
| 0.1 | 0.7 | GO:0031642 | negative regulation of myelination(GO:0031642) |
| 0.1 | 1.2 | GO:0036072 | intramembranous ossification(GO:0001957) direct ossification(GO:0036072) |
| 0.1 | 2.6 | GO:0046697 | decidualization(GO:0046697) |
| 0.1 | 0.2 | GO:0030225 | macrophage differentiation(GO:0030225) |
| 0.1 | 0.1 | GO:0046113 | nucleobase catabolic process(GO:0046113) |
| 0.1 | 0.3 | GO:0032918 | polyamine acetylation(GO:0032917) spermidine acetylation(GO:0032918) |
| 0.1 | 0.5 | GO:1902361 | mitochondrial pyruvate transport(GO:0006850) mitochondrial pyruvate transmembrane transport(GO:1902361) |
| 0.1 | 1.3 | GO:0070327 | thyroid hormone transport(GO:0070327) |
| 0.1 | 0.7 | GO:0019747 | regulation of isoprenoid metabolic process(GO:0019747) |
| 0.1 | 1.9 | GO:0071624 | positive regulation of granulocyte chemotaxis(GO:0071624) positive regulation of neutrophil chemotaxis(GO:0090023) |
| 0.1 | 4.0 | GO:0060512 | prostate gland morphogenesis(GO:0060512) |
| 0.1 | 0.1 | GO:0032707 | negative regulation of interleukin-23 production(GO:0032707) |
| 0.1 | 2.0 | GO:0006995 | cellular response to nitrogen starvation(GO:0006995) cellular response to nitrogen levels(GO:0043562) |
| 0.1 | 0.1 | GO:0016071 | mRNA metabolic process(GO:0016071) |
| 0.1 | 3.2 | GO:0042403 | thyroid hormone metabolic process(GO:0042403) |
| 0.1 | 0.2 | GO:0060120 | auditory receptor cell fate commitment(GO:0009912) inner ear receptor cell fate commitment(GO:0060120) |
| 0.1 | 0.7 | GO:0060480 | lung goblet cell differentiation(GO:0060480) |
| 0.1 | 0.4 | GO:0090526 | regulation of gluconeogenesis involved in cellular glucose homeostasis(GO:0090526) |
| 0.1 | 1.1 | GO:2000304 | positive regulation of sphingolipid biosynthetic process(GO:0090154) positive regulation of ceramide biosynthetic process(GO:2000304) |
| 0.1 | 0.3 | GO:1904579 | response to thapsigargin(GO:1904578) cellular response to thapsigargin(GO:1904579) response to hypobaric hypoxia(GO:1990910) |
| 0.1 | 0.4 | GO:0010513 | positive regulation of phosphatidylinositol biosynthetic process(GO:0010513) |
| 0.1 | 0.3 | GO:2000395 | regulation of ubiquitin-dependent endocytosis(GO:2000395) positive regulation of ubiquitin-dependent endocytosis(GO:2000397) |
| 0.1 | 0.4 | GO:0050916 | sensory perception of sweet taste(GO:0050916) |
| 0.1 | 2.4 | GO:0035458 | cellular response to interferon-beta(GO:0035458) |
| 0.1 | 1.2 | GO:0071374 | cellular response to parathyroid hormone stimulus(GO:0071374) |
| 0.1 | 0.3 | GO:1904397 | negative regulation of neuromuscular junction development(GO:1904397) |
| 0.1 | 0.3 | GO:1902908 | regulation of melanosome transport(GO:1902908) |
| 0.1 | 0.3 | GO:0071921 | establishment of sister chromatid cohesion(GO:0034085) cohesin loading(GO:0071921) regulation of cohesin loading(GO:0071922) |
| 0.1 | 1.1 | GO:0061179 | negative regulation of insulin secretion involved in cellular response to glucose stimulus(GO:0061179) |
| 0.1 | 0.4 | GO:1902683 | regulation of receptor localization to synapse(GO:1902683) |
| 0.1 | 0.2 | GO:0010716 | negative regulation of extracellular matrix disassembly(GO:0010716) |
| 0.1 | 0.4 | GO:0019626 | short-chain fatty acid catabolic process(GO:0019626) |
| 0.1 | 0.7 | GO:0045008 | depyrimidination(GO:0045008) |
| 0.1 | 1.4 | GO:1901387 | positive regulation of voltage-gated calcium channel activity(GO:1901387) |
| 0.1 | 0.8 | GO:0035879 | plasma membrane lactate transport(GO:0035879) |
| 0.1 | 1.6 | GO:0036158 | outer dynein arm assembly(GO:0036158) |
| 0.1 | 0.4 | GO:0098968 | neurotransmitter receptor transport postsynaptic membrane to endosome(GO:0098968) |
| 0.1 | 0.2 | GO:0060024 | rhythmic synaptic transmission(GO:0060024) |
| 0.1 | 0.3 | GO:0032581 | ER-dependent peroxisome organization(GO:0032581) |
| 0.1 | 0.1 | GO:0021979 | hypothalamus cell differentiation(GO:0021979) |
| 0.1 | 0.1 | GO:0018307 | enzyme active site formation(GO:0018307) |
| 0.1 | 0.9 | GO:0046087 | cytidine catabolic process(GO:0006216) cytidine deamination(GO:0009972) cytidine metabolic process(GO:0046087) |
| 0.1 | 0.3 | GO:0040040 | thermosensory behavior(GO:0040040) |
| 0.1 | 0.5 | GO:0060005 | vestibular reflex(GO:0060005) |
| 0.1 | 3.1 | GO:0033169 | histone H3-K9 demethylation(GO:0033169) |
| 0.1 | 1.2 | GO:1902414 | protein localization to cell junction(GO:1902414) |
| 0.1 | 0.4 | GO:1903722 | regulation of centriole elongation(GO:1903722) |
| 0.1 | 0.3 | GO:0019896 | axonal transport of mitochondrion(GO:0019896) |
| 0.1 | 0.5 | GO:0007185 | transmembrane receptor protein tyrosine phosphatase signaling pathway(GO:0007185) |
| 0.1 | 0.1 | GO:2000696 | regulation of epithelial cell differentiation involved in kidney development(GO:2000696) |
| 0.1 | 1.7 | GO:0070933 | histone H4 deacetylation(GO:0070933) |
| 0.1 | 1.0 | GO:0045669 | positive regulation of osteoblast differentiation(GO:0045669) |
| 0.1 | 0.2 | GO:1903625 | negative regulation of DNA catabolic process(GO:1903625) |
| 0.1 | 0.7 | GO:0010818 | T cell chemotaxis(GO:0010818) |
| 0.1 | 0.5 | GO:0006051 | mannosamine metabolic process(GO:0006050) N-acetylmannosamine metabolic process(GO:0006051) |
| 0.1 | 0.3 | GO:0046463 | triglyceride biosynthetic process(GO:0019432) neutral lipid biosynthetic process(GO:0046460) acylglycerol biosynthetic process(GO:0046463) |
| 0.1 | 1.0 | GO:0071569 | protein ufmylation(GO:0071569) |
| 0.1 | 0.5 | GO:1900222 | negative regulation of beta-amyloid clearance(GO:1900222) |
| 0.1 | 0.8 | GO:0031914 | negative regulation of synaptic plasticity(GO:0031914) |
| 0.1 | 0.7 | GO:0038195 | urokinase plasminogen activator signaling pathway(GO:0038195) |
| 0.1 | 0.4 | GO:0071462 | cellular response to water deprivation(GO:0042631) cellular response to water stimulus(GO:0071462) |
| 0.1 | 0.5 | GO:0052250 | modulation of signal transduction in other organism(GO:0044501) modulation by symbiont of host signal transduction pathway(GO:0052027) modulation of signal transduction in other organism involved in symbiotic interaction(GO:0052250) modulation by symbiont of host I-kappaB kinase/NF-kappaB cascade(GO:0085032) |
| 0.1 | 0.5 | GO:0098502 | DNA dephosphorylation(GO:0098502) |
| 0.1 | 0.4 | GO:0060423 | foregut regionalization(GO:0060423) lung field specification(GO:0060424) lung induction(GO:0060492) regulation of branching involved in lung morphogenesis(GO:0061046) positive regulation of branching involved in lung morphogenesis(GO:0061047) |
| 0.1 | 1.1 | GO:0048672 | positive regulation of collateral sprouting(GO:0048672) |
| 0.1 | 0.1 | GO:0060061 | Spemann organizer formation(GO:0060061) |
| 0.1 | 0.4 | GO:0051490 | negative regulation of filopodium assembly(GO:0051490) |
| 0.1 | 2.9 | GO:0007130 | synaptonemal complex assembly(GO:0007130) |
| 0.1 | 0.2 | GO:0030259 | lipid glycosylation(GO:0030259) |
| 0.1 | 0.3 | GO:1900075 | regulation of neuromuscular synaptic transmission(GO:1900073) positive regulation of neuromuscular synaptic transmission(GO:1900075) |
| 0.1 | 0.3 | GO:0071901 | negative regulation of protein serine/threonine kinase activity(GO:0071901) |
| 0.1 | 0.7 | GO:0060125 | negative regulation of growth hormone secretion(GO:0060125) |
| 0.1 | 0.4 | GO:0044336 | canonical Wnt signaling pathway involved in negative regulation of apoptotic process(GO:0044336) |
| 0.1 | 0.4 | GO:0009236 | cobalamin biosynthetic process(GO:0009236) |
| 0.1 | 0.5 | GO:0036152 | phosphatidylethanolamine acyl-chain remodeling(GO:0036152) |
| 0.1 | 0.7 | GO:0010793 | regulation of mRNA export from nucleus(GO:0010793) |
| 0.1 | 6.9 | GO:0006120 | mitochondrial electron transport, NADH to ubiquinone(GO:0006120) |
| 0.1 | 0.3 | GO:0048631 | regulation of skeletal muscle tissue growth(GO:0048631) |
| 0.1 | 0.7 | GO:0006685 | sphingomyelin catabolic process(GO:0006685) |
| 0.1 | 0.5 | GO:0042350 | GDP-L-fucose biosynthetic process(GO:0042350) |
| 0.1 | 0.8 | GO:0060315 | negative regulation of release of sequestered calcium ion into cytosol(GO:0051280) negative regulation of ryanodine-sensitive calcium-release channel activity(GO:0060315) |
| 0.1 | 2.0 | GO:0007597 | blood coagulation, intrinsic pathway(GO:0007597) |
| 0.1 | 0.3 | GO:0071280 | cellular response to copper ion(GO:0071280) |
| 0.1 | 0.3 | GO:0098884 | postsynaptic neurotransmitter receptor internalization(GO:0098884) |
| 0.1 | 0.5 | GO:0043335 | protein unfolding(GO:0043335) |
| 0.1 | 0.8 | GO:0021957 | corticospinal tract morphogenesis(GO:0021957) |
| 0.1 | 0.7 | GO:0045198 | establishment of epithelial cell apical/basal polarity(GO:0045198) |
| 0.1 | 6.3 | GO:0018149 | peptide cross-linking(GO:0018149) |
| 0.1 | 0.2 | GO:0035988 | chondrocyte proliferation(GO:0035988) |
| 0.1 | 0.3 | GO:2000348 | regulation of CD40 signaling pathway(GO:2000348) |
| 0.1 | 0.3 | GO:0070105 | positive regulation of interleukin-6-mediated signaling pathway(GO:0070105) |
| 0.1 | 0.1 | GO:0034154 | toll-like receptor 7 signaling pathway(GO:0034154) |
| 0.1 | 1.0 | GO:0007288 | sperm axoneme assembly(GO:0007288) |
| 0.1 | 0.7 | GO:0015727 | lactate transport(GO:0015727) lactate transmembrane transport(GO:0035873) |
| 0.1 | 0.9 | GO:1903265 | positive regulation of tumor necrosis factor-mediated signaling pathway(GO:1903265) |
| 0.1 | 0.4 | GO:1903236 | regulation of leukocyte tethering or rolling(GO:1903236) negative regulation of leukocyte tethering or rolling(GO:1903237) negative regulation of leukocyte adhesion to vascular endothelial cell(GO:1904995) |
| 0.1 | 1.8 | GO:0030322 | stabilization of membrane potential(GO:0030322) |
| 0.1 | 0.3 | GO:0072106 | regulation of ureteric bud formation(GO:0072106) positive regulation of ureteric bud formation(GO:0072107) |
| 0.1 | 0.3 | GO:0032618 | interleukin-15 production(GO:0032618) |
| 0.1 | 0.8 | GO:0019236 | response to pheromone(GO:0019236) |
| 0.1 | 0.1 | GO:0015882 | L-ascorbic acid transport(GO:0015882) transepithelial L-ascorbic acid transport(GO:0070904) |
| 0.1 | 0.4 | GO:0097156 | fasciculation of motor neuron axon(GO:0097156) |
| 0.1 | 0.2 | GO:0044240 | multicellular organism lipid catabolic process(GO:0044240) |
| 0.1 | 0.4 | GO:0070350 | white fat cell proliferation(GO:0070343) regulation of white fat cell proliferation(GO:0070350) |
| 0.1 | 5.0 | GO:0060216 | definitive hemopoiesis(GO:0060216) |
| 0.1 | 0.1 | GO:0007588 | excretion(GO:0007588) |
| 0.1 | 1.0 | GO:0051195 | negative regulation of glycolytic process(GO:0045820) negative regulation of cofactor metabolic process(GO:0051195) negative regulation of coenzyme metabolic process(GO:0051198) |
| 0.1 | 0.5 | GO:0071934 | thiamine transmembrane transport(GO:0071934) |
| 0.1 | 0.5 | GO:0045065 | cytotoxic T cell differentiation(GO:0045065) |
| 0.1 | 1.0 | GO:0031087 | deadenylation-independent decapping of nuclear-transcribed mRNA(GO:0031087) |
| 0.1 | 0.8 | GO:0060263 | regulation of respiratory burst(GO:0060263) |
| 0.1 | 0.8 | GO:0060677 | ureteric bud elongation(GO:0060677) |
| 0.1 | 0.7 | GO:0060244 | negative regulation of cell proliferation involved in contact inhibition(GO:0060244) |
| 0.1 | 0.3 | GO:0006579 | amino-acid betaine catabolic process(GO:0006579) |
| 0.1 | 0.3 | GO:0061056 | sclerotome development(GO:0061056) |
| 0.1 | 0.2 | GO:0022417 | protein maturation by protein folding(GO:0022417) |
| 0.1 | 0.7 | GO:0010989 | negative regulation of low-density lipoprotein particle clearance(GO:0010989) |
| 0.1 | 0.4 | GO:0021797 | forebrain anterior/posterior pattern specification(GO:0021797) |
| 0.1 | 0.3 | GO:0006478 | peptidyl-tyrosine sulfation(GO:0006478) |
| 0.1 | 0.6 | GO:0061086 | negative regulation of histone H3-K27 methylation(GO:0061086) |
| 0.1 | 0.2 | GO:0040020 | regulation of meiotic nuclear division(GO:0040020) |
| 0.1 | 2.1 | GO:0043401 | steroid hormone mediated signaling pathway(GO:0043401) |
| 0.1 | 0.9 | GO:0050859 | negative regulation of B cell receptor signaling pathway(GO:0050859) |
| 0.1 | 1.0 | GO:0010968 | regulation of microtubule nucleation(GO:0010968) |
| 0.1 | 1.1 | GO:2000628 | regulation of miRNA metabolic process(GO:2000628) |
| 0.1 | 0.5 | GO:0042357 | thiamine diphosphate metabolic process(GO:0042357) |
| 0.1 | 0.2 | GO:0002501 | peptide antigen assembly with MHC protein complex(GO:0002501) peptide antigen assembly with MHC class II protein complex(GO:0002503) |
| 0.1 | 0.5 | GO:0090076 | relaxation of skeletal muscle(GO:0090076) |
| 0.1 | 0.5 | GO:0001501 | skeletal system development(GO:0001501) |
| 0.1 | 0.3 | GO:0060838 | lymphatic endothelial cell fate commitment(GO:0060838) |
| 0.1 | 0.5 | GO:0034224 | cellular response to zinc ion starvation(GO:0034224) |
| 0.1 | 0.3 | GO:0032827 | negative regulation of natural killer cell differentiation(GO:0032824) negative regulation of natural killer cell differentiation involved in immune response(GO:0032827) |
| 0.1 | 2.5 | GO:0016338 | calcium-independent cell-cell adhesion via plasma membrane cell-adhesion molecules(GO:0016338) |
| 0.1 | 0.4 | GO:0002052 | positive regulation of neuroblast proliferation(GO:0002052) |
| 0.1 | 0.4 | GO:0038172 | interleukin-33-mediated signaling pathway(GO:0038172) |
| 0.1 | 0.7 | GO:0098706 | ferric iron import(GO:0033216) ferric iron import into cell(GO:0097461) ferric iron import across plasma membrane(GO:0098706) |
| 0.1 | 0.7 | GO:0007296 | vitellogenesis(GO:0007296) |
| 0.1 | 0.7 | GO:0006857 | oligopeptide transport(GO:0006857) |
| 0.1 | 0.8 | GO:0002175 | protein localization to paranode region of axon(GO:0002175) |
| 0.1 | 0.3 | GO:0033600 | negative regulation of mammary gland epithelial cell proliferation(GO:0033600) |
| 0.1 | 2.1 | GO:0097320 | membrane tubulation(GO:0097320) |
| 0.1 | 0.3 | GO:0032494 | response to peptidoglycan(GO:0032494) |
| 0.1 | 0.3 | GO:0060019 | radial glial cell differentiation(GO:0060019) |
| 0.1 | 1.1 | GO:0010839 | negative regulation of keratinocyte proliferation(GO:0010839) |
| 0.1 | 0.1 | GO:0045347 | negative regulation of MHC class II biosynthetic process(GO:0045347) |
| 0.1 | 0.2 | GO:0032912 | negative regulation of transforming growth factor beta2 production(GO:0032912) |
| 0.1 | 0.4 | GO:0010982 | regulation of high-density lipoprotein particle clearance(GO:0010982) positive regulation of high-density lipoprotein particle clearance(GO:0010983) |
| 0.1 | 0.6 | GO:0003215 | cardiac right ventricle morphogenesis(GO:0003215) |
| 0.1 | 0.1 | GO:0000717 | nucleotide-excision repair, DNA duplex unwinding(GO:0000717) |
| 0.1 | 2.0 | GO:0006123 | mitochondrial electron transport, cytochrome c to oxygen(GO:0006123) |
| 0.1 | 0.5 | GO:0021860 | pyramidal neuron development(GO:0021860) |
| 0.1 | 0.5 | GO:0006420 | arginyl-tRNA aminoacylation(GO:0006420) |
| 0.1 | 0.3 | GO:0010499 | proteasomal ubiquitin-independent protein catabolic process(GO:0010499) |
| 0.1 | 1.2 | GO:0007614 | short-term memory(GO:0007614) |
| 0.1 | 0.6 | GO:0030263 | apoptotic chromosome condensation(GO:0030263) |
| 0.1 | 2.1 | GO:0050909 | sensory perception of taste(GO:0050909) |
| 0.1 | 0.3 | GO:1902159 | regulation of cyclic nucleotide-gated ion channel activity(GO:1902159) |
| 0.1 | 1.1 | GO:1902902 | negative regulation of autophagosome assembly(GO:1902902) |
| 0.1 | 0.9 | GO:0035095 | behavioral response to nicotine(GO:0035095) |
| 0.1 | 0.3 | GO:1904425 | negative regulation of GTP binding(GO:1904425) |
| 0.1 | 0.4 | GO:1904031 | positive regulation of cyclin-dependent protein kinase activity(GO:1904031) |
| 0.1 | 0.3 | GO:0014826 | vein smooth muscle contraction(GO:0014826) |
| 0.1 | 0.6 | GO:0046604 | positive regulation of mitotic centrosome separation(GO:0046604) |
| 0.1 | 0.3 | GO:0008057 | eye pigment granule organization(GO:0008057) |
| 0.1 | 0.5 | GO:0010650 | positive regulation of cell communication by electrical coupling(GO:0010650) maintenance of protein location in membrane(GO:0072658) maintenance of protein location in plasma membrane(GO:0072660) positive regulation of membrane depolarization during cardiac muscle cell action potential(GO:1900827) |
| 0.1 | 0.3 | GO:1903964 | monounsaturated fatty acid metabolic process(GO:1903964) monounsaturated fatty acid biosynthetic process(GO:1903966) |
| 0.1 | 0.5 | GO:0042737 | drug catabolic process(GO:0042737) |
| 0.1 | 0.3 | GO:1903012 | positive regulation of bone development(GO:1903012) |
| 0.1 | 0.5 | GO:0014807 | regulation of somitogenesis(GO:0014807) |
| 0.1 | 1.6 | GO:0071803 | positive regulation of podosome assembly(GO:0071803) |
| 0.1 | 0.2 | GO:0031529 | ruffle organization(GO:0031529) ruffle assembly(GO:0097178) |
| 0.1 | 0.2 | GO:0070676 | intralumenal vesicle formation(GO:0070676) |
| 0.1 | 0.2 | GO:0001777 | T cell homeostatic proliferation(GO:0001777) |
| 0.1 | 1.2 | GO:0006122 | mitochondrial electron transport, ubiquinol to cytochrome c(GO:0006122) |
| 0.1 | 0.4 | GO:0003404 | optic vesicle morphogenesis(GO:0003404) optic cup structural organization(GO:0003409) oculomotor nerve morphogenesis(GO:0021622) oculomotor nerve formation(GO:0021623) |
| 0.1 | 0.2 | GO:0061343 | cell adhesion involved in heart morphogenesis(GO:0061343) |
| 0.1 | 0.2 | GO:0002143 | tRNA wobble position uridine thiolation(GO:0002143) |
| 0.1 | 3.5 | GO:0015985 | energy coupled proton transport, down electrochemical gradient(GO:0015985) ATP synthesis coupled proton transport(GO:0015986) |
| 0.1 | 0.4 | GO:0051892 | negative regulation of cardioblast differentiation(GO:0051892) regulation of cardiac muscle cell myoblast differentiation(GO:2000690) negative regulation of cardiac muscle cell myoblast differentiation(GO:2000691) |
| 0.1 | 0.2 | GO:0035509 | negative regulation of myosin-light-chain-phosphatase activity(GO:0035509) negative regulation of bicellular tight junction assembly(GO:1903347) |
| 0.1 | 1.5 | GO:0001675 | acrosome assembly(GO:0001675) |
| 0.1 | 0.2 | GO:0044154 | histone H3-K14 acetylation(GO:0044154) |
| 0.1 | 0.2 | GO:0090274 | regulation of somatostatin secretion(GO:0090273) positive regulation of somatostatin secretion(GO:0090274) |
| 0.1 | 0.9 | GO:1902746 | regulation of lens fiber cell differentiation(GO:1902746) |
| 0.1 | 0.8 | GO:0097106 | postsynaptic density organization(GO:0097106) |
| 0.1 | 1.1 | GO:0035456 | response to interferon-beta(GO:0035456) |
| 0.1 | 2.8 | GO:0060644 | mammary gland epithelial cell differentiation(GO:0060644) |
| 0.1 | 0.7 | GO:0042424 | phenol-containing compound catabolic process(GO:0019336) catechol-containing compound catabolic process(GO:0019614) catecholamine catabolic process(GO:0042424) |
| 0.1 | 0.4 | GO:0032218 | riboflavin transport(GO:0032218) |
| 0.1 | 0.7 | GO:0046898 | response to cycloheximide(GO:0046898) |
| 0.1 | 0.2 | GO:0044827 | modulation by host of viral genome replication(GO:0044827) positive regulation by host of viral genome replication(GO:0044829) |
| 0.1 | 0.6 | GO:0035610 | protein side chain deglutamylation(GO:0035610) |
| 0.1 | 0.4 | GO:0014043 | negative regulation of neuron maturation(GO:0014043) |
| 0.1 | 0.9 | GO:0030046 | parallel actin filament bundle assembly(GO:0030046) |
| 0.1 | 0.2 | GO:0045082 | positive regulation of interleukin-10 biosynthetic process(GO:0045082) |
| 0.1 | 0.5 | GO:0033132 | negative regulation of glucokinase activity(GO:0033132) negative regulation of hexokinase activity(GO:1903300) |
| 0.1 | 0.8 | GO:2001238 | positive regulation of extrinsic apoptotic signaling pathway(GO:2001238) |
| 0.1 | 0.2 | GO:0050913 | sensory perception of bitter taste(GO:0050913) |
| 0.1 | 0.1 | GO:0010986 | positive regulation of lipoprotein particle clearance(GO:0010986) |
| 0.1 | 0.2 | GO:0046041 | ITP metabolic process(GO:0046041) |
| 0.1 | 0.8 | GO:0006636 | unsaturated fatty acid biosynthetic process(GO:0006636) |
| 0.1 | 0.2 | GO:0021577 | hindbrain structural organization(GO:0021577) cerebellum structural organization(GO:0021589) |
| 0.1 | 0.7 | GO:0017196 | N-terminal peptidyl-methionine acetylation(GO:0017196) |
| 0.1 | 2.4 | GO:0002076 | osteoblast development(GO:0002076) |
| 0.1 | 0.4 | GO:0051611 | negative regulation of neurotransmitter uptake(GO:0051581) regulation of serotonin uptake(GO:0051611) negative regulation of serotonin uptake(GO:0051612) |
| 0.1 | 0.8 | GO:0090520 | sphingosine-1-phosphate signaling pathway(GO:0003376) sphingolipid mediated signaling pathway(GO:0090520) |
| 0.1 | 0.8 | GO:0048569 | post-embryonic organ development(GO:0048569) |
| 0.1 | 0.8 | GO:0060088 | auditory receptor cell stereocilium organization(GO:0060088) |
| 0.1 | 0.8 | GO:0019367 | fatty acid elongation, saturated fatty acid(GO:0019367) fatty acid elongation, unsaturated fatty acid(GO:0019368) fatty acid elongation, monounsaturated fatty acid(GO:0034625) fatty acid elongation, polyunsaturated fatty acid(GO:0034626) |
| 0.1 | 0.2 | GO:0036518 | chemorepulsion of dopaminergic neuron axon(GO:0036518) |
| 0.1 | 0.3 | GO:1903445 | intermembrane transport(GO:0046909) protein transport from ciliary membrane to plasma membrane(GO:1903445) |
| 0.1 | 0.2 | GO:0042756 | drinking behavior(GO:0042756) |
| 0.1 | 0.8 | GO:0048266 | behavioral response to pain(GO:0048266) |
| 0.1 | 0.2 | GO:0032096 | regulation of response to food(GO:0032095) negative regulation of response to food(GO:0032096) negative regulation of appetite(GO:0032099) |
| 0.1 | 0.8 | GO:0051694 | pointed-end actin filament capping(GO:0051694) |
| 0.1 | 0.1 | GO:0007262 | STAT protein import into nucleus(GO:0007262) |
| 0.1 | 0.7 | GO:0060605 | tube lumen cavitation(GO:0060605) salivary gland cavitation(GO:0060662) |
| 0.1 | 0.6 | GO:0042989 | sequestering of actin monomers(GO:0042989) |
| 0.1 | 0.4 | GO:1904526 | regulation of microtubule binding(GO:1904526) |
| 0.1 | 0.7 | GO:0060563 | neuroepithelial cell differentiation(GO:0060563) |
| 0.1 | 0.1 | GO:0060965 | negative regulation of posttranscriptional gene silencing(GO:0060149) negative regulation of gene silencing by miRNA(GO:0060965) negative regulation of gene silencing by RNA(GO:0060967) |
| 0.1 | 0.1 | GO:0019249 | lactate biosynthetic process(GO:0019249) |
| 0.1 | 2.1 | GO:0010719 | negative regulation of epithelial to mesenchymal transition(GO:0010719) |
| 0.1 | 0.1 | GO:0010966 | regulation of phosphate transport(GO:0010966) |
| 0.1 | 0.1 | GO:0048627 | myoblast development(GO:0048627) |
| 0.1 | 0.4 | GO:0038170 | somatostatin receptor signaling pathway(GO:0038169) somatostatin signaling pathway(GO:0038170) |
| 0.1 | 0.1 | GO:1903795 | regulation of inorganic anion transmembrane transport(GO:1903795) |
| 0.1 | 0.4 | GO:0061098 | positive regulation of protein tyrosine kinase activity(GO:0061098) |
| 0.1 | 0.9 | GO:0009048 | dosage compensation by inactivation of X chromosome(GO:0009048) |
| 0.1 | 0.3 | GO:1903039 | positive regulation of homotypic cell-cell adhesion(GO:0034112) positive regulation of leukocyte cell-cell adhesion(GO:1903039) |
| 0.1 | 0.1 | GO:0010726 | positive regulation of hydrogen peroxide metabolic process(GO:0010726) |
| 0.1 | 0.2 | GO:0019287 | isopentenyl diphosphate biosynthetic process, mevalonate pathway(GO:0019287) |
| 0.1 | 0.9 | GO:0035634 | response to stilbenoid(GO:0035634) |
| 0.1 | 0.8 | GO:0031665 | negative regulation of lipopolysaccharide-mediated signaling pathway(GO:0031665) |
| 0.1 | 0.5 | GO:0071421 | manganese ion transmembrane transport(GO:0071421) |
| 0.1 | 1.4 | GO:0043011 | myeloid dendritic cell differentiation(GO:0043011) |
| 0.1 | 1.1 | GO:0033227 | dsRNA transport(GO:0033227) |
| 0.1 | 0.2 | GO:0030213 | hyaluronan biosynthetic process(GO:0030213) |
| 0.1 | 1.1 | GO:0071157 | negative regulation of cell cycle arrest(GO:0071157) |
| 0.1 | 0.1 | GO:0007389 | pattern specification process(GO:0007389) |
| 0.1 | 0.3 | GO:0010430 | fatty acid omega-oxidation(GO:0010430) |
| 0.1 | 0.6 | GO:1904352 | positive regulation of protein catabolic process in the vacuole(GO:1904352) |
| 0.1 | 0.4 | GO:0021591 | ventricular system development(GO:0021591) |
| 0.1 | 0.1 | GO:0043376 | regulation of CD8-positive, alpha-beta T cell differentiation(GO:0043376) |
| 0.1 | 0.1 | GO:0051646 | mitochondrion localization(GO:0051646) |
| 0.1 | 0.1 | GO:0045402 | interleukin-4 biosynthetic process(GO:0042097) regulation of interleukin-4 biosynthetic process(GO:0045402) positive regulation of interleukin-4 biosynthetic process(GO:0045404) |
| 0.1 | 0.1 | GO:0040018 | positive regulation of multicellular organism growth(GO:0040018) |
| 0.1 | 0.5 | GO:0051697 | protein delipidation(GO:0051697) |
| 0.1 | 0.6 | GO:2000270 | negative regulation of fibroblast apoptotic process(GO:2000270) |
| 0.1 | 15.0 | GO:0007156 | homophilic cell adhesion via plasma membrane adhesion molecules(GO:0007156) |
| 0.1 | 0.2 | GO:0032815 | negative regulation of natural killer cell activation(GO:0032815) |
| 0.1 | 0.3 | GO:0009386 | translational attenuation(GO:0009386) |
| 0.1 | 0.3 | GO:1990502 | dense core granule maturation(GO:1990502) |
| 0.1 | 1.4 | GO:0001649 | osteoblast differentiation(GO:0001649) |
| 0.1 | 0.5 | GO:0035641 | locomotory exploration behavior(GO:0035641) |
| 0.1 | 0.2 | GO:2000909 | regulation of cholesterol import(GO:0060620) regulation of sterol import(GO:2000909) |
| 0.1 | 0.6 | GO:0007207 | phospholipase C-activating G-protein coupled acetylcholine receptor signaling pathway(GO:0007207) |
| 0.1 | 1.6 | GO:0015695 | organic cation transport(GO:0015695) |
| 0.1 | 0.2 | GO:0046952 | ketone body catabolic process(GO:0046952) |
| 0.1 | 0.3 | GO:0043096 | purine nucleobase salvage(GO:0043096) |
| 0.1 | 1.3 | GO:0070571 | negative regulation of axon regeneration(GO:0048681) negative regulation of neuron projection regeneration(GO:0070571) |
| 0.1 | 0.6 | GO:0006119 | oxidative phosphorylation(GO:0006119) |
| 0.1 | 1.4 | GO:0009313 | oligosaccharide catabolic process(GO:0009313) |
| 0.1 | 0.2 | GO:0097194 | execution phase of apoptosis(GO:0097194) |
| 0.1 | 0.3 | GO:1903644 | regulation of chaperone-mediated protein folding(GO:1903644) |
| 0.1 | 0.2 | GO:2000282 | regulation of cellular amine catabolic process(GO:0033241) negative regulation of cellular amine catabolic process(GO:0033242) negative regulation of cellular amino acid metabolic process(GO:0045763) negative regulation of adrenergic receptor signaling pathway(GO:0071878) negative regulation of the force of heart contraction(GO:0098736) regulation of arginine catabolic process(GO:1900081) negative regulation of arginine catabolic process(GO:1900082) regulation of adrenergic receptor signaling pathway involved in heart process(GO:1901204) negative regulation of adrenergic receptor signaling pathway involved in heart process(GO:1901205) regulation of citrulline biosynthetic process(GO:1903248) negative regulation of citrulline biosynthetic process(GO:1903249) regulation of cellular amino acid biosynthetic process(GO:2000282) negative regulation of cellular amino acid biosynthetic process(GO:2000283) |
| 0.1 | 2.3 | GO:1904659 | hexose transmembrane transport(GO:0035428) glucose transmembrane transport(GO:1904659) |
| 0.1 | 0.3 | GO:0006290 | pyrimidine dimer repair(GO:0006290) |
| 0.1 | 0.3 | GO:0036269 | swimming behavior(GO:0036269) |
| 0.1 | 0.9 | GO:0032780 | negative regulation of ATPase activity(GO:0032780) |
| 0.1 | 0.6 | GO:0001763 | morphogenesis of a branching structure(GO:0001763) |
| 0.1 | 0.3 | GO:1903045 | neural crest cell migration involved in sympathetic nervous system development(GO:1903045) |
| 0.1 | 0.3 | GO:0055064 | chloride ion homeostasis(GO:0055064) |
| 0.1 | 0.3 | GO:0032373 | positive regulation of sterol transport(GO:0032373) positive regulation of cholesterol transport(GO:0032376) |
| 0.1 | 0.2 | GO:1904046 | negative regulation of vascular endothelial growth factor production(GO:1904046) |
| 0.1 | 0.5 | GO:0045007 | depurination(GO:0045007) |
| 0.1 | 0.5 | GO:0033578 | protein glycosylation in Golgi(GO:0033578) |
| 0.1 | 6.7 | GO:0006501 | C-terminal protein lipidation(GO:0006501) |
| 0.1 | 0.3 | GO:0070317 | negative regulation of G0 to G1 transition(GO:0070317) |
| 0.1 | 0.9 | GO:0060575 | intestinal epithelial cell differentiation(GO:0060575) |
| 0.1 | 0.2 | GO:0043181 | vacuolar sequestering(GO:0043181) |
| 0.1 | 2.6 | GO:0014072 | response to isoquinoline alkaloid(GO:0014072) response to morphine(GO:0043278) |
| 0.1 | 0.1 | GO:2000295 | regulation of hydrogen peroxide catabolic process(GO:2000295) |
| 0.1 | 0.4 | GO:0050766 | positive regulation of phagocytosis(GO:0050766) |
| 0.1 | 0.3 | GO:0038092 | nodal signaling pathway(GO:0038092) |
| 0.1 | 1.7 | GO:0006953 | acute-phase response(GO:0006953) |
| 0.1 | 0.1 | GO:1900114 | positive regulation of histone H3-K9 trimethylation(GO:1900114) |
| 0.1 | 1.8 | GO:0006555 | methionine metabolic process(GO:0006555) |
| 0.1 | 1.8 | GO:0050962 | detection of light stimulus involved in visual perception(GO:0050908) detection of light stimulus involved in sensory perception(GO:0050962) |
| 0.1 | 0.4 | GO:0051684 | maintenance of Golgi location(GO:0051684) |
| 0.1 | 0.1 | GO:0090118 | receptor-mediated endocytosis of low-density lipoprotein particle involved in cholesterol transport(GO:0090118) |
| 0.1 | 0.4 | GO:1990504 | dense core granule exocytosis(GO:1990504) |
| 0.1 | 0.6 | GO:0032782 | bile acid secretion(GO:0032782) |
| 0.1 | 0.3 | GO:1902766 | skeletal muscle satellite cell migration(GO:1902766) |
| 0.1 | 0.6 | GO:0045741 | positive regulation of epidermal growth factor-activated receptor activity(GO:0045741) |
| 0.1 | 0.4 | GO:2000483 | negative regulation of interleukin-8 secretion(GO:2000483) |
| 0.1 | 0.1 | GO:0008628 | hormone-mediated apoptotic signaling pathway(GO:0008628) |
| 0.1 | 0.2 | GO:0055118 | negative regulation of cardiac muscle contraction(GO:0055118) |
| 0.1 | 0.2 | GO:0032290 | peripheral nervous system myelin formation(GO:0032290) |
| 0.1 | 0.5 | GO:0046784 | viral mRNA export from host cell nucleus(GO:0046784) |
| 0.1 | 0.7 | GO:0015760 | hexose phosphate transport(GO:0015712) glucose-6-phosphate transport(GO:0015760) |
| 0.1 | 0.7 | GO:0046520 | sphingoid biosynthetic process(GO:0046520) |
| 0.1 | 0.3 | GO:0015793 | glycerol transport(GO:0015793) |
| 0.1 | 0.4 | GO:0018343 | protein farnesylation(GO:0018343) |
| 0.1 | 0.3 | GO:0030382 | sperm mitochondrion organization(GO:0030382) |
| 0.1 | 0.2 | GO:0000412 | histone peptidyl-prolyl isomerization(GO:0000412) |
| 0.1 | 0.4 | GO:0001867 | complement activation, lectin pathway(GO:0001867) |
| 0.1 | 1.2 | GO:2000009 | negative regulation of protein localization to cell surface(GO:2000009) |
| 0.1 | 0.8 | GO:2001224 | positive regulation of neuron migration(GO:2001224) |
| 0.1 | 0.3 | GO:1903844 | regulation of cellular response to transforming growth factor beta stimulus(GO:1903844) |
| 0.1 | 0.2 | GO:0035803 | egg coat formation(GO:0035803) |
| 0.1 | 0.2 | GO:0035526 | retrograde transport, plasma membrane to Golgi(GO:0035526) |
| 0.1 | 0.6 | GO:0070050 | neuron cellular homeostasis(GO:0070050) |
| 0.1 | 0.2 | GO:0033967 | box C/D snoRNA 3'-end processing(GO:0000494) box C/D snoRNA metabolic process(GO:0033967) box C/D snoRNA processing(GO:0034963) histone glutamine methylation(GO:1990258) |
| 0.1 | 0.1 | GO:0044793 | negative regulation by host of viral process(GO:0044793) |
| 0.1 | 0.2 | GO:0002026 | regulation of the force of heart contraction(GO:0002026) |
| 0.1 | 1.3 | GO:0051798 | positive regulation of hair follicle development(GO:0051798) |
| 0.1 | 9.5 | GO:0006614 | SRP-dependent cotranslational protein targeting to membrane(GO:0006614) |
| 0.1 | 0.3 | GO:0090107 | regulation of high-density lipoprotein particle assembly(GO:0090107) |
| 0.1 | 0.7 | GO:0031282 | regulation of guanylate cyclase activity(GO:0031282) |
| 0.1 | 0.5 | GO:1901299 | negative regulation of hydrogen peroxide-mediated programmed cell death(GO:1901299) |
| 0.1 | 0.2 | GO:1904428 | negative regulation of tubulin deacetylation(GO:1904428) |
| 0.1 | 0.8 | GO:2000311 | regulation of alpha-amino-3-hydroxy-5-methyl-4-isoxazole propionate selective glutamate receptor activity(GO:2000311) |
| 0.1 | 1.7 | GO:0007157 | heterophilic cell-cell adhesion via plasma membrane cell adhesion molecules(GO:0007157) |
| 0.1 | 0.2 | GO:0018874 | benzoate metabolic process(GO:0018874) |
| 0.1 | 1.3 | GO:1901685 | glutathione derivative metabolic process(GO:1901685) glutathione derivative biosynthetic process(GO:1901687) |
| 0.1 | 0.3 | GO:0031086 | nuclear-transcribed mRNA catabolic process, deadenylation-independent decay(GO:0031086) |
| 0.1 | 0.3 | GO:0030573 | bile acid catabolic process(GO:0030573) |
| 0.1 | 1.9 | GO:0001913 | T cell mediated cytotoxicity(GO:0001913) |
| 0.1 | 0.6 | GO:0002483 | antigen processing and presentation of endogenous peptide antigen(GO:0002483) |
| 0.1 | 1.0 | GO:0001562 | response to protozoan(GO:0001562) |
| 0.1 | 1.0 | GO:0048305 | immunoglobulin secretion(GO:0048305) |
| 0.1 | 1.0 | GO:1990573 | potassium ion import across plasma membrane(GO:1990573) |
| 0.1 | 1.4 | GO:0033622 | integrin activation(GO:0033622) |
| 0.1 | 0.5 | GO:0033564 | anterior/posterior axon guidance(GO:0033564) |
| 0.1 | 0.3 | GO:1902462 | regulation of mesenchymal stem cell proliferation(GO:1902460) positive regulation of mesenchymal stem cell proliferation(GO:1902462) |
| 0.1 | 0.1 | GO:0002439 | chronic inflammatory response to antigenic stimulus(GO:0002439) |
| 0.1 | 0.7 | GO:0060294 | cilium movement involved in cell motility(GO:0060294) |
| 0.1 | 0.2 | GO:0033563 | dorsal/ventral axon guidance(GO:0033563) |
| 0.1 | 0.2 | GO:0048733 | sebaceous gland development(GO:0048733) |
| 0.1 | 0.2 | GO:0033299 | secretion of lysosomal enzymes(GO:0033299) |
| 0.1 | 0.6 | GO:1900029 | positive regulation of ruffle assembly(GO:1900029) |
| 0.1 | 0.2 | GO:0090527 | actin filament reorganization(GO:0090527) |
| 0.1 | 0.6 | GO:0006068 | ethanol catabolic process(GO:0006068) |
| 0.1 | 0.3 | GO:0097211 | response to gonadotropin-releasing hormone(GO:0097210) cellular response to gonadotropin-releasing hormone(GO:0097211) |
| 0.1 | 1.0 | GO:0048172 | regulation of short-term neuronal synaptic plasticity(GO:0048172) |
| 0.1 | 0.2 | GO:0071233 | cellular response to leucine(GO:0071233) |
| 0.1 | 0.2 | GO:0003340 | negative regulation of mesenchymal to epithelial transition involved in metanephros morphogenesis(GO:0003340) |
| 0.1 | 0.2 | GO:0060081 | membrane hyperpolarization(GO:0060081) |
| 0.1 | 1.1 | GO:0043518 | negative regulation of DNA damage response, signal transduction by p53 class mediator(GO:0043518) |
| 0.1 | 0.7 | GO:0015074 | DNA integration(GO:0015074) |
| 0.1 | 0.3 | GO:0000432 | regulation of transcription from RNA polymerase II promoter by glucose(GO:0000430) positive regulation of transcription from RNA polymerase II promoter by glucose(GO:0000432) positive regulation of transcription by glucose(GO:0046016) |
| 0.1 | 0.2 | GO:0048200 | COPI-coated vesicle budding(GO:0035964) Golgi transport vesicle coating(GO:0048200) COPI coating of Golgi vesicle(GO:0048205) |
| 0.1 | 0.3 | GO:0046340 | diacylglycerol catabolic process(GO:0046340) |
| 0.1 | 0.3 | GO:0007341 | penetration of zona pellucida(GO:0007341) |
| 0.1 | 0.9 | GO:0019532 | oxalate transport(GO:0019532) |
| 0.1 | 0.3 | GO:0019627 | urea metabolic process(GO:0019627) |
| 0.1 | 1.7 | GO:0003197 | endocardial cushion development(GO:0003197) |
| 0.1 | 0.9 | GO:0006366 | transcription from RNA polymerase II promoter(GO:0006366) |
| 0.1 | 0.4 | GO:0030199 | collagen fibril organization(GO:0030199) |
| 0.1 | 0.2 | GO:0006742 | NADP catabolic process(GO:0006742) pyridine nucleotide catabolic process(GO:0019364) |
| 0.1 | 0.2 | GO:0010898 | regulation of triglyceride catabolic process(GO:0010896) positive regulation of triglyceride catabolic process(GO:0010898) |
| 0.1 | 0.2 | GO:0018002 | N-terminal peptidyl-serine acetylation(GO:0017198) N-terminal peptidyl-glutamic acid acetylation(GO:0018002) peptidyl-serine acetylation(GO:0030920) |
| 0.1 | 1.5 | GO:0003298 | physiological muscle hypertrophy(GO:0003298) physiological cardiac muscle hypertrophy(GO:0003301) cell growth involved in cardiac muscle cell development(GO:0061049) |
| 0.1 | 0.2 | GO:0036090 | cleavage furrow ingression(GO:0036090) |
| 0.1 | 0.5 | GO:0006828 | manganese ion transport(GO:0006828) |
| 0.1 | 0.1 | GO:0060425 | lung morphogenesis(GO:0060425) |
| 0.1 | 0.1 | GO:0072268 | pattern specification involved in metanephros development(GO:0072268) |
| 0.1 | 0.3 | GO:0010988 | regulation of low-density lipoprotein particle clearance(GO:0010988) |
| 0.1 | 1.0 | GO:0030205 | dermatan sulfate metabolic process(GO:0030205) |
| 0.1 | 0.6 | GO:2000324 | positive regulation of glucocorticoid receptor signaling pathway(GO:2000324) |
| 0.1 | 0.2 | GO:0071352 | interleukin-2-mediated signaling pathway(GO:0038110) cellular response to interleukin-2(GO:0071352) |
| 0.1 | 2.6 | GO:0015701 | bicarbonate transport(GO:0015701) |
| 0.1 | 0.2 | GO:0048840 | otolith development(GO:0048840) |
| 0.1 | 0.2 | GO:0036060 | filtration diaphragm assembly(GO:0036058) slit diaphragm assembly(GO:0036060) |
| 0.1 | 0.2 | GO:0061589 | calcium activated phosphatidylserine scrambling(GO:0061589) |
| 0.1 | 0.2 | GO:0007498 | mesoderm development(GO:0007498) |
| 0.1 | 0.3 | GO:0045188 | regulation of circadian sleep/wake cycle, non-REM sleep(GO:0045188) |
| 0.1 | 0.3 | GO:0051593 | response to folic acid(GO:0051593) |
| 0.1 | 0.5 | GO:0036503 | ERAD pathway(GO:0036503) |
| 0.1 | 0.5 | GO:0045730 | respiratory burst(GO:0045730) |
| 0.1 | 0.2 | GO:0060484 | lung-associated mesenchyme development(GO:0060484) |
| 0.0 | 0.3 | GO:0046949 | fatty-acyl-CoA biosynthetic process(GO:0046949) |
| 0.0 | 0.2 | GO:0036149 | phosphatidylinositol acyl-chain remodeling(GO:0036149) |
| 0.0 | 0.2 | GO:1902400 | signal transduction involved in mitotic G1 DNA damage checkpoint(GO:0072431) intracellular signal transduction involved in G1 DNA damage checkpoint(GO:1902400) |
| 0.0 | 0.3 | GO:0060219 | camera-type eye photoreceptor cell differentiation(GO:0060219) |
| 0.0 | 0.2 | GO:0033384 | geranyl diphosphate metabolic process(GO:0033383) geranyl diphosphate biosynthetic process(GO:0033384) farnesyl diphosphate biosynthetic process(GO:0045337) farnesyl diphosphate metabolic process(GO:0045338) |
| 0.0 | 0.0 | GO:2000297 | negative regulation of synapse maturation(GO:2000297) |
| 0.0 | 2.6 | GO:0097503 | sialylation(GO:0097503) |
| 0.0 | 1.9 | GO:0042572 | retinol metabolic process(GO:0042572) |
| 0.0 | 0.1 | GO:0032696 | negative regulation of interleukin-13 production(GO:0032696) |
| 0.0 | 3.5 | GO:0060337 | type I interferon signaling pathway(GO:0060337) cellular response to type I interferon(GO:0071357) |
| 0.0 | 0.3 | GO:0014067 | negative regulation of phosphatidylinositol 3-kinase signaling(GO:0014067) |
| 0.0 | 0.2 | GO:0045109 | intermediate filament organization(GO:0045109) |
| 0.0 | 0.4 | GO:0060044 | negative regulation of cardiac muscle cell proliferation(GO:0060044) |
| 0.0 | 0.2 | GO:0002024 | diet induced thermogenesis(GO:0002024) |
| 0.0 | 0.1 | GO:0072156 | distal tubule morphogenesis(GO:0072156) |
| 0.0 | 0.1 | GO:0007343 | egg activation(GO:0007343) |
| 0.0 | 1.3 | GO:0001676 | long-chain fatty acid metabolic process(GO:0001676) |
| 0.0 | 0.0 | GO:2000196 | positive regulation of female gonad development(GO:2000196) |
| 0.0 | 0.1 | GO:1902445 | regulation of mitochondrial membrane permeability involved in programmed necrotic cell death(GO:1902445) |
| 0.0 | 0.3 | GO:0048243 | norepinephrine secretion(GO:0048243) |
| 0.0 | 0.3 | GO:0042136 | neurotransmitter biosynthetic process(GO:0042136) |
| 0.0 | 0.2 | GO:0042796 | snRNA transcription from RNA polymerase III promoter(GO:0042796) |
| 0.0 | 0.1 | GO:0008627 | intrinsic apoptotic signaling pathway in response to osmotic stress(GO:0008627) |
| 0.0 | 2.3 | GO:0007520 | myoblast fusion(GO:0007520) |
| 0.0 | 0.1 | GO:0036135 | Schwann cell migration(GO:0036135) regulation of Schwann cell migration(GO:1900147) |
| 0.0 | 0.1 | GO:0030050 | vesicle transport along actin filament(GO:0030050) actin filament-based transport(GO:0099515) |
| 0.0 | 0.2 | GO:0009071 | L-serine catabolic process(GO:0006565) serine family amino acid catabolic process(GO:0009071) |
| 0.0 | 0.1 | GO:0051085 | 'de novo' posttranslational protein folding(GO:0051084) chaperone mediated protein folding requiring cofactor(GO:0051085) |
| 0.0 | 0.9 | GO:0036065 | fucosylation(GO:0036065) |
| 0.0 | 0.3 | GO:0035965 | cardiolipin acyl-chain remodeling(GO:0035965) |
| 0.0 | 0.3 | GO:0043932 | ossification involved in bone remodeling(GO:0043932) |
| 0.0 | 0.1 | GO:0045759 | negative regulation of action potential(GO:0045759) |
| 0.0 | 0.8 | GO:0010663 | positive regulation of striated muscle cell apoptotic process(GO:0010663) positive regulation of cardiac muscle cell apoptotic process(GO:0010666) |
| 0.0 | 0.1 | GO:0033058 | directional locomotion(GO:0033058) |
| 0.0 | 0.2 | GO:0006489 | dolichyl diphosphate biosynthetic process(GO:0006489) dolichyl diphosphate metabolic process(GO:0046465) |
| 0.0 | 0.3 | GO:0007214 | gamma-aminobutyric acid signaling pathway(GO:0007214) |
| 0.0 | 0.1 | GO:0010248 | establishment or maintenance of transmembrane electrochemical gradient(GO:0010248) |
| 0.0 | 0.4 | GO:0032092 | positive regulation of protein binding(GO:0032092) |
| 0.0 | 0.3 | GO:0051012 | microtubule sliding(GO:0051012) |
| 0.0 | 0.5 | GO:0030207 | chondroitin sulfate catabolic process(GO:0030207) |
| 0.0 | 1.1 | GO:0030511 | positive regulation of transforming growth factor beta receptor signaling pathway(GO:0030511) positive regulation of cellular response to transforming growth factor beta stimulus(GO:1903846) |
| 0.0 | 0.3 | GO:0050930 | induction of positive chemotaxis(GO:0050930) |
| 0.0 | 2.1 | GO:0000413 | protein peptidyl-prolyl isomerization(GO:0000413) |
| 0.0 | 0.6 | GO:0046548 | retinal rod cell development(GO:0046548) |
| 0.0 | 0.2 | GO:0072656 | maintenance of protein location in mitochondrion(GO:0072656) |
| 0.0 | 0.3 | GO:0042976 | activation of Janus kinase activity(GO:0042976) |
| 0.0 | 0.7 | GO:0003299 | muscle hypertrophy in response to stress(GO:0003299) cardiac muscle adaptation(GO:0014887) cardiac muscle hypertrophy in response to stress(GO:0014898) |
| 0.0 | 1.3 | GO:0032786 | positive regulation of DNA-templated transcription, elongation(GO:0032786) |
| 0.0 | 0.4 | GO:0061072 | iris morphogenesis(GO:0061072) |
| 0.0 | 0.5 | GO:0060124 | positive regulation of growth hormone secretion(GO:0060124) |
| 0.0 | 0.0 | GO:0036367 | adaptation of rhodopsin mediated signaling(GO:0016062) light adaption(GO:0036367) |
| 0.0 | 0.3 | GO:0051533 | positive regulation of NFAT protein import into nucleus(GO:0051533) |
| 0.0 | 0.2 | GO:0008214 | protein demethylation(GO:0006482) protein dealkylation(GO:0008214) |
| 0.0 | 0.2 | GO:0046947 | hydroxylysine metabolic process(GO:0046946) hydroxylysine biosynthetic process(GO:0046947) |
| 0.0 | 0.2 | GO:0045023 | G0 to G1 transition(GO:0045023) |
| 0.0 | 0.4 | GO:0070294 | renal sodium ion transport(GO:0003096) renal sodium ion absorption(GO:0070294) |
| 0.0 | 0.2 | GO:0008272 | sulfate transport(GO:0008272) |
| 0.0 | 0.2 | GO:0002305 | gamma-delta intraepithelial T cell differentiation(GO:0002304) CD8-positive, gamma-delta intraepithelial T cell differentiation(GO:0002305) |
| 0.0 | 0.1 | GO:1990928 | response to amino acid starvation(GO:1990928) |
| 0.0 | 0.3 | GO:2001013 | epithelial cell proliferation involved in renal tubule morphogenesis(GO:2001013) |
| 0.0 | 0.4 | GO:1901678 | iron coordination entity transport(GO:1901678) |
| 0.0 | 0.3 | GO:0015860 | purine nucleoside transmembrane transport(GO:0015860) |
| 0.0 | 0.5 | GO:0071493 | cellular response to UV-B(GO:0071493) |
| 0.0 | 0.3 | GO:0060850 | regulation of transcription involved in cell fate commitment(GO:0060850) |
| 0.0 | 1.2 | GO:0010107 | potassium ion import(GO:0010107) |
| 0.0 | 0.5 | GO:0030252 | growth hormone secretion(GO:0030252) |
| 0.0 | 0.1 | GO:2000402 | negative regulation of lymphocyte migration(GO:2000402) |
| 0.0 | 0.4 | GO:0060334 | regulation of interferon-gamma-mediated signaling pathway(GO:0060334) |
| 0.0 | 0.1 | GO:0060736 | prostate gland growth(GO:0060736) |
| 0.0 | 0.4 | GO:0040032 | post-embryonic body morphogenesis(GO:0040032) |
| 0.0 | 0.0 | GO:0002883 | hypersensitivity(GO:0002524) regulation of hypersensitivity(GO:0002883) |
| 0.0 | 0.9 | GO:0035774 | positive regulation of insulin secretion involved in cellular response to glucose stimulus(GO:0035774) |
| 0.0 | 0.1 | GO:0071799 | response to prostaglandin D(GO:0071798) cellular response to prostaglandin D stimulus(GO:0071799) |
| 0.0 | 0.1 | GO:1902514 | regulation of calcium ion transmembrane transport via high voltage-gated calcium channel(GO:1902514) |
| 0.0 | 0.1 | GO:0061300 | cerebellum vasculature development(GO:0061300) |
| 0.0 | 0.2 | GO:0046498 | S-adenosylmethionine cycle(GO:0033353) S-adenosylhomocysteine metabolic process(GO:0046498) |
| 0.0 | 0.4 | GO:0036444 | calcium ion transmembrane import into mitochondrion(GO:0036444) |
| 0.0 | 0.2 | GO:0071900 | regulation of protein serine/threonine kinase activity(GO:0071900) |
| 0.0 | 0.3 | GO:0032526 | response to retinoic acid(GO:0032526) |
| 0.0 | 0.8 | GO:0007616 | long-term memory(GO:0007616) |
| 0.0 | 0.0 | GO:0060916 | mesenchymal cell proliferation involved in lung development(GO:0060916) |
| 0.0 | 0.2 | GO:1902775 | mitochondrial large ribosomal subunit assembly(GO:1902775) |
| 0.0 | 0.1 | GO:0070278 | extracellular matrix constituent secretion(GO:0070278) |
| 0.0 | 0.6 | GO:0034587 | piRNA metabolic process(GO:0034587) |
| 0.0 | 0.3 | GO:0000395 | mRNA 5'-splice site recognition(GO:0000395) |
| 0.0 | 0.2 | GO:0043550 | regulation of lipid kinase activity(GO:0043550) |
| 0.0 | 0.2 | GO:0045766 | positive regulation of angiogenesis(GO:0045766) |
| 0.0 | 0.4 | GO:0035751 | regulation of lysosomal lumen pH(GO:0035751) |
| 0.0 | 0.1 | GO:1990414 | replication-born double-strand break repair via sister chromatid exchange(GO:1990414) |
| 0.0 | 0.8 | GO:0045494 | photoreceptor cell maintenance(GO:0045494) |
| 0.0 | 0.1 | GO:0048539 | bone marrow development(GO:0048539) |
| 0.0 | 0.6 | GO:0019371 | cyclooxygenase pathway(GO:0019371) |
| 0.0 | 0.4 | GO:1904153 | negative regulation of protein exit from endoplasmic reticulum(GO:0070862) negative regulation of retrograde protein transport, ER to cytosol(GO:1904153) |
| 0.0 | 0.7 | GO:0030513 | positive regulation of BMP signaling pathway(GO:0030513) |
| 0.0 | 1.0 | GO:0006491 | N-glycan processing(GO:0006491) |
| 0.0 | 0.0 | GO:0042222 | interleukin-1 biosynthetic process(GO:0042222) interleukin-1 beta biosynthetic process(GO:0050720) |
| 0.0 | 0.3 | GO:0019348 | dolichol metabolic process(GO:0019348) |
| 0.0 | 0.1 | GO:1902490 | regulation of sperm capacitation(GO:1902490) |
| 0.0 | 0.5 | GO:0018026 | peptidyl-lysine monomethylation(GO:0018026) |
| 0.0 | 0.6 | GO:0070208 | protein heterotrimerization(GO:0070208) |
| 0.0 | 0.9 | GO:0034063 | stress granule assembly(GO:0034063) |
| 0.0 | 0.2 | GO:1900017 | positive regulation of cytokine production involved in inflammatory response(GO:1900017) |
| 0.0 | 0.1 | GO:0098905 | regulation of bundle of His cell action potential(GO:0098905) |
| 0.0 | 0.1 | GO:0019482 | beta-alanine metabolic process(GO:0019482) |
| 0.0 | 0.4 | GO:0008090 | retrograde axonal transport(GO:0008090) |
| 0.0 | 0.1 | GO:0035880 | embryonic nail plate morphogenesis(GO:0035880) |
| 0.0 | 0.8 | GO:1902236 | negative regulation of endoplasmic reticulum stress-induced intrinsic apoptotic signaling pathway(GO:1902236) |
| 0.0 | 0.1 | GO:0021847 | ventricular zone neuroblast division(GO:0021847) |
| 0.0 | 0.2 | GO:0010664 | negative regulation of striated muscle cell apoptotic process(GO:0010664) negative regulation of cardiac muscle cell apoptotic process(GO:0010667) |
| 0.0 | 0.9 | GO:0006749 | glutathione metabolic process(GO:0006749) |
| 0.0 | 0.8 | GO:0035094 | response to nicotine(GO:0035094) |
| 0.0 | 0.4 | GO:0006657 | CDP-choline pathway(GO:0006657) |
| 0.0 | 0.4 | GO:2000623 | regulation of nuclear-transcribed mRNA catabolic process, nonsense-mediated decay(GO:2000622) negative regulation of nuclear-transcribed mRNA catabolic process, nonsense-mediated decay(GO:2000623) |
| 0.0 | 0.4 | GO:0045723 | positive regulation of fatty acid biosynthetic process(GO:0045723) |
| 0.0 | 0.2 | GO:0002710 | negative regulation of T cell mediated immunity(GO:0002710) |
| 0.0 | 0.1 | GO:0046122 | purine deoxyribonucleoside metabolic process(GO:0046122) |
| 0.0 | 0.3 | GO:0014809 | regulation of skeletal muscle contraction by regulation of release of sequestered calcium ion(GO:0014809) |
| 0.0 | 0.2 | GO:0030037 | actin filament reorganization involved in cell cycle(GO:0030037) |
| 0.0 | 0.5 | GO:0046339 | diacylglycerol metabolic process(GO:0046339) |
| 0.0 | 0.3 | GO:0060346 | bone trabecula formation(GO:0060346) |
| 0.0 | 0.3 | GO:0060122 | inner ear receptor stereocilium organization(GO:0060122) |
| 0.0 | 0.1 | GO:0035397 | helper T cell enhancement of adaptive immune response(GO:0035397) |
| 0.0 | 0.1 | GO:0009439 | cyanate metabolic process(GO:0009439) cyanate catabolic process(GO:0009440) |
| 0.0 | 1.2 | GO:0097120 | receptor localization to synapse(GO:0097120) |
| 0.0 | 0.1 | GO:0014062 | regulation of serotonin secretion(GO:0014062) negative regulation of serotonin secretion(GO:0014063) |
| 0.0 | 0.2 | GO:0051152 | positive regulation of smooth muscle cell differentiation(GO:0051152) |
| 0.0 | 0.2 | GO:0010890 | positive regulation of sequestering of triglyceride(GO:0010890) |
| 0.0 | 0.4 | GO:0051923 | sulfation(GO:0051923) |
| 0.0 | 0.1 | GO:0060017 | parathyroid gland development(GO:0060017) |
| 0.0 | 0.2 | GO:0035024 | negative regulation of Rho protein signal transduction(GO:0035024) |
| 0.0 | 0.1 | GO:0010922 | positive regulation of phosphatase activity(GO:0010922) |
| 0.0 | 0.8 | GO:0090200 | positive regulation of release of cytochrome c from mitochondria(GO:0090200) |
| 0.0 | 0.6 | GO:0019511 | peptidyl-proline hydroxylation(GO:0019511) |
| 0.0 | 0.2 | GO:0048739 | cardiac muscle fiber development(GO:0048739) |
| 0.0 | 0.1 | GO:0035878 | nail development(GO:0035878) |
| 0.0 | 0.6 | GO:0045116 | protein neddylation(GO:0045116) |
| 0.0 | 0.1 | GO:0044805 | late nucleophagy(GO:0044805) |
| 0.0 | 0.2 | GO:0042993 | positive regulation of transcription factor import into nucleus(GO:0042993) |
| 0.0 | 0.1 | GO:0048496 | maintenance of organ identity(GO:0048496) |
| 0.0 | 0.1 | GO:0061299 | retina vasculature development in camera-type eye(GO:0061298) retina vasculature morphogenesis in camera-type eye(GO:0061299) |
| 0.0 | 0.3 | GO:2000059 | negative regulation of protein ubiquitination involved in ubiquitin-dependent protein catabolic process(GO:2000059) |
| 0.0 | 0.2 | GO:0044872 | lipoprotein transport(GO:0042953) lipoprotein localization(GO:0044872) |
| 0.0 | 1.0 | GO:0015012 | heparan sulfate proteoglycan biosynthetic process(GO:0015012) |
| 0.0 | 0.2 | GO:0070901 | mitochondrial tRNA methylation(GO:0070901) |
| 0.0 | 0.1 | GO:0060040 | retinal bipolar neuron differentiation(GO:0060040) |
| 0.0 | 0.1 | GO:1900227 | positive regulation of NLRP3 inflammasome complex assembly(GO:1900227) |
| 0.0 | 0.1 | GO:0045686 | negative regulation of glial cell differentiation(GO:0045686) negative regulation of astrocyte differentiation(GO:0048712) |
| 0.0 | 0.2 | GO:0052551 | response to defense-related nitric oxide production by other organism involved in symbiotic interaction(GO:0052551) response to defense-related host nitric oxide production(GO:0052565) |
| 0.0 | 0.1 | GO:0040037 | negative regulation of fibroblast growth factor receptor signaling pathway(GO:0040037) |
| 0.0 | 0.3 | GO:0043374 | CD8-positive, alpha-beta T cell differentiation(GO:0043374) |
| 0.0 | 0.1 | GO:0021542 | dentate gyrus development(GO:0021542) |
| 0.0 | 0.1 | GO:0007538 | primary sex determination(GO:0007538) |
| 0.0 | 0.1 | GO:1901798 | positive regulation of signal transduction by p53 class mediator(GO:1901798) |
| 0.0 | 0.1 | GO:0006721 | terpenoid metabolic process(GO:0006721) |
| 0.0 | 0.4 | GO:0048240 | sperm capacitation(GO:0048240) |
| 0.0 | 0.2 | GO:0002430 | complement receptor mediated signaling pathway(GO:0002430) |
| 0.0 | 0.1 | GO:0007621 | negative regulation of female receptivity(GO:0007621) |
| 0.0 | 0.1 | GO:1904211 | membrane protein proteolysis involved in retrograde protein transport, ER to cytosol(GO:1904211) |
| 0.0 | 0.3 | GO:0007617 | mating behavior(GO:0007617) multi-organism reproductive behavior(GO:0044705) |
| 0.0 | 0.1 | GO:0000066 | mitochondrial ornithine transport(GO:0000066) |
| 0.0 | 0.9 | GO:0090162 | establishment of epithelial cell polarity(GO:0090162) |
| 0.0 | 0.5 | GO:0034380 | high-density lipoprotein particle assembly(GO:0034380) |
| 0.0 | 0.1 | GO:0002666 | positive regulation of T cell tolerance induction(GO:0002666) |
| 0.0 | 0.2 | GO:0070777 | D-aspartate transport(GO:0070777) D-aspartate import(GO:0070779) |
| 0.0 | 0.4 | GO:0036342 | post-anal tail morphogenesis(GO:0036342) |
| 0.0 | 0.4 | GO:0036148 | phosphatidylglycerol acyl-chain remodeling(GO:0036148) |
| 0.0 | 0.1 | GO:0001920 | negative regulation of receptor recycling(GO:0001920) |
| 0.0 | 0.2 | GO:0032185 | septin cytoskeleton organization(GO:0032185) |
| 0.0 | 0.1 | GO:0050713 | negative regulation of interleukin-1 beta secretion(GO:0050713) |
| 0.0 | 0.1 | GO:0019732 | antifungal humoral response(GO:0019732) |
| 0.0 | 0.2 | GO:0086027 | AV node cell action potential(GO:0086016) AV node cell to bundle of His cell signaling(GO:0086027) |
| 0.0 | 0.6 | GO:0031295 | lymphocyte costimulation(GO:0031294) T cell costimulation(GO:0031295) |
| 0.0 | 0.1 | GO:0061743 | motor learning(GO:0061743) |
| 0.0 | 0.2 | GO:0046149 | porphyrin-containing compound catabolic process(GO:0006787) tetrapyrrole catabolic process(GO:0033015) heme catabolic process(GO:0042167) pigment catabolic process(GO:0046149) |
| 0.0 | 0.3 | GO:0019695 | choline metabolic process(GO:0019695) |
| 0.0 | 0.4 | GO:1902222 | L-phenylalanine metabolic process(GO:0006558) L-phenylalanine catabolic process(GO:0006559) erythrose 4-phosphate/phosphoenolpyruvate family amino acid metabolic process(GO:1902221) erythrose 4-phosphate/phosphoenolpyruvate family amino acid catabolic process(GO:1902222) |
| 0.0 | 0.1 | GO:0060623 | regulation of chromosome condensation(GO:0060623) |
| 0.0 | 0.4 | GO:0019441 | tryptophan catabolic process to kynurenine(GO:0019441) |
| 0.0 | 0.1 | GO:0086042 | cardiac muscle cell-cardiac muscle cell adhesion(GO:0086042) bundle of His cell-Purkinje myocyte adhesion involved in cell communication(GO:0086073) |
| 0.0 | 0.2 | GO:1902455 | negative regulation of stem cell population maintenance(GO:1902455) |
| 0.0 | 0.6 | GO:0071425 | hematopoietic stem cell proliferation(GO:0071425) |
| 0.0 | 0.2 | GO:1905247 | positive regulation of aspartic-type endopeptidase activity involved in amyloid precursor protein catabolic process(GO:1902961) positive regulation of aspartic-type peptidase activity(GO:1905247) |
| 0.0 | 0.4 | GO:0031532 | actin cytoskeleton reorganization(GO:0031532) |
| 0.0 | 0.1 | GO:0044778 | meiotic DNA integrity checkpoint(GO:0044778) |
| 0.0 | 0.1 | GO:0051151 | negative regulation of smooth muscle cell differentiation(GO:0051151) |
| 0.0 | 0.2 | GO:0010831 | positive regulation of myotube differentiation(GO:0010831) |
| 0.0 | 2.2 | GO:0044243 | multicellular organism catabolic process(GO:0044243) |
| 0.0 | 0.5 | GO:0033539 | fatty acid beta-oxidation using acyl-CoA dehydrogenase(GO:0033539) |
| 0.0 | 0.1 | GO:0018364 | peptidyl-glutamine methylation(GO:0018364) |
| 0.0 | 0.2 | GO:0001778 | plasma membrane repair(GO:0001778) |
| 0.0 | 0.0 | GO:0043368 | positive T cell selection(GO:0043368) |
| 0.0 | 0.2 | GO:0045948 | positive regulation of translational initiation(GO:0045948) |
| 0.0 | 0.3 | GO:0045056 | transcytosis(GO:0045056) |
| 0.0 | 0.5 | GO:0001829 | trophectodermal cell differentiation(GO:0001829) |
| 0.0 | 0.4 | GO:0090161 | Golgi ribbon formation(GO:0090161) |
| 0.0 | 0.1 | GO:1903803 | glutamine secretion(GO:0010585) L-glutamine import(GO:0036229) L-glutamine import into cell(GO:1903803) |
| 0.0 | 0.3 | GO:0048635 | negative regulation of muscle organ development(GO:0048635) |
| 0.0 | 0.0 | GO:0009804 | coumarin metabolic process(GO:0009804) |
| 0.0 | 0.1 | GO:0097065 | anterior head development(GO:0097065) regulation of anterior head development(GO:2000742) positive regulation of anterior head development(GO:2000744) |
| 0.0 | 0.1 | GO:0035106 | operant conditioning(GO:0035106) |
| 0.0 | 0.2 | GO:0072513 | positive regulation of secondary heart field cardioblast proliferation(GO:0072513) |
| 0.0 | 0.2 | GO:0060712 | spongiotrophoblast layer development(GO:0060712) |
| 0.0 | 0.2 | GO:0002441 | histamine production involved in inflammatory response(GO:0002349) histamine secretion involved in inflammatory response(GO:0002441) histamine secretion by mast cell(GO:0002553) |
| 0.0 | 0.1 | GO:0044830 | modulation by host of viral RNA genome replication(GO:0044830) positive regulation of intracellular transport of viral material(GO:1901254) |
| 0.0 | 0.4 | GO:0090361 | platelet-derived growth factor production(GO:0090360) regulation of platelet-derived growth factor production(GO:0090361) |
| 0.0 | 0.1 | GO:0003431 | growth plate cartilage chondrocyte development(GO:0003431) |
| 0.0 | 0.1 | GO:0042435 | serotonin biosynthetic process(GO:0042427) indole-containing compound biosynthetic process(GO:0042435) indolalkylamine biosynthetic process(GO:0046219) |
| 0.0 | 0.8 | GO:0042771 | intrinsic apoptotic signaling pathway in response to DNA damage by p53 class mediator(GO:0042771) |
| 0.0 | 0.1 | GO:0042089 | cytokine biosynthetic process(GO:0042089) |
| 0.0 | 0.1 | GO:2000377 | regulation of reactive oxygen species metabolic process(GO:2000377) |
| 0.0 | 0.2 | GO:1903358 | regulation of Golgi organization(GO:1903358) |
| 0.0 | 0.1 | GO:0002347 | response to tumor cell(GO:0002347) |
| 0.0 | 0.0 | GO:0007228 | positive regulation of hh target transcription factor activity(GO:0007228) |
| 0.0 | 0.1 | GO:0038030 | non-canonical Wnt signaling pathway via MAPK cascade(GO:0038030) non-canonical Wnt signaling pathway via JNK cascade(GO:0038031) |
| 0.0 | 0.2 | GO:0006883 | cellular sodium ion homeostasis(GO:0006883) |
| 0.0 | 0.2 | GO:0035655 | interleukin-18-mediated signaling pathway(GO:0035655) cellular response to interleukin-18(GO:0071351) |
| 0.0 | 0.1 | GO:0008588 | release of cytoplasmic sequestered NF-kappaB(GO:0008588) |
| 0.0 | 0.1 | GO:1903461 | Okazaki fragment processing involved in mitotic DNA replication(GO:1903461) |
| 0.0 | 0.1 | GO:1904587 | response to glycoprotein(GO:1904587) |
| 0.0 | 0.0 | GO:0006907 | pinocytosis(GO:0006907) |
| 0.0 | 0.1 | GO:0015911 | plasma membrane long-chain fatty acid transport(GO:0015911) |
| 0.0 | 0.2 | GO:0006930 | substrate-dependent cell migration, cell extension(GO:0006930) |
| 0.0 | 0.0 | GO:0043396 | corticotropin-releasing hormone secretion(GO:0043396) regulation of corticotropin-releasing hormone secretion(GO:0043397) positive regulation of corticotropin-releasing hormone secretion(GO:0051466) |
| 0.0 | 0.1 | GO:0044728 | DNA methylation or demethylation(GO:0044728) |
| 0.0 | 0.3 | GO:1903959 | regulation of anion transmembrane transport(GO:1903959) |
| 0.0 | 0.1 | GO:0019046 | release from viral latency(GO:0019046) |
| 0.0 | 0.5 | GO:0090286 | cytoskeletal anchoring at nuclear membrane(GO:0090286) |
| 0.0 | 0.4 | GO:0042340 | keratan sulfate catabolic process(GO:0042340) |
| 0.0 | 0.8 | GO:0006910 | phagocytosis, recognition(GO:0006910) |
| 0.0 | 1.2 | GO:0070534 | protein K63-linked ubiquitination(GO:0070534) |
| 0.0 | 0.5 | GO:0033617 | mitochondrial respiratory chain complex IV assembly(GO:0033617) mitochondrial respiratory chain complex IV biogenesis(GO:0097034) |
| 0.0 | 0.4 | GO:0006030 | chitin metabolic process(GO:0006030) chitin catabolic process(GO:0006032) |
| 0.0 | 0.6 | GO:0022400 | regulation of rhodopsin mediated signaling pathway(GO:0022400) |
| 0.0 | 0.1 | GO:0046098 | guanine catabolic process(GO:0006147) guanine metabolic process(GO:0046098) |
| 0.0 | 0.5 | GO:0044550 | secondary metabolite biosynthetic process(GO:0044550) |
| 0.0 | 0.1 | GO:0031128 | developmental induction(GO:0031128) |
| 0.0 | 0.2 | GO:0007084 | mitotic nuclear envelope reassembly(GO:0007084) |
| 0.0 | 0.4 | GO:0003341 | cilium movement(GO:0003341) |
| 0.0 | 0.1 | GO:0038193 | thromboxane A2 signaling pathway(GO:0038193) |
| 0.0 | 0.0 | GO:0010579 | regulation of adenylate cyclase activity involved in G-protein coupled receptor signaling pathway(GO:0010578) positive regulation of adenylate cyclase activity involved in G-protein coupled receptor signaling pathway(GO:0010579) |
| 0.0 | 0.1 | GO:0009744 | response to sucrose(GO:0009744) response to disaccharide(GO:0034285) |
| 0.0 | 0.1 | GO:0031584 | activation of phospholipase D activity(GO:0031584) |
| 0.0 | 0.2 | GO:0032287 | peripheral nervous system myelin maintenance(GO:0032287) |
| 0.0 | 0.4 | GO:1900744 | regulation of p38MAPK cascade(GO:1900744) |
| 0.0 | 0.0 | GO:0060009 | Sertoli cell development(GO:0060009) |
| 0.0 | 0.6 | GO:0035235 | ionotropic glutamate receptor signaling pathway(GO:0035235) |
| 0.0 | 0.0 | GO:2001033 | negative regulation of double-strand break repair via nonhomologous end joining(GO:2001033) |
| 0.0 | 0.1 | GO:0072678 | T cell migration(GO:0072678) |
| 0.0 | 0.1 | GO:0009312 | oligosaccharide biosynthetic process(GO:0009312) |
| 0.0 | 0.3 | GO:0001973 | adenosine receptor signaling pathway(GO:0001973) |
| 0.0 | 0.1 | GO:0060051 | negative regulation of protein ADP-ribosylation(GO:0010836) negative regulation of protein glycosylation(GO:0060051) |
| 0.0 | 0.2 | GO:0033234 | negative regulation of protein sumoylation(GO:0033234) |
| 0.0 | 0.1 | GO:0009593 | detection of calcium ion(GO:0005513) detection of chemical stimulus(GO:0009593) |
| 0.0 | 0.5 | GO:0034389 | lipid particle organization(GO:0034389) |
| 0.0 | 0.1 | GO:0006987 | activation of signaling protein activity involved in unfolded protein response(GO:0006987) |
| 0.0 | 0.1 | GO:0061158 | 3'-UTR-mediated mRNA destabilization(GO:0061158) |
| 0.0 | 2.1 | GO:0050911 | detection of chemical stimulus involved in sensory perception of smell(GO:0050911) |
| 0.0 | 0.1 | GO:0048845 | venous blood vessel morphogenesis(GO:0048845) |
| 0.0 | 0.2 | GO:0035418 | protein localization to synapse(GO:0035418) |
| 0.0 | 0.2 | GO:0001833 | inner cell mass cell proliferation(GO:0001833) |
| 0.0 | 0.1 | GO:0070235 | regulation of activation-induced cell death of T cells(GO:0070235) |
| 0.0 | 0.1 | GO:2000393 | negative regulation of lamellipodium morphogenesis(GO:2000393) |
| 0.0 | 0.2 | GO:0016998 | cell wall macromolecule catabolic process(GO:0016998) |
| 0.0 | 0.3 | GO:0035115 | embryonic forelimb morphogenesis(GO:0035115) |
| 0.0 | 0.1 | GO:0045836 | positive regulation of meiotic nuclear division(GO:0045836) |
| 0.0 | 0.1 | GO:0002023 | reduction of food intake in response to dietary excess(GO:0002023) |
| 0.0 | 0.2 | GO:0015884 | folic acid transport(GO:0015884) |
| 0.0 | 0.2 | GO:2001214 | positive regulation of vasculogenesis(GO:2001214) |
| 0.0 | 0.5 | GO:0090662 | ATP hydrolysis coupled transmembrane transport(GO:0090662) |
| 0.0 | 0.2 | GO:1904220 | regulation of serine C-palmitoyltransferase activity(GO:1904220) |
| 0.0 | 0.3 | GO:0098787 | mRNA cleavage involved in mRNA processing(GO:0098787) |
| 0.0 | 0.2 | GO:0048227 | plasma membrane to endosome transport(GO:0048227) |
| 0.0 | 0.0 | GO:0035494 | SNARE complex disassembly(GO:0035494) |
| 0.0 | 0.2 | GO:0035855 | megakaryocyte development(GO:0035855) |
| 0.0 | 0.0 | GO:0007595 | lactation(GO:0007595) |
| 0.0 | 0.1 | GO:0071286 | cellular response to magnesium ion(GO:0071286) |
| 0.0 | 0.4 | GO:0007398 | ectoderm development(GO:0007398) |
| 0.0 | 0.1 | GO:0046108 | uridine metabolic process(GO:0046108) |
| 0.0 | 0.3 | GO:2000171 | negative regulation of dendrite development(GO:2000171) |
| 0.0 | 0.4 | GO:0043030 | regulation of macrophage activation(GO:0043030) |
| 0.0 | 0.1 | GO:2001244 | positive regulation of intrinsic apoptotic signaling pathway(GO:2001244) |
| 0.0 | 0.1 | GO:0072429 | response to intra-S DNA damage checkpoint signaling(GO:0072429) |
| 0.0 | 0.0 | GO:0046677 | response to antibiotic(GO:0046677) |
| 0.0 | 2.1 | GO:1902476 | chloride transmembrane transport(GO:1902476) |
| 0.0 | 0.1 | GO:0060380 | regulation of single-stranded telomeric DNA binding(GO:0060380) positive regulation of single-stranded telomeric DNA binding(GO:0060381) |
| 0.0 | 0.1 | GO:0090043 | regulation of tubulin deacetylation(GO:0090043) |
| 0.0 | 0.0 | GO:0009726 | detection of endogenous stimulus(GO:0009726) |
| 0.0 | 0.1 | GO:0030638 | polyketide metabolic process(GO:0030638) aminoglycoside antibiotic metabolic process(GO:0030647) daunorubicin metabolic process(GO:0044597) doxorubicin metabolic process(GO:0044598) |
| 0.0 | 0.1 | GO:2000134 | negative regulation of G1/S transition of mitotic cell cycle(GO:2000134) |
| 0.0 | 0.2 | GO:0006682 | galactosylceramide biosynthetic process(GO:0006682) galactolipid biosynthetic process(GO:0019375) |
| 0.0 | 0.4 | GO:0045879 | negative regulation of smoothened signaling pathway(GO:0045879) |
| 0.0 | 0.1 | GO:0016240 | autophagosome docking(GO:0016240) |
| 0.0 | 0.1 | GO:0038083 | peptidyl-tyrosine autophosphorylation(GO:0038083) |
| 0.0 | 0.1 | GO:0032796 | uropod organization(GO:0032796) |
| 0.0 | 0.2 | GO:0014850 | response to muscle activity(GO:0014850) |
| 0.0 | 0.1 | GO:1902894 | negative regulation of pri-miRNA transcription from RNA polymerase II promoter(GO:1902894) |
| 0.0 | 0.1 | GO:0042780 | tRNA 3'-end processing(GO:0042780) |
| 0.0 | 0.4 | GO:0009226 | nucleotide-sugar biosynthetic process(GO:0009226) |
| 0.0 | 0.1 | GO:0090073 | positive regulation of protein homodimerization activity(GO:0090073) |
| 0.0 | 0.0 | GO:0050905 | neuromuscular process(GO:0050905) |
| 0.0 | 0.4 | GO:0022404 | hair follicle development(GO:0001942) molting cycle process(GO:0022404) hair cycle process(GO:0022405) skin epidermis development(GO:0098773) |
| 0.0 | 0.1 | GO:2000821 | regulation of grooming behavior(GO:2000821) |
| 0.0 | 0.1 | GO:0038128 | ERBB2 signaling pathway(GO:0038128) |
| 0.0 | 0.1 | GO:0034390 | smooth muscle cell apoptotic process(GO:0034390) regulation of smooth muscle cell apoptotic process(GO:0034391) |
| 0.0 | 0.1 | GO:0035307 | positive regulation of dephosphorylation(GO:0035306) positive regulation of protein dephosphorylation(GO:0035307) |
| 0.0 | 0.0 | GO:0002755 | MyD88-dependent toll-like receptor signaling pathway(GO:0002755) |
| 0.0 | 0.1 | GO:2001222 | regulation of neuron migration(GO:2001222) |
| 0.0 | 0.2 | GO:0007528 | neuromuscular junction development(GO:0007528) |
| 0.0 | 0.0 | GO:1990697 | protein depalmitoleylation(GO:1990697) |
| 0.0 | 0.1 | GO:0000023 | maltose metabolic process(GO:0000023) |
| 0.0 | 0.0 | GO:0090080 | positive regulation of MAPKKK cascade by fibroblast growth factor receptor signaling pathway(GO:0090080) |
| 0.0 | 0.0 | GO:0072718 | response to cisplatin(GO:0072718) |
| 0.0 | 0.1 | GO:0097105 | presynaptic membrane assembly(GO:0097105) |
| 0.0 | 0.1 | GO:2000394 | positive regulation of lamellipodium morphogenesis(GO:2000394) |
| 0.0 | 0.4 | GO:0019228 | neuronal action potential(GO:0019228) |
| 0.0 | 0.5 | GO:1901998 | toxin transport(GO:1901998) |
| 0.0 | 0.5 | GO:0051123 | RNA polymerase II transcriptional preinitiation complex assembly(GO:0051123) |
| 0.0 | 0.2 | GO:0021895 | cerebral cortex neuron differentiation(GO:0021895) |
| 0.0 | 0.0 | GO:0021722 | pons maturation(GO:0021586) superior olivary nucleus development(GO:0021718) superior olivary nucleus maturation(GO:0021722) |
| 0.0 | 0.3 | GO:0010862 | positive regulation of pathway-restricted SMAD protein phosphorylation(GO:0010862) |
| 0.0 | 0.2 | GO:0006379 | mRNA cleavage(GO:0006379) |
| 0.0 | 0.1 | GO:0097475 | motor neuron migration(GO:0097475) |
| 0.0 | 0.1 | GO:0035790 | platelet-derived growth factor receptor-alpha signaling pathway(GO:0035790) |
| 0.0 | 0.0 | GO:0031018 | endocrine pancreas development(GO:0031018) |
| 0.0 | 0.1 | GO:0008637 | apoptotic mitochondrial changes(GO:0008637) |
| 0.0 | 0.3 | GO:0051703 | social behavior(GO:0035176) intraspecies interaction between organisms(GO:0051703) |
| 0.0 | 0.6 | GO:0038202 | TORC1 signaling(GO:0038202) |
| 0.0 | 0.0 | GO:0009624 | response to nematode(GO:0009624) |
| 0.0 | 0.0 | GO:0035935 | androgen secretion(GO:0035935) testosterone secretion(GO:0035936) regulation of hepatic stellate cell proliferation(GO:1904897) positive regulation of hepatic stellate cell proliferation(GO:1904899) hepatic stellate cell proliferation(GO:1990922) regulation of androgen secretion(GO:2000834) positive regulation of androgen secretion(GO:2000836) regulation of testosterone secretion(GO:2000843) positive regulation of testosterone secretion(GO:2000845) |
| 0.0 | 0.2 | GO:0060561 | apoptotic process involved in morphogenesis(GO:0060561) |
| 0.0 | 0.1 | GO:1902310 | positive regulation of peptidyl-serine dephosphorylation(GO:1902310) |
| 0.0 | 0.0 | GO:0019254 | carnitine metabolic process, CoA-linked(GO:0019254) |
| 0.0 | 0.6 | GO:0006376 | mRNA splice site selection(GO:0006376) |
| 0.0 | 0.1 | GO:0033147 | negative regulation of intracellular estrogen receptor signaling pathway(GO:0033147) |
| 0.0 | 0.2 | GO:0072512 | ferric iron transport(GO:0015682) trivalent inorganic cation transport(GO:0072512) |
| 0.0 | 0.0 | GO:0007077 | mitotic nuclear envelope disassembly(GO:0007077) |
| 0.0 | 0.1 | GO:0032693 | negative regulation of interleukin-10 production(GO:0032693) |
| 0.0 | 0.1 | GO:0061732 | mitochondrial acetyl-CoA biosynthetic process from pyruvate(GO:0061732) |
| 0.0 | 0.1 | GO:0032026 | response to magnesium ion(GO:0032026) |
| 0.0 | 0.3 | GO:0046827 | positive regulation of protein export from nucleus(GO:0046827) |
| 0.0 | 0.1 | GO:0019852 | L-ascorbic acid metabolic process(GO:0019852) |
| 0.0 | 0.1 | GO:0042417 | dopamine metabolic process(GO:0042417) |
| 0.0 | 0.0 | GO:0003094 | glomerular filtration(GO:0003094) |
| 0.0 | 0.5 | GO:0006968 | cellular defense response(GO:0006968) |
| 0.0 | 0.0 | GO:0045416 | positive regulation of interleukin-8 biosynthetic process(GO:0045416) |
| 0.0 | 0.1 | GO:0000060 | protein import into nucleus, translocation(GO:0000060) |
| 0.0 | 0.0 | GO:0001865 | NK T cell differentiation(GO:0001865) |
| 0.0 | 0.0 | GO:0043616 | regulation of keratinocyte proliferation(GO:0010837) keratinocyte proliferation(GO:0043616) |
| 0.0 | 0.2 | GO:0030388 | fructose 1,6-bisphosphate metabolic process(GO:0030388) |
| 0.0 | 0.1 | GO:0006107 | oxaloacetate metabolic process(GO:0006107) |
| 0.0 | 0.0 | GO:0016572 | histone phosphorylation(GO:0016572) |
| 0.0 | 0.0 | GO:0019417 | sulfur oxidation(GO:0019417) |
| 0.0 | 0.1 | GO:0034201 | response to oleic acid(GO:0034201) |
| 0.0 | 0.0 | GO:0060372 | regulation of atrial cardiac muscle cell membrane repolarization(GO:0060372) |
| 0.0 | 0.0 | GO:0021780 | spinal cord oligodendrocyte cell differentiation(GO:0021529) spinal cord oligodendrocyte cell fate specification(GO:0021530) oligodendrocyte cell fate specification(GO:0021778) oligodendrocyte cell fate commitment(GO:0021779) glial cell fate specification(GO:0021780) |
| 0.0 | 0.2 | GO:0035728 | response to hepatocyte growth factor(GO:0035728) |
| 0.0 | 0.1 | GO:2001199 | negative regulation of dendritic cell differentiation(GO:2001199) |
| 0.0 | 0.0 | GO:0099566 | regulation of postsynaptic cytosolic calcium ion concentration(GO:0099566) |
| 0.0 | 0.1 | GO:0042573 | retinoic acid metabolic process(GO:0042573) |
| 0.0 | 0.4 | GO:0042475 | odontogenesis of dentin-containing tooth(GO:0042475) |
| 0.0 | 0.1 | GO:0019934 | cGMP-mediated signaling(GO:0019934) |
| 0.0 | 0.1 | GO:0032007 | negative regulation of TOR signaling(GO:0032007) |
| 0.0 | 0.1 | GO:0019720 | Mo-molybdopterin cofactor biosynthetic process(GO:0006777) Mo-molybdopterin cofactor metabolic process(GO:0019720) |
| 0.0 | 0.1 | GO:0033005 | positive regulation of mast cell activation(GO:0033005) |
| 0.0 | 0.0 | GO:0044691 | tooth eruption(GO:0044691) |
| 0.0 | 0.1 | GO:1901186 | positive regulation of epidermal growth factor receptor signaling pathway(GO:0045742) positive regulation of ERBB signaling pathway(GO:1901186) |
| 0.0 | 0.1 | GO:0002021 | response to dietary excess(GO:0002021) |
| 0.0 | 0.1 | GO:0000821 | regulation of arginine metabolic process(GO:0000821) |
| 0.0 | 0.0 | GO:0003433 | chondrocyte development involved in endochondral bone morphogenesis(GO:0003433) |
| 0.0 | 0.1 | GO:1902018 | negative regulation of cilium assembly(GO:1902018) |
| 0.0 | 0.0 | GO:0030879 | mammary gland development(GO:0030879) |
Gene overrepresentation in cellular_component category:
| Log-likelihood per target | Total log-likelihood | Term | Description |
|---|---|---|---|
| 1.7 | 15.3 | GO:0035976 | AP1 complex(GO:0035976) |
| 1.3 | 4.0 | GO:0043512 | inhibin complex(GO:0043511) inhibin A complex(GO:0043512) |
| 0.8 | 2.5 | GO:0072563 | endothelial microparticle(GO:0072563) |
| 0.8 | 5.5 | GO:0097209 | epidermal lamellar body(GO:0097209) |
| 0.5 | 0.5 | GO:0034365 | discoidal high-density lipoprotein particle(GO:0034365) |
| 0.5 | 5.4 | GO:0005610 | laminin-5 complex(GO:0005610) |
| 0.5 | 3.4 | GO:0072558 | NLRP1 inflammasome complex(GO:0072558) |
| 0.5 | 8.5 | GO:0031089 | platelet dense granule lumen(GO:0031089) |
| 0.5 | 1.4 | GO:0071065 | alpha9-beta1 integrin-vascular cell adhesion molecule-1 complex(GO:0071065) |
| 0.4 | 2.0 | GO:1903349 | omegasome membrane(GO:1903349) |
| 0.4 | 4.4 | GO:0042612 | MHC class I protein complex(GO:0042612) |
| 0.4 | 2.0 | GO:0097169 | AIM2 inflammasome complex(GO:0097169) |
| 0.4 | 0.4 | GO:0033093 | Weibel-Palade body(GO:0033093) |
| 0.4 | 4.6 | GO:0005593 | FACIT collagen trimer(GO:0005593) |
| 0.4 | 1.8 | GO:0031417 | NatC complex(GO:0031417) |
| 0.3 | 2.6 | GO:0097442 | CA3 pyramidal cell dendrite(GO:0097442) |
| 0.3 | 0.6 | GO:0061202 | clathrin-sculpted glutamate transport vesicle(GO:0060199) clathrin-sculpted acetylcholine transport vesicle(GO:0060200) clathrin-sculpted acetylcholine transport vesicle membrane(GO:0060201) clathrin-sculpted glutamate transport vesicle membrane(GO:0060203) clathrin-sculpted gamma-aminobutyric acid transport vesicle(GO:0061200) clathrin-sculpted gamma-aminobutyric acid transport vesicle membrane(GO:0061202) |
| 0.3 | 1.0 | GO:0036117 | hyaluranon cable(GO:0036117) |
| 0.3 | 0.6 | GO:0034686 | integrin alphav-beta8 complex(GO:0034686) |
| 0.3 | 0.3 | GO:0005742 | mitochondrial outer membrane translocase complex(GO:0005742) |
| 0.3 | 1.2 | GO:0097179 | protease inhibitor complex(GO:0097179) |
| 0.3 | 2.0 | GO:0036021 | endolysosome lumen(GO:0036021) |
| 0.3 | 2.0 | GO:0042406 | extrinsic component of endoplasmic reticulum membrane(GO:0042406) |
| 0.3 | 0.8 | GO:0043260 | laminin-3 complex(GO:0005608) laminin-11 complex(GO:0043260) |
| 0.3 | 0.3 | GO:0034673 | inhibin-betaglycan-ActRII complex(GO:0034673) |
| 0.3 | 1.1 | GO:0031905 | early endosome lumen(GO:0031905) |
| 0.3 | 2.1 | GO:1990111 | spermatoproteasome complex(GO:1990111) |
| 0.3 | 1.5 | GO:0034991 | nuclear meiotic cohesin complex(GO:0034991) |
| 0.3 | 3.3 | GO:0043083 | synaptic cleft(GO:0043083) |
| 0.2 | 1.7 | GO:0030121 | AP-1 adaptor complex(GO:0030121) |
| 0.2 | 1.9 | GO:0031232 | extrinsic component of external side of plasma membrane(GO:0031232) |
| 0.2 | 1.2 | GO:0044393 | microspike(GO:0044393) |
| 0.2 | 1.2 | GO:0070435 | Shc-EGFR complex(GO:0070435) |
| 0.2 | 3.4 | GO:0005677 | chromatin silencing complex(GO:0005677) |
| 0.2 | 2.1 | GO:0031466 | Cul5-RING ubiquitin ligase complex(GO:0031466) |
| 0.2 | 0.7 | GO:0002139 | stereocilia coupling link(GO:0002139) |
| 0.2 | 0.9 | GO:0005883 | neurofilament(GO:0005883) |
| 0.2 | 1.8 | GO:0035692 | macrophage migration inhibitory factor receptor complex(GO:0035692) |
| 0.2 | 0.2 | GO:0071438 | invadopodium membrane(GO:0071438) |
| 0.2 | 7.0 | GO:0031528 | microvillus membrane(GO:0031528) |
| 0.2 | 0.9 | GO:0031933 | telomeric heterochromatin(GO:0031933) |
| 0.2 | 0.8 | GO:0071062 | alphav-beta3 integrin-vitronectin complex(GO:0071062) |
| 0.2 | 1.0 | GO:0032144 | 4-aminobutyrate transaminase complex(GO:0032144) |
| 0.2 | 0.8 | GO:0097233 | lamellar body membrane(GO:0097232) alveolar lamellar body membrane(GO:0097233) |
| 0.2 | 1.6 | GO:1990393 | 3M complex(GO:1990393) |
| 0.2 | 1.5 | GO:0005797 | Golgi medial cisterna(GO:0005797) |
| 0.2 | 1.9 | GO:0000801 | central element(GO:0000801) |
| 0.2 | 1.5 | GO:0097129 | cyclin D2-CDK4 complex(GO:0097129) |
| 0.2 | 19.2 | GO:0035580 | specific granule lumen(GO:0035580) |
| 0.2 | 3.3 | GO:0000276 | mitochondrial proton-transporting ATP synthase complex, coupling factor F(o)(GO:0000276) |
| 0.2 | 1.8 | GO:0042567 | insulin-like growth factor ternary complex(GO:0042567) |
| 0.2 | 4.5 | GO:0001527 | microfibril(GO:0001527) fibril(GO:0043205) |
| 0.2 | 12.0 | GO:0001533 | cornified envelope(GO:0001533) |
| 0.2 | 4.6 | GO:0071682 | endocytic vesicle lumen(GO:0071682) |
| 0.2 | 0.5 | GO:0070195 | growth hormone receptor complex(GO:0070195) |
| 0.2 | 0.7 | GO:0016222 | procollagen-proline 4-dioxygenase complex(GO:0016222) |
| 0.2 | 0.2 | GO:0000015 | phosphopyruvate hydratase complex(GO:0000015) |
| 0.2 | 2.3 | GO:0005577 | fibrinogen complex(GO:0005577) |
| 0.2 | 0.8 | GO:0001674 | female germ cell nucleus(GO:0001674) |
| 0.2 | 0.3 | GO:0048237 | rough endoplasmic reticulum lumen(GO:0048237) |
| 0.2 | 0.8 | GO:0036156 | inner dynein arm(GO:0036156) |
| 0.2 | 0.9 | GO:0032044 | DSIF complex(GO:0032044) |
| 0.2 | 1.7 | GO:0005785 | signal recognition particle receptor complex(GO:0005785) |
| 0.2 | 2.6 | GO:0042599 | lamellar body(GO:0042599) |
| 0.2 | 1.1 | GO:0005956 | protein kinase CK2 complex(GO:0005956) |
| 0.1 | 0.4 | GO:0098855 | HCN channel complex(GO:0098855) |
| 0.1 | 0.6 | GO:0044224 | juxtaparanode region of axon(GO:0044224) |
| 0.1 | 2.9 | GO:0043020 | NADPH oxidase complex(GO:0043020) |
| 0.1 | 3.5 | GO:0097386 | glial cell projection(GO:0097386) |
| 0.1 | 0.4 | GO:0030689 | Noc complex(GO:0030689) |
| 0.1 | 1.7 | GO:0035985 | senescence-associated heterochromatin focus(GO:0035985) |
| 0.1 | 0.7 | GO:0071458 | integral component of cytoplasmic side of endoplasmic reticulum membrane(GO:0071458) |
| 0.1 | 1.5 | GO:0031430 | M band(GO:0031430) |
| 0.1 | 0.3 | GO:0071598 | neuronal ribonucleoprotein granule(GO:0071598) |
| 0.1 | 1.4 | GO:0008074 | guanylate cyclase complex, soluble(GO:0008074) |
| 0.1 | 1.3 | GO:0061574 | ASAP complex(GO:0061574) |
| 0.1 | 0.8 | GO:0008537 | proteasome activator complex(GO:0008537) |
| 0.1 | 2.2 | GO:0030056 | hemidesmosome(GO:0030056) |
| 0.1 | 1.2 | GO:0002116 | semaphorin receptor complex(GO:0002116) |
| 0.1 | 1.1 | GO:0046696 | lipopolysaccharide receptor complex(GO:0046696) |
| 0.1 | 0.7 | GO:0031205 | endoplasmic reticulum Sec complex(GO:0031205) |
| 0.1 | 3.2 | GO:0005922 | connexon complex(GO:0005922) |
| 0.1 | 1.6 | GO:0036157 | outer dynein arm(GO:0036157) |
| 0.1 | 0.7 | GO:0031904 | endosome lumen(GO:0031904) |
| 0.1 | 1.4 | GO:0061689 | tricellular tight junction(GO:0061689) |
| 0.1 | 9.0 | GO:0030964 | mitochondrial respiratory chain complex I(GO:0005747) NADH dehydrogenase complex(GO:0030964) respiratory chain complex I(GO:0045271) |
| 0.1 | 0.9 | GO:0070695 | FHF complex(GO:0070695) |
| 0.1 | 3.6 | GO:0001891 | phagocytic cup(GO:0001891) |
| 0.1 | 0.7 | GO:0070436 | Grb2-EGFR complex(GO:0070436) |
| 0.1 | 1.7 | GO:0034663 | endoplasmic reticulum chaperone complex(GO:0034663) |
| 0.1 | 0.2 | GO:0005889 | hydrogen:potassium-exchanging ATPase complex(GO:0005889) |
| 0.1 | 1.7 | GO:0032426 | stereocilium tip(GO:0032426) |
| 0.1 | 1.5 | GO:0097136 | Bcl-2 family protein complex(GO:0097136) |
| 0.1 | 0.4 | GO:0034750 | Scrib-APC-beta-catenin complex(GO:0034750) |
| 0.1 | 0.9 | GO:0002177 | manchette(GO:0002177) |
| 0.1 | 1.1 | GO:0005964 | phosphorylase kinase complex(GO:0005964) |
| 0.1 | 0.8 | GO:0089701 | U2AF(GO:0089701) |
| 0.1 | 2.7 | GO:0071004 | U2-type prespliceosome(GO:0071004) |
| 0.1 | 0.7 | GO:0000275 | mitochondrial proton-transporting ATP synthase complex, catalytic core F(1)(GO:0000275) |
| 0.1 | 1.0 | GO:0005827 | polar microtubule(GO:0005827) |
| 0.1 | 0.3 | GO:0097057 | TRAF2-GSTP1 complex(GO:0097057) |
| 0.1 | 0.1 | GO:0020005 | symbiont-containing vacuole(GO:0020003) symbiont-containing vacuole membrane(GO:0020005) |
| 0.1 | 0.3 | GO:0036398 | TCR signalosome(GO:0036398) |
| 0.1 | 10.8 | GO:0035577 | azurophil granule membrane(GO:0035577) |
| 0.1 | 0.6 | GO:0031314 | extrinsic component of mitochondrial inner membrane(GO:0031314) |
| 0.1 | 1.8 | GO:0097512 | cardiac myofibril(GO:0097512) |
| 0.1 | 0.7 | GO:0030665 | clathrin-coated vesicle membrane(GO:0030665) |
| 0.1 | 0.6 | GO:1990131 | Gtr1-Gtr2 GTPase complex(GO:1990131) |
| 0.1 | 4.0 | GO:1904724 | tertiary granule lumen(GO:1904724) |
| 0.1 | 0.8 | GO:0097361 | CIA complex(GO:0097361) |
| 0.1 | 0.1 | GO:0044420 | extracellular matrix component(GO:0044420) |
| 0.1 | 0.8 | GO:0005579 | membrane attack complex(GO:0005579) |
| 0.1 | 1.5 | GO:0005751 | mitochondrial respiratory chain complex IV(GO:0005751) |
| 0.1 | 0.6 | GO:0000110 | nucleotide-excision repair factor 1 complex(GO:0000110) |
| 0.1 | 6.4 | GO:0045095 | keratin filament(GO:0045095) |
| 0.1 | 5.0 | GO:0009925 | basal plasma membrane(GO:0009925) |
| 0.1 | 4.7 | GO:0046658 | anchored component of plasma membrane(GO:0046658) |
| 0.1 | 11.8 | GO:0005604 | basement membrane(GO:0005604) |
| 0.1 | 0.4 | GO:0046581 | intercellular canaliculus(GO:0046581) |
| 0.1 | 0.4 | GO:0019031 | viral envelope(GO:0019031) viral membrane(GO:0036338) |
| 0.1 | 0.6 | GO:0005854 | nascent polypeptide-associated complex(GO:0005854) |
| 0.1 | 1.8 | GO:0097225 | sperm midpiece(GO:0097225) |
| 0.1 | 0.2 | GO:0005674 | transcription factor TFIIF complex(GO:0005674) |
| 0.1 | 2.0 | GO:0043186 | P granule(GO:0043186) pole plasm(GO:0045495) germ plasm(GO:0060293) |
| 0.1 | 0.4 | GO:0097486 | multivesicular body lumen(GO:0097486) |
| 0.1 | 0.8 | GO:0045275 | mitochondrial respiratory chain complex III(GO:0005750) respiratory chain complex III(GO:0045275) |
| 0.1 | 0.3 | GO:0030485 | smooth muscle contractile fiber(GO:0030485) |
| 0.1 | 1.0 | GO:0030061 | mitochondrial crista(GO:0030061) |
| 0.1 | 3.2 | GO:0045178 | basal part of cell(GO:0045178) |
| 0.1 | 0.2 | GO:0045277 | respiratory chain complex IV(GO:0045277) |
| 0.1 | 0.5 | GO:1990452 | Parkin-FBXW7-Cul1 ubiquitin ligase complex(GO:1990452) |
| 0.1 | 0.5 | GO:0071797 | LUBAC complex(GO:0071797) |
| 0.1 | 0.8 | GO:0033256 | I-kappaB/NF-kappaB complex(GO:0033256) |
| 0.1 | 0.2 | GO:0031074 | nucleocytoplasmic shuttling complex(GO:0031074) |
| 0.1 | 0.6 | GO:0014802 | terminal cisterna(GO:0014802) |
| 0.1 | 1.3 | GO:0008290 | F-actin capping protein complex(GO:0008290) |
| 0.1 | 0.6 | GO:0033010 | paranodal junction(GO:0033010) |
| 0.1 | 8.2 | GO:0035578 | azurophil granule lumen(GO:0035578) |
| 0.1 | 0.6 | GO:0005947 | mitochondrial alpha-ketoglutarate dehydrogenase complex(GO:0005947) |
| 0.1 | 8.5 | GO:0022625 | cytosolic large ribosomal subunit(GO:0022625) |
| 0.1 | 0.5 | GO:0070765 | gamma-secretase complex(GO:0070765) |
| 0.1 | 1.1 | GO:0042101 | T cell receptor complex(GO:0042101) |
| 0.1 | 0.3 | GO:0048179 | activin receptor complex(GO:0048179) |
| 0.1 | 1.3 | GO:0032059 | bleb(GO:0032059) |
| 0.1 | 0.2 | GO:0005584 | collagen type I trimer(GO:0005584) |
| 0.1 | 0.4 | GO:1990246 | uniplex complex(GO:1990246) |
| 0.1 | 0.8 | GO:0097550 | transcriptional preinitiation complex(GO:0097550) |
| 0.1 | 0.5 | GO:0000243 | commitment complex(GO:0000243) |
| 0.1 | 0.5 | GO:0043196 | varicosity(GO:0043196) |
| 0.1 | 0.7 | GO:0030314 | junctional membrane complex(GO:0030314) |
| 0.1 | 1.6 | GO:0016327 | apicolateral plasma membrane(GO:0016327) |
| 0.1 | 0.4 | GO:0070852 | cell body fiber(GO:0070852) |
| 0.1 | 1.1 | GO:0002178 | palmitoyltransferase complex(GO:0002178) |
| 0.1 | 0.9 | GO:0031092 | platelet alpha granule membrane(GO:0031092) |
| 0.1 | 0.4 | GO:0002080 | acrosomal membrane(GO:0002080) |
| 0.1 | 1.7 | GO:0042571 | immunoglobulin complex, circulating(GO:0042571) |
| 0.1 | 1.1 | GO:0060077 | inhibitory synapse(GO:0060077) |
| 0.1 | 1.2 | GO:0042611 | MHC protein complex(GO:0042611) |
| 0.1 | 0.1 | GO:0000438 | core TFIIH complex portion of holo TFIIH complex(GO:0000438) |
| 0.1 | 0.5 | GO:0070876 | SOSS complex(GO:0070876) |
| 0.1 | 0.4 | GO:0016461 | unconventional myosin complex(GO:0016461) |
| 0.1 | 0.1 | GO:0034448 | EGO complex(GO:0034448) |
| 0.1 | 0.3 | GO:0014701 | junctional sarcoplasmic reticulum membrane(GO:0014701) |
| 0.1 | 0.5 | GO:0032593 | insulin-responsive compartment(GO:0032593) |
| 0.1 | 0.4 | GO:0031045 | dense core granule(GO:0031045) |
| 0.1 | 3.2 | GO:0001772 | immunological synapse(GO:0001772) |
| 0.1 | 1.0 | GO:0000813 | ESCRT I complex(GO:0000813) |
| 0.1 | 0.6 | GO:0005688 | U6 snRNP(GO:0005688) |
| 0.1 | 0.5 | GO:0000120 | RNA polymerase I transcription factor complex(GO:0000120) |
| 0.1 | 0.7 | GO:0030478 | actin cap(GO:0030478) |
| 0.1 | 1.3 | GO:0005892 | acetylcholine-gated channel complex(GO:0005892) |
| 0.1 | 1.6 | GO:0034706 | sodium channel complex(GO:0034706) |
| 0.1 | 0.1 | GO:0036457 | keratohyalin granule(GO:0036457) |
| 0.1 | 1.7 | GO:0032420 | stereocilium(GO:0032420) |
| 0.1 | 0.5 | GO:1990907 | beta-catenin-TCF complex(GO:1990907) |
| 0.0 | 0.3 | GO:0008024 | cyclin/CDK positive transcription elongation factor complex(GO:0008024) |
| 0.0 | 0.2 | GO:0033185 | dolichol-phosphate-mannose synthase complex(GO:0033185) |
| 0.0 | 1.2 | GO:0005847 | mRNA cleavage and polyadenylation specificity factor complex(GO:0005847) |
| 0.0 | 0.4 | GO:0008282 | ATP-sensitive potassium channel complex(GO:0008282) |
| 0.0 | 0.7 | GO:0099634 | postsynaptic specialization membrane(GO:0099634) |
| 0.0 | 0.1 | GO:0044609 | DBIRD complex(GO:0044609) |
| 0.0 | 0.3 | GO:0032444 | activin responsive factor complex(GO:0032444) |
| 0.0 | 5.9 | GO:0032580 | Golgi cisterna membrane(GO:0032580) |
| 0.0 | 0.2 | GO:1990730 | VCP-NSFL1C complex(GO:1990730) |
| 0.0 | 0.2 | GO:0033179 | proton-transporting V-type ATPase, V0 domain(GO:0033179) |
| 0.0 | 5.5 | GO:0005796 | Golgi lumen(GO:0005796) |
| 0.0 | 0.2 | GO:0031085 | BLOC-3 complex(GO:0031085) |
| 0.0 | 0.2 | GO:0033596 | TSC1-TSC2 complex(GO:0033596) |
| 0.0 | 7.4 | GO:0031225 | anchored component of membrane(GO:0031225) |
| 0.0 | 0.2 | GO:0072536 | interleukin-23 receptor complex(GO:0072536) |
| 0.0 | 0.3 | GO:0097165 | nuclear stress granule(GO:0097165) |
| 0.0 | 0.1 | GO:0030895 | apolipoprotein B mRNA editing enzyme complex(GO:0030895) |
| 0.0 | 0.2 | GO:0097196 | Shu complex(GO:0097196) |
| 0.0 | 0.3 | GO:0042272 | nuclear RNA export factor complex(GO:0042272) |
| 0.0 | 0.2 | GO:0033268 | node of Ranvier(GO:0033268) |
| 0.0 | 0.2 | GO:0038039 | G-protein coupled receptor heterodimeric complex(GO:0038039) |
| 0.0 | 0.1 | GO:0001534 | radial spoke(GO:0001534) |
| 0.0 | 0.6 | GO:0033180 | proton-transporting V-type ATPase, V1 domain(GO:0033180) |
| 0.0 | 0.2 | GO:0072534 | perineuronal net(GO:0072534) |
| 0.0 | 0.5 | GO:0035686 | sperm fibrous sheath(GO:0035686) |
| 0.0 | 1.3 | GO:0043198 | dendritic shaft(GO:0043198) |
| 0.0 | 2.3 | GO:0005811 | lipid particle(GO:0005811) |
| 0.0 | 0.3 | GO:1902560 | GMP reductase complex(GO:1902560) |
| 0.0 | 0.3 | GO:0016013 | syntrophin complex(GO:0016013) |
| 0.0 | 3.7 | GO:0036126 | sperm flagellum(GO:0036126) |
| 0.0 | 0.5 | GO:0033391 | chromatoid body(GO:0033391) |
| 0.0 | 0.2 | GO:0098554 | cytoplasmic side of endoplasmic reticulum membrane(GO:0098554) |
| 0.0 | 0.5 | GO:0033162 | melanosome membrane(GO:0033162) chitosome(GO:0045009) |
| 0.0 | 0.2 | GO:1990130 | Iml1 complex(GO:1990130) |
| 0.0 | 1.2 | GO:0033202 | Ino80 complex(GO:0031011) DNA helicase complex(GO:0033202) |
| 0.0 | 0.4 | GO:0000347 | THO complex(GO:0000347) THO complex part of transcription export complex(GO:0000445) |
| 0.0 | 2.5 | GO:0031228 | intrinsic component of Golgi membrane(GO:0031228) |
| 0.0 | 0.1 | GO:0019008 | molybdopterin synthase complex(GO:0019008) |
| 0.0 | 0.4 | GO:0030057 | desmosome(GO:0030057) |
| 0.0 | 1.2 | GO:0016529 | sarcoplasmic reticulum(GO:0016529) |
| 0.0 | 0.3 | GO:0019774 | proteasome core complex, beta-subunit complex(GO:0019774) |
| 0.0 | 0.6 | GO:0030008 | TRAPP complex(GO:0030008) |
| 0.0 | 0.1 | GO:0002945 | cyclin K-CDK12 complex(GO:0002944) cyclin K-CDK13 complex(GO:0002945) |
| 0.0 | 0.3 | GO:0071953 | elastic fiber(GO:0071953) |
| 0.0 | 0.3 | GO:0000974 | Prp19 complex(GO:0000974) |
| 0.0 | 2.7 | GO:0008328 | ionotropic glutamate receptor complex(GO:0008328) neurotransmitter receptor complex(GO:0098878) |
| 0.0 | 0.4 | GO:0036056 | filtration diaphragm(GO:0036056) slit diaphragm(GO:0036057) |
| 0.0 | 0.1 | GO:0032002 | interleukin-28 receptor complex(GO:0032002) |
| 0.0 | 0.2 | GO:0005766 | primary lysosome(GO:0005766) azurophil granule(GO:0042582) |
| 0.0 | 0.5 | GO:0043203 | axon hillock(GO:0043203) |
| 0.0 | 0.4 | GO:0071818 | BAT3 complex(GO:0071818) ER membrane insertion complex(GO:0072379) |
| 0.0 | 1.0 | GO:0097381 | photoreceptor disc membrane(GO:0097381) |
| 0.0 | 0.2 | GO:0031428 | box C/D snoRNP complex(GO:0031428) |
| 0.0 | 0.1 | GO:0070032 | synaptobrevin 2-SNAP-25-syntaxin-1a-complexin I complex(GO:0070032) |
| 0.0 | 0.1 | GO:0044194 | cytolytic granule(GO:0044194) |
| 0.0 | 0.1 | GO:0097038 | perinuclear endoplasmic reticulum(GO:0097038) |
| 0.0 | 1.2 | GO:0000421 | autophagosome membrane(GO:0000421) |
| 0.0 | 1.8 | GO:0005882 | intermediate filament(GO:0005882) |
| 0.0 | 0.4 | GO:0044300 | cerebellar mossy fiber(GO:0044300) |
| 0.0 | 0.6 | GO:0070469 | respiratory chain(GO:0070469) |
| 0.0 | 0.4 | GO:0035859 | Seh1-associated complex(GO:0035859) GATOR2 complex(GO:0061700) |
| 0.0 | 0.3 | GO:0072669 | tRNA-splicing ligase complex(GO:0072669) |
| 0.0 | 46.0 | GO:0005615 | extracellular space(GO:0005615) |
| 0.0 | 2.5 | GO:0005581 | collagen trimer(GO:0005581) |
| 0.0 | 0.4 | GO:0005642 | annulate lamellae(GO:0005642) |
| 0.0 | 0.1 | GO:0000137 | Golgi cis cisterna(GO:0000137) |
| 0.0 | 2.4 | GO:0030672 | synaptic vesicle membrane(GO:0030672) exocytic vesicle membrane(GO:0099501) |
| 0.0 | 0.2 | GO:0012510 | trans-Golgi network transport vesicle membrane(GO:0012510) |
| 0.0 | 0.3 | GO:0098560 | cytoplasmic side of late endosome membrane(GO:0098560) |
| 0.0 | 0.1 | GO:0070821 | tertiary granule membrane(GO:0070821) |
| 0.0 | 5.2 | GO:0055037 | recycling endosome(GO:0055037) |
| 0.0 | 2.3 | GO:0034707 | chloride channel complex(GO:0034707) |
| 0.0 | 0.1 | GO:0002079 | inner acrosomal membrane(GO:0002079) |
| 0.0 | 0.1 | GO:0016471 | vacuolar proton-transporting V-type ATPase complex(GO:0016471) |
| 0.0 | 3.3 | GO:0030175 | filopodium(GO:0030175) |
| 0.0 | 0.1 | GO:0005879 | axonemal microtubule(GO:0005879) |
| 0.0 | 0.3 | GO:0031941 | filamentous actin(GO:0031941) |
| 0.0 | 0.1 | GO:0005858 | axonemal dynein complex(GO:0005858) |
| 0.0 | 0.1 | GO:0033011 | perinuclear theca(GO:0033011) |
| 0.0 | 0.1 | GO:0097425 | smooth endoplasmic reticulum membrane(GO:0030868) smooth endoplasmic reticulum part(GO:0097425) |
| 0.0 | 0.1 | GO:0031372 | UBC13-MMS2 complex(GO:0031372) |
| 0.0 | 0.3 | GO:0031931 | TORC1 complex(GO:0031931) |
| 0.0 | 0.1 | GO:0010370 | perinucleolar chromocenter(GO:0010370) |
| 0.0 | 0.2 | GO:0097025 | MPP7-DLG1-LIN7 complex(GO:0097025) |
| 0.0 | 0.1 | GO:0030289 | protein phosphatase 4 complex(GO:0030289) |
| 0.0 | 0.1 | GO:0000229 | cytoplasmic chromosome(GO:0000229) |
| 0.0 | 0.2 | GO:0031414 | N-terminal protein acetyltransferase complex(GO:0031414) |
| 0.0 | 0.4 | GO:0005890 | sodium:potassium-exchanging ATPase complex(GO:0005890) |
| 0.0 | 0.1 | GO:1990716 | axonemal central apparatus(GO:1990716) |
| 0.0 | 0.2 | GO:0016589 | NURF complex(GO:0016589) |
| 0.0 | 0.9 | GO:0001669 | acrosomal vesicle(GO:0001669) |
| 0.0 | 0.2 | GO:0043202 | lysosomal lumen(GO:0043202) |
| 0.0 | 0.2 | GO:0035068 | micro-ribonucleoprotein complex(GO:0035068) |
| 0.0 | 0.2 | GO:0005869 | dynactin complex(GO:0005869) |
| 0.0 | 0.1 | GO:0019773 | proteasome core complex, alpha-subunit complex(GO:0019773) |
| 0.0 | 0.0 | GO:0016533 | cyclin-dependent protein kinase 5 holoenzyme complex(GO:0016533) |
| 0.0 | 0.4 | GO:0070971 | endoplasmic reticulum exit site(GO:0070971) |
| 0.0 | 0.0 | GO:1990726 | Lsm1-7-Pat1 complex(GO:1990726) |
| 0.0 | 1.2 | GO:0032588 | trans-Golgi network membrane(GO:0032588) |
| 0.0 | 0.1 | GO:0001740 | Barr body(GO:0001740) |
| 0.0 | 0.1 | GO:0005753 | mitochondrial proton-transporting ATP synthase complex(GO:0005753) |
| 0.0 | 0.4 | GO:0005859 | muscle myosin complex(GO:0005859) |
| 0.0 | 0.2 | GO:1990454 | L-type voltage-gated calcium channel complex(GO:1990454) |
| 0.0 | 1.3 | GO:0042734 | presynaptic membrane(GO:0042734) |
| 0.0 | 0.2 | GO:0072546 | ER membrane protein complex(GO:0072546) |
| 0.0 | 0.2 | GO:0042622 | photoreceptor outer segment membrane(GO:0042622) |
| 0.0 | 0.2 | GO:0005791 | rough endoplasmic reticulum(GO:0005791) |
| 0.0 | 0.1 | GO:0042824 | MHC class I peptide loading complex(GO:0042824) TAP complex(GO:0042825) |
| 0.0 | 0.1 | GO:0005899 | insulin receptor complex(GO:0005899) |
| 0.0 | 0.4 | GO:0008180 | COP9 signalosome(GO:0008180) |
| 0.0 | 67.8 | GO:0031224 | intrinsic component of membrane(GO:0031224) |
| 0.0 | 0.0 | GO:0005965 | protein farnesyltransferase complex(GO:0005965) |
Gene overrepresentation in molecular_function category:
| Log-likelihood per target | Total log-likelihood | Term | Description |
|---|---|---|---|
| 1.8 | 5.3 | GO:0004947 | bradykinin receptor activity(GO:0004947) |
| 1.8 | 5.3 | GO:0003845 | 11-beta-hydroxysteroid dehydrogenase [NAD(P)] activity(GO:0003845) |
| 1.3 | 3.8 | GO:0031731 | CCR6 chemokine receptor binding(GO:0031731) |
| 1.2 | 4.9 | GO:0015227 | acyl carnitine transmembrane transporter activity(GO:0015227) |
| 1.0 | 1.0 | GO:0004800 | thyroxine 5'-deiodinase activity(GO:0004800) |
| 1.0 | 4.0 | GO:0001632 | leukotriene B4 receptor activity(GO:0001632) |
| 0.9 | 4.7 | GO:0004782 | sulfinoalanine decarboxylase activity(GO:0004782) |
| 0.9 | 2.7 | GO:0036313 | phosphatidylinositol 3-kinase catalytic subunit binding(GO:0036313) |
| 0.9 | 3.5 | GO:0004356 | glutamate-ammonia ligase activity(GO:0004356) ammonia ligase activity(GO:0016211) acid-ammonia (or amide) ligase activity(GO:0016880) |
| 0.9 | 6.0 | GO:0005134 | interleukin-2 receptor binding(GO:0005134) |
| 0.7 | 2.2 | GO:0005150 | interleukin-1, Type I receptor binding(GO:0005150) |
| 0.7 | 2.1 | GO:0016401 | palmitoyl-CoA oxidase activity(GO:0016401) |
| 0.7 | 2.0 | GO:0046970 | NAD-dependent histone deacetylase activity (H4-K16 specific)(GO:0046970) |
| 0.7 | 4.0 | GO:0070699 | type II activin receptor binding(GO:0070699) |
| 0.7 | 2.0 | GO:0004794 | L-threonine ammonia-lyase activity(GO:0004794) |
| 0.6 | 2.6 | GO:0008431 | vitamin E binding(GO:0008431) |
| 0.6 | 1.7 | GO:0004939 | beta-adrenergic receptor activity(GO:0004939) |
| 0.6 | 1.7 | GO:0102007 | lactonohydrolase activity(GO:0046573) acyl-L-homoserine-lactone lactonohydrolase activity(GO:0102007) |
| 0.6 | 4.5 | GO:0005534 | galactose binding(GO:0005534) |
| 0.6 | 1.7 | GO:0008330 | protein tyrosine/threonine phosphatase activity(GO:0008330) |
| 0.5 | 2.1 | GO:0004047 | aminomethyltransferase activity(GO:0004047) |
| 0.5 | 1.5 | GO:0008160 | protein tyrosine phosphatase activator activity(GO:0008160) |
| 0.5 | 2.0 | GO:0008453 | alanine-glyoxylate transaminase activity(GO:0008453) |
| 0.4 | 1.3 | GO:0015091 | ferric iron transmembrane transporter activity(GO:0015091) trivalent inorganic cation transmembrane transporter activity(GO:0072510) |
| 0.4 | 1.7 | GO:0047066 | phospholipid-hydroperoxide glutathione peroxidase activity(GO:0047066) |
| 0.4 | 1.3 | GO:0070506 | high-density lipoprotein particle receptor activity(GO:0070506) |
| 0.4 | 3.0 | GO:0047894 | flavonol 3-sulfotransferase activity(GO:0047894) |
| 0.4 | 2.9 | GO:1990254 | keratin filament binding(GO:1990254) |
| 0.4 | 6.2 | GO:0038062 | protein tyrosine kinase collagen receptor activity(GO:0038062) |
| 0.4 | 1.2 | GO:0052857 | NADHX epimerase activity(GO:0052856) NADPHX epimerase activity(GO:0052857) |
| 0.4 | 1.6 | GO:0016165 | linoleate 13S-lipoxygenase activity(GO:0016165) |
| 0.4 | 3.5 | GO:0070891 | lipoteichoic acid binding(GO:0070891) |
| 0.4 | 1.9 | GO:0018685 | alkane 1-monooxygenase activity(GO:0018685) |
| 0.4 | 1.9 | GO:0070736 | protein-glycine ligase activity, initiating(GO:0070736) |
| 0.4 | 1.5 | GO:1902122 | chenodeoxycholic acid binding(GO:1902122) |
| 0.4 | 2.2 | GO:0008113 | peptide-methionine (S)-S-oxide reductase activity(GO:0008113) |
| 0.4 | 1.4 | GO:0047888 | fatty acid peroxidase activity(GO:0047888) |
| 0.4 | 5.0 | GO:0004022 | alcohol dehydrogenase (NAD) activity(GO:0004022) |
| 0.4 | 2.5 | GO:0008481 | sphinganine kinase activity(GO:0008481) D-erythro-sphingosine kinase activity(GO:0017050) |
| 0.4 | 2.8 | GO:0042289 | MHC class II protein binding(GO:0042289) |
| 0.3 | 1.0 | GO:0030272 | 5-formyltetrahydrofolate cyclo-ligase activity(GO:0030272) |
| 0.3 | 1.0 | GO:0004618 | phosphoglycerate kinase activity(GO:0004618) |
| 0.3 | 2.8 | GO:0004126 | cytidine deaminase activity(GO:0004126) |
| 0.3 | 3.1 | GO:0004499 | N,N-dimethylaniline monooxygenase activity(GO:0004499) |
| 0.3 | 6.1 | GO:0036312 | phosphatidylinositol 3-kinase regulatory subunit binding(GO:0036312) |
| 0.3 | 0.7 | GO:0046969 | histone deacetylase activity (H3-K9 specific)(GO:0032129) NAD-dependent histone deacetylase activity (H3-K9 specific)(GO:0046969) |
| 0.3 | 1.7 | GO:0060961 | phospholipase D inhibitor activity(GO:0060961) |
| 0.3 | 6.3 | GO:0019841 | retinol binding(GO:0019841) |
| 0.3 | 1.0 | GO:0004416 | hydroxyacylglutathione hydrolase activity(GO:0004416) |
| 0.3 | 1.9 | GO:0019828 | aspartic-type endopeptidase inhibitor activity(GO:0019828) |
| 0.3 | 0.9 | GO:0005152 | interleukin-1 receptor antagonist activity(GO:0005152) |
| 0.3 | 1.5 | GO:0015563 | uptake transmembrane transporter activity(GO:0015563) |
| 0.3 | 1.5 | GO:0015254 | glycerol channel activity(GO:0015254) |
| 0.3 | 2.0 | GO:0004447 | iodide peroxidase activity(GO:0004447) |
| 0.3 | 0.9 | GO:0032093 | SAM domain binding(GO:0032093) |
| 0.3 | 1.2 | GO:0051431 | corticotropin-releasing hormone receptor 2 binding(GO:0051431) |
| 0.3 | 1.2 | GO:0017095 | heparan sulfate 6-O-sulfotransferase activity(GO:0017095) |
| 0.3 | 2.0 | GO:0035662 | Toll-like receptor 4 binding(GO:0035662) |
| 0.3 | 0.8 | GO:0043849 | Ras palmitoyltransferase activity(GO:0043849) |
| 0.3 | 1.9 | GO:0046979 | TAP2 binding(GO:0046979) |
| 0.3 | 1.7 | GO:0043262 | adenosine-diphosphatase activity(GO:0043262) |
| 0.3 | 1.6 | GO:0015307 | drug:proton antiporter activity(GO:0015307) |
| 0.3 | 1.1 | GO:0035650 | AP-1 adaptor complex binding(GO:0035650) |
| 0.3 | 1.1 | GO:0008260 | 3-oxoacid CoA-transferase activity(GO:0008260) CoA-transferase activity(GO:0008410) |
| 0.3 | 1.1 | GO:0046538 | bisphosphoglycerate mutase activity(GO:0004082) phosphoglycerate mutase activity(GO:0004619) 2,3-bisphosphoglycerate-dependent phosphoglycerate mutase activity(GO:0046538) |
| 0.3 | 0.5 | GO:0047977 | hepoxilin-epoxide hydrolase activity(GO:0047977) |
| 0.3 | 2.9 | GO:0031995 | insulin-like growth factor II binding(GO:0031995) |
| 0.3 | 0.8 | GO:0016503 | pheromone receptor activity(GO:0016503) |
| 0.3 | 0.3 | GO:0003943 | N-acetylgalactosamine-4-sulfatase activity(GO:0003943) |
| 0.3 | 1.0 | GO:0070326 | very-low-density lipoprotein particle receptor binding(GO:0070326) |
| 0.2 | 3.4 | GO:0070700 | BMP receptor binding(GO:0070700) |
| 0.2 | 1.0 | GO:0045118 | azole transporter activity(GO:0045118) |
| 0.2 | 1.2 | GO:0052798 | beta-galactoside alpha-2,3-sialyltransferase activity(GO:0052798) |
| 0.2 | 1.4 | GO:0016672 | oxidoreductase activity, acting on a sulfur group of donors, quinone or similar compound as acceptor(GO:0016672) glutathione dehydrogenase (ascorbate) activity(GO:0045174) methylarsonate reductase activity(GO:0050610) |
| 0.2 | 0.7 | GO:0038181 | bile acid receptor activity(GO:0038181) |
| 0.2 | 0.7 | GO:0097158 | pre-mRNA intronic pyrimidine-rich binding(GO:0097158) |
| 0.2 | 0.7 | GO:0030984 | kininogen binding(GO:0030984) |
| 0.2 | 0.9 | GO:0000033 | alpha-1,3-mannosyltransferase activity(GO:0000033) |
| 0.2 | 2.0 | GO:0030881 | beta-2-microglobulin binding(GO:0030881) |
| 0.2 | 1.5 | GO:0005353 | fructose transmembrane transporter activity(GO:0005353) |
| 0.2 | 2.2 | GO:0016842 | amidine-lyase activity(GO:0016842) |
| 0.2 | 0.9 | GO:0003839 | gamma-glutamylcyclotransferase activity(GO:0003839) |
| 0.2 | 1.3 | GO:0030171 | voltage-gated proton channel activity(GO:0030171) |
| 0.2 | 2.0 | GO:0016679 | oxidoreductase activity, acting on diphenols and related substances as donors(GO:0016679) |
| 0.2 | 4.9 | GO:0004861 | cyclin-dependent protein serine/threonine kinase inhibitor activity(GO:0004861) |
| 0.2 | 0.4 | GO:0019912 | cyclin-dependent protein kinase activating kinase activity(GO:0019912) |
| 0.2 | 1.3 | GO:0015252 | hydrogen ion channel activity(GO:0015252) |
| 0.2 | 1.1 | GO:0005222 | intracellular cAMP activated cation channel activity(GO:0005222) |
| 0.2 | 0.6 | GO:0004807 | triose-phosphate isomerase activity(GO:0004807) |
| 0.2 | 1.9 | GO:0004873 | asialoglycoprotein receptor activity(GO:0004873) |
| 0.2 | 0.6 | GO:1990430 | extracellular matrix protein binding(GO:1990430) |
| 0.2 | 1.0 | GO:0047374 | methylumbelliferyl-acetate deacetylase activity(GO:0047374) |
| 0.2 | 0.2 | GO:0034739 | histone deacetylase activity (H4-K16 specific)(GO:0034739) |
| 0.2 | 0.6 | GO:0008332 | low voltage-gated calcium channel activity(GO:0008332) |
| 0.2 | 0.6 | GO:0019150 | D-ribulokinase activity(GO:0019150) |
| 0.2 | 0.4 | GO:0004886 | 9-cis retinoic acid receptor activity(GO:0004886) |
| 0.2 | 1.0 | GO:0032145 | 4-aminobutyrate transaminase activity(GO:0003867) succinate-semialdehyde dehydrogenase binding(GO:0032145) (S)-3-amino-2-methylpropionate transaminase activity(GO:0047298) |
| 0.2 | 0.8 | GO:0004310 | farnesyl-diphosphate farnesyltransferase activity(GO:0004310) squalene synthase activity(GO:0051996) |
| 0.2 | 0.6 | GO:0002113 | interleukin-33 binding(GO:0002113) |
| 0.2 | 0.8 | GO:0031728 | CCR3 chemokine receptor binding(GO:0031728) |
| 0.2 | 3.7 | GO:0031702 | type 1 angiotensin receptor binding(GO:0031702) |
| 0.2 | 0.2 | GO:0047631 | ADP-ribose diphosphatase activity(GO:0047631) |
| 0.2 | 0.6 | GO:0015439 | heme-transporting ATPase activity(GO:0015439) |
| 0.2 | 0.8 | GO:0034188 | apolipoprotein A-I receptor activity(GO:0034188) phosphatidylserine-translocating ATPase activity(GO:0090556) |
| 0.2 | 1.9 | GO:0045545 | syndecan binding(GO:0045545) |
| 0.2 | 3.6 | GO:0015280 | ligand-gated sodium channel activity(GO:0015280) |
| 0.2 | 2.2 | GO:0005007 | fibroblast growth factor-activated receptor activity(GO:0005007) |
| 0.2 | 2.4 | GO:0019869 | chloride channel inhibitor activity(GO:0019869) |
| 0.2 | 0.5 | GO:0004611 | phosphoenolpyruvate carboxykinase activity(GO:0004611) phosphoenolpyruvate carboxykinase (GTP) activity(GO:0004613) |
| 0.2 | 0.7 | GO:0004667 | prostaglandin-D synthase activity(GO:0004667) |
| 0.2 | 1.1 | GO:0003998 | acylphosphatase activity(GO:0003998) |
| 0.2 | 0.7 | GO:0061714 | folic acid receptor activity(GO:0061714) |
| 0.2 | 0.5 | GO:0004731 | purine-nucleoside phosphorylase activity(GO:0004731) |
| 0.2 | 0.7 | GO:0047223 | beta-1,3-galactosyl-O-glycosyl-glycoprotein beta-1,3-N-acetylglucosaminyltransferase activity(GO:0047223) |
| 0.2 | 0.9 | GO:0017099 | very-long-chain-acyl-CoA dehydrogenase activity(GO:0017099) |
| 0.2 | 0.5 | GO:0004828 | serine-tRNA ligase activity(GO:0004828) |
| 0.2 | 0.7 | GO:0004657 | proline dehydrogenase activity(GO:0004657) |
| 0.2 | 4.3 | GO:0050700 | CARD domain binding(GO:0050700) |
| 0.2 | 0.7 | GO:0050698 | proteoglycan sulfotransferase activity(GO:0050698) |
| 0.2 | 2.2 | GO:0015250 | water channel activity(GO:0015250) |
| 0.2 | 0.5 | GO:0004980 | melanocyte-stimulating hormone receptor activity(GO:0004980) |
| 0.2 | 0.5 | GO:0051379 | epinephrine binding(GO:0051379) |
| 0.2 | 1.7 | GO:0004839 | ubiquitin activating enzyme activity(GO:0004839) |
| 0.2 | 3.0 | GO:0004089 | carbonate dehydratase activity(GO:0004089) |
| 0.2 | 1.5 | GO:0003827 | alpha-1,3-mannosylglycoprotein 2-beta-N-acetylglucosaminyltransferase activity(GO:0003827) |
| 0.2 | 4.1 | GO:0004065 | arylsulfatase activity(GO:0004065) |
| 0.2 | 0.5 | GO:0034353 | RNA pyrophosphohydrolase activity(GO:0034353) |
| 0.2 | 0.5 | GO:0061752 | telomeric repeat-containing RNA binding(GO:0061752) |
| 0.2 | 0.6 | GO:0003858 | 3-hydroxybutyrate dehydrogenase activity(GO:0003858) |
| 0.2 | 0.5 | GO:0016670 | oxidoreductase activity, acting on a sulfur group of donors, oxygen as acceptor(GO:0016670) |
| 0.2 | 1.9 | GO:0036122 | BMP binding(GO:0036122) |
| 0.2 | 0.6 | GO:1990175 | EH domain binding(GO:1990175) |
| 0.2 | 0.5 | GO:0005055 | laminin receptor activity(GO:0005055) |
| 0.2 | 13.4 | GO:0001102 | RNA polymerase II activating transcription factor binding(GO:0001102) |
| 0.2 | 1.4 | GO:0008467 | [heparan sulfate]-glucosamine 3-sulfotransferase 1 activity(GO:0008467) |
| 0.2 | 1.7 | GO:0016909 | JUN kinase activity(GO:0004705) SAP kinase activity(GO:0016909) |
| 0.1 | 2.2 | GO:0033038 | bitter taste receptor activity(GO:0033038) |
| 0.1 | 0.3 | GO:0035033 | histone deacetylase regulator activity(GO:0035033) |
| 0.1 | 0.3 | GO:0005375 | copper ion transmembrane transporter activity(GO:0005375) |
| 0.1 | 1.5 | GO:0030020 | extracellular matrix structural constituent conferring tensile strength(GO:0030020) |
| 0.1 | 2.3 | GO:0003707 | steroid hormone receptor activity(GO:0003707) |
| 0.1 | 1.3 | GO:0019798 | procollagen-proline 4-dioxygenase activity(GO:0004656) procollagen-proline dioxygenase activity(GO:0019798) |
| 0.1 | 0.4 | GO:0034186 | apolipoprotein A-I binding(GO:0034186) |
| 0.1 | 1.0 | GO:0008508 | bile acid:sodium symporter activity(GO:0008508) |
| 0.1 | 0.6 | GO:0004449 | isocitrate dehydrogenase (NAD+) activity(GO:0004449) |
| 0.1 | 3.3 | GO:0004185 | serine-type carboxypeptidase activity(GO:0004185) |
| 0.1 | 0.9 | GO:0051032 | nucleic acid transmembrane transporter activity(GO:0051032) RNA transmembrane transporter activity(GO:0051033) |
| 0.1 | 1.0 | GO:0047045 | testosterone 17-beta-dehydrogenase (NADP+) activity(GO:0047045) |
| 0.1 | 0.4 | GO:0008859 | exoribonuclease II activity(GO:0008859) |
| 0.1 | 0.7 | GO:0022897 | peptide:proton symporter activity(GO:0015333) proton-dependent peptide secondary active transmembrane transporter activity(GO:0022897) |
| 0.1 | 0.4 | GO:0047150 | betaine-homocysteine S-methyltransferase activity(GO:0047150) |
| 0.1 | 0.4 | GO:0070984 | SET domain binding(GO:0070984) |
| 0.1 | 1.5 | GO:0046703 | natural killer cell lectin-like receptor binding(GO:0046703) |
| 0.1 | 0.1 | GO:0004368 | glycerol-3-phosphate dehydrogenase activity(GO:0004368) oxidoreductase activity, acting on the CH-OH group of donors, quinone or similar compound as acceptor(GO:0016901) |
| 0.1 | 0.4 | GO:0033878 | hormone-sensitive lipase activity(GO:0033878) |
| 0.1 | 0.8 | GO:0046624 | sphingolipid transporter activity(GO:0046624) |
| 0.1 | 5.4 | GO:0008009 | chemokine activity(GO:0008009) |
| 0.1 | 2.5 | GO:0008391 | arachidonic acid monooxygenase activity(GO:0008391) arachidonic acid epoxygenase activity(GO:0008392) |
| 0.1 | 0.5 | GO:0060422 | peptidyl-dipeptidase inhibitor activity(GO:0060422) |
| 0.1 | 0.4 | GO:0004968 | gonadotropin-releasing hormone receptor activity(GO:0004968) |
| 0.1 | 0.7 | GO:0031849 | olfactory receptor binding(GO:0031849) |
| 0.1 | 2.7 | GO:0005149 | interleukin-1 receptor binding(GO:0005149) |
| 0.1 | 0.9 | GO:0047820 | D-glutamate cyclase activity(GO:0047820) |
| 0.1 | 0.5 | GO:0003976 | UDP-N-acetylglucosamine-lysosomal-enzyme N-acetylglucosaminephosphotransferase activity(GO:0003976) |
| 0.1 | 0.5 | GO:0008670 | 2,4-dienoyl-CoA reductase (NADPH) activity(GO:0008670) |
| 0.1 | 0.5 | GO:0002054 | nucleobase binding(GO:0002054) |
| 0.1 | 0.4 | GO:0003842 | 1-pyrroline-5-carboxylate dehydrogenase activity(GO:0003842) |
| 0.1 | 2.1 | GO:0017017 | MAP kinase tyrosine/serine/threonine phosphatase activity(GO:0017017) |
| 0.1 | 3.2 | GO:0015643 | toxic substance binding(GO:0015643) |
| 0.1 | 0.7 | GO:0016971 | flavin-linked sulfhydryl oxidase activity(GO:0016971) |
| 0.1 | 0.8 | GO:0034711 | inhibin binding(GO:0034711) |
| 0.1 | 4.5 | GO:0003841 | 1-acylglycerol-3-phosphate O-acyltransferase activity(GO:0003841) |
| 0.1 | 0.3 | GO:0043199 | sulfate binding(GO:0043199) |
| 0.1 | 0.7 | GO:0000702 | oxidized base lesion DNA N-glycosylase activity(GO:0000702) |
| 0.1 | 0.5 | GO:0005046 | KDEL sequence binding(GO:0005046) |
| 0.1 | 0.6 | GO:0052812 | phosphatidylinositol-3,4-bisphosphate 5-kinase activity(GO:0052812) |
| 0.1 | 0.1 | GO:0015111 | iodide transmembrane transporter activity(GO:0015111) |
| 0.1 | 0.3 | GO:0004917 | interleukin-7 receptor activity(GO:0004917) |
| 0.1 | 1.4 | GO:1901702 | urate transmembrane transporter activity(GO:0015143) salt transmembrane transporter activity(GO:1901702) |
| 0.1 | 18.6 | GO:0004867 | serine-type endopeptidase inhibitor activity(GO:0004867) |
| 0.1 | 1.3 | GO:0015501 | glutamate:sodium symporter activity(GO:0015501) |
| 0.1 | 0.4 | GO:0004739 | pyruvate dehydrogenase (acetyl-transferring) activity(GO:0004739) |
| 0.1 | 1.5 | GO:0005172 | vascular endothelial growth factor receptor binding(GO:0005172) |
| 0.1 | 4.2 | GO:0031489 | myosin V binding(GO:0031489) |
| 0.1 | 0.9 | GO:0001875 | lipopolysaccharide receptor activity(GO:0001875) |
| 0.1 | 0.7 | GO:0004167 | dopachrome isomerase activity(GO:0004167) |
| 0.1 | 1.8 | GO:0046870 | cadmium ion binding(GO:0046870) |
| 0.1 | 1.7 | GO:0004415 | hyalurononglucosaminidase activity(GO:0004415) |
| 0.1 | 1.4 | GO:0005094 | Rho GDP-dissociation inhibitor activity(GO:0005094) |
| 0.1 | 1.3 | GO:0070573 | metallodipeptidase activity(GO:0070573) |
| 0.1 | 2.5 | GO:0030215 | semaphorin receptor binding(GO:0030215) |
| 0.1 | 0.5 | GO:0008131 | primary amine oxidase activity(GO:0008131) |
| 0.1 | 0.4 | GO:0070283 | lipoate synthase activity(GO:0016992) radical SAM enzyme activity(GO:0070283) |
| 0.1 | 2.0 | GO:0017110 | nucleoside-diphosphatase activity(GO:0017110) |
| 0.1 | 0.7 | GO:0008172 | S-methyltransferase activity(GO:0008172) |
| 0.1 | 0.1 | GO:0004031 | aldehyde oxidase activity(GO:0004031) |
| 0.1 | 4.8 | GO:0004653 | polypeptide N-acetylgalactosaminyltransferase activity(GO:0004653) |
| 0.1 | 0.7 | GO:0042500 | aspartic endopeptidase activity, intramembrane cleaving(GO:0042500) |
| 0.1 | 0.3 | GO:0004145 | diamine N-acetyltransferase activity(GO:0004145) |
| 0.1 | 0.3 | GO:0098599 | palmitoyl-(protein) hydrolase activity(GO:0008474) palmitoyl hydrolase activity(GO:0098599) |
| 0.1 | 0.5 | GO:0050833 | pyruvate transmembrane transporter activity(GO:0050833) |
| 0.1 | 0.5 | GO:0004392 | heme oxygenase (decyclizing) activity(GO:0004392) |
| 0.1 | 0.3 | GO:0031862 | prostanoid receptor binding(GO:0031862) |
| 0.1 | 0.8 | GO:0047288 | monosialoganglioside sialyltransferase activity(GO:0047288) |
| 0.1 | 2.6 | GO:0016505 | peptidase activator activity involved in apoptotic process(GO:0016505) |
| 0.1 | 2.3 | GO:0001530 | lipopolysaccharide binding(GO:0001530) |
| 0.1 | 1.4 | GO:0005005 | transmembrane-ephrin receptor activity(GO:0005005) |
| 0.1 | 0.3 | GO:0008427 | calcium-dependent protein kinase inhibitor activity(GO:0008427) |
| 0.1 | 1.7 | GO:0016174 | NAD(P)H oxidase activity(GO:0016174) |
| 0.1 | 5.6 | GO:0000978 | RNA polymerase II core promoter proximal region sequence-specific DNA binding(GO:0000978) |
| 0.1 | 0.9 | GO:0004758 | serine C-palmitoyltransferase activity(GO:0004758) C-palmitoyltransferase activity(GO:0016454) |
| 0.1 | 0.3 | GO:0047391 | alkylglycerophosphoethanolamine phosphodiesterase activity(GO:0047391) |
| 0.1 | 0.4 | GO:0042954 | lipoprotein transporter activity(GO:0042954) |
| 0.1 | 2.2 | GO:0008499 | UDP-galactose:beta-N-acetylglucosamine beta-1,3-galactosyltransferase activity(GO:0008499) |
| 0.1 | 0.6 | GO:0097603 | temperature-gated ion channel activity(GO:0097603) |
| 0.1 | 5.2 | GO:0004364 | glutathione transferase activity(GO:0004364) |
| 0.1 | 0.6 | GO:0005011 | macrophage colony-stimulating factor receptor activity(GO:0005011) |
| 0.1 | 4.0 | GO:0043394 | proteoglycan binding(GO:0043394) |
| 0.1 | 1.4 | GO:0015129 | lactate transmembrane transporter activity(GO:0015129) |
| 0.1 | 0.3 | GO:0072544 | L-DOPA receptor activity(GO:0035643) L-DOPA binding(GO:0072544) |
| 0.1 | 1.6 | GO:0008191 | metalloendopeptidase inhibitor activity(GO:0008191) |
| 0.1 | 4.2 | GO:0042056 | chemoattractant activity(GO:0042056) |
| 0.1 | 0.3 | GO:0005277 | acetylcholine transmembrane transporter activity(GO:0005277) acetate ester transmembrane transporter activity(GO:1901375) |
| 0.1 | 6.9 | GO:0008137 | NADH dehydrogenase (ubiquinone) activity(GO:0008137) NADH dehydrogenase (quinone) activity(GO:0050136) |
| 0.1 | 1.0 | GO:0034235 | GPI anchor binding(GO:0034235) |
| 0.1 | 0.2 | GO:0001716 | L-amino-acid oxidase activity(GO:0001716) |
| 0.1 | 0.1 | GO:0019826 | oxygen sensor activity(GO:0019826) |
| 0.1 | 1.1 | GO:0004689 | phosphorylase kinase activity(GO:0004689) |
| 0.1 | 0.4 | GO:0097363 | protein O-GlcNAc transferase activity(GO:0097363) |
| 0.1 | 3.4 | GO:0051428 | peptide hormone receptor binding(GO:0051428) |
| 0.1 | 0.7 | GO:0003954 | NADH dehydrogenase activity(GO:0003954) |
| 0.1 | 1.5 | GO:1990459 | transferrin receptor binding(GO:1990459) |
| 0.1 | 0.6 | GO:0017060 | 3-galactosyl-N-acetylglucosaminide 4-alpha-L-fucosyltransferase activity(GO:0017060) |
| 0.1 | 1.9 | GO:0036374 | glutathione hydrolase activity(GO:0036374) |
| 0.1 | 3.2 | GO:0042165 | neurotransmitter binding(GO:0042165) |
| 0.1 | 2.1 | GO:0022841 | potassium ion leak channel activity(GO:0022841) |
| 0.1 | 29.2 | GO:0004252 | serine-type endopeptidase activity(GO:0004252) |
| 0.1 | 0.7 | GO:0030377 | urokinase plasminogen activator receptor activity(GO:0030377) |
| 0.1 | 0.6 | GO:0008158 | hedgehog receptor activity(GO:0008158) |
| 0.1 | 0.7 | GO:0052851 | cupric reductase activity(GO:0008823) ferric-chelate reductase (NADPH) activity(GO:0052851) |
| 0.1 | 0.6 | GO:0005166 | neurotrophin p75 receptor binding(GO:0005166) |
| 0.1 | 1.5 | GO:0008097 | 5S rRNA binding(GO:0008097) |
| 0.1 | 1.3 | GO:0004767 | sphingomyelin phosphodiesterase activity(GO:0004767) |
| 0.1 | 1.1 | GO:0070097 | delta-catenin binding(GO:0070097) |
| 0.1 | 0.5 | GO:0047961 | glycine N-acyltransferase activity(GO:0047961) |
| 0.1 | 0.4 | GO:0004140 | dephospho-CoA kinase activity(GO:0004140) |
| 0.1 | 0.3 | GO:0015229 | L-ascorbate:sodium symporter activity(GO:0008520) L-ascorbic acid transporter activity(GO:0015229) sodium-dependent L-ascorbate transmembrane transporter activity(GO:0070890) |
| 0.1 | 0.3 | GO:0031798 | type 1 metabotropic glutamate receptor binding(GO:0031798) |
| 0.1 | 0.6 | GO:0004468 | lysine N-acetyltransferase activity, acting on acetyl phosphate as donor(GO:0004468) |
| 0.1 | 0.2 | GO:0030550 | acetylcholine receptor inhibitor activity(GO:0030550) |
| 0.1 | 0.3 | GO:0047787 | delta4-3-oxosteroid 5beta-reductase activity(GO:0047787) |
| 0.1 | 1.5 | GO:0004000 | adenosine deaminase activity(GO:0004000) |
| 0.1 | 0.9 | GO:0070740 | tubulin-glutamic acid ligase activity(GO:0070740) |
| 0.1 | 0.3 | GO:0016744 | transferase activity, transferring aldehyde or ketonic groups(GO:0016744) |
| 0.1 | 0.5 | GO:0036435 | K48-linked polyubiquitin binding(GO:0036435) |
| 0.1 | 0.6 | GO:0047685 | amine sulfotransferase activity(GO:0047685) |
| 0.1 | 4.2 | GO:0005035 | tumor necrosis factor-activated receptor activity(GO:0005031) death receptor activity(GO:0005035) |
| 0.1 | 1.3 | GO:0016176 | superoxide-generating NADPH oxidase activator activity(GO:0016176) |
| 0.1 | 0.4 | GO:0031811 | G-protein coupled nucleotide receptor binding(GO:0031811) P2Y1 nucleotide receptor binding(GO:0031812) |
| 0.1 | 0.6 | GO:0016286 | small conductance calcium-activated potassium channel activity(GO:0016286) |
| 0.1 | 1.1 | GO:0038132 | neuregulin binding(GO:0038132) |
| 0.1 | 0.6 | GO:0070181 | small ribosomal subunit rRNA binding(GO:0070181) |
| 0.1 | 0.3 | GO:0004878 | complement component C5a receptor activity(GO:0004878) |
| 0.1 | 0.3 | GO:0008476 | protein-tyrosine sulfotransferase activity(GO:0008476) |
| 0.1 | 0.8 | GO:0016206 | catechol O-methyltransferase activity(GO:0016206) |
| 0.1 | 2.1 | GO:0015467 | G-protein activated inward rectifier potassium channel activity(GO:0015467) |
| 0.1 | 0.3 | GO:0050333 | thiamin-triphosphatase activity(GO:0050333) |
| 0.1 | 0.5 | GO:0004911 | interleukin-2 receptor activity(GO:0004911) interleukin-2 binding(GO:0019976) |
| 0.1 | 0.4 | GO:0002114 | interleukin-33 receptor activity(GO:0002114) |
| 0.1 | 0.4 | GO:0033829 | O-fucosylpeptide 3-beta-N-acetylglucosaminyltransferase activity(GO:0033829) |
| 0.1 | 1.8 | GO:0001011 | transcription factor activity, sequence-specific DNA binding, RNA polymerase recruiting(GO:0001011) transcription factor activity, TFIIB-class binding(GO:0001087) |
| 0.1 | 0.1 | GO:0005119 | smoothened binding(GO:0005119) |
| 0.1 | 0.3 | GO:0070538 | oleic acid binding(GO:0070538) |
| 0.1 | 1.2 | GO:0016712 | oxidoreductase activity, acting on paired donors, with incorporation or reduction of molecular oxygen, reduced flavin or flavoprotein as one donor, and incorporation of one atom of oxygen(GO:0016712) |
| 0.1 | 0.9 | GO:0071933 | Arp2/3 complex binding(GO:0071933) |
| 0.1 | 0.5 | GO:0004814 | arginine-tRNA ligase activity(GO:0004814) |
| 0.1 | 0.3 | GO:0035529 | NADH pyrophosphatase activity(GO:0035529) |
| 0.1 | 0.3 | GO:0001515 | opioid peptide activity(GO:0001515) |
| 0.1 | 0.3 | GO:0071987 | WD40-repeat domain binding(GO:0071987) |
| 0.1 | 0.6 | GO:0004609 | phosphatidylserine decarboxylase activity(GO:0004609) |
| 0.1 | 0.7 | GO:0050816 | phosphothreonine binding(GO:0050816) |
| 0.1 | 3.0 | GO:0098641 | cadherin binding involved in cell-cell adhesion(GO:0098641) |
| 0.1 | 1.2 | GO:0032395 | MHC class II receptor activity(GO:0032395) |
| 0.1 | 2.1 | GO:0017049 | GTP-Rho binding(GO:0017049) |
| 0.1 | 1.5 | GO:0000149 | SNARE binding(GO:0000149) |
| 0.1 | 0.2 | GO:0030348 | syntaxin-3 binding(GO:0030348) |
| 0.1 | 0.7 | GO:0015272 | ATP-activated inward rectifier potassium channel activity(GO:0015272) |
| 0.1 | 1.4 | GO:0016653 | oxidoreductase activity, acting on NAD(P)H, heme protein as acceptor(GO:0016653) |
| 0.1 | 2.6 | GO:0015002 | cytochrome-c oxidase activity(GO:0004129) heme-copper terminal oxidase activity(GO:0015002) oxidoreductase activity, acting on a heme group of donors(GO:0016675) oxidoreductase activity, acting on a heme group of donors, oxygen as acceptor(GO:0016676) |
| 0.1 | 1.3 | GO:0097371 | MDM2/MDM4 family protein binding(GO:0097371) |
| 0.1 | 0.9 | GO:0047498 | calcium-dependent phospholipase A2 activity(GO:0047498) |
| 0.1 | 0.6 | GO:0089720 | caspase binding(GO:0089720) |
| 0.1 | 0.5 | GO:0008889 | glycerophosphodiester phosphodiesterase activity(GO:0008889) |
| 0.1 | 1.0 | GO:0031386 | protein tag(GO:0031386) |
| 0.1 | 0.4 | GO:0032217 | riboflavin transporter activity(GO:0032217) |
| 0.1 | 0.4 | GO:0031708 | endothelin B receptor binding(GO:0031708) |
| 0.1 | 1.0 | GO:0016861 | intramolecular oxidoreductase activity, interconverting aldoses and ketoses(GO:0016861) |
| 0.1 | 2.4 | GO:0002162 | dystroglycan binding(GO:0002162) |
| 0.1 | 2.3 | GO:0046933 | proton-transporting ATP synthase activity, rotational mechanism(GO:0046933) |
| 0.1 | 1.3 | GO:0008140 | cAMP response element binding protein binding(GO:0008140) |
| 0.1 | 0.2 | GO:0047760 | butyrate-CoA ligase activity(GO:0047760) |
| 0.1 | 0.2 | GO:0004925 | prolactin receptor activity(GO:0004925) |
| 0.1 | 0.4 | GO:0004105 | choline-phosphate cytidylyltransferase activity(GO:0004105) |
| 0.1 | 1.3 | GO:0030284 | estrogen receptor activity(GO:0030284) |
| 0.1 | 1.8 | GO:0030247 | pattern binding(GO:0001871) polysaccharide binding(GO:0030247) |
| 0.1 | 0.2 | GO:0008269 | JAK pathway signal transduction adaptor activity(GO:0008269) |
| 0.1 | 0.4 | GO:0030492 | hemoglobin binding(GO:0030492) |
| 0.1 | 2.7 | GO:0005229 | intracellular calcium activated chloride channel activity(GO:0005229) |
| 0.1 | 0.6 | GO:0061133 | endopeptidase activator activity(GO:0061133) |
| 0.1 | 1.3 | GO:0015125 | bile acid transmembrane transporter activity(GO:0015125) |
| 0.1 | 0.3 | GO:0001601 | peptide YY receptor activity(GO:0001601) |
| 0.1 | 0.1 | GO:0072545 | tyrosine binding(GO:0072545) |
| 0.1 | 1.1 | GO:0045159 | myosin II binding(GO:0045159) |
| 0.1 | 0.5 | GO:0019788 | NEDD8 transferase activity(GO:0019788) |
| 0.1 | 0.7 | GO:0015349 | thyroid hormone transmembrane transporter activity(GO:0015349) |
| 0.1 | 0.4 | GO:0004522 | ribonuclease A activity(GO:0004522) |
| 0.1 | 0.5 | GO:0004699 | calcium-independent protein kinase C activity(GO:0004699) |
| 0.1 | 1.8 | GO:0031957 | very long-chain fatty acid-CoA ligase activity(GO:0031957) |
| 0.1 | 0.1 | GO:0005220 | inositol 1,4,5-trisphosphate-sensitive calcium-release channel activity(GO:0005220) |
| 0.1 | 0.4 | GO:0004994 | somatostatin receptor activity(GO:0004994) |
| 0.1 | 0.6 | GO:0015315 | hexose phosphate transmembrane transporter activity(GO:0015119) organophosphate:inorganic phosphate antiporter activity(GO:0015315) hexose-phosphate:inorganic phosphate antiporter activity(GO:0015526) glucose 6-phosphate:inorganic phosphate antiporter activity(GO:0061513) |
| 0.1 | 0.2 | GO:0042356 | GDP-4-dehydro-D-rhamnose reductase activity(GO:0042356) GDP-L-fucose synthase activity(GO:0050577) |
| 0.1 | 2.7 | GO:0001972 | retinoic acid binding(GO:0001972) |
| 0.1 | 0.7 | GO:0001665 | alpha-N-acetylgalactosaminide alpha-2,6-sialyltransferase activity(GO:0001665) |
| 0.1 | 1.0 | GO:0004465 | lipoprotein lipase activity(GO:0004465) |
| 0.1 | 0.4 | GO:0017159 | pantetheine hydrolase activity(GO:0017159) |
| 0.1 | 0.9 | GO:0001730 | 2'-5'-oligoadenylate synthetase activity(GO:0001730) |
| 0.1 | 0.9 | GO:0047134 | protein-disulfide reductase activity(GO:0047134) |
| 0.1 | 0.8 | GO:0051434 | BH3 domain binding(GO:0051434) |
| 0.1 | 0.6 | GO:0015232 | heme transporter activity(GO:0015232) |
| 0.1 | 3.8 | GO:0005164 | tumor necrosis factor receptor binding(GO:0005164) |
| 0.1 | 0.2 | GO:0015928 | alpha-L-fucosidase activity(GO:0004560) fucosidase activity(GO:0015928) |
| 0.1 | 0.3 | GO:0015189 | L-lysine transmembrane transporter activity(GO:0015189) |
| 0.1 | 2.6 | GO:0005001 | transmembrane receptor protein tyrosine phosphatase activity(GO:0005001) transmembrane receptor protein phosphatase activity(GO:0019198) |
| 0.1 | 0.7 | GO:0051400 | BH domain binding(GO:0051400) |
| 0.1 | 1.1 | GO:0005537 | mannose binding(GO:0005537) |
| 0.1 | 0.4 | GO:0050664 | superoxide-generating NADPH oxidase activity(GO:0016175) oxidoreductase activity, acting on NAD(P)H, oxygen as acceptor(GO:0050664) |
| 0.1 | 0.3 | GO:0016019 | peptidoglycan receptor activity(GO:0016019) |
| 0.1 | 0.7 | GO:0008440 | inositol-1,4,5-trisphosphate 3-kinase activity(GO:0008440) |
| 0.1 | 0.2 | GO:0036487 | nitric-oxide synthase inhibitor activity(GO:0036487) |
| 0.1 | 0.3 | GO:0060230 | lipoprotein lipase activator activity(GO:0060230) |
| 0.1 | 0.1 | GO:0070568 | guanylyltransferase activity(GO:0070568) |
| 0.1 | 1.1 | GO:0000182 | rDNA binding(GO:0000182) |
| 0.1 | 0.3 | GO:0015440 | peptide-transporting ATPase activity(GO:0015440) |
| 0.1 | 0.4 | GO:0004906 | interferon-gamma receptor activity(GO:0004906) |
| 0.1 | 0.5 | GO:0050682 | AF-2 domain binding(GO:0050682) |
| 0.1 | 0.4 | GO:0047006 | 17-alpha,20-alpha-dihydroxypregn-4-en-3-one dehydrogenase activity(GO:0047006) |
| 0.1 | 0.3 | GO:0034714 | type III transforming growth factor beta receptor binding(GO:0034714) |
| 0.1 | 1.0 | GO:0004062 | aryl sulfotransferase activity(GO:0004062) |
| 0.1 | 0.2 | GO:0004574 | oligo-1,6-glucosidase activity(GO:0004574) |
| 0.1 | 0.8 | GO:0004565 | beta-galactosidase activity(GO:0004565) |
| 0.1 | 1.6 | GO:0035613 | RNA stem-loop binding(GO:0035613) |
| 0.1 | 0.2 | GO:0000990 | transcription factor activity, core RNA polymerase binding(GO:0000990) |
| 0.1 | 0.7 | GO:0019865 | immunoglobulin binding(GO:0019865) |
| 0.1 | 0.8 | GO:0050693 | LBD domain binding(GO:0050693) |
| 0.1 | 0.8 | GO:0004602 | glutathione peroxidase activity(GO:0004602) |
| 0.1 | 0.2 | GO:0070513 | death domain binding(GO:0070513) |
| 0.1 | 1.3 | GO:0005243 | gap junction channel activity(GO:0005243) |
| 0.1 | 0.4 | GO:0004045 | aminoacyl-tRNA hydrolase activity(GO:0004045) |
| 0.1 | 2.1 | GO:0004550 | nucleoside diphosphate kinase activity(GO:0004550) |
| 0.1 | 1.4 | GO:0044548 | S100 protein binding(GO:0044548) |
| 0.1 | 0.6 | GO:0008321 | Ral guanyl-nucleotide exchange factor activity(GO:0008321) |
| 0.1 | 0.9 | GO:0003810 | protein-glutamine gamma-glutamyltransferase activity(GO:0003810) |
| 0.1 | 0.2 | GO:0070051 | fibrinogen binding(GO:0070051) |
| 0.1 | 0.2 | GO:0004019 | adenylosuccinate synthase activity(GO:0004019) |
| 0.1 | 0.3 | GO:0034584 | piRNA binding(GO:0034584) |
| 0.1 | 0.2 | GO:1990259 | protein-glutamine N-methyltransferase activity(GO:0036009) histone-glutamine methyltransferase activity(GO:1990259) |
| 0.1 | 0.5 | GO:0015220 | choline transmembrane transporter activity(GO:0015220) |
| 0.1 | 0.5 | GO:0004198 | calcium-dependent cysteine-type endopeptidase activity(GO:0004198) |
| 0.1 | 1.0 | GO:0042605 | peptide antigen binding(GO:0042605) |
| 0.1 | 1.1 | GO:0016864 | protein disulfide isomerase activity(GO:0003756) intramolecular oxidoreductase activity, transposing S-S bonds(GO:0016864) |
| 0.1 | 1.2 | GO:0008271 | secondary active sulfate transmembrane transporter activity(GO:0008271) |
| 0.1 | 0.2 | GO:0004060 | arylamine N-acetyltransferase activity(GO:0004060) |
| 0.1 | 0.5 | GO:0016314 | phosphatidylinositol-3,4,5-trisphosphate 3-phosphatase activity(GO:0016314) PTB domain binding(GO:0051425) |
| 0.1 | 0.3 | GO:0004489 | methylenetetrahydrofolate reductase (NAD(P)H) activity(GO:0004489) |
| 0.1 | 0.2 | GO:0004351 | glutamate decarboxylase activity(GO:0004351) |
| 0.1 | 0.3 | GO:0001849 | complement component C1q binding(GO:0001849) |
| 0.1 | 0.5 | GO:0030628 | pre-mRNA 3'-splice site binding(GO:0030628) |
| 0.1 | 0.5 | GO:0008503 | benzodiazepine receptor activity(GO:0008503) |
| 0.1 | 0.3 | GO:0003829 | beta-1,3-galactosyl-O-glycosyl-glycoprotein beta-1,6-N-acetylglucosaminyltransferase activity(GO:0003829) |
| 0.1 | 0.3 | GO:0016015 | morphogen activity(GO:0016015) |
| 0.1 | 0.9 | GO:0043008 | ATP-dependent protein binding(GO:0043008) |
| 0.1 | 0.2 | GO:0008426 | protein kinase C inhibitor activity(GO:0008426) |
| 0.1 | 0.6 | GO:0008020 | G-protein coupled photoreceptor activity(GO:0008020) |
| 0.1 | 1.2 | GO:0055056 | D-glucose transmembrane transporter activity(GO:0055056) |
| 0.1 | 0.1 | GO:0016774 | phosphotransferase activity, carboxyl group as acceptor(GO:0016774) |
| 0.1 | 0.2 | GO:0045127 | N-acetylglucosamine kinase activity(GO:0045127) |
| 0.1 | 0.5 | GO:0030249 | cyclase regulator activity(GO:0010851) guanylate cyclase regulator activity(GO:0030249) |
| 0.1 | 0.3 | GO:0004035 | alkaline phosphatase activity(GO:0004035) |
| 0.1 | 0.2 | GO:0004346 | glucose-6-phosphatase activity(GO:0004346) sugar-terminal-phosphatase activity(GO:0050309) |
| 0.1 | 0.2 | GO:0031690 | adrenergic receptor binding(GO:0031690) |
| 0.1 | 0.2 | GO:0008479 | queuine tRNA-ribosyltransferase activity(GO:0008479) |
| 0.1 | 0.2 | GO:0008241 | peptidyl-dipeptidase activity(GO:0008241) |
| 0.1 | 0.8 | GO:0033130 | acetylcholine receptor binding(GO:0033130) |
| 0.1 | 0.7 | GO:0004322 | ferroxidase activity(GO:0004322) oxidoreductase activity, oxidizing metal ions, oxygen as acceptor(GO:0016724) |
| 0.1 | 0.3 | GO:0016520 | growth hormone-releasing hormone receptor activity(GO:0016520) |
| 0.1 | 0.2 | GO:1990190 | peptide-glutamate-N-acetyltransferase activity(GO:1990190) |
| 0.1 | 0.2 | GO:0008193 | tRNA guanylyltransferase activity(GO:0008193) |
| 0.1 | 1.7 | GO:0043425 | bHLH transcription factor binding(GO:0043425) |
| 0.1 | 0.4 | GO:0001517 | N-acetylglucosamine 6-O-sulfotransferase activity(GO:0001517) |
| 0.1 | 0.2 | GO:0032422 | purine-rich negative regulatory element binding(GO:0032422) |
| 0.1 | 0.3 | GO:0042015 | interleukin-20 binding(GO:0042015) |
| 0.1 | 1.3 | GO:0005095 | GTPase inhibitor activity(GO:0005095) |
| 0.1 | 0.3 | GO:0005087 | Ran guanyl-nucleotide exchange factor activity(GO:0005087) |
| 0.1 | 1.1 | GO:0044213 | intronic transcription regulatory region sequence-specific DNA binding(GO:0001161) intronic transcription regulatory region DNA binding(GO:0044213) |
| 0.1 | 9.5 | GO:0008083 | growth factor activity(GO:0008083) |
| 0.1 | 0.6 | GO:0004332 | fructose-bisphosphate aldolase activity(GO:0004332) |
| 0.1 | 11.7 | GO:0001078 | transcriptional repressor activity, RNA polymerase II core promoter proximal region sequence-specific binding(GO:0001078) |
| 0.1 | 3.9 | GO:0005179 | hormone activity(GO:0005179) |
| 0.0 | 2.0 | GO:0004180 | carboxypeptidase activity(GO:0004180) |
| 0.0 | 0.6 | GO:0004551 | nucleotide diphosphatase activity(GO:0004551) |
| 0.0 | 1.7 | GO:0034987 | immunoglobulin receptor binding(GO:0034987) |
| 0.0 | 0.2 | GO:0004582 | dolichyl-phosphate beta-D-mannosyltransferase activity(GO:0004582) |
| 0.0 | 0.2 | GO:0097322 | 7SK snRNA binding(GO:0097322) |
| 0.0 | 0.2 | GO:0004161 | dimethylallyltranstransferase activity(GO:0004161) geranyltranstransferase activity(GO:0004337) |
| 0.0 | 0.4 | GO:0003696 | satellite DNA binding(GO:0003696) |
| 0.0 | 0.4 | GO:0008568 | microtubule-severing ATPase activity(GO:0008568) |
| 0.0 | 0.2 | GO:0004792 | thiosulfate sulfurtransferase activity(GO:0004792) |
| 0.0 | 3.0 | GO:0003755 | peptidyl-prolyl cis-trans isomerase activity(GO:0003755) |
| 0.0 | 0.4 | GO:0004791 | thioredoxin-disulfide reductase activity(GO:0004791) |
| 0.0 | 0.9 | GO:0005159 | insulin-like growth factor receptor binding(GO:0005159) |
| 0.0 | 0.7 | GO:0003906 | DNA-(apurinic or apyrimidinic site) lyase activity(GO:0003906) |
| 0.0 | 0.2 | GO:0004965 | G-protein coupled GABA receptor activity(GO:0004965) |
| 0.0 | 1.8 | GO:0008235 | metalloexopeptidase activity(GO:0008235) |
| 0.0 | 0.1 | GO:0033149 | FFAT motif binding(GO:0033149) |
| 0.0 | 0.7 | GO:0004745 | retinol dehydrogenase activity(GO:0004745) |
| 0.0 | 0.6 | GO:0097109 | neuroligin family protein binding(GO:0097109) |
| 0.0 | 1.3 | GO:0070003 | threonine-type endopeptidase activity(GO:0004298) threonine-type peptidase activity(GO:0070003) |
| 0.0 | 0.2 | GO:0016803 | ether hydrolase activity(GO:0016803) |
| 0.0 | 0.4 | GO:0030172 | troponin C binding(GO:0030172) |
| 0.0 | 0.4 | GO:0003828 | alpha-N-acetylneuraminate alpha-2,8-sialyltransferase activity(GO:0003828) |
| 0.0 | 0.3 | GO:0019855 | calcium channel inhibitor activity(GO:0019855) |
| 0.0 | 1.7 | GO:0008093 | cytoskeletal adaptor activity(GO:0008093) |
| 0.0 | 0.1 | GO:0005104 | fibroblast growth factor receptor binding(GO:0005104) |
| 0.0 | 1.3 | GO:0016538 | cyclin-dependent protein serine/threonine kinase regulator activity(GO:0016538) |
| 0.0 | 0.5 | GO:0035259 | glucocorticoid receptor binding(GO:0035259) |
| 0.0 | 0.2 | GO:0005143 | interleukin-12 receptor binding(GO:0005143) |
| 0.0 | 0.4 | GO:0031402 | sodium ion binding(GO:0031402) |
| 0.0 | 0.1 | GO:0015235 | cobalamin transporter activity(GO:0015235) |
| 0.0 | 0.8 | GO:0038187 | signaling pattern recognition receptor activity(GO:0008329) pattern recognition receptor activity(GO:0038187) |
| 0.0 | 0.2 | GO:0046976 | histone methyltransferase activity (H3-K27 specific)(GO:0046976) |
| 0.0 | 0.2 | GO:0004074 | biliverdin reductase activity(GO:0004074) |
| 0.0 | 0.3 | GO:0060175 | brain-derived neurotrophic factor-activated receptor activity(GO:0060175) |
| 0.0 | 0.2 | GO:0033823 | procollagen-lysine 5-dioxygenase activity(GO:0008475) procollagen glucosyltransferase activity(GO:0033823) |
| 0.0 | 0.3 | GO:1990599 | 3' overhang single-stranded DNA endodeoxyribonuclease activity(GO:1990599) |
| 0.0 | 0.5 | GO:0001206 | transcriptional repressor activity, RNA polymerase II distal enhancer sequence-specific binding(GO:0001206) |
| 0.0 | 0.2 | GO:0072345 | NAADP-sensitive calcium-release channel activity(GO:0072345) |
| 0.0 | 0.3 | GO:0042285 | UDP-xylosyltransferase activity(GO:0035252) xylosyltransferase activity(GO:0042285) |
| 0.0 | 0.1 | GO:0004155 | 6,7-dihydropteridine reductase activity(GO:0004155) |
| 0.0 | 0.5 | GO:0035251 | UDP-glucosyltransferase activity(GO:0035251) |
| 0.0 | 0.2 | GO:0016638 | oxidoreductase activity, acting on the CH-NH2 group of donors(GO:0016638) |
| 0.0 | 0.6 | GO:0005381 | iron ion transmembrane transporter activity(GO:0005381) |
| 0.0 | 1.6 | GO:0043014 | alpha-tubulin binding(GO:0043014) |
| 0.0 | 0.3 | GO:0017162 | aryl hydrocarbon receptor binding(GO:0017162) |
| 0.0 | 0.1 | GO:0004531 | deoxyribonuclease II activity(GO:0004531) |
| 0.0 | 0.3 | GO:0050733 | RS domain binding(GO:0050733) |
| 0.0 | 0.2 | GO:0004949 | cannabinoid receptor activity(GO:0004949) |
| 0.0 | 0.5 | GO:0003996 | acyl-CoA ligase activity(GO:0003996) |
| 0.0 | 0.8 | GO:0031418 | L-ascorbic acid binding(GO:0031418) |
| 0.0 | 0.3 | GO:0003920 | GMP reductase activity(GO:0003920) oxidoreductase activity, acting on NAD(P)H, nitrogenous group as acceptor(GO:0016657) |
| 0.0 | 0.4 | GO:1904264 | ubiquitin protein ligase activity involved in ERAD pathway(GO:1904264) |
| 0.0 | 0.8 | GO:0008519 | ammonium transmembrane transporter activity(GO:0008519) |
| 0.0 | 0.1 | GO:0005223 | intracellular cGMP activated cation channel activity(GO:0005223) |
| 0.0 | 0.9 | GO:0030306 | ADP-ribosylation factor binding(GO:0030306) |
| 0.0 | 5.0 | GO:0002020 | protease binding(GO:0002020) |
| 0.0 | 0.1 | GO:0004510 | tryptophan 5-monooxygenase activity(GO:0004510) |
| 0.0 | 0.7 | GO:0004190 | aspartic-type endopeptidase activity(GO:0004190) aspartic-type peptidase activity(GO:0070001) |
| 0.0 | 0.4 | GO:0001609 | G-protein coupled adenosine receptor activity(GO:0001609) |
| 0.0 | 0.2 | GO:0035473 | lipase binding(GO:0035473) |
| 0.0 | 0.1 | GO:0001093 | TFIIB-class transcription factor binding(GO:0001093) |
| 0.0 | 0.1 | GO:0005124 | scavenger receptor binding(GO:0005124) |
| 0.0 | 0.1 | GO:0005004 | GPI-linked ephrin receptor activity(GO:0005004) |
| 0.0 | 8.9 | GO:0003735 | structural constituent of ribosome(GO:0003735) |
| 0.0 | 0.6 | GO:0016494 | C-X-C chemokine receptor activity(GO:0016494) |
| 0.0 | 1.1 | GO:0034237 | protein kinase A regulatory subunit binding(GO:0034237) |
| 0.0 | 1.3 | GO:0046875 | ephrin receptor binding(GO:0046875) |
| 0.0 | 0.1 | GO:0003986 | acetyl-CoA hydrolase activity(GO:0003986) |
| 0.0 | 0.1 | GO:0005199 | structural constituent of cell wall(GO:0005199) |
| 0.0 | 0.3 | GO:0004784 | superoxide dismutase activity(GO:0004784) oxidoreductase activity, acting on superoxide radicals as acceptor(GO:0016721) |
| 0.0 | 0.3 | GO:0030620 | U2 snRNA binding(GO:0030620) |
| 0.0 | 4.1 | GO:0031490 | chromatin DNA binding(GO:0031490) |
| 0.0 | 0.1 | GO:0008900 | hydrogen:potassium-exchanging ATPase activity(GO:0008900) |
| 0.0 | 0.1 | GO:0016749 | 5-aminolevulinate synthase activity(GO:0003870) N-succinyltransferase activity(GO:0016749) |
| 0.0 | 1.6 | GO:0003950 | NAD+ ADP-ribosyltransferase activity(GO:0003950) |
| 0.0 | 0.1 | GO:0061676 | importin-alpha family protein binding(GO:0061676) |
| 0.0 | 0.3 | GO:0004704 | NF-kappaB-inducing kinase activity(GO:0004704) |
| 0.0 | 2.9 | GO:0005125 | cytokine activity(GO:0005125) |
| 0.0 | 0.2 | GO:0030548 | acetylcholine receptor regulator activity(GO:0030548) neurotransmitter receptor regulator activity(GO:0099602) |
| 0.0 | 0.1 | GO:0004605 | phosphatidate cytidylyltransferase activity(GO:0004605) |
| 0.0 | 0.1 | GO:0004852 | uroporphyrinogen-III synthase activity(GO:0004852) |
| 0.0 | 0.1 | GO:0034040 | lipid-transporting ATPase activity(GO:0034040) |
| 0.0 | 3.5 | GO:0004222 | metalloendopeptidase activity(GO:0004222) |
| 0.0 | 0.1 | GO:0010385 | double-stranded methylated DNA binding(GO:0010385) |
| 0.0 | 0.2 | GO:0001135 | transcription factor activity, RNA polymerase II transcription factor recruiting(GO:0001135) |
| 0.0 | 0.4 | GO:0003796 | lysozyme activity(GO:0003796) |
| 0.0 | 0.2 | GO:0045505 | dynein intermediate chain binding(GO:0045505) |
| 0.0 | 0.1 | GO:0031751 | D4 dopamine receptor binding(GO:0031751) |
| 0.0 | 0.2 | GO:0086056 | voltage-gated calcium channel activity involved in AV node cell action potential(GO:0086056) |
| 0.0 | 0.2 | GO:0032190 | acrosin binding(GO:0032190) |
| 0.0 | 0.4 | GO:0015347 | sodium-independent organic anion transmembrane transporter activity(GO:0015347) |
| 0.0 | 0.2 | GO:0047757 | chondroitin-glucuronate 5-epimerase activity(GO:0047757) |
| 0.0 | 0.3 | GO:0015464 | acetylcholine receptor activity(GO:0015464) |
| 0.0 | 0.2 | GO:0043855 | intracellular cyclic nucleotide activated cation channel activity(GO:0005221) cyclic nucleotide-gated ion channel activity(GO:0043855) |
| 0.0 | 0.7 | GO:0051059 | NF-kappaB binding(GO:0051059) |
| 0.0 | 3.8 | GO:0003730 | mRNA 3'-UTR binding(GO:0003730) |
| 0.0 | 0.2 | GO:0047756 | chondroitin 4-sulfotransferase activity(GO:0047756) |
| 0.0 | 0.5 | GO:0070569 | uridylyltransferase activity(GO:0070569) |
| 0.0 | 0.4 | GO:0017091 | AU-rich element binding(GO:0017091) |
| 0.0 | 0.1 | GO:0047696 | beta-adrenergic receptor kinase activity(GO:0047696) |
| 0.0 | 0.2 | GO:0004144 | diacylglycerol O-acyltransferase activity(GO:0004144) |
| 0.0 | 1.3 | GO:0004385 | guanylate kinase activity(GO:0004385) |
| 0.0 | 0.3 | GO:0004768 | stearoyl-CoA 9-desaturase activity(GO:0004768) acyl-CoA desaturase activity(GO:0016215) |
| 0.0 | 0.4 | GO:0045503 | dynein light chain binding(GO:0045503) |
| 0.0 | 0.2 | GO:0015277 | kainate selective glutamate receptor activity(GO:0015277) |
| 0.0 | 0.5 | GO:0043560 | insulin receptor substrate binding(GO:0043560) |
| 0.0 | 0.0 | GO:0031893 | vasopressin receptor binding(GO:0031893) |
| 0.0 | 0.1 | GO:0003978 | UDP-N-acetylglucosamine 4-epimerase activity(GO:0003974) UDP-glucose 4-epimerase activity(GO:0003978) |
| 0.0 | 0.3 | GO:0032454 | histone demethylase activity (H3-K9 specific)(GO:0032454) |
| 0.0 | 0.8 | GO:0017069 | snRNA binding(GO:0017069) |
| 0.0 | 0.1 | GO:0003955 | NAD(P)H dehydrogenase (quinone) activity(GO:0003955) |
| 0.0 | 0.1 | GO:0004958 | prostaglandin F receptor activity(GO:0004958) |
| 0.0 | 0.2 | GO:0004983 | neuropeptide Y receptor activity(GO:0004983) |
| 0.0 | 0.9 | GO:0030159 | receptor signaling complex scaffold activity(GO:0030159) |
| 0.0 | 1.0 | GO:0051959 | dynein light intermediate chain binding(GO:0051959) |
| 0.0 | 0.1 | GO:0015186 | L-glutamine transmembrane transporter activity(GO:0015186) |
| 0.0 | 0.1 | GO:0004991 | parathyroid hormone receptor activity(GO:0004991) |
| 0.0 | 0.1 | GO:0050211 | procollagen galactosyltransferase activity(GO:0050211) |
| 0.0 | 0.5 | GO:0070679 | inositol 1,4,5 trisphosphate binding(GO:0070679) |
| 0.0 | 0.1 | GO:0019103 | pyrimidine nucleotide binding(GO:0019103) |
| 0.0 | 0.3 | GO:0015379 | potassium:chloride symporter activity(GO:0015379) potassium ion symporter activity(GO:0022820) |
| 0.0 | 0.1 | GO:0010181 | FMN binding(GO:0010181) |
| 0.0 | 0.2 | GO:0086006 | voltage-gated sodium channel activity involved in cardiac muscle cell action potential(GO:0086006) |
| 0.0 | 0.3 | GO:0008308 | voltage-gated anion channel activity(GO:0008308) |
| 0.0 | 0.7 | GO:0005251 | delayed rectifier potassium channel activity(GO:0005251) |
| 0.0 | 0.1 | GO:0061628 | H3K27me3 modified histone binding(GO:0061628) |
| 0.0 | 0.1 | GO:0004692 | cGMP-dependent protein kinase activity(GO:0004692) |
| 0.0 | 0.1 | GO:0015056 | corticotrophin-releasing factor receptor activity(GO:0015056) |
| 0.0 | 0.1 | GO:0005384 | manganese ion transmembrane transporter activity(GO:0005384) |
| 0.0 | 0.1 | GO:0097677 | STAT family protein binding(GO:0097677) |
| 0.0 | 0.2 | GO:0016594 | glycine binding(GO:0016594) |
| 0.0 | 0.2 | GO:0004908 | interleukin-1 receptor activity(GO:0004908) |
| 0.0 | 0.2 | GO:0001733 | galactosylceramide sulfotransferase activity(GO:0001733) galactose 3-O-sulfotransferase activity(GO:0050694) |
| 0.0 | 0.2 | GO:0099583 | neurotransmitter receptor activity involved in regulation of postsynaptic cytosolic calcium ion concentration(GO:0099583) |
| 0.0 | 0.4 | GO:0004568 | chitinase activity(GO:0004568) |
| 0.0 | 0.2 | GO:0015187 | glycine transmembrane transporter activity(GO:0015187) |
| 0.0 | 0.1 | GO:0032406 | MutLbeta complex binding(GO:0032406) MutSbeta complex binding(GO:0032408) |
| 0.0 | 0.1 | GO:0008892 | guanine deaminase activity(GO:0008892) |
| 0.0 | 1.4 | GO:0097110 | scaffold protein binding(GO:0097110) |
| 0.0 | 0.1 | GO:0004961 | thromboxane receptor activity(GO:0004960) thromboxane A2 receptor activity(GO:0004961) |
| 0.0 | 0.2 | GO:0016997 | exo-alpha-sialidase activity(GO:0004308) alpha-sialidase activity(GO:0016997) exo-alpha-(2->3)-sialidase activity(GO:0052794) exo-alpha-(2->6)-sialidase activity(GO:0052795) exo-alpha-(2->8)-sialidase activity(GO:0052796) |
| 0.0 | 0.4 | GO:0031435 | mitogen-activated protein kinase kinase kinase binding(GO:0031435) |
| 0.0 | 0.4 | GO:0005549 | odorant binding(GO:0005549) |
| 0.0 | 0.0 | GO:0004311 | farnesyltranstransferase activity(GO:0004311) |
| 0.0 | 0.1 | GO:0005499 | vitamin D binding(GO:0005499) |
| 0.0 | 0.7 | GO:0019707 | protein-cysteine S-palmitoyltransferase activity(GO:0019706) protein-cysteine S-acyltransferase activity(GO:0019707) |
| 0.0 | 0.2 | GO:0060698 | endoribonuclease inhibitor activity(GO:0060698) |
| 0.0 | 0.1 | GO:0001133 | RNA polymerase II transcription factor activity, sequence-specific transcription regulatory region DNA binding(GO:0001133) |
| 0.0 | 0.5 | GO:0004143 | diacylglycerol kinase activity(GO:0004143) |
| 0.0 | 0.2 | GO:0008553 | hydrogen-exporting ATPase activity, phosphorylative mechanism(GO:0008553) |
| 0.0 | 0.1 | GO:0051575 | 5'-deoxyribose-5-phosphate lyase activity(GO:0051575) |
| 0.0 | 0.3 | GO:0004596 | peptide alpha-N-acetyltransferase activity(GO:0004596) |
| 0.0 | 1.7 | GO:0004984 | olfactory receptor activity(GO:0004984) |
| 0.0 | 0.4 | GO:0030971 | receptor tyrosine kinase binding(GO:0030971) |
| 0.0 | 0.3 | GO:0008417 | fucosyltransferase activity(GO:0008417) |
| 0.0 | 0.1 | GO:0070742 | C2H2 zinc finger domain binding(GO:0070742) |
| 0.0 | 0.1 | GO:0004711 | ribosomal protein S6 kinase activity(GO:0004711) |
| 0.0 | 0.2 | GO:0005412 | glucose:sodium symporter activity(GO:0005412) |
| 0.0 | 0.2 | GO:0008420 | CTD phosphatase activity(GO:0008420) |
| 0.0 | 0.1 | GO:0003863 | alpha-ketoacid dehydrogenase activity(GO:0003826) 3-methyl-2-oxobutanoate dehydrogenase (2-methylpropanoyl-transferring) activity(GO:0003863) |
| 0.0 | 0.2 | GO:0008046 | axon guidance receptor activity(GO:0008046) |
| 0.0 | 1.0 | GO:0005518 | collagen binding(GO:0005518) |
| 0.0 | 0.2 | GO:0070137 | ubiquitin-like protein-specific endopeptidase activity(GO:0070137) SUMO-specific endopeptidase activity(GO:0070139) |
| 0.0 | 0.2 | GO:0003847 | 1-alkyl-2-acetylglycerophosphocholine esterase activity(GO:0003847) |
| 0.0 | 0.2 | GO:0043225 | anion transmembrane-transporting ATPase activity(GO:0043225) |
| 0.0 | 0.2 | GO:0003680 | AT DNA binding(GO:0003680) |
| 0.0 | 0.9 | GO:0050840 | extracellular matrix binding(GO:0050840) |
| 0.0 | 0.1 | GO:0004850 | uridine phosphorylase activity(GO:0004850) |
| 0.0 | 0.2 | GO:0022833 | mechanically-gated ion channel activity(GO:0008381) mechanically gated channel activity(GO:0022833) |
| 0.0 | 0.1 | GO:0000064 | L-ornithine transmembrane transporter activity(GO:0000064) |
| 0.0 | 0.1 | GO:0004769 | steroid delta-isomerase activity(GO:0004769) |
| 0.0 | 0.1 | GO:0004716 | receptor signaling protein tyrosine kinase activity(GO:0004716) |
| 0.0 | 0.1 | GO:0004948 | calcitonin receptor activity(GO:0004948) |
| 0.0 | 0.2 | GO:1990247 | N6-methyladenosine-containing RNA binding(GO:1990247) |
| 0.0 | 0.2 | GO:0001103 | RNA polymerase II repressing transcription factor binding(GO:0001103) |
| 0.0 | 1.0 | GO:0030145 | manganese ion binding(GO:0030145) |
| 0.0 | 0.3 | GO:0043539 | protein serine/threonine kinase activator activity(GO:0043539) |
| 0.0 | 0.0 | GO:1990699 | palmitoleyl hydrolase activity(GO:1990699) |
| 0.0 | 0.1 | GO:0003997 | acyl-CoA oxidase activity(GO:0003997) |
| 0.0 | 0.1 | GO:0032450 | alpha-1,4-glucosidase activity(GO:0004558) maltose alpha-glucosidase activity(GO:0032450) |
| 0.0 | 0.0 | GO:0019966 | interleukin-1 binding(GO:0019966) |
| 0.0 | 0.1 | GO:0030957 | Tat protein binding(GO:0030957) |
| 0.0 | 0.2 | GO:0008556 | sodium:potassium-exchanging ATPase activity(GO:0005391) potassium-transporting ATPase activity(GO:0008556) |
| 0.0 | 0.0 | GO:0004458 | D-lactate dehydrogenase (cytochrome) activity(GO:0004458) oxidoreductase activity, acting on the CH-OH group of donors, cytochrome as acceptor(GO:0016898) |
| 0.0 | 0.1 | GO:0036042 | long-chain fatty acyl-CoA binding(GO:0036042) |
| 0.0 | 0.2 | GO:0004875 | complement receptor activity(GO:0004875) |
| 0.0 | 0.0 | GO:0016534 | cyclin-dependent protein kinase 5 activator activity(GO:0016534) |
| 0.0 | 0.1 | GO:0023024 | MHC class I protein complex binding(GO:0023024) |
| 0.0 | 0.7 | GO:0030676 | Rac guanyl-nucleotide exchange factor activity(GO:0030676) |
| 0.0 | 0.1 | GO:0005018 | platelet-derived growth factor alpha-receptor activity(GO:0005018) |
| 0.0 | 0.1 | GO:0016416 | O-palmitoyltransferase activity(GO:0016416) |
| 0.0 | 0.2 | GO:0001222 | transcription corepressor binding(GO:0001222) |
| 0.0 | 0.3 | GO:0008331 | high voltage-gated calcium channel activity(GO:0008331) |
| 0.0 | 0.1 | GO:0015923 | alpha-mannosidase activity(GO:0004559) mannosidase activity(GO:0015923) |
| 0.0 | 0.1 | GO:0016361 | activin receptor activity, type I(GO:0016361) |
| 0.0 | 0.1 | GO:0001588 | dopamine neurotransmitter receptor activity, coupled via Gs(GO:0001588) |
| 0.0 | 0.1 | GO:0008273 | calcium, potassium:sodium antiporter activity(GO:0008273) |
| 0.0 | 0.0 | GO:0038131 | neuregulin receptor activity(GO:0038131) |
| 0.0 | 0.1 | GO:0035325 | Toll-like receptor binding(GO:0035325) |
| 0.0 | 0.3 | GO:0005436 | sodium:phosphate symporter activity(GO:0005436) |
| 0.0 | 0.1 | GO:0004796 | thromboxane-A synthase activity(GO:0004796) 12-hydroxyheptadecatrienoic acid synthase activity(GO:0036134) |
| 0.0 | 1.5 | GO:0005070 | SH3/SH2 adaptor activity(GO:0005070) |
| 0.0 | 0.0 | GO:0042134 | rRNA primary transcript binding(GO:0042134) |
| 0.0 | 0.2 | GO:0005542 | folic acid binding(GO:0005542) |
| 0.0 | 0.1 | GO:0052813 | phosphatidylinositol-4,5-bisphosphate 3-kinase activity(GO:0046934) phosphatidylinositol bisphosphate kinase activity(GO:0052813) |
| 0.0 | 0.0 | GO:0004974 | leukotriene receptor activity(GO:0004974) |
| 0.0 | 0.8 | GO:0015078 | hydrogen ion transmembrane transporter activity(GO:0015078) |
| 0.0 | 0.1 | GO:0004995 | tachykinin receptor activity(GO:0004995) |
| 0.0 | 0.9 | GO:0070063 | RNA polymerase binding(GO:0070063) |
| 0.0 | 0.2 | GO:0005326 | neurotransmitter transporter activity(GO:0005326) |
| 0.0 | 1.0 | GO:0005201 | extracellular matrix structural constituent(GO:0005201) |
| 0.0 | 0.0 | GO:0016409 | palmitoyltransferase activity(GO:0016409) |
| 0.0 | 0.1 | GO:0004996 | thyroid-stimulating hormone receptor activity(GO:0004996) |
| 0.0 | 0.4 | GO:0033558 | histone deacetylase activity(GO:0004407) protein deacetylase activity(GO:0033558) |
| 0.0 | 0.3 | GO:0035591 | signaling adaptor activity(GO:0035591) |
| 0.0 | 0.1 | GO:0070290 | N-acylphosphatidylethanolamine-specific phospholipase D activity(GO:0070290) |
| 0.0 | 0.0 | GO:0005042 | netrin receptor activity(GO:0005042) |
| 0.0 | 0.6 | GO:0030507 | spectrin binding(GO:0030507) |
| 0.0 | 0.1 | GO:0004809 | tRNA (guanine-N2-)-methyltransferase activity(GO:0004809) |
| 0.0 | 0.1 | GO:0070411 | I-SMAD binding(GO:0070411) |
| 0.0 | 0.1 | GO:0048101 | calcium- and calmodulin-regulated 3',5'-cyclic-GMP phosphodiesterase activity(GO:0048101) |
| 0.0 | 0.1 | GO:0015929 | hexosaminidase activity(GO:0015929) |
| 0.0 | 0.9 | GO:0003705 | transcription factor activity, RNA polymerase II distal enhancer sequence-specific binding(GO:0003705) |
| 0.0 | 0.0 | GO:0001223 | transcription coactivator binding(GO:0001223) |
| 0.0 | 0.2 | GO:0042288 | MHC class I protein binding(GO:0042288) |
| 0.0 | 0.1 | GO:0030060 | L-malate dehydrogenase activity(GO:0030060) |
| 0.0 | 0.1 | GO:0003909 | DNA ligase activity(GO:0003909) |
| 0.0 | 0.1 | GO:0019211 | phosphatase activator activity(GO:0019211) |
| 0.0 | 0.0 | GO:0031177 | phosphopantetheine binding(GO:0031177) |
Gene overrepresentation in C2:CP category:
| Log-likelihood per target | Total log-likelihood | Term | Description |
|---|---|---|---|
| 0.4 | 11.9 | PID TCR RAS PATHWAY | Ras signaling in the CD4+ TCR pathway |
| 0.3 | 1.0 | PID ERBB NETWORK PATHWAY | ErbB receptor signaling network |
| 0.2 | 6.1 | PID INTEGRIN4 PATHWAY | Alpha6 beta4 integrin-ligand interactions |
| 0.2 | 16.4 | PID DELTA NP63 PATHWAY | Validated transcriptional targets of deltaNp63 isoforms |
| 0.1 | 4.2 | PID ANTHRAX PATHWAY | Cellular roles of Anthrax toxin |
| 0.1 | 1.6 | ST IL 13 PATHWAY | Interleukin 13 (IL-13) Pathway |
| 0.1 | 9.5 | PID TAP63 PATHWAY | Validated transcriptional targets of TAp63 isoforms |
| 0.1 | 52.5 | NABA SECRETED FACTORS | Genes encoding secreted soluble factors |
| 0.1 | 0.7 | SA PROGRAMMED CELL DEATH | Programmed cell death, or apoptosis, eliminates damaged or unneeded cells. |
| 0.1 | 0.3 | ST STAT3 PATHWAY | STAT3 Pathway |
| 0.1 | 6.1 | PID INTEGRIN2 PATHWAY | Beta2 integrin cell surface interactions |
| 0.1 | 34.8 | NABA ECM REGULATORS | Genes encoding enzymes and their regulators involved in the remodeling of the extracellular matrix |
| 0.1 | 0.5 | PID PDGFRA PATHWAY | PDGFR-alpha signaling pathway |
| 0.1 | 6.5 | PID CD40 PATHWAY | CD40/CD40L signaling |
| 0.1 | 6.0 | PID SYNDECAN 1 PATHWAY | Syndecan-1-mediated signaling events |
| 0.1 | 5.2 | PID INTEGRIN1 PATHWAY | Beta1 integrin cell surface interactions |
| 0.1 | 1.8 | PID TCR JNK PATHWAY | JNK signaling in the CD4+ TCR pathway |
| 0.1 | 0.8 | ST TYPE I INTERFERON PATHWAY | Type I Interferon (alpha/beta IFN) Pathway |
| 0.1 | 3.6 | ST WNT CA2 CYCLIC GMP PATHWAY | Wnt/Ca2+/cyclic GMP signaling. |
| 0.1 | 1.2 | PID NFKAPPAB ATYPICAL PATHWAY | Atypical NF-kappaB pathway |
| 0.1 | 22.9 | NABA ECM GLYCOPROTEINS | Genes encoding structural ECM glycoproteins |
| 0.1 | 2.0 | PID HEDGEHOG 2PATHWAY | Signaling events mediated by the Hedgehog family |
| 0.1 | 0.4 | PID AR NONGENOMIC PATHWAY | Nongenotropic Androgen signaling |
| 0.1 | 0.4 | SIG CHEMOTAXIS | Genes related to chemotaxis |
| 0.1 | 4.0 | ST ERK1 ERK2 MAPK PATHWAY | ERK1/ERK2 MAPK Pathway |
| 0.1 | 0.3 | PID NFKAPPAB CANONICAL PATHWAY | Canonical NF-kappaB pathway |
| 0.1 | 0.2 | PID ERB GENOMIC PATHWAY | Validated nuclear estrogen receptor beta network |
| 0.1 | 2.2 | PID AMB2 NEUTROPHILS PATHWAY | amb2 Integrin signaling |
| 0.1 | 0.7 | PID ERBB2 ERBB3 PATHWAY | ErbB2/ErbB3 signaling events |
| 0.1 | 1.7 | PID S1P S1P1 PATHWAY | S1P1 pathway |
| 0.1 | 2.1 | ST P38 MAPK PATHWAY | p38 MAPK Pathway |
| 0.1 | 1.0 | PID ECADHERIN KERATINOCYTE PATHWAY | E-cadherin signaling in keratinocytes |
| 0.1 | 4.5 | PID NFAT TFPATHWAY | Calcineurin-regulated NFAT-dependent transcription in lymphocytes |
| 0.1 | 15.5 | NABA ECM AFFILIATED | Genes encoding proteins affiliated structurally or functionally to extracellular matrix proteins |
| 0.1 | 1.0 | PID EPHB FWD PATHWAY | EPHB forward signaling |
| 0.1 | 1.7 | ST WNT BETA CATENIN PATHWAY | Wnt/beta-catenin Pathway |
| 0.1 | 0.2 | PID IFNG PATHWAY | IFN-gamma pathway |
| 0.1 | 1.2 | PID CD8 TCR DOWNSTREAM PATHWAY | Downstream signaling in naïve CD8+ T cells |
| 0.1 | 1.8 | PID ALPHA SYNUCLEIN PATHWAY | Alpha-synuclein signaling |
| 0.1 | 1.1 | PID IL3 PATHWAY | IL3-mediated signaling events |
| 0.0 | 2.7 | PID EPHA FWDPATHWAY | EPHA forward signaling |
| 0.0 | 0.9 | PID P38 MKK3 6PATHWAY | p38 MAPK signaling pathway |
| 0.0 | 2.0 | PID AVB3 OPN PATHWAY | Osteopontin-mediated events |
| 0.0 | 1.6 | PID RHODOPSIN PATHWAY | Visual signal transduction: Rods |
| 0.0 | 0.4 | PID IL23 PATHWAY | IL23-mediated signaling events |
| 0.0 | 0.6 | PID IL8 CXCR1 PATHWAY | IL8- and CXCR1-mediated signaling events |
| 0.0 | 3.0 | PID LKB1 PATHWAY | LKB1 signaling events |
| 0.0 | 1.2 | PID MYC PATHWAY | C-MYC pathway |
| 0.0 | 1.1 | PID FRA PATHWAY | Validated transcriptional targets of AP1 family members Fra1 and Fra2 |
| 0.0 | 0.6 | PID HIF1A PATHWAY | Hypoxic and oxygen homeostasis regulation of HIF-1-alpha |
| 0.0 | 0.9 | PID IL2 STAT5 PATHWAY | IL2 signaling events mediated by STAT5 |
| 0.0 | 0.5 | PID ANGIOPOIETIN RECEPTOR PATHWAY | Angiopoietin receptor Tie2-mediated signaling |
| 0.0 | 0.2 | ST INTERFERON GAMMA PATHWAY | Interferon gamma pathway. |
| 0.0 | 1.1 | PID FGF PATHWAY | FGF signaling pathway |
| 0.0 | 2.1 | PID NFAT 3PATHWAY | Role of Calcineurin-dependent NFAT signaling in lymphocytes |
| 0.0 | 0.3 | PID WNT SIGNALING PATHWAY | Wnt signaling network |
| 0.0 | 3.0 | PID HIF1 TFPATHWAY | HIF-1-alpha transcription factor network |
| 0.0 | 0.6 | PID ARF6 DOWNSTREAM PATHWAY | Arf6 downstream pathway |
| 0.0 | 0.8 | PID TOLL ENDOGENOUS PATHWAY | Endogenous TLR signaling |
| 0.0 | 0.2 | SA B CELL RECEPTOR COMPLEXES | Antigen binding to B cell receptors activates protein tyrosine kinases, such as the Src family, which ultimate activate MAP kinases. |
| 0.0 | 0.5 | SIG IL4RECEPTOR IN B LYPHOCYTES | Genes related to IL4 rceptor signaling in B lymphocytes |
| 0.0 | 0.2 | PID SHP2 PATHWAY | SHP2 signaling |
| 0.0 | 0.3 | ST G ALPHA S PATHWAY | G alpha s Pathway |
| 0.0 | 0.4 | PID P38 ALPHA BETA DOWNSTREAM PATHWAY | Signaling mediated by p38-alpha and p38-beta |
| 0.0 | 0.6 | PID REG GR PATHWAY | Glucocorticoid receptor regulatory network |
| 0.0 | 0.2 | SA PTEN PATHWAY | PTEN is a tumor suppressor that dephosphorylates the lipid messenger phosphatidylinositol triphosphate. |
| 0.0 | 0.1 | PID INTEGRIN3 PATHWAY | Beta3 integrin cell surface interactions |
| 0.0 | 0.4 | PID SMAD2 3PATHWAY | Regulation of cytoplasmic and nuclear SMAD2/3 signaling |
| 0.0 | 0.9 | ST T CELL SIGNAL TRANSDUCTION | T Cell Signal Transduction |
| 0.0 | 0.2 | PID NECTIN PATHWAY | Nectin adhesion pathway |
| 0.0 | 0.2 | PID CONE PATHWAY | Visual signal transduction: Cones |
| 0.0 | 0.7 | PID ARF6 TRAFFICKING PATHWAY | Arf6 trafficking events |
| 0.0 | 1.1 | WNT SIGNALING | Genes related to Wnt-mediated signal transduction |
| 0.0 | 0.1 | PID BETA CATENIN DEG PATHWAY | Degradation of beta catenin |
Gene overrepresentation in C2:CP:REACTOME category:
| Log-likelihood per target | Total log-likelihood | Term | Description |
|---|---|---|---|
| 0.6 | 16.3 | REACTOME ACTIVATION OF THE AP1 FAMILY OF TRANSCRIPTION FACTORS | Genes involved in Activation of the AP-1 family of transcription factors |
| 0.4 | 3.9 | REACTOME GLYCOPROTEIN HORMONES | Genes involved in Glycoprotein hormones |
| 0.4 | 3.8 | REACTOME ENDOSOMAL VACUOLAR PATHWAY | Genes involved in Endosomal/Vacuolar pathway |
| 0.3 | 0.3 | REACTOME CIRCADIAN REPRESSION OF EXPRESSION BY REV ERBA | Genes involved in Circadian Repression of Expression by REV-ERBA |
| 0.3 | 0.3 | REACTOME TRIGLYCERIDE BIOSYNTHESIS | Genes involved in Triglyceride Biosynthesis |
| 0.3 | 9.4 | REACTOME REGULATION OF COMPLEMENT CASCADE | Genes involved in Regulation of Complement cascade |
| 0.3 | 4.9 | REACTOME XENOBIOTICS | Genes involved in Xenobiotics |
| 0.2 | 6.8 | REACTOME ADVANCED GLYCOSYLATION ENDPRODUCT RECEPTOR SIGNALING | Genes involved in Advanced glycosylation endproduct receptor signaling |
| 0.2 | 5.7 | REACTOME REGULATION OF INSULIN LIKE GROWTH FACTOR IGF ACTIVITY BY INSULIN LIKE GROWTH FACTOR BINDING PROTEINS IGFBPS | Genes involved in Regulation of Insulin-like Growth Factor (IGF) Activity by Insulin-like Growth Factor Binding Proteins (IGFBPs) |
| 0.2 | 4.2 | REACTOME EICOSANOID LIGAND BINDING RECEPTORS | Genes involved in Eicosanoid ligand-binding receptors |
| 0.2 | 3.4 | REACTOME FGFR2C LIGAND BINDING AND ACTIVATION | Genes involved in FGFR2c ligand binding and activation |
| 0.2 | 3.5 | REACTOME THE ACTIVATION OF ARYLSULFATASES | Genes involved in The activation of arylsulfatases |
| 0.2 | 2.8 | REACTOME REVERSIBLE HYDRATION OF CARBON DIOXIDE | Genes involved in Reversible Hydration of Carbon Dioxide |
| 0.2 | 15.1 | REACTOME INTERFERON ALPHA BETA SIGNALING | Genes involved in Interferon alpha/beta signaling |
| 0.2 | 2.0 | REACTOME TRAFFICKING AND PROCESSING OF ENDOSOMAL TLR | Genes involved in Trafficking and processing of endosomal TLR |
| 0.2 | 1.5 | REACTOME CS DS DEGRADATION | Genes involved in CS/DS degradation |
| 0.1 | 4.3 | REACTOME FACILITATIVE NA INDEPENDENT GLUCOSE TRANSPORTERS | Genes involved in Facilitative Na+-independent glucose transporters |
| 0.1 | 4.8 | REACTOME OTHER SEMAPHORIN INTERACTIONS | Genes involved in Other semaphorin interactions |
| 0.1 | 0.9 | REACTOME PHOSPHORYLATION OF CD3 AND TCR ZETA CHAINS | Genes involved in Phosphorylation of CD3 and TCR zeta chains |
| 0.1 | 3.7 | REACTOME BMAL1 CLOCK NPAS2 ACTIVATES CIRCADIAN EXPRESSION | Genes involved in BMAL1:CLOCK/NPAS2 Activates Circadian Expression |
| 0.1 | 8.2 | REACTOME COLLAGEN FORMATION | Genes involved in Collagen formation |
| 0.1 | 4.9 | REACTOME GLUTATHIONE CONJUGATION | Genes involved in Glutathione conjugation |
| 0.1 | 2.6 | REACTOME INTRINSIC PATHWAY | Genes involved in Intrinsic Pathway |
| 0.1 | 3.1 | REACTOME GAP JUNCTION ASSEMBLY | Genes involved in Gap junction assembly |
| 0.1 | 4.0 | REACTOME CYTOSOLIC SULFONATION OF SMALL MOLECULES | Genes involved in Cytosolic sulfonation of small molecules |
| 0.1 | 5.7 | REACTOME SULFUR AMINO ACID METABOLISM | Genes involved in Sulfur amino acid metabolism |
| 0.1 | 0.6 | REACTOME KERATAN SULFATE KERATIN METABOLISM | Genes involved in Keratan sulfate/keratin metabolism |
| 0.1 | 3.6 | REACTOME INFLAMMASOMES | Genes involved in Inflammasomes |
| 0.1 | 1.5 | REACTOME MEMBRANE BINDING AND TARGETTING OF GAG PROTEINS | Genes involved in Membrane binding and targetting of GAG proteins |
| 0.1 | 6.8 | REACTOME CHEMOKINE RECEPTORS BIND CHEMOKINES | Genes involved in Chemokine receptors bind chemokines |
| 0.1 | 8.9 | REACTOME RESPIRATORY ELECTRON TRANSPORT | Genes involved in Respiratory electron transport |
| 0.1 | 2.1 | REACTOME SIGNAL ATTENUATION | Genes involved in Signal attenuation |
| 0.1 | 4.3 | REACTOME STEROID HORMONES | Genes involved in Steroid hormones |
| 0.1 | 0.9 | REACTOME NUCLEOTIDE BINDING DOMAIN LEUCINE RICH REPEAT CONTAINING RECEPTOR NLR SIGNALING PATHWAYS | Genes involved in Nucleotide-binding domain, leucine rich repeat containing receptor (NLR) signaling pathways |
| 0.1 | 6.4 | REACTOME INTERFERON GAMMA SIGNALING | Genes involved in Interferon gamma signaling |
| 0.1 | 1.3 | REACTOME ACTIVATION OF IRF3 IRF7 MEDIATED BY TBK1 IKK EPSILON | Genes involved in Activation of IRF3/IRF7 mediated by TBK1/IKK epsilon |
| 0.1 | 2.3 | REACTOME AMINE DERIVED HORMONES | Genes involved in Amine-derived hormones |
| 0.1 | 0.8 | REACTOME RECEPTOR LIGAND BINDING INITIATES THE SECOND PROTEOLYTIC CLEAVAGE OF NOTCH RECEPTOR | Genes involved in Receptor-ligand binding initiates the second proteolytic cleavage of Notch receptor |
| 0.1 | 0.2 | REACTOME NRAGE SIGNALS DEATH THROUGH JNK | Genes involved in NRAGE signals death through JNK |
| 0.1 | 1.8 | REACTOME ORGANIC CATION ANION ZWITTERION TRANSPORT | Genes involved in Organic cation/anion/zwitterion transport |
| 0.1 | 5.9 | REACTOME NCAM1 INTERACTIONS | Genes involved in NCAM1 interactions |
| 0.1 | 0.8 | REACTOME NFKB IS ACTIVATED AND SIGNALS SURVIVAL | Genes involved in NF-kB is activated and signals survival |
| 0.1 | 3.2 | REACTOME GENERATION OF SECOND MESSENGER MOLECULES | Genes involved in Generation of second messenger molecules |
| 0.1 | 1.9 | REACTOME FORMATION OF ATP BY CHEMIOSMOTIC COUPLING | Genes involved in Formation of ATP by chemiosmotic coupling |
| 0.1 | 3.5 | REACTOME A TETRASACCHARIDE LINKER SEQUENCE IS REQUIRED FOR GAG SYNTHESIS | Genes involved in A tetrasaccharide linker sequence is required for GAG synthesis |
| 0.1 | 0.4 | REACTOME HORMONE LIGAND BINDING RECEPTORS | Genes involved in Hormone ligand-binding receptors |
| 0.1 | 2.5 | REACTOME LYSOSOME VESICLE BIOGENESIS | Genes involved in Lysosome Vesicle Biogenesis |
| 0.1 | 0.5 | REACTOME GAMMA CARBOXYLATION TRANSPORT AND AMINO TERMINAL CLEAVAGE OF PROTEINS | Genes involved in Gamma-carboxylation, transport, and amino-terminal cleavage of proteins |
| 0.1 | 0.7 | REACTOME TRAF6 MEDIATED IRF7 ACTIVATION IN TLR7 8 OR 9 SIGNALING | Genes involved in TRAF6 mediated IRF7 activation in TLR7/8 or 9 signaling |
| 0.1 | 11.7 | REACTOME PEPTIDE CHAIN ELONGATION | Genes involved in Peptide chain elongation |
| 0.1 | 1.2 | REACTOME SYNTHESIS OF SUBSTRATES IN N GLYCAN BIOSYTHESIS | Genes involved in Synthesis of substrates in N-glycan biosythesis |
| 0.1 | 1.1 | REACTOME PASSIVE TRANSPORT BY AQUAPORINS | Genes involved in Passive Transport by Aquaporins |
| 0.1 | 1.9 | REACTOME TGF BETA RECEPTOR SIGNALING IN EMT EPITHELIAL TO MESENCHYMAL TRANSITION | Genes involved in TGF-beta receptor signaling in EMT (epithelial to mesenchymal transition) |
| 0.1 | 4.1 | REACTOME ADHERENS JUNCTIONS INTERACTIONS | Genes involved in Adherens junctions interactions |
| 0.1 | 1.3 | REACTOME APOPTOTIC CLEAVAGE OF CELL ADHESION PROTEINS | Genes involved in Apoptotic cleavage of cell adhesion proteins |
| 0.1 | 1.3 | REACTOME ETHANOL OXIDATION | Genes involved in Ethanol oxidation |
| 0.1 | 3.1 | REACTOME CELL CELL JUNCTION ORGANIZATION | Genes involved in Cell-cell junction organization |
| 0.1 | 1.8 | REACTOME ACTIVATION OF RAC | Genes involved in Activation of Rac |
| 0.1 | 1.9 | REACTOME HS GAG BIOSYNTHESIS | Genes involved in HS-GAG biosynthesis |
| 0.1 | 1.7 | REACTOME PROLACTIN RECEPTOR SIGNALING | Genes involved in Prolactin receptor signaling |
| 0.1 | 0.9 | REACTOME TANDEM PORE DOMAIN POTASSIUM CHANNELS | Genes involved in Tandem pore domain potassium channels |
| 0.1 | 6.1 | REACTOME O LINKED GLYCOSYLATION OF MUCINS | Genes involved in O-linked glycosylation of mucins |
| 0.1 | 1.3 | REACTOME BILE SALT AND ORGANIC ANION SLC TRANSPORTERS | Genes involved in Bile salt and organic anion SLC transporters |
| 0.1 | 0.3 | REACTOME DESTABILIZATION OF MRNA BY BRF1 | Genes involved in Destabilization of mRNA by Butyrate Response Factor 1 (BRF1) |
| 0.1 | 1.2 | REACTOME LATENT INFECTION OF HOMO SAPIENS WITH MYCOBACTERIUM TUBERCULOSIS | Genes involved in Latent infection of Homo sapiens with Mycobacterium tuberculosis |
| 0.1 | 2.9 | REACTOME INHIBITION OF VOLTAGE GATED CA2 CHANNELS VIA GBETA GAMMA SUBUNITS | Genes involved in Inhibition of voltage gated Ca2+ channels via Gbeta/gamma subunits |
| 0.1 | 1.1 | REACTOME COMPLEMENT CASCADE | Genes involved in Complement cascade |
| 0.1 | 1.4 | REACTOME SYNTHESIS SECRETION AND INACTIVATION OF GIP | Genes involved in Synthesis, Secretion, and Inactivation of Glucose-dependent Insulinotropic Polypeptide (GIP) |
| 0.1 | 1.4 | REACTOME PRE NOTCH PROCESSING IN GOLGI | Genes involved in Pre-NOTCH Processing in Golgi |
| 0.1 | 0.8 | REACTOME COMMON PATHWAY | Genes involved in Common Pathway |
| 0.1 | 4.2 | REACTOME IMMUNOREGULATORY INTERACTIONS BETWEEN A LYMPHOID AND A NON LYMPHOID CELL | Genes involved in Immunoregulatory interactions between a Lymphoid and a non-Lymphoid cell |
| 0.1 | 1.1 | REACTOME MITOCHONDRIAL FATTY ACID BETA OXIDATION | Genes involved in Mitochondrial Fatty Acid Beta-Oxidation |
| 0.1 | 6.7 | REACTOME PEPTIDE LIGAND BINDING RECEPTORS | Genes involved in Peptide ligand-binding receptors |
| 0.0 | 1.5 | REACTOME GLUCURONIDATION | Genes involved in Glucuronidation |
| 0.0 | 0.2 | REACTOME ACYL CHAIN REMODELLING OF PI | Genes involved in Acyl chain remodelling of PI |
| 0.0 | 0.7 | REACTOME PRESYNAPTIC NICOTINIC ACETYLCHOLINE RECEPTORS | Genes involved in Presynaptic nicotinic acetylcholine receptors |
| 0.0 | 2.8 | REACTOME PIP3 ACTIVATES AKT SIGNALING | Genes involved in PIP3 activates AKT signaling |
| 0.0 | 0.5 | REACTOME ROLE OF SECOND MESSENGERS IN NETRIN1 SIGNALING | Genes involved in Role of second messengers in netrin-1 signaling |
| 0.0 | 0.8 | REACTOME RECYCLING OF BILE ACIDS AND SALTS | Genes involved in Recycling of bile acids and salts |
| 0.0 | 0.3 | REACTOME SIGNALING BY WNT | Genes involved in Signaling by Wnt |
| 0.0 | 1.6 | REACTOME TRANSFERRIN ENDOCYTOSIS AND RECYCLING | Genes involved in Transferrin endocytosis and recycling |
| 0.0 | 0.5 | REACTOME DSCAM INTERACTIONS | Genes involved in DSCAM interactions |
| 0.0 | 0.2 | REACTOME G BETA GAMMA SIGNALLING THROUGH PLC BETA | Genes involved in G beta:gamma signalling through PLC beta |
| 0.0 | 0.7 | REACTOME BASE FREE SUGAR PHOSPHATE REMOVAL VIA THE SINGLE NUCLEOTIDE REPLACEMENT PATHWAY | Genes involved in Base-free sugar-phosphate removal via the single-nucleotide replacement pathway |
| 0.0 | 0.1 | REACTOME SIGNALING BY CONSTITUTIVELY ACTIVE EGFR | Genes involved in Signaling by constitutively active EGFR |
| 0.0 | 2.5 | REACTOME GLUCONEOGENESIS | Genes involved in Gluconeogenesis |
| 0.0 | 2.7 | REACTOME AMYLOIDS | Genes involved in Amyloids |
| 0.0 | 1.8 | REACTOME NITRIC OXIDE STIMULATES GUANYLATE CYCLASE | Genes involved in Nitric oxide stimulates guanylate cyclase |
| 0.0 | 0.4 | REACTOME PTM GAMMA CARBOXYLATION HYPUSINE FORMATION AND ARYLSULFATASE ACTIVATION | Genes involved in PTM: gamma carboxylation, hypusine formation and arylsulfatase activation |
| 0.0 | 0.2 | REACTOME SYNTHESIS SECRETION AND DEACYLATION OF GHRELIN | Genes involved in Synthesis, Secretion, and Deacylation of Ghrelin |
| 0.0 | 0.8 | REACTOME EXTRACELLULAR MATRIX ORGANIZATION | Genes involved in Extracellular matrix organization |
| 0.0 | 1.3 | REACTOME SYNTHESIS OF PA | Genes involved in Synthesis of PA |
| 0.0 | 1.4 | REACTOME SIGNALING BY NOTCH1 | Genes involved in Signaling by NOTCH1 |
| 0.0 | 0.2 | REACTOME OPSINS | Genes involved in Opsins |
| 0.0 | 1.5 | REACTOME CELL JUNCTION ORGANIZATION | Genes involved in Cell junction organization |
| 0.0 | 0.8 | REACTOME TRANSCRIPTIONAL REGULATION OF WHITE ADIPOCYTE DIFFERENTIATION | Genes involved in Transcriptional Regulation of White Adipocyte Differentiation |
| 0.0 | 0.5 | REACTOME SEMA3A PLEXIN REPULSION SIGNALING BY INHIBITING INTEGRIN ADHESION | Genes involved in SEMA3A-Plexin repulsion signaling by inhibiting Integrin adhesion |
| 0.0 | 0.8 | REACTOME AMINE LIGAND BINDING RECEPTORS | Genes involved in Amine ligand-binding receptors |
| 0.0 | 0.7 | REACTOME SYNTHESIS OF PC | Genes involved in Synthesis of PC |
| 0.0 | 0.0 | REACTOME TRANSPORT OF MATURE MRNA DERIVED FROM AN INTRONLESS TRANSCRIPT | Genes involved in Transport of Mature mRNA Derived from an Intronless Transcript |
| 0.0 | 0.1 | REACTOME ACTIVATED POINT MUTANTS OF FGFR2 | Genes involved in Activated point mutants of FGFR2 |
| 0.0 | 0.9 | REACTOME SEMA4D IN SEMAPHORIN SIGNALING | Genes involved in Sema4D in semaphorin signaling |
| 0.0 | 0.1 | REACTOME APOBEC3G MEDIATED RESISTANCE TO HIV1 INFECTION | Genes involved in APOBEC3G mediated resistance to HIV-1 infection |
| 0.0 | 0.5 | REACTOME PROTEOLYTIC CLEAVAGE OF SNARE COMPLEX PROTEINS | Genes involved in Proteolytic cleavage of SNARE complex proteins |
| 0.0 | 1.5 | REACTOME OLFACTORY SIGNALING PATHWAY | Genes involved in Olfactory Signaling Pathway |
| 0.0 | 0.3 | REACTOME CLASS C 3 METABOTROPIC GLUTAMATE PHEROMONE RECEPTORS | Genes involved in Class C/3 (Metabotropic glutamate/pheromone receptors) |
| 0.0 | 0.8 | REACTOME IL1 SIGNALING | Genes involved in Interleukin-1 signaling |
| 0.0 | 2.8 | REACTOME TRANSPORT OF INORGANIC CATIONS ANIONS AND AMINO ACIDS OLIGOPEPTIDES | Genes involved in Transport of inorganic cations/anions and amino acids/oligopeptides |
| 0.0 | 0.3 | REACTOME MRNA DECAY BY 5 TO 3 EXORIBONUCLEASE | Genes involved in mRNA Decay by 5' to 3' Exoribonuclease |
| 0.0 | 0.4 | REACTOME IL 7 SIGNALING | Genes involved in Interleukin-7 signaling |
| 0.0 | 0.6 | REACTOME EFFECTS OF PIP2 HYDROLYSIS | Genes involved in Effects of PIP2 hydrolysis |
| 0.0 | 0.1 | REACTOME ACYL CHAIN REMODELLING OF PG | Genes involved in Acyl chain remodelling of PG |
| 0.0 | 0.2 | REACTOME IL RECEPTOR SHC SIGNALING | Genes involved in Interleukin receptor SHC signaling |
| 0.0 | 0.1 | REACTOME ACTIVATED AMPK STIMULATES FATTY ACID OXIDATION IN MUSCLE | Genes involved in Activated AMPK stimulates fatty-acid oxidation in muscle |
| 0.0 | 0.1 | REACTOME CD28 DEPENDENT VAV1 PATHWAY | Genes involved in CD28 dependent Vav1 pathway |
| 0.0 | 0.4 | REACTOME PROCESSING OF INTRONLESS PRE MRNAS | Genes involved in Processing of Intronless Pre-mRNAs |
| 0.0 | 0.1 | REACTOME DOWNSTREAM TCR SIGNALING | Genes involved in Downstream TCR signaling |