Project
SARS-CoV-2 Analysis Results (GEO series: GSE147507)
Navigation
Downloads
Results for PBX2
Z-value: 0.27
Motif logo
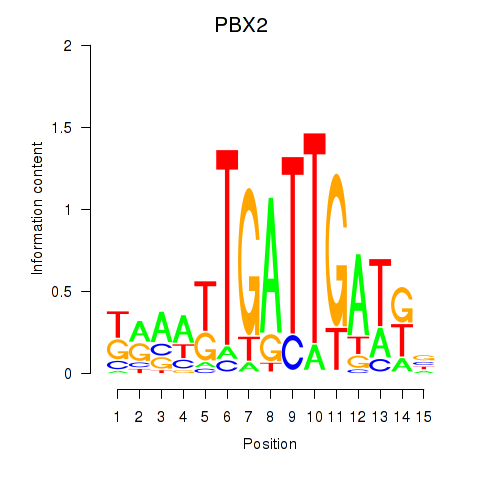
Transcription factors associated with PBX2
| Gene Symbol | Gene ID | Gene Info |
|---|---|---|
|
PBX2
|
ENSG00000204304.7 | PBX homeobox 2 |
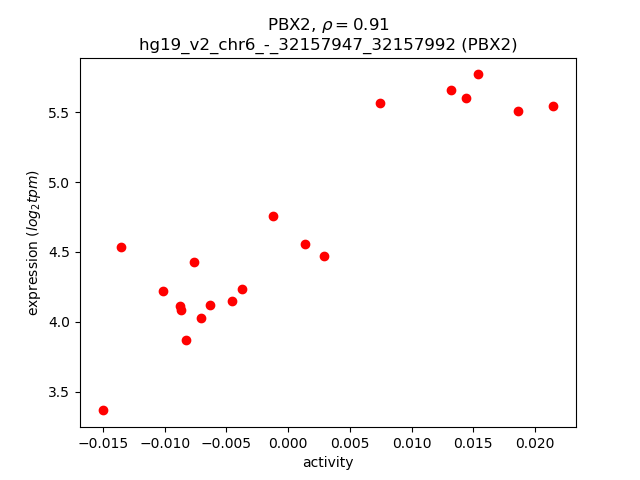
Activity-expression correlation:
| Gene | Promoter | Pearson corr. coef. | P-value | Plot |
|---|---|---|---|---|
| PBX2 | hg19_v2_chr6_-_32157947_32157992 | 0.91 | 2.3e-08 | Click! |
Activity profile of PBX2 motif
Sorted Z-values of PBX2 motif
| Promoter | Log-likelihood | Transcript | Gene | Gene Info |
|---|---|---|---|---|
| chr12_-_28124903 | 1.79 |
ENST00000395872.1
ENST00000354417.3 ENST00000201015.4 |
PTHLH
|
parathyroid hormone-like hormone |
| chr12_-_28125638 | 1.72 |
ENST00000545234.1
|
PTHLH
|
parathyroid hormone-like hormone |
| chr2_+_234104079 | 0.78 |
ENST00000417661.1
|
INPP5D
|
inositol polyphosphate-5-phosphatase, 145kDa |
| chr2_-_31440377 | 0.69 |
ENST00000444918.2
ENST00000403897.3 |
CAPN14
|
calpain 14 |
| chr2_+_12857043 | 0.63 |
ENST00000381465.2
|
TRIB2
|
tribbles pseudokinase 2 |
| chrM_+_12331 | 0.59 |
ENST00000361567.2
|
MT-ND5
|
mitochondrially encoded NADH dehydrogenase 5 |
| chr2_+_12857015 | 0.58 |
ENST00000155926.4
|
TRIB2
|
tribbles pseudokinase 2 |
| chr11_-_111794446 | 0.56 |
ENST00000527950.1
|
CRYAB
|
crystallin, alpha B |
| chr14_-_23624511 | 0.47 |
ENST00000529705.2
|
SLC7A8
|
solute carrier family 7 (amino acid transporter light chain, L system), member 8 |
| chr17_+_7758374 | 0.45 |
ENST00000301599.6
ENST00000574668.1 |
TMEM88
|
transmembrane protein 88 |
| chr2_+_234602305 | 0.35 |
ENST00000406651.1
|
UGT1A6
|
UDP glucuronosyltransferase 1 family, polypeptide A6 |
| chr2_+_234601512 | 0.30 |
ENST00000305139.6
|
UGT1A6
|
UDP glucuronosyltransferase 1 family, polypeptide A6 |
| chr10_-_45474237 | 0.25 |
ENST00000448778.1
ENST00000298295.3 |
C10orf10
|
chromosome 10 open reading frame 10 |
| chr1_+_101702417 | 0.25 |
ENST00000305352.6
|
S1PR1
|
sphingosine-1-phosphate receptor 1 |
| chr11_+_68228186 | 0.21 |
ENST00000393799.2
ENST00000393800.2 ENST00000528635.1 ENST00000533127.1 ENST00000529907.1 ENST00000529344.1 ENST00000534534.1 ENST00000524845.1 ENST00000265637.4 ENST00000524904.1 ENST00000393801.3 ENST00000265636.5 ENST00000529710.1 |
PPP6R3
|
protein phosphatase 6, regulatory subunit 3 |
| chr3_-_47932759 | 0.20 |
ENST00000441748.2
ENST00000335271.5 |
MAP4
|
microtubule-associated protein 4 |
| chr2_+_113033164 | 0.20 |
ENST00000409871.1
ENST00000343936.4 |
ZC3H6
|
zinc finger CCCH-type containing 6 |
| chr11_-_2162162 | 0.17 |
ENST00000381389.1
|
IGF2
|
insulin-like growth factor 2 (somatomedin A) |
| chrX_+_46696372 | 0.16 |
ENST00000218340.3
|
RP2
|
retinitis pigmentosa 2 (X-linked recessive) |
| chr7_+_134528635 | 0.15 |
ENST00000445569.2
|
CALD1
|
caldesmon 1 |
| chr14_+_58765103 | 0.14 |
ENST00000355431.3
ENST00000348476.3 ENST00000395168.3 |
ARID4A
|
AT rich interactive domain 4A (RBP1-like) |
| chr11_+_69455855 | 0.13 |
ENST00000227507.2
ENST00000536559.1 |
CCND1
|
cyclin D1 |
| chr1_+_62417957 | 0.13 |
ENST00000307297.7
ENST00000543708.1 |
INADL
|
InaD-like (Drosophila) |
| chr12_+_53835383 | 0.13 |
ENST00000429243.2
|
PRR13
|
proline rich 13 |
| chr7_-_112727774 | 0.13 |
ENST00000297146.3
ENST00000501255.2 |
GPR85
|
G protein-coupled receptor 85 |
| chr12_+_53835425 | 0.12 |
ENST00000549924.1
|
PRR13
|
proline rich 13 |
| chr4_-_100065440 | 0.12 |
ENST00000508393.1
ENST00000265512.7 |
ADH4
|
alcohol dehydrogenase 4 (class II), pi polypeptide |
| chr12_+_53835539 | 0.11 |
ENST00000547368.1
ENST00000379786.4 ENST00000551945.1 |
PRR13
|
proline rich 13 |
| chr13_-_107220455 | 0.10 |
ENST00000400198.3
|
ARGLU1
|
arginine and glutamate rich 1 |
| chr10_+_47894572 | 0.10 |
ENST00000355876.5
|
FAM21B
|
family with sequence similarity 21, member B |
| chr1_-_115323245 | 0.10 |
ENST00000060969.5
ENST00000369528.5 |
SIKE1
|
suppressor of IKBKE 1 |
| chr5_-_39462390 | 0.09 |
ENST00000511792.1
|
DAB2
|
Dab, mitogen-responsive phosphoprotein, homolog 2 (Drosophila) |
| chr18_-_72920372 | 0.08 |
ENST00000581620.1
ENST00000582437.1 |
ZADH2
|
zinc binding alcohol dehydrogenase domain containing 2 |
| chr7_-_33140498 | 0.08 |
ENST00000448915.1
|
RP9
|
retinitis pigmentosa 9 (autosomal dominant) |
| chr14_+_58765305 | 0.07 |
ENST00000445108.1
|
ARID4A
|
AT rich interactive domain 4A (RBP1-like) |
| chr3_-_129158676 | 0.06 |
ENST00000393278.2
|
MBD4
|
methyl-CpG binding domain protein 4 |
| chr3_-_112013071 | 0.06 |
ENST00000487372.1
ENST00000486574.1 ENST00000305815.5 |
SLC9C1
|
solute carrier family 9, subfamily C (Na+-transporting carboxylic acid decarboxylase), member 1 |
| chr3_+_188889737 | 0.06 |
ENST00000345063.3
|
TPRG1
|
tumor protein p63 regulated 1 |
| chr2_+_204732487 | 0.05 |
ENST00000302823.3
|
CTLA4
|
cytotoxic T-lymphocyte-associated protein 4 |
| chr14_+_38033252 | 0.04 |
ENST00000554829.1
|
RP11-356O9.1
|
RP11-356O9.1 |
| chr16_-_11492366 | 0.03 |
ENST00000595360.1
|
CTD-3088G3.8
|
Protein LOC388210 |
| chr6_+_53976211 | 0.02 |
ENST00000503951.1
|
MLIP
|
muscular LMNA-interacting protein |
| chr4_-_100065419 | 0.01 |
ENST00000504125.1
ENST00000505590.1 |
ADH4
|
alcohol dehydrogenase 4 (class II), pi polypeptide |
| chr3_+_120626919 | 0.01 |
ENST00000273666.6
ENST00000471454.1 ENST00000472879.1 ENST00000497029.1 ENST00000492541.1 |
STXBP5L
|
syntaxin binding protein 5-like |
| chr4_-_100065389 | 0.00 |
ENST00000512499.1
|
ADH4
|
alcohol dehydrogenase 4 (class II), pi polypeptide |
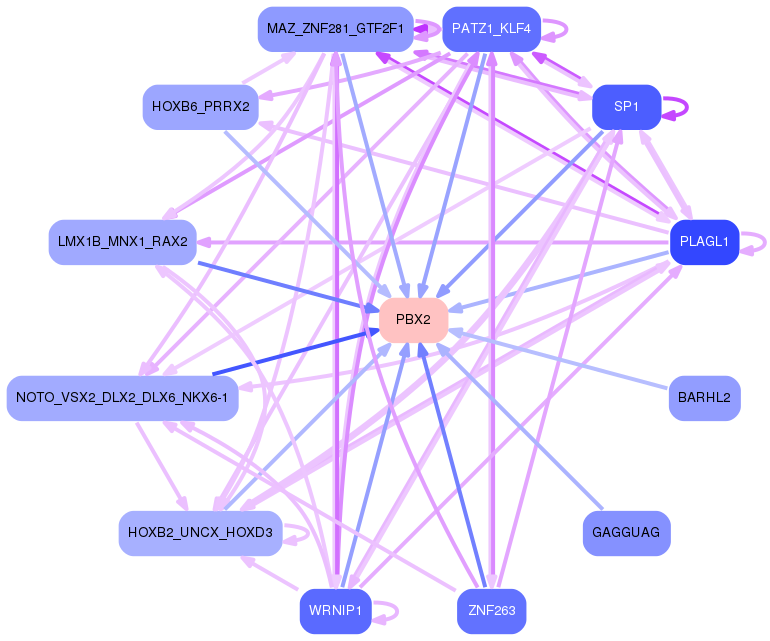
Network of associatons between targets according to the STRING database.

First level regulatory network of PBX2
Gene Ontology Analysis
Gene overrepresentation in biological_process category:
| Log-likelihood per target | Total log-likelihood | Term | Description |
|---|---|---|---|
| 0.4 | 1.2 | GO:0045081 | negative regulation of interleukin-10 biosynthetic process(GO:0045081) |
| 0.2 | 0.8 | GO:0045658 | regulation of neutrophil differentiation(GO:0045658) negative regulation of neutrophil differentiation(GO:0045659) |
| 0.1 | 3.5 | GO:0032331 | negative regulation of chondrocyte differentiation(GO:0032331) |
| 0.1 | 0.2 | GO:0003245 | cardiac muscle tissue growth involved in heart morphogenesis(GO:0003245) |
| 0.1 | 0.2 | GO:0007023 | post-chaperonin tubulin folding pathway(GO:0007023) |
| 0.1 | 0.7 | GO:0052697 | flavonoid glucuronidation(GO:0052696) xenobiotic glucuronidation(GO:0052697) |
| 0.0 | 0.2 | GO:0097368 | establishment of Sertoli cell barrier(GO:0097368) |
| 0.0 | 0.2 | GO:0051012 | microtubule sliding(GO:0051012) |
| 0.0 | 0.6 | GO:0007021 | tubulin complex assembly(GO:0007021) |
| 0.0 | 0.2 | GO:2000467 | insulin receptor signaling pathway via phosphatidylinositol 3-kinase(GO:0038028) positive regulation of glycogen (starch) synthase activity(GO:2000467) |
| 0.0 | 0.1 | GO:0035026 | leading edge cell differentiation(GO:0035026) |
| 0.0 | 0.5 | GO:0015695 | organic cation transport(GO:0015695) |
| 0.0 | 0.0 | GO:0045590 | negative regulation of regulatory T cell differentiation(GO:0045590) |
Gene overrepresentation in cellular_component category:
| Log-likelihood per target | Total log-likelihood | Term | Description |
|---|---|---|---|
| 0.0 | 0.2 | GO:1990075 | periciliary membrane compartment(GO:1990075) |
| 0.0 | 0.6 | GO:0097512 | cardiac myofibril(GO:0097512) |
Gene overrepresentation in molecular_function category:
| Log-likelihood per target | Total log-likelihood | Term | Description |
|---|---|---|---|
| 0.1 | 0.8 | GO:0016314 | phosphatidylinositol-3,4,5-trisphosphate 3-phosphatase activity(GO:0016314) |
| 0.1 | 3.5 | GO:0051428 | peptide hormone receptor binding(GO:0051428) |
| 0.1 | 1.2 | GO:0055106 | ubiquitin-protein transferase regulator activity(GO:0055106) |
| 0.0 | 0.1 | GO:0019115 | benzaldehyde dehydrogenase activity(GO:0019115) |
| 0.0 | 0.5 | GO:0019534 | toxin transporter activity(GO:0019534) |
| 0.0 | 0.6 | GO:0005212 | structural constituent of eye lens(GO:0005212) |
| 0.0 | 0.2 | GO:0038036 | sphingosine-1-phosphate receptor activity(GO:0038036) |
| 0.0 | 0.7 | GO:0004198 | calcium-dependent cysteine-type endopeptidase activity(GO:0004198) |
| 0.0 | 0.7 | GO:0001972 | retinoic acid binding(GO:0001972) |
| 0.0 | 0.1 | GO:0047522 | 13-prostaglandin reductase activity(GO:0036132) 15-oxoprostaglandin 13-oxidase activity(GO:0047522) |
Gene overrepresentation in C2:CP category:
| Log-likelihood per target | Total log-likelihood | Term | Description |
|---|---|---|---|
| 0.1 | 3.5 | PID HEDGEHOG 2PATHWAY | Signaling events mediated by the Hedgehog family |
| 0.0 | 0.8 | ST INTERLEUKIN 4 PATHWAY | Interleukin 4 (IL-4) Pathway |
Gene overrepresentation in C2:CP:REACTOME category:
| Log-likelihood per target | Total log-likelihood | Term | Description |
|---|---|---|---|
| 0.0 | 3.5 | REACTOME CLASS B 2 SECRETIN FAMILY RECEPTORS | Genes involved in Class B/2 (Secretin family receptors) |
| 0.0 | 0.7 | REACTOME GLUCURONIDATION | Genes involved in Glucuronidation |