Project
avrg: SARS-CoV-2 Analysis Results (GEO series: GSE147507)
Navigation
Downloads
Results for PBX2
Z-value: 0.41
Motif logo
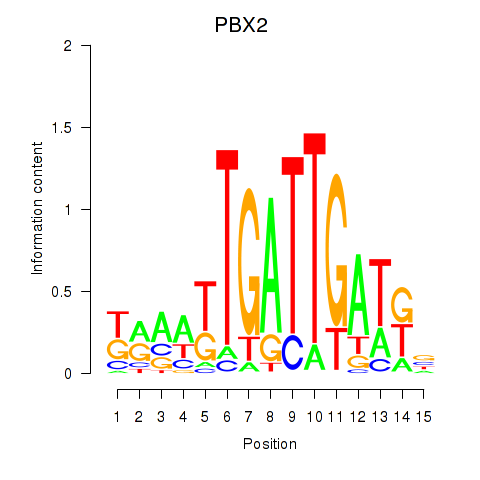
Transcription factors associated with PBX2
| Gene Symbol | Gene ID | Gene Info |
|---|---|---|
|
PBX2
|
ENSG00000204304.7 | PBX homeobox 2 |
Activity-expression correlation:
| Gene | Promoter | Pearson corr. coef. | P-value | Plot |
|---|---|---|---|---|
| PBX2 | hg19_v2_chr6_-_32157947_32157992 | 0.91 | 2.3e-08 | Click! |
Activity profile of PBX2 motif
Sorted Z-values of PBX2 motif
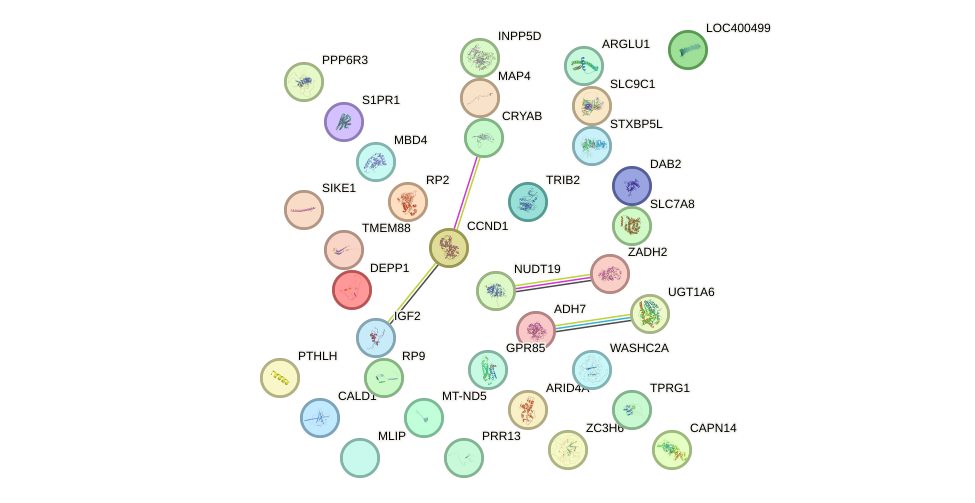
Network of associatons between targets according to the STRING database.
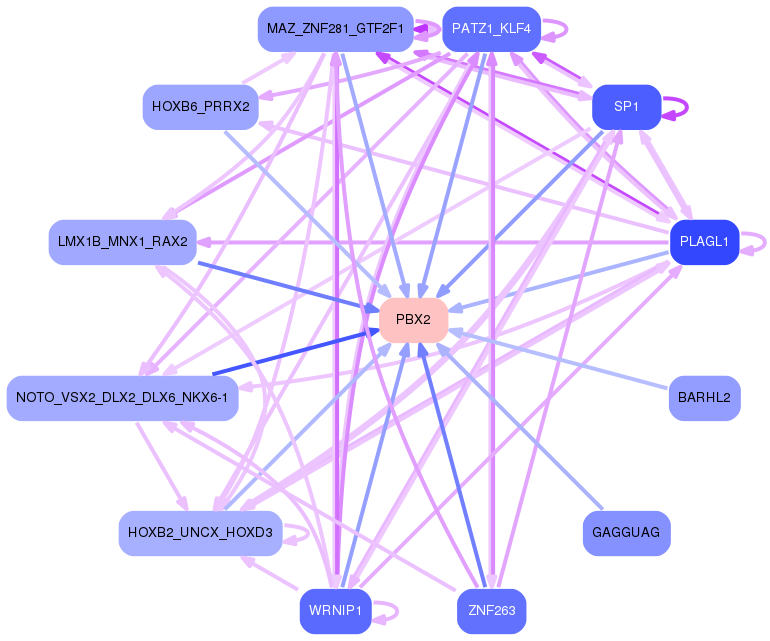
First level regulatory network of PBX2
Gene Ontology Analysis
Gene overrepresentation in biological_process category:
| Log-likelihood per target | Total log-likelihood | Term | Description |
|---|---|---|---|
| 0.4 | 1.2 | GO:0045081 | negative regulation of interleukin-10 biosynthetic process(GO:0045081) |
| 0.2 | 0.8 | GO:0045658 | regulation of neutrophil differentiation(GO:0045658) negative regulation of neutrophil differentiation(GO:0045659) |
| 0.1 | 3.5 | GO:0032331 | negative regulation of chondrocyte differentiation(GO:0032331) |
| 0.1 | 0.2 | GO:0003245 | cardiac muscle tissue growth involved in heart morphogenesis(GO:0003245) |
| 0.1 | 0.2 | GO:0007023 | post-chaperonin tubulin folding pathway(GO:0007023) |
| 0.1 | 0.7 | GO:0052697 | flavonoid glucuronidation(GO:0052696) xenobiotic glucuronidation(GO:0052697) |
| 0.0 | 0.2 | GO:0097368 | establishment of Sertoli cell barrier(GO:0097368) |
| 0.0 | 0.2 | GO:0051012 | microtubule sliding(GO:0051012) |
| 0.0 | 0.6 | GO:0007021 | tubulin complex assembly(GO:0007021) |
| 0.0 | 0.2 | GO:2000467 | insulin receptor signaling pathway via phosphatidylinositol 3-kinase(GO:0038028) positive regulation of glycogen (starch) synthase activity(GO:2000467) |
| 0.0 | 0.1 | GO:0035026 | leading edge cell differentiation(GO:0035026) |
| 0.0 | 0.5 | GO:0015695 | organic cation transport(GO:0015695) |
| 0.0 | 0.0 | GO:0045590 | negative regulation of regulatory T cell differentiation(GO:0045590) |
Gene overrepresentation in cellular_component category:
| Log-likelihood per target | Total log-likelihood | Term | Description |
|---|---|---|---|
| 0.0 | 0.2 | GO:1990075 | periciliary membrane compartment(GO:1990075) |
| 0.0 | 0.6 | GO:0097512 | cardiac myofibril(GO:0097512) |
Gene overrepresentation in molecular_function category:
| Log-likelihood per target | Total log-likelihood | Term | Description |
|---|---|---|---|
| 0.1 | 0.8 | GO:0016314 | phosphatidylinositol-3,4,5-trisphosphate 3-phosphatase activity(GO:0016314) |
| 0.1 | 3.5 | GO:0051428 | peptide hormone receptor binding(GO:0051428) |
| 0.1 | 1.2 | GO:0055106 | ubiquitin-protein transferase regulator activity(GO:0055106) |
| 0.0 | 0.1 | GO:0019115 | benzaldehyde dehydrogenase activity(GO:0019115) |
| 0.0 | 0.5 | GO:0019534 | toxin transporter activity(GO:0019534) |
| 0.0 | 0.6 | GO:0005212 | structural constituent of eye lens(GO:0005212) |
| 0.0 | 0.2 | GO:0038036 | sphingosine-1-phosphate receptor activity(GO:0038036) |
| 0.0 | 0.7 | GO:0004198 | calcium-dependent cysteine-type endopeptidase activity(GO:0004198) |
| 0.0 | 0.7 | GO:0001972 | retinoic acid binding(GO:0001972) |
| 0.0 | 0.1 | GO:0047522 | 13-prostaglandin reductase activity(GO:0036132) 15-oxoprostaglandin 13-oxidase activity(GO:0047522) |
Gene overrepresentation in C2:CP category:
| Log-likelihood per target | Total log-likelihood | Term | Description |
|---|---|---|---|
| 0.1 | 3.5 | PID HEDGEHOG 2PATHWAY | Signaling events mediated by the Hedgehog family |
| 0.0 | 0.8 | ST INTERLEUKIN 4 PATHWAY | Interleukin 4 (IL-4) Pathway |
Gene overrepresentation in C2:CP:REACTOME category:
| Log-likelihood per target | Total log-likelihood | Term | Description |
|---|---|---|---|
| 0.0 | 3.5 | REACTOME CLASS B 2 SECRETIN FAMILY RECEPTORS | Genes involved in Class B/2 (Secretin family receptors) |
| 0.0 | 0.7 | REACTOME GLUCURONIDATION | Genes involved in Glucuronidation |