Project
avrg: SARS-CoV-2 Analysis Results (GEO series: GSE147507)
Navigation
Downloads
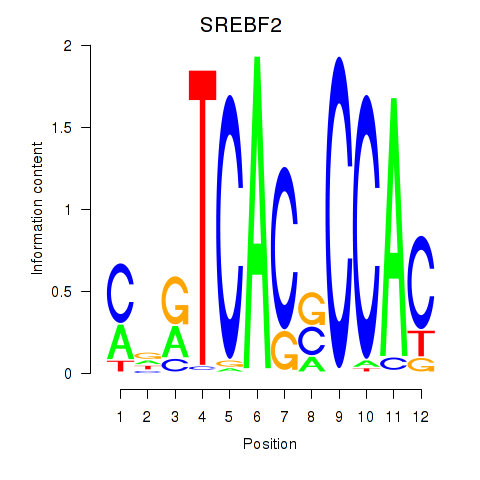
Results for SREBF2
Z-value: 1.38
Motif logo
Transcription factors associated with SREBF2
| Gene Symbol | Gene ID | Gene Info |
|---|---|---|
|
SREBF2
|
ENSG00000198911.7 | sterol regulatory element binding transcription factor 2 |
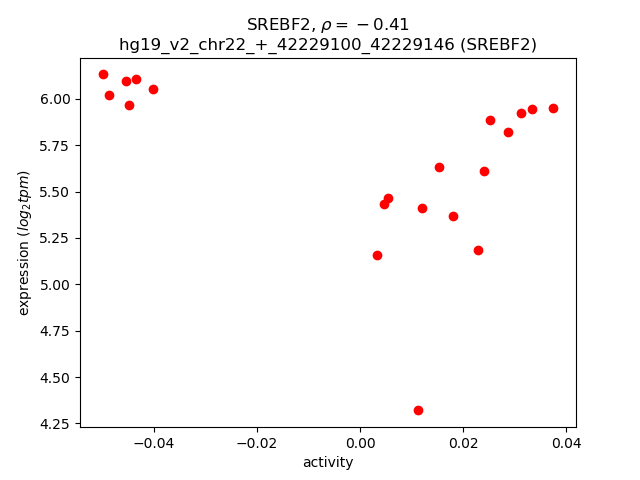
Activity-expression correlation:
| Gene | Promoter | Pearson corr. coef. | P-value | Plot |
|---|---|---|---|---|
| SREBF2 | hg19_v2_chr22_+_42229100_42229146 | -0.41 | 7.6e-02 | Click! |
Activity profile of SREBF2 motif
Sorted Z-values of SREBF2 motif
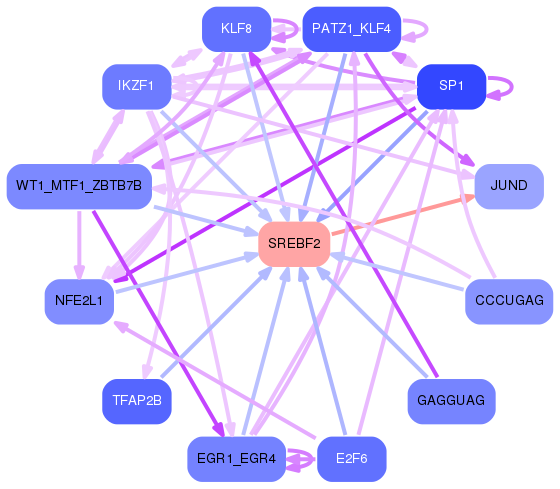
Network of associatons between targets according to the STRING database.

First level regulatory network of SREBF2
Gene Ontology Analysis
Gene overrepresentation in biological_process category:
| Log-likelihood per target | Total log-likelihood | Term | Description |
|---|---|---|---|
| 0.6 | 5.3 | GO:0046618 | drug export(GO:0046618) |
| 0.5 | 8.4 | GO:0051599 | response to hydrostatic pressure(GO:0051599) |
| 0.5 | 1.9 | GO:1900154 | regulation of bone trabecula formation(GO:1900154) negative regulation of bone trabecula formation(GO:1900155) |
| 0.3 | 2.0 | GO:0019541 | acetate biosynthetic process(GO:0019413) acetyl-CoA biosynthetic process from acetate(GO:0019427) propionate metabolic process(GO:0019541) propionate biosynthetic process(GO:0019542) |
| 0.3 | 1.0 | GO:2000646 | positive regulation of receptor catabolic process(GO:2000646) |
| 0.3 | 0.9 | GO:0070563 | negative regulation of vitamin D receptor signaling pathway(GO:0070563) |
| 0.3 | 3.6 | GO:0014722 | regulation of skeletal muscle contraction by calcium ion signaling(GO:0014722) |
| 0.2 | 0.9 | GO:0050916 | sensory perception of sweet taste(GO:0050916) |
| 0.2 | 0.7 | GO:0060981 | cell migration involved in coronary angiogenesis(GO:0060981) |
| 0.2 | 1.4 | GO:0097428 | protein maturation by iron-sulfur cluster transfer(GO:0097428) |
| 0.1 | 1.0 | GO:0048165 | ovarian cumulus expansion(GO:0001550) fused antrum stage(GO:0048165) |
| 0.1 | 2.1 | GO:0010739 | positive regulation of protein kinase A signaling(GO:0010739) |
| 0.1 | 3.8 | GO:0032060 | bleb assembly(GO:0032060) |
| 0.1 | 0.1 | GO:0030908 | intein-mediated protein splicing(GO:0016539) protein splicing(GO:0030908) |
| 0.1 | 1.2 | GO:0030043 | actin filament fragmentation(GO:0030043) |
| 0.1 | 0.9 | GO:0010032 | meiotic chromosome condensation(GO:0010032) |
| 0.1 | 1.3 | GO:0006107 | oxaloacetate metabolic process(GO:0006107) |
| 0.1 | 0.8 | GO:0033689 | negative regulation of osteoblast proliferation(GO:0033689) |
| 0.0 | 1.9 | GO:0002076 | osteoblast development(GO:0002076) |
| 0.0 | 0.3 | GO:0035026 | leading edge cell differentiation(GO:0035026) |
| 0.0 | 2.7 | GO:0035735 | intraciliary transport involved in cilium morphogenesis(GO:0035735) |
| 0.0 | 1.0 | GO:0000028 | ribosomal small subunit assembly(GO:0000028) |
| 0.0 | 0.3 | GO:0007023 | post-chaperonin tubulin folding pathway(GO:0007023) |
| 0.0 | 0.3 | GO:2000189 | positive regulation of cholesterol homeostasis(GO:2000189) |
| 0.0 | 0.4 | GO:0048251 | elastic fiber assembly(GO:0048251) |
| 0.0 | 0.2 | GO:0019747 | regulation of isoprenoid metabolic process(GO:0019747) |
| 0.0 | 1.2 | GO:0006735 | NADH regeneration(GO:0006735) canonical glycolysis(GO:0061621) glucose catabolic process to pyruvate(GO:0061718) |
| 0.0 | 0.2 | GO:0032534 | regulation of microvillus assembly(GO:0032534) |
| 0.0 | 0.3 | GO:0034244 | negative regulation of transcription elongation from RNA polymerase II promoter(GO:0034244) |
| 0.0 | 3.1 | GO:0030516 | regulation of axon extension(GO:0030516) |
| 0.0 | 0.8 | GO:0090162 | establishment of epithelial cell polarity(GO:0090162) |
| 0.0 | 2.0 | GO:0030032 | lamellipodium assembly(GO:0030032) |
| 0.0 | 0.1 | GO:0032914 | positive regulation of transforming growth factor beta1 production(GO:0032914) |
| 0.0 | 0.4 | GO:0007252 | I-kappaB phosphorylation(GO:0007252) |
| 0.0 | 0.1 | GO:0019046 | release from viral latency(GO:0019046) |
| 0.0 | 1.9 | GO:0032436 | positive regulation of proteasomal ubiquitin-dependent protein catabolic process(GO:0032436) |
Gene overrepresentation in cellular_component category:
| Log-likelihood per target | Total log-likelihood | Term | Description |
|---|---|---|---|
| 0.4 | 1.3 | GO:0009346 | citrate lyase complex(GO:0009346) |
| 0.2 | 1.9 | GO:0035976 | AP1 complex(GO:0035976) |
| 0.2 | 8.4 | GO:0016327 | apicolateral plasma membrane(GO:0016327) |
| 0.2 | 1.0 | GO:1990667 | PCSK9-AnxA2 complex(GO:1990667) |
| 0.1 | 3.8 | GO:0043218 | compact myelin(GO:0043218) |
| 0.1 | 3.6 | GO:0031307 | integral component of mitochondrial outer membrane(GO:0031307) |
| 0.1 | 0.8 | GO:0061689 | tricellular tight junction(GO:0061689) |
| 0.1 | 0.9 | GO:0000796 | condensin complex(GO:0000796) |
| 0.0 | 0.3 | GO:0032021 | NELF complex(GO:0032021) |
| 0.0 | 2.7 | GO:0097542 | ciliary tip(GO:0097542) |
| 0.0 | 0.6 | GO:0005583 | fibrillar collagen trimer(GO:0005583) banded collagen fibril(GO:0098643) |
| 0.0 | 0.3 | GO:0032777 | Piccolo NuA4 histone acetyltransferase complex(GO:0032777) |
| 0.0 | 1.0 | GO:0000314 | organellar small ribosomal subunit(GO:0000314) mitochondrial small ribosomal subunit(GO:0005763) |
| 0.0 | 0.3 | GO:0070022 | transforming growth factor beta receptor homodimeric complex(GO:0070022) |
Gene overrepresentation in molecular_function category:
| Log-likelihood per target | Total log-likelihood | Term | Description |
|---|---|---|---|
| 0.9 | 5.3 | GO:0015307 | drug:proton antiporter activity(GO:0015307) |
| 0.8 | 4.1 | GO:0004157 | dihydropyrimidinase activity(GO:0004157) |
| 0.4 | 1.3 | GO:0003878 | ATP citrate synthase activity(GO:0003878) |
| 0.3 | 2.0 | GO:0003987 | acetate-CoA ligase activity(GO:0003987) |
| 0.2 | 1.0 | GO:0070326 | very-low-density lipoprotein particle binding(GO:0034189) very-low-density lipoprotein particle receptor binding(GO:0070326) |
| 0.2 | 1.9 | GO:0016015 | morphogen activity(GO:0016015) |
| 0.2 | 0.7 | GO:0005019 | platelet-derived growth factor beta-receptor activity(GO:0005019) |
| 0.2 | 0.8 | GO:0008422 | beta-glucosidase activity(GO:0008422) |
| 0.1 | 2.1 | GO:0008179 | adenylate cyclase binding(GO:0008179) |
| 0.1 | 8.4 | GO:0097110 | scaffold protein binding(GO:0097110) |
| 0.1 | 0.4 | GO:0036435 | IkappaB kinase activity(GO:0008384) K48-linked polyubiquitin binding(GO:0036435) |
| 0.0 | 1.9 | GO:0016922 | ligand-dependent nuclear receptor binding(GO:0016922) |
| 0.0 | 1.4 | GO:0051537 | 2 iron, 2 sulfur cluster binding(GO:0051537) |
| 0.0 | 3.0 | GO:0019888 | protein phosphatase regulator activity(GO:0019888) |
| 0.0 | 2.4 | GO:0003777 | microtubule motor activity(GO:0003777) |
| 0.0 | 0.2 | GO:0070290 | N-acylphosphatidylethanolamine-specific phospholipase D activity(GO:0070290) |
| 0.0 | 0.2 | GO:0004726 | non-membrane spanning protein tyrosine phosphatase activity(GO:0004726) |
| 0.0 | 1.0 | GO:0019843 | rRNA binding(GO:0019843) |
| 0.0 | 1.6 | GO:0046934 | phosphatidylinositol-4,5-bisphosphate 3-kinase activity(GO:0046934) |
| 0.0 | 0.5 | GO:0030676 | Rac guanyl-nucleotide exchange factor activity(GO:0030676) |
Gene overrepresentation in C2:CP category:
| Log-likelihood per target | Total log-likelihood | Term | Description |
|---|---|---|---|
| 0.1 | 8.4 | PID P38 ALPHA BETA DOWNSTREAM PATHWAY | Signaling mediated by p38-alpha and p38-beta |
| 0.0 | 2.0 | PID HDAC CLASSIII PATHWAY | Signaling events mediated by HDAC Class III |
| 0.0 | 1.6 | PID ERBB NETWORK PATHWAY | ErbB receptor signaling network |
| 0.0 | 3.8 | PID A6B1 A6B4 INTEGRIN PATHWAY | a6b1 and a6b4 Integrin signaling |
| 0.0 | 1.9 | PID FRA PATHWAY | Validated transcriptional targets of AP1 family members Fra1 and Fra2 |
| 0.0 | 1.9 | PID BMP PATHWAY | BMP receptor signaling |
| 0.0 | 1.8 | PID CDC42 REG PATHWAY | Regulation of CDC42 activity |
| 0.0 | 0.7 | PID S1P S1P1 PATHWAY | S1P1 pathway |
| 0.0 | 1.2 | SIG REGULATION OF THE ACTIN CYTOSKELETON BY RHO GTPASES | Genes related to regulation of the actin cytoskeleton |
| 0.0 | 0.9 | PID AURORA B PATHWAY | Aurora B signaling |
Gene overrepresentation in C2:CP:REACTOME category:
| Log-likelihood per target | Total log-likelihood | Term | Description |
|---|---|---|---|
| 0.2 | 5.3 | REACTOME ORGANIC CATION ANION ZWITTERION TRANSPORT | Genes involved in Organic cation/anion/zwitterion transport |
| 0.1 | 2.0 | REACTOME ETHANOL OXIDATION | Genes involved in Ethanol oxidation |
| 0.1 | 4.1 | REACTOME CRMPS IN SEMA3A SIGNALING | Genes involved in CRMPs in Sema3A signaling |
| 0.1 | 2.4 | REACTOME KINESINS | Genes involved in Kinesins |
| 0.0 | 1.6 | REACTOME SHC1 EVENTS IN ERBB4 SIGNALING | Genes involved in SHC1 events in ERBB4 signaling |
| 0.0 | 0.4 | REACTOME TRAF3 DEPENDENT IRF ACTIVATION PATHWAY | Genes involved in TRAF3-dependent IRF activation pathway |
| 0.0 | 0.3 | REACTOME GAP JUNCTION DEGRADATION | Genes involved in Gap junction degradation |