Project
Epithelial-Mesenchymal Transition, human (Scheel, 2011)
Navigation
Downloads
Results for AAGUGCU
Z-value: 0.28
Motif logo

miRNA associated with seed AAGUGCU
| Name | miRBASE accession |
|---|---|
|
hsa-miR-302a-3p
|
MIMAT0000684 |
|
hsa-miR-302b-3p
|
MIMAT0000715 |
|
hsa-miR-302c-3p.1
|
MIMAT0000717 |
|
hsa-miR-302d-3p
|
MIMAT0000718 |
|
hsa-miR-302e
|
MIMAT0005931 |
|
hsa-miR-372-3p
|
MIMAT0000724 |
|
hsa-miR-373-3p
|
MIMAT0000726 |
|
hsa-miR-520a-3p
|
MIMAT0002834 |
|
hsa-miR-520b
|
MIMAT0002843 |
|
hsa-miR-520c-3p
|
MIMAT0002846 |
|
hsa-miR-520d-3p
|
MIMAT0002856 |
|
hsa-miR-520e
|
MIMAT0002825 |
Activity profile of AAGUGCU motif
Sorted Z-values of AAGUGCU motif
| Promoter | Log-likelihood | Transcript | Gene | Gene Info |
|---|---|---|---|---|
| chr8_+_94641145 | 0.26 |
ENST00000433389.8
ENST00000358397.9 |
ESRP1
|
epithelial splicing regulatory protein 1 |
| chr7_-_41703062 | 0.19 |
ENST00000242208.5
|
INHBA
|
inhibin subunit beta A |
| chr3_-_69386079 | 0.17 |
ENST00000398540.8
|
FRMD4B
|
FERM domain containing 4B |
| chr8_+_28494190 | 0.17 |
ENST00000537916.2
ENST00000240093.8 ENST00000523546.1 |
FZD3
|
frizzled class receptor 3 |
| chr9_-_23821275 | 0.15 |
ENST00000380110.8
|
ELAVL2
|
ELAV like RNA binding protein 2 |
| chr11_+_32829903 | 0.14 |
ENST00000257836.4
|
PRRG4
|
proline rich and Gla domain 4 |
| chr11_-_108593738 | 0.14 |
ENST00000525344.5
ENST00000265843.9 |
EXPH5
|
exophilin 5 |
| chr14_-_99272184 | 0.13 |
ENST00000357195.8
|
BCL11B
|
BAF chromatin remodeling complex subunit BCL11B |
| chr12_+_4273751 | 0.12 |
ENST00000675880.1
ENST00000261254.8 |
CCND2
|
cyclin D2 |
| chr7_-_20217342 | 0.12 |
ENST00000400331.10
ENST00000332878.8 |
MACC1
|
MET transcriptional regulator MACC1 |
| chr12_+_72272360 | 0.12 |
ENST00000547300.2
ENST00000261180.10 |
TRHDE
|
thyrotropin releasing hormone degrading enzyme |
| chr5_-_1882902 | 0.11 |
ENST00000231357.7
|
IRX4
|
iroquois homeobox 4 |
| chr15_-_83284645 | 0.10 |
ENST00000345382.7
|
BNC1
|
basonuclin 1 |
| chr3_-_56801939 | 0.09 |
ENST00000296315.8
ENST00000495373.5 |
ARHGEF3
|
Rho guanine nucleotide exchange factor 3 |
| chr2_-_96145431 | 0.09 |
ENST00000288943.5
|
DUSP2
|
dual specificity phosphatase 2 |
| chr2_+_102619531 | 0.09 |
ENST00000233969.3
|
SLC9A2
|
solute carrier family 9 member A2 |
| chr22_+_39994926 | 0.09 |
ENST00000333407.11
|
FAM83F
|
family with sequence similarity 83 member F |
| chr2_-_20225123 | 0.09 |
ENST00000254351.9
|
SDC1
|
syndecan 1 |
| chr12_+_82686889 | 0.08 |
ENST00000321196.8
|
TMTC2
|
transmembrane O-mannosyltransferase targeting cadherins 2 |
| chr18_+_23689439 | 0.08 |
ENST00000313654.14
|
LAMA3
|
laminin subunit alpha 3 |
| chr3_+_141231770 | 0.08 |
ENST00000286353.9
ENST00000502783.5 ENST00000393010.6 ENST00000514680.5 |
PXYLP1
|
2-phosphoxylose phosphatase 1 |
| chr22_+_29073024 | 0.08 |
ENST00000400335.9
|
KREMEN1
|
kringle containing transmembrane protein 1 |
| chr3_-_121545962 | 0.08 |
ENST00000264233.6
|
POLQ
|
DNA polymerase theta |
| chr17_-_49764123 | 0.08 |
ENST00000240364.7
ENST00000506156.1 |
FAM117A
|
family with sequence similarity 117 member A |
| chr6_-_116060859 | 0.08 |
ENST00000606080.2
|
FRK
|
fyn related Src family tyrosine kinase |
| chr10_-_88583304 | 0.08 |
ENST00000331772.9
|
RNLS
|
renalase, FAD dependent amine oxidase |
| chr6_-_3457018 | 0.08 |
ENST00000436008.6
ENST00000406686.8 |
SLC22A23
|
solute carrier family 22 member 23 |
| chr2_-_72147819 | 0.07 |
ENST00000001146.7
ENST00000546307.5 ENST00000474509.1 |
CYP26B1
|
cytochrome P450 family 26 subfamily B member 1 |
| chr22_+_28883564 | 0.07 |
ENST00000544604.7
|
ZNRF3
|
zinc and ring finger 3 |
| chr22_+_32801697 | 0.07 |
ENST00000266085.7
|
TIMP3
|
TIMP metallopeptidase inhibitor 3 |
| chr2_-_234497035 | 0.07 |
ENST00000390645.2
ENST00000339728.6 |
ARL4C
|
ADP ribosylation factor like GTPase 4C |
| chr8_-_123396412 | 0.07 |
ENST00000287394.10
|
ATAD2
|
ATPase family AAA domain containing 2 |
| chr17_+_75721451 | 0.07 |
ENST00000200181.8
|
ITGB4
|
integrin subunit beta 4 |
| chr3_-_123884290 | 0.07 |
ENST00000346322.9
ENST00000360772.7 ENST00000360304.8 |
MYLK
|
myosin light chain kinase |
| chr1_-_227947924 | 0.06 |
ENST00000272164.6
|
WNT9A
|
Wnt family member 9A |
| chr1_+_26529745 | 0.06 |
ENST00000374168.7
ENST00000374166.8 |
RPS6KA1
|
ribosomal protein S6 kinase A1 |
| chr12_-_54385727 | 0.06 |
ENST00000551109.5
ENST00000546970.5 |
ZNF385A
|
zinc finger protein 385A |
| chr18_-_21704763 | 0.06 |
ENST00000580981.5
ENST00000289119.7 |
ABHD3
|
abhydrolase domain containing 3, phospholipase |
| chr3_-_48188356 | 0.06 |
ENST00000351231.7
ENST00000437972.1 ENST00000302506.8 |
CDC25A
|
cell division cycle 25A |
| chr7_+_20330893 | 0.06 |
ENST00000222573.5
|
ITGB8
|
integrin subunit beta 8 |
| chr12_+_4909895 | 0.06 |
ENST00000638821.1
ENST00000382545.5 |
ENSG00000256654.4
KCNA1
|
novel transcript, sense overlapping KCNA1 potassium voltage-gated channel subfamily A member 1 |
| chr5_+_56815534 | 0.06 |
ENST00000399503.4
|
MAP3K1
|
mitogen-activated protein kinase kinase kinase 1 |
| chr20_+_1894145 | 0.06 |
ENST00000400068.7
|
SIRPA
|
signal regulatory protein alpha |
| chr15_+_68578970 | 0.06 |
ENST00000261861.10
|
CORO2B
|
coronin 2B |
| chr6_-_108074703 | 0.06 |
ENST00000193322.8
|
OSTM1
|
osteoclastogenesis associated transmembrane protein 1 |
| chr5_+_149730260 | 0.06 |
ENST00000360453.8
ENST00000394320.7 ENST00000309241.10 |
PPARGC1B
|
PPARG coactivator 1 beta |
| chr9_-_122227525 | 0.05 |
ENST00000373755.6
ENST00000373754.6 |
LHX6
|
LIM homeobox 6 |
| chr6_+_157823191 | 0.05 |
ENST00000681534.1
ENST00000681183.1 ENST00000679732.1 ENST00000681186.1 ENST00000680078.1 ENST00000681138.1 ENST00000680495.1 ENST00000392185.8 |
SNX9
|
sorting nexin 9 |
| chr4_-_170003738 | 0.05 |
ENST00000502832.1
ENST00000393704.3 |
MFAP3L
|
microfibril associated protein 3 like |
| chr1_+_32741779 | 0.05 |
ENST00000401073.7
|
KIAA1522
|
KIAA1522 |
| chr1_-_53328053 | 0.05 |
ENST00000371454.6
ENST00000667377.1 ENST00000306052.12 ENST00000668448.1 |
LRP8
|
LDL receptor related protein 8 |
| chr1_-_24964984 | 0.05 |
ENST00000338888.3
ENST00000399916.5 |
RUNX3
|
RUNX family transcription factor 3 |
| chr19_+_37907200 | 0.05 |
ENST00000222345.11
|
SIPA1L3
|
signal induced proliferation associated 1 like 3 |
| chr6_+_43770707 | 0.05 |
ENST00000324450.11
ENST00000417285.7 ENST00000413642.8 ENST00000372055.9 ENST00000482630.7 ENST00000425836.7 ENST00000372064.9 ENST00000372077.8 ENST00000519767.5 |
VEGFA
|
vascular endothelial growth factor A |
| chr3_+_126983035 | 0.04 |
ENST00000393409.3
|
PLXNA1
|
plexin A1 |
| chr21_-_41926680 | 0.04 |
ENST00000329623.11
|
C2CD2
|
C2 calcium dependent domain containing 2 |
| chr1_-_16156059 | 0.04 |
ENST00000358432.8
|
EPHA2
|
EPH receptor A2 |
| chr9_-_19102887 | 0.04 |
ENST00000380502.8
|
HAUS6
|
HAUS augmin like complex subunit 6 |
| chr5_+_34656288 | 0.04 |
ENST00000265109.8
|
RAI14
|
retinoic acid induced 14 |
| chr3_+_130850585 | 0.04 |
ENST00000505330.5
ENST00000504381.5 ENST00000507488.6 |
ATP2C1
|
ATPase secretory pathway Ca2+ transporting 1 |
| chr1_-_226737277 | 0.04 |
ENST00000272117.7
|
ITPKB
|
inositol-trisphosphate 3-kinase B |
| chr1_-_234609445 | 0.04 |
ENST00000366610.7
|
IRF2BP2
|
interferon regulatory factor 2 binding protein 2 |
| chr12_+_45216079 | 0.04 |
ENST00000423947.7
ENST00000680498.1 ENST00000320560.13 |
ANO6
|
anoctamin 6 |
| chr4_-_110198650 | 0.04 |
ENST00000394607.7
|
ELOVL6
|
ELOVL fatty acid elongase 6 |
| chr1_-_55215345 | 0.04 |
ENST00000294383.7
|
USP24
|
ubiquitin specific peptidase 24 |
| chr17_+_4833331 | 0.04 |
ENST00000355280.11
ENST00000347992.11 |
MINK1
|
misshapen like kinase 1 |
| chr12_-_24949026 | 0.04 |
ENST00000539780.5
ENST00000546285.1 ENST00000342945.9 ENST00000261192.12 |
BCAT1
|
branched chain amino acid transaminase 1 |
| chr3_+_43286512 | 0.04 |
ENST00000454177.5
ENST00000429705.6 ENST00000296088.12 ENST00000437827.1 |
SNRK
|
SNF related kinase |
| chr1_+_220528112 | 0.04 |
ENST00000366917.6
ENST00000402574.5 ENST00000611084.4 ENST00000366918.8 |
MARK1
|
microtubule affinity regulating kinase 1 |
| chrX_-_25015924 | 0.04 |
ENST00000379044.5
|
ARX
|
aristaless related homeobox |
| chr7_+_77696423 | 0.04 |
ENST00000334955.13
|
RSBN1L
|
round spermatid basic protein 1 like |
| chr2_+_15940537 | 0.04 |
ENST00000281043.4
ENST00000638417.1 |
MYCN
|
MYCN proto-oncogene, bHLH transcription factor |
| chr7_-_138981307 | 0.04 |
ENST00000440172.5
ENST00000422774.2 |
KIAA1549
|
KIAA1549 |
| chr2_+_99337364 | 0.04 |
ENST00000617677.1
ENST00000289371.11 |
EIF5B
|
eukaryotic translation initiation factor 5B |
| chr2_+_46297397 | 0.04 |
ENST00000263734.5
|
EPAS1
|
endothelial PAS domain protein 1 |
| chr9_+_2621766 | 0.04 |
ENST00000382100.8
|
VLDLR
|
very low density lipoprotein receptor |
| chr16_+_25691953 | 0.04 |
ENST00000331351.6
|
HS3ST4
|
heparan sulfate-glucosamine 3-sulfotransferase 4 |
| chr2_+_69915100 | 0.04 |
ENST00000264444.7
|
MXD1
|
MAX dimerization protein 1 |
| chr20_-_4823597 | 0.04 |
ENST00000379400.8
|
RASSF2
|
Ras association domain family member 2 |
| chr14_+_70641896 | 0.04 |
ENST00000256367.3
|
TTC9
|
tetratricopeptide repeat domain 9 |
| chr19_+_4402615 | 0.04 |
ENST00000301280.10
|
CHAF1A
|
chromatin assembly factor 1 subunit A |
| chr6_-_98947911 | 0.04 |
ENST00000369244.7
ENST00000229971.2 |
FBXL4
|
F-box and leucine rich repeat protein 4 |
| chr14_+_103334176 | 0.04 |
ENST00000560338.5
ENST00000560763.5 ENST00000216554.8 |
EIF5
|
eukaryotic translation initiation factor 5 |
| chr3_+_151086889 | 0.04 |
ENST00000474524.5
ENST00000273432.8 |
MED12L
|
mediator complex subunit 12L |
| chr3_-_171460368 | 0.04 |
ENST00000436636.7
ENST00000465393.1 ENST00000341852.10 |
TNIK
|
TRAF2 and NCK interacting kinase |
| chr1_-_113812448 | 0.03 |
ENST00000612242.4
ENST00000261441.9 |
RSBN1
|
round spermatid basic protein 1 |
| chr5_+_140875299 | 0.03 |
ENST00000613593.1
ENST00000398631.3 |
PCDHA12
|
protocadherin alpha 12 |
| chr5_+_140841183 | 0.03 |
ENST00000378123.4
ENST00000531613.2 |
PCDHA8
|
protocadherin alpha 8 |
| chr5_+_90474879 | 0.03 |
ENST00000504930.5
ENST00000514483.5 |
POLR3G
|
RNA polymerase III subunit G |
| chr8_+_60678705 | 0.03 |
ENST00000423902.7
|
CHD7
|
chromodomain helicase DNA binding protein 7 |
| chr5_+_140868945 | 0.03 |
ENST00000398640.7
|
PCDHA11
|
protocadherin alpha 11 |
| chr5_+_140848360 | 0.03 |
ENST00000532602.2
|
PCDHA9
|
protocadherin alpha 9 |
| chr19_-_4066892 | 0.03 |
ENST00000322357.9
|
ZBTB7A
|
zinc finger and BTB domain containing 7A |
| chr2_-_25878445 | 0.03 |
ENST00000336112.9
ENST00000435504.9 |
ASXL2
|
ASXL transcriptional regulator 2 |
| chr4_-_78939352 | 0.03 |
ENST00000512733.5
|
PAQR3
|
progestin and adipoQ receptor family member 3 |
| chr2_+_173354820 | 0.03 |
ENST00000347703.7
ENST00000410101.7 ENST00000410019.3 ENST00000306721.8 |
CDCA7
|
cell division cycle associated 7 |
| chr1_-_156082412 | 0.03 |
ENST00000532414.3
|
MEX3A
|
mex-3 RNA binding family member A |
| chr15_-_63381835 | 0.03 |
ENST00000344366.7
ENST00000178638.8 ENST00000422263.2 |
CA12
|
carbonic anhydrase 12 |
| chr5_-_44389407 | 0.03 |
ENST00000264664.5
|
FGF10
|
fibroblast growth factor 10 |
| chr16_+_24539536 | 0.03 |
ENST00000568015.5
ENST00000319715.10 |
RBBP6
|
RB binding protein 6, ubiquitin ligase |
| chr8_+_85177225 | 0.03 |
ENST00000418930.6
|
E2F5
|
E2F transcription factor 5 |
| chr4_+_98995709 | 0.03 |
ENST00000296411.11
ENST00000625963.1 |
METAP1
|
methionyl aminopeptidase 1 |
| chr17_-_32877106 | 0.03 |
ENST00000318217.10
ENST00000579584.5 ENST00000583621.1 |
MYO1D
|
myosin ID |
| chr1_+_209827964 | 0.03 |
ENST00000491415.7
|
UTP25
|
UTP25 small subunit processor component |
| chr6_+_33454543 | 0.03 |
ENST00000621915.1
ENST00000395064.3 |
ZBTB9
|
zinc finger and BTB domain containing 9 |
| chr14_-_22982544 | 0.03 |
ENST00000262713.7
|
AJUBA
|
ajuba LIM protein |
| chr17_-_42609356 | 0.03 |
ENST00000309428.10
|
RETREG3
|
reticulophagy regulator family member 3 |
| chr17_+_29593118 | 0.03 |
ENST00000394859.8
|
ANKRD13B
|
ankyrin repeat domain 13B |
| chr11_-_69704013 | 0.03 |
ENST00000294312.4
|
FGF19
|
fibroblast growth factor 19 |
| chr2_-_73269483 | 0.03 |
ENST00000295133.9
|
FBXO41
|
F-box protein 41 |
| chr2_+_26848093 | 0.03 |
ENST00000288699.11
|
DPYSL5
|
dihydropyrimidinase like 5 |
| chrX_-_15335407 | 0.03 |
ENST00000635543.1
ENST00000542278.6 ENST00000482148.6 ENST00000333590.6 ENST00000637296.1 ENST00000634582.1 ENST00000634640.1 |
PIGA
|
phosphatidylinositol glycan anchor biosynthesis class A |
| chr1_-_225889143 | 0.03 |
ENST00000272134.5
|
LEFTY1
|
left-right determination factor 1 |
| chr1_+_42380772 | 0.03 |
ENST00000431473.4
ENST00000410070.6 |
RIMKLA
|
ribosomal modification protein rimK like family member A |
| chr20_+_52972347 | 0.03 |
ENST00000371497.10
|
TSHZ2
|
teashirt zinc finger homeobox 2 |
| chr4_-_16226460 | 0.03 |
ENST00000405303.7
|
TAPT1
|
transmembrane anterior posterior transformation 1 |
| chr18_-_31684504 | 0.03 |
ENST00000383131.3
ENST00000237019.11 ENST00000306851.10 |
B4GALT6
|
beta-1,4-galactosyltransferase 6 |
| chr14_+_32939243 | 0.03 |
ENST00000346562.6
ENST00000548645.5 ENST00000356141.8 ENST00000357798.9 |
NPAS3
|
neuronal PAS domain protein 3 |
| chr4_+_74308463 | 0.03 |
ENST00000413830.6
|
EPGN
|
epithelial mitogen |
| chr2_+_85133376 | 0.03 |
ENST00000282111.4
|
TCF7L1
|
transcription factor 7 like 1 |
| chr3_+_14947568 | 0.03 |
ENST00000413118.5
ENST00000425241.5 |
NR2C2
|
nuclear receptor subfamily 2 group C member 2 |
| chr2_-_165794190 | 0.03 |
ENST00000392701.8
ENST00000422973.1 |
GALNT3
|
polypeptide N-acetylgalactosaminyltransferase 3 |
| chr4_-_184474518 | 0.03 |
ENST00000393593.8
|
IRF2
|
interferon regulatory factor 2 |
| chr1_-_115841116 | 0.03 |
ENST00000320238.3
|
NHLH2
|
nescient helix-loop-helix 2 |
| chr8_+_103298836 | 0.03 |
ENST00000523739.5
ENST00000358755.5 |
FZD6
|
frizzled class receptor 6 |
| chrX_+_77447387 | 0.03 |
ENST00000439435.3
|
FGF16
|
fibroblast growth factor 16 |
| chr10_-_110304894 | 0.03 |
ENST00000369603.10
|
SMNDC1
|
survival motor neuron domain containing 1 |
| chr17_+_68035722 | 0.02 |
ENST00000679078.1
ENST00000330459.8 ENST00000584026.6 |
KPNA2
|
karyopherin subunit alpha 2 |
| chr11_-_102452758 | 0.02 |
ENST00000398136.7
ENST00000361236.7 |
TMEM123
|
transmembrane protein 123 |
| chr12_-_21774688 | 0.02 |
ENST00000240662.3
|
KCNJ8
|
potassium inwardly rectifying channel subfamily J member 8 |
| chr1_-_225941383 | 0.02 |
ENST00000420304.6
|
LEFTY2
|
left-right determination factor 2 |
| chr9_-_133121228 | 0.02 |
ENST00000372050.8
|
RALGDS
|
ral guanine nucleotide dissociation stimulator |
| chr7_-_142885737 | 0.02 |
ENST00000359396.9
ENST00000436401.1 |
TRPV6
|
transient receptor potential cation channel subfamily V member 6 |
| chr1_-_207051202 | 0.02 |
ENST00000315927.9
|
YOD1
|
YOD1 deubiquitinase |
| chr12_-_16608183 | 0.02 |
ENST00000354662.5
ENST00000538051.5 |
LMO3
|
LIM domain only 3 |
| chr9_-_10612966 | 0.02 |
ENST00000381196.9
|
PTPRD
|
protein tyrosine phosphatase receptor type D |
| chr4_+_44678412 | 0.02 |
ENST00000281543.6
|
GUF1
|
GTP binding elongation factor GUF1 |
| chr22_-_50474942 | 0.02 |
ENST00000348911.10
ENST00000380817.8 |
SBF1
|
SET binding factor 1 |
| chr1_+_11980181 | 0.02 |
ENST00000444836.5
ENST00000674817.1 ENST00000675053.1 ENST00000675817.1 ENST00000675298.1 ENST00000676369.1 ENST00000412236.2 ENST00000675530.1 ENST00000674548.1 ENST00000674658.1 ENST00000674910.1 ENST00000675231.1 |
MFN2
|
mitofusin 2 |
| chr17_-_68291116 | 0.02 |
ENST00000327268.8
ENST00000580666.6 |
SLC16A6
|
solute carrier family 16 member 6 |
| chr11_-_27472698 | 0.02 |
ENST00000389858.4
ENST00000379214.9 |
LGR4
|
leucine rich repeat containing G protein-coupled receptor 4 |
| chr1_+_117060309 | 0.02 |
ENST00000369466.9
|
TTF2
|
transcription termination factor 2 |
| chr20_-_32207708 | 0.02 |
ENST00000246229.5
|
PLAGL2
|
PLAG1 like zinc finger 2 |
| chr5_+_140966466 | 0.02 |
ENST00000615316.1
ENST00000289269.7 |
PCDHAC2
|
protocadherin alpha subfamily C, 2 |
| chr11_+_129375841 | 0.02 |
ENST00000281437.6
|
BARX2
|
BARX homeobox 2 |
| chr6_-_142946312 | 0.02 |
ENST00000367604.6
|
HIVEP2
|
HIVEP zinc finger 2 |
| chr11_+_33257265 | 0.02 |
ENST00000303296.9
ENST00000379016.7 |
HIPK3
|
homeodomain interacting protein kinase 3 |
| chr3_+_179347686 | 0.02 |
ENST00000471841.6
|
MFN1
|
mitofusin 1 |
| chr10_-_118754956 | 0.02 |
ENST00000369151.8
|
CACUL1
|
CDK2 associated cullin domain 1 |
| chr7_-_127392687 | 0.02 |
ENST00000393313.5
ENST00000619291.4 ENST00000265827.8 ENST00000434602.5 |
ZNF800
|
zinc finger protein 800 |
| chr6_-_105137147 | 0.02 |
ENST00000314641.10
|
BVES
|
blood vessel epicardial substance |
| chr11_+_67119245 | 0.02 |
ENST00000529006.7
ENST00000398645.6 |
KDM2A
|
lysine demethylase 2A |
| chr7_+_120273129 | 0.02 |
ENST00000331113.9
|
KCND2
|
potassium voltage-gated channel subfamily D member 2 |
| chr4_-_145938422 | 0.02 |
ENST00000656985.1
ENST00000652097.1 ENST00000503462.3 ENST00000379448.9 ENST00000513840.2 |
ZNF827
|
zinc finger protein 827 |
| chr2_-_181680490 | 0.02 |
ENST00000684145.1
ENST00000295108.4 ENST00000684079.1 ENST00000683430.1 |
CERKL
NEUROD1
|
ceramide kinase like neuronal differentiation 1 |
| chr4_+_127782270 | 0.02 |
ENST00000508549.5
ENST00000296464.9 |
HSPA4L
|
heat shock protein family A (Hsp70) member 4 like |
| chr16_-_4273014 | 0.02 |
ENST00000204517.11
|
TFAP4
|
transcription factor AP-4 |
| chr16_-_71289609 | 0.02 |
ENST00000338099.9
ENST00000563876.1 |
CMTR2
|
cap methyltransferase 2 |
| chr3_-_45995807 | 0.02 |
ENST00000535325.5
ENST00000296137.7 |
FYCO1
|
FYVE and coiled-coil domain autophagy adaptor 1 |
| chr2_-_102736819 | 0.02 |
ENST00000258436.10
|
MFSD9
|
major facilitator superfamily domain containing 9 |
| chr17_+_12665882 | 0.02 |
ENST00000425538.6
|
MYOCD
|
myocardin |
| chr2_+_134120169 | 0.02 |
ENST00000409645.5
|
MGAT5
|
alpha-1,6-mannosylglycoprotein 6-beta-N-acetylglucosaminyltransferase |
| chrX_-_20266834 | 0.02 |
ENST00000379565.9
|
RPS6KA3
|
ribosomal protein S6 kinase A3 |
| chr3_-_12967668 | 0.02 |
ENST00000273221.8
|
IQSEC1
|
IQ motif and Sec7 domain ArfGEF 1 |
| chr16_-_46973634 | 0.02 |
ENST00000317089.10
|
DNAJA2
|
DnaJ heat shock protein family (Hsp40) member A2 |
| chr13_-_26221703 | 0.02 |
ENST00000381570.7
ENST00000346166.7 |
RNF6
|
ring finger protein 6 |
| chr2_+_168456215 | 0.02 |
ENST00000392687.4
ENST00000305747.11 |
CERS6
|
ceramide synthase 6 |
| chr5_+_96936071 | 0.02 |
ENST00000231368.10
|
LNPEP
|
leucyl and cystinyl aminopeptidase |
| chr4_+_38664189 | 0.02 |
ENST00000514033.1
ENST00000261438.10 |
KLF3
|
Kruppel like factor 3 |
| chr20_-_9838831 | 0.02 |
ENST00000378423.5
|
PAK5
|
p21 (RAC1) activated kinase 5 |
| chr17_-_58517835 | 0.02 |
ENST00000579921.1
ENST00000579925.5 ENST00000323456.9 |
MTMR4
|
myotubularin related protein 4 |
| chr10_+_28677487 | 0.02 |
ENST00000375533.6
|
BAMBI
|
BMP and activin membrane bound inhibitor |
| chr5_+_140827950 | 0.02 |
ENST00000378126.4
ENST00000529310.6 ENST00000527624.1 |
PCDHA6
|
protocadherin alpha 6 |
| chr3_+_196739839 | 0.02 |
ENST00000327134.7
|
PAK2
|
p21 (RAC1) activated kinase 2 |
| chr4_+_155667198 | 0.02 |
ENST00000296518.11
|
GUCY1A1
|
guanylate cyclase 1 soluble subunit alpha 1 |
| chr2_+_96816236 | 0.02 |
ENST00000377060.7
ENST00000305510.4 |
CNNM3
|
cyclin and CBS domain divalent metal cation transport mediator 3 |
| chr14_+_52267683 | 0.02 |
ENST00000306051.3
ENST00000553372.1 |
PTGDR
|
prostaglandin D2 receptor |
| chr8_-_100952918 | 0.02 |
ENST00000395957.6
ENST00000395948.6 ENST00000457309.2 |
YWHAZ
|
tyrosine 3-monooxygenase/tryptophan 5-monooxygenase activation protein zeta |
| chr22_+_21417357 | 0.02 |
ENST00000407464.7
|
HIC2
|
HIC ZBTB transcriptional repressor 2 |
| chr1_+_84078043 | 0.02 |
ENST00000370689.6
ENST00000370688.7 |
PRKACB
|
protein kinase cAMP-activated catalytic subunit beta |
| chr11_-_65614195 | 0.02 |
ENST00000309100.8
ENST00000529839.1 ENST00000526293.1 |
MAP3K11
|
mitogen-activated protein kinase kinase kinase 11 |
| chr5_+_52989314 | 0.02 |
ENST00000296585.10
|
ITGA2
|
integrin subunit alpha 2 |
| chr17_+_82519694 | 0.02 |
ENST00000335255.10
|
FOXK2
|
forkhead box K2 |
| chr6_-_31902041 | 0.02 |
ENST00000375527.3
|
ZBTB12
|
zinc finger and BTB domain containing 12 |
| chr7_-_32891744 | 0.02 |
ENST00000304056.9
|
KBTBD2
|
kelch repeat and BTB domain containing 2 |
| chr18_+_57352541 | 0.02 |
ENST00000324000.4
|
ST8SIA3
|
ST8 alpha-N-acetyl-neuraminide alpha-2,8-sialyltransferase 3 |
| chr22_-_18024513 | 0.02 |
ENST00000441493.7
|
MICAL3
|
microtubule associated monooxygenase, calponin and LIM domain containing 3 |
| chr1_+_244051275 | 0.02 |
ENST00000358704.4
|
ZBTB18
|
zinc finger and BTB domain containing 18 |
| chr1_-_197201262 | 0.02 |
ENST00000367405.5
|
ZBTB41
|
zinc finger and BTB domain containing 41 |
| chr12_-_77065526 | 0.02 |
ENST00000547316.1
ENST00000416496.6 ENST00000550669.5 ENST00000322886.12 |
E2F7
|
E2F transcription factor 7 |
| chr18_+_33578213 | 0.02 |
ENST00000681521.1
ENST00000269197.12 |
ASXL3
|
ASXL transcriptional regulator 3 |
| chr10_+_96832252 | 0.02 |
ENST00000676187.1
ENST00000675687.1 ENST00000676123.1 ENST00000675471.1 ENST00000371103.8 ENST00000421806.4 ENST00000675250.1 ENST00000540664.6 ENST00000676414.1 |
LCOR
|
ligand dependent nuclear receptor corepressor |
| chr12_+_19439469 | 0.02 |
ENST00000266508.14
|
AEBP2
|
AE binding protein 2 |
| chr10_+_63521365 | 0.02 |
ENST00000373758.5
|
REEP3
|
receptor accessory protein 3 |
| chr12_-_107761113 | 0.02 |
ENST00000228437.10
|
PRDM4
|
PR/SET domain 4 |
| chr9_-_104928139 | 0.02 |
ENST00000423487.6
ENST00000374733.1 ENST00000374736.8 ENST00000678995.1 |
ABCA1
|
ATP binding cassette subfamily A member 1 |
| chr12_-_46268989 | 0.02 |
ENST00000549049.5
ENST00000439706.5 ENST00000398637.10 |
SLC38A1
|
solute carrier family 38 member 1 |
| chr11_+_9384621 | 0.02 |
ENST00000379719.8
ENST00000527431.1 ENST00000630083.1 |
IPO7
|
importin 7 |
| chr3_+_122795039 | 0.02 |
ENST00000261038.6
|
SLC49A4
|
solute carrier family 49 member 4 |
| chr21_-_26170654 | 0.02 |
ENST00000439274.6
ENST00000358918.7 ENST00000354192.7 ENST00000348990.9 ENST00000346798.8 ENST00000357903.7 |
APP
|
amyloid beta precursor protein |
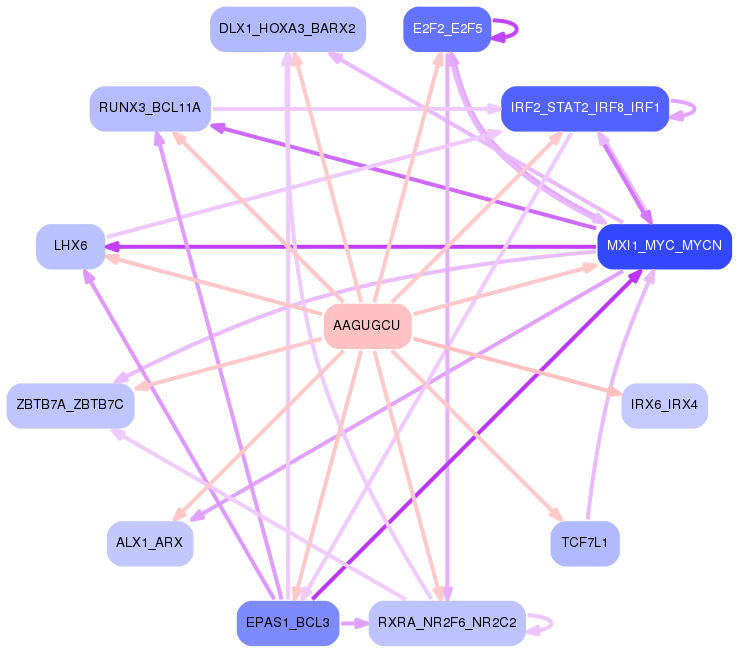
Network of associatons between targets according to the STRING database.

First level regulatory network of AAGUGCU
Gene Ontology Analysis
Gene overrepresentation in biological process category:
| Log-likelihood per target | Total log-likelihood | Term | Description |
|---|---|---|---|
| 0.1 | 0.2 | GO:0060279 | positive regulation of ovulation(GO:0060279) |
| 0.0 | 0.1 | GO:0097535 | lymphoid lineage cell migration(GO:0097534) lymphoid lineage cell migration into thymus(GO:0097535) |
| 0.0 | 0.2 | GO:1904693 | midbrain morphogenesis(GO:1904693) |
| 0.0 | 0.1 | GO:0048560 | establishment of anatomical structure orientation(GO:0048560) |
| 0.0 | 0.1 | GO:0016103 | diterpenoid catabolic process(GO:0016103) retinoic acid catabolic process(GO:0034653) regulation of skeletal muscle fiber differentiation(GO:1902809) |
| 0.0 | 0.1 | GO:0048627 | myoblast development(GO:0048627) |
| 0.0 | 0.1 | GO:0050976 | detection of mechanical stimulus involved in sensory perception of touch(GO:0050976) |
| 0.0 | 0.1 | GO:0038018 | Wnt receptor catabolic process(GO:0038018) |
| 0.0 | 0.1 | GO:1903984 | positive regulation of TRAIL-activated apoptotic signaling pathway(GO:1903984) |
| 0.0 | 0.1 | GO:0070889 | mRNA localization resulting in posttranscriptional regulation of gene expression(GO:0010609) platelet alpha granule organization(GO:0070889) regulation of DNA damage response, signal transduction by p53 class mediator resulting in transcription of p21 class mediator(GO:1902162) positive regulation of DNA damage response, signal transduction by p53 class mediator resulting in transcription of p21 class mediator(GO:1902164) |
| 0.0 | 0.0 | GO:0009946 | proximal/distal axis specification(GO:0009946) |
| 0.0 | 0.0 | GO:1903572 | regulation of protein kinase D signaling(GO:1903570) positive regulation of protein kinase D signaling(GO:1903572) |
| 0.0 | 0.0 | GO:0048320 | axial mesoderm formation(GO:0048320) negative regulation of lymphangiogenesis(GO:1901491) |
| 0.0 | 0.0 | GO:0097045 | phosphatidylserine exposure on blood platelet(GO:0097045) |
| 0.0 | 0.1 | GO:0060414 | aorta smooth muscle tissue morphogenesis(GO:0060414) |
Gene overrepresentation in cellular component category:
| Log-likelihood per target | Total log-likelihood | Term | Description |
|---|---|---|---|
| 0.1 | 0.2 | GO:0043512 | inhibin complex(GO:0043511) inhibin A complex(GO:0043512) |
| 0.0 | 0.1 | GO:0034686 | integrin alphav-beta8 complex(GO:0034686) |
| 0.0 | 0.1 | GO:0097129 | cyclin D2-CDK4 complex(GO:0097129) |
| 0.0 | 0.1 | GO:0005610 | laminin-5 complex(GO:0005610) |
Gene overrepresentation in molecular function category:
| Log-likelihood per target | Total log-likelihood | Term | Description |
|---|---|---|---|
| 0.0 | 0.1 | GO:0008330 | protein tyrosine/threonine phosphatase activity(GO:0008330) |
| 0.0 | 0.1 | GO:0008401 | retinoic acid 4-hydroxylase activity(GO:0008401) |
| 0.0 | 0.2 | GO:0070699 | type II activin receptor binding(GO:0070699) |
| 0.0 | 0.1 | GO:0052739 | phosphatidylserine 1-acylhydrolase activity(GO:0052739) |
| 0.0 | 0.1 | GO:0038025 | reelin receptor activity(GO:0038025) |
| 0.0 | 0.1 | GO:1990430 | extracellular matrix protein binding(GO:1990430) |
Gene overrepresentation in curated gene sets: REACTOME pathways category:
| Log-likelihood per target | Total log-likelihood | Term | Description |
|---|---|---|---|
| 0.0 | 0.2 | REACTOME GLYCOPROTEIN HORMONES | Genes involved in Glycoprotein hormones |