Project
Epithelial-Mesenchymal Transition, human (Scheel, 2011)
Navigation
Downloads
Results for BARX1
Z-value: 0.42
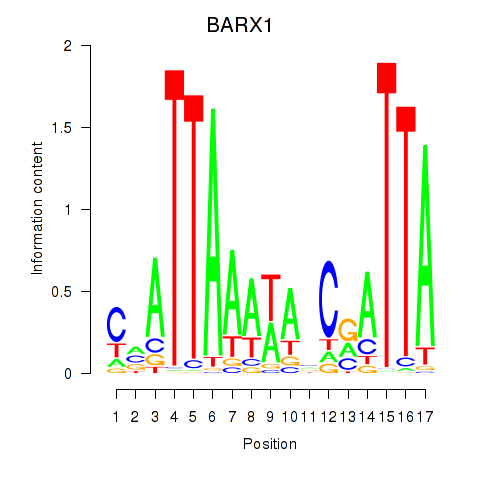
Motif logo
Transcription factors associated with BARX1
| Gene Symbol | Gene ID | Gene Info |
|---|---|---|
|
BARX1
|
ENSG00000131668.14 | BARX homeobox 1 |
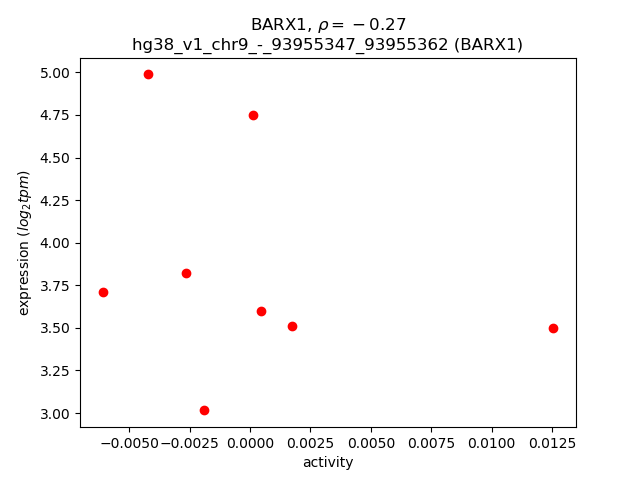
Activity-expression correlation:
| Gene | Promoter | Pearson corr. coef. | P-value | Plot |
|---|---|---|---|---|
| BARX1 | hg38_v1_chr9_-_93955347_93955362 | -0.27 | 5.1e-01 | Click! |
Activity profile of BARX1 motif
Sorted Z-values of BARX1 motif
| Promoter | Log-likelihood | Transcript | Gene | Gene Info |
|---|---|---|---|---|
| chr3_-_112829367 | 0.24 |
ENST00000448932.4
ENST00000617549.3 |
CD200R1L
|
CD200 receptor 1 like |
| chr13_-_37598750 | 0.13 |
ENST00000379743.8
ENST00000379742.4 ENST00000379749.8 ENST00000379747.9 ENST00000541179.5 ENST00000541481.5 |
POSTN
|
periostin |
| chr1_-_145910066 | 0.13 |
ENST00000539363.2
|
ITGA10
|
integrin subunit alpha 10 |
| chr3_-_98035295 | 0.11 |
ENST00000621172.4
|
GABRR3
|
gamma-aminobutyric acid type A receptor subunit rho3 |
| chr19_-_9107475 | 0.11 |
ENST00000641081.1
|
OR7G2
|
olfactory receptor family 7 subfamily G member 2 |
| chr3_-_191282383 | 0.11 |
ENST00000427544.6
|
UTS2B
|
urotensin 2B |
| chr12_-_10826358 | 0.10 |
ENST00000240619.2
|
TAS2R10
|
taste 2 receptor member 10 |
| chr1_-_145910031 | 0.10 |
ENST00000369304.8
|
ITGA10
|
integrin subunit alpha 10 |
| chr10_+_88594746 | 0.10 |
ENST00000531458.1
|
LIPJ
|
lipase family member J |
| chr12_-_91178520 | 0.10 |
ENST00000425043.5
ENST00000420120.6 ENST00000441303.6 ENST00000456569.2 |
DCN
|
decorin |
| chr2_+_90069662 | 0.09 |
ENST00000390271.2
|
IGKV6D-41
|
immunoglobulin kappa variable 6D-41 (non-functional) |
| chr17_-_31321743 | 0.08 |
ENST00000247270.3
|
EVI2A
|
ecotropic viral integration site 2A |
| chr14_+_21990357 | 0.08 |
ENST00000390444.1
|
TRAV16
|
T cell receptor alpha variable 16 |
| chr5_-_135954962 | 0.08 |
ENST00000522943.5
ENST00000514447.2 ENST00000274507.6 |
LECT2
|
leukocyte cell derived chemotaxin 2 |
| chr8_+_66043413 | 0.08 |
ENST00000522619.1
|
DNAJC5B
|
DnaJ heat shock protein family (Hsp40) member C5 beta |
| chr16_+_56961942 | 0.07 |
ENST00000200676.8
ENST00000566128.1 |
CETP
|
cholesteryl ester transfer protein |
| chr12_-_91180365 | 0.07 |
ENST00000547937.5
|
DCN
|
decorin |
| chr9_+_96928310 | 0.07 |
ENST00000354649.7
|
NUTM2G
|
NUT family member 2G |
| chr1_-_118185157 | 0.07 |
ENST00000336338.10
|
SPAG17
|
sperm associated antigen 17 |
| chr17_-_31321603 | 0.07 |
ENST00000462804.3
|
EVI2A
|
ecotropic viral integration site 2A |
| chr9_-_111330224 | 0.07 |
ENST00000302681.3
|
OR2K2
|
olfactory receptor family 2 subfamily K member 2 |
| chr10_-_77637789 | 0.06 |
ENST00000481070.1
ENST00000640969.1 ENST00000286628.14 ENST00000638991.1 ENST00000639913.1 ENST00000480683.2 |
KCNMA1
|
potassium calcium-activated channel subfamily M alpha 1 |
| chr3_+_157436842 | 0.06 |
ENST00000295927.4
|
PTX3
|
pentraxin 3 |
| chr10_+_122910605 | 0.06 |
ENST00000368894.2
|
FAM24A
|
family with sequence similarity 24 member A |
| chr14_-_106360320 | 0.06 |
ENST00000390615.2
|
IGHV3-33
|
immunoglobulin heavy variable 3-33 |
| chr9_+_76459152 | 0.06 |
ENST00000444201.6
ENST00000376730.5 |
GCNT1
|
glucosaminyl (N-acetyl) transferase 1 |
| chr1_-_72100930 | 0.06 |
ENST00000306821.3
|
NEGR1
|
neuronal growth regulator 1 |
| chr19_+_15082211 | 0.06 |
ENST00000641398.1
|
OR1I1
|
olfactory receptor family 1 subfamily I member 1 |
| chr3_-_149792547 | 0.06 |
ENST00000446160.7
ENST00000462519.3 |
ANKUB1
|
ankyrin repeat and ubiquitin domain containing 1 |
| chr1_-_91906280 | 0.06 |
ENST00000370399.6
|
TGFBR3
|
transforming growth factor beta receptor 3 |
| chr10_-_77637721 | 0.06 |
ENST00000638848.1
ENST00000639406.1 ENST00000618048.2 ENST00000639120.1 ENST00000640834.1 ENST00000639601.1 ENST00000638514.1 ENST00000457953.6 ENST00000639090.1 ENST00000639489.1 ENST00000372440.6 ENST00000404771.8 ENST00000638203.1 ENST00000638306.1 ENST00000638351.1 ENST00000638606.1 ENST00000639591.1 ENST00000640182.1 ENST00000640605.1 ENST00000640141.1 |
KCNMA1
|
potassium calcium-activated channel subfamily M alpha 1 |
| chr13_-_33205997 | 0.06 |
ENST00000399365.7
|
STARD13
|
StAR related lipid transfer domain containing 13 |
| chr8_-_13276491 | 0.06 |
ENST00000512044.6
|
DLC1
|
DLC1 Rho GTPase activating protein |
| chr4_+_99574812 | 0.05 |
ENST00000422897.6
ENST00000265517.10 |
MTTP
|
microsomal triglyceride transfer protein |
| chr5_-_124745315 | 0.05 |
ENST00000306315.9
|
ZNF608
|
zinc finger protein 608 |
| chr7_+_124476371 | 0.05 |
ENST00000473520.1
|
SSU72P8
|
SSU72 pseudogene 8 |
| chr1_+_60865259 | 0.05 |
ENST00000371191.5
|
NFIA
|
nuclear factor I A |
| chr5_+_157269317 | 0.05 |
ENST00000618329.4
|
CYFIP2
|
cytoplasmic FMR1 interacting protein 2 |
| chr2_+_106063234 | 0.05 |
ENST00000409944.5
|
ECRG4
|
ECRG4 augurin precursor |
| chr2_-_189762755 | 0.05 |
ENST00000520350.1
ENST00000521630.1 ENST00000264151.10 ENST00000517895.5 |
OSGEPL1
|
O-sialoglycoprotein endopeptidase like 1 |
| chr13_+_48976597 | 0.05 |
ENST00000541916.5
|
FNDC3A
|
fibronectin type III domain containing 3A |
| chr19_-_6591103 | 0.05 |
ENST00000423145.7
ENST00000245903.4 |
CD70
|
CD70 molecule |
| chr5_+_141094595 | 0.05 |
ENST00000622947.1
ENST00000194155.7 ENST00000624874.1 ENST00000625033.1 |
PCDHB2
|
protocadherin beta 2 |
| chr18_-_12656716 | 0.05 |
ENST00000462226.1
ENST00000497844.6 ENST00000309836.9 ENST00000453447.6 |
SPIRE1
|
spire type actin nucleation factor 1 |
| chr12_-_10986912 | 0.05 |
ENST00000506868.1
|
TAS2R50
|
taste 2 receptor member 50 |
| chr4_+_122339221 | 0.05 |
ENST00000442707.1
|
KIAA1109
|
KIAA1109 |
| chr6_+_96563117 | 0.05 |
ENST00000450218.6
|
FHL5
|
four and a half LIM domains 5 |
| chr6_+_28124596 | 0.05 |
ENST00000340487.5
|
ZSCAN16
|
zinc finger and SCAN domain containing 16 |
| chr16_+_396713 | 0.05 |
ENST00000397722.5
|
NME4
|
NME/NM23 nucleoside diphosphate kinase 4 |
| chr7_-_122699108 | 0.05 |
ENST00000340112.3
|
RNF133
|
ring finger protein 133 |
| chr6_-_89217339 | 0.05 |
ENST00000454853.7
|
GABRR1
|
gamma-aminobutyric acid type A receptor subunit rho1 |
| chr2_+_120013068 | 0.05 |
ENST00000443902.6
ENST00000263713.10 |
EPB41L5
|
erythrocyte membrane protein band 4.1 like 5 |
| chr4_-_56681288 | 0.05 |
ENST00000556376.6
ENST00000420433.6 |
HOPX
|
HOP homeobox |
| chr5_+_141382702 | 0.05 |
ENST00000617050.1
ENST00000518325.2 |
PCDHGA7
|
protocadherin gamma subfamily A, 7 |
| chr5_+_141412979 | 0.04 |
ENST00000612503.1
ENST00000398610.3 |
PCDHGA10
|
protocadherin gamma subfamily A, 10 |
| chr12_-_8227587 | 0.04 |
ENST00000442295.2
ENST00000307435.10 ENST00000538603.6 |
FAM90A1
|
family with sequence similarity 90 member A1 |
| chr11_+_30231000 | 0.04 |
ENST00000254122.8
ENST00000533718.2 ENST00000417547.1 |
FSHB
|
follicle stimulating hormone subunit beta |
| chr6_-_15548360 | 0.04 |
ENST00000509674.1
|
DTNBP1
|
dystrobrevin binding protein 1 |
| chr1_-_94925759 | 0.04 |
ENST00000415017.1
ENST00000545882.5 |
CNN3
|
calponin 3 |
| chr5_-_88823763 | 0.04 |
ENST00000635898.1
ENST00000626391.2 ENST00000628656.2 |
MEF2C
|
myocyte enhancer factor 2C |
| chr6_+_28281555 | 0.04 |
ENST00000259883.3
ENST00000682144.1 |
PGBD1
|
piggyBac transposable element derived 1 |
| chr22_-_28306645 | 0.04 |
ENST00000612946.4
|
TTC28
|
tetratricopeptide repeat domain 28 |
| chr19_+_3762665 | 0.04 |
ENST00000330133.5
|
MRPL54
|
mitochondrial ribosomal protein L54 |
| chr17_-_445939 | 0.04 |
ENST00000329099.4
|
RFLNB
|
refilin B |
| chr12_+_32502114 | 0.04 |
ENST00000682739.1
ENST00000427716.7 ENST00000583694.2 |
FGD4
|
FYVE, RhoGEF and PH domain containing 4 |
| chr1_+_206834347 | 0.04 |
ENST00000340758.7
|
IL19
|
interleukin 19 |
| chr16_-_66550005 | 0.04 |
ENST00000527284.6
|
TK2
|
thymidine kinase 2 |
| chr12_+_18262730 | 0.04 |
ENST00000675017.1
|
PIK3C2G
|
phosphatidylinositol-4-phosphate 3-kinase catalytic subunit type 2 gamma |
| chr7_+_93921720 | 0.04 |
ENST00000248564.6
|
GNG11
|
G protein subunit gamma 11 |
| chrX_-_50200988 | 0.04 |
ENST00000358526.7
|
AKAP4
|
A-kinase anchoring protein 4 |
| chr3_+_45886501 | 0.04 |
ENST00000395963.2
|
CCR9
|
C-C motif chemokine receptor 9 |
| chrX_-_107777038 | 0.04 |
ENST00000480691.2
ENST00000506081.5 ENST00000514426.1 |
TSC22D3
|
TSC22 domain family member 3 |
| chr16_+_397209 | 0.04 |
ENST00000382940.8
|
NME4
|
NME/NM23 nucleoside diphosphate kinase 4 |
| chr9_-_92482350 | 0.04 |
ENST00000375543.2
|
ASPN
|
asporin |
| chr9_+_107306459 | 0.04 |
ENST00000457811.1
|
RAD23B
|
RAD23 homolog B, nucleotide excision repair protein |
| chr12_+_9827472 | 0.04 |
ENST00000617793.4
ENST00000617889.5 ENST00000354855.7 ENST00000279545.7 |
KLRF1
|
killer cell lectin like receptor F1 |
| chr6_-_22297028 | 0.04 |
ENST00000306482.2
|
PRL
|
prolactin |
| chrX_-_119150579 | 0.04 |
ENST00000402510.2
|
KIAA1210
|
KIAA1210 |
| chr16_-_20669855 | 0.04 |
ENST00000524149.5
|
ACSM1
|
acyl-CoA synthetase medium chain family member 1 |
| chr10_+_96000091 | 0.04 |
ENST00000424464.5
ENST00000410012.6 ENST00000344386.3 |
CC2D2B
|
coiled-coil and C2 domain containing 2B |
| chr10_-_77637902 | 0.04 |
ENST00000286627.10
ENST00000639486.1 ENST00000640523.1 |
KCNMA1
|
potassium calcium-activated channel subfamily M alpha 1 |
| chr6_+_132552693 | 0.04 |
ENST00000275200.1
|
TAAR8
|
trace amine associated receptor 8 |
| chr14_+_75632610 | 0.04 |
ENST00000555027.1
|
FLVCR2
|
FLVCR heme transporter 2 |
| chr19_-_53159004 | 0.04 |
ENST00000599096.1
ENST00000597183.5 ENST00000601804.5 ENST00000334197.12 ENST00000601469.2 ENST00000452676.6 |
ZNF347
|
zinc finger protein 347 |
| chr11_-_86672419 | 0.04 |
ENST00000524826.7
ENST00000532471.1 |
ME3
|
malic enzyme 3 |
| chr1_+_159780930 | 0.04 |
ENST00000368109.5
ENST00000368108.7 ENST00000368107.2 |
DUSP23
|
dual specificity phosphatase 23 |
| chr16_-_66550091 | 0.04 |
ENST00000564917.5
ENST00000677420.1 |
TK2
|
thymidine kinase 2 |
| chr16_+_397183 | 0.04 |
ENST00000620944.4
ENST00000621774.4 ENST00000219479.7 |
NME4
|
NME/NM23 nucleoside diphosphate kinase 4 |
| chr22_+_19479457 | 0.04 |
ENST00000407835.6
ENST00000455750.6 |
CDC45
|
cell division cycle 45 |
| chr19_+_9185594 | 0.04 |
ENST00000344248.4
|
OR7D2
|
olfactory receptor family 7 subfamily D member 2 |
| chr5_-_111512473 | 0.04 |
ENST00000296632.8
ENST00000512160.5 ENST00000509887.5 |
STARD4
|
StAR related lipid transfer domain containing 4 |
| chr9_-_28670285 | 0.04 |
ENST00000379992.6
ENST00000308675.5 ENST00000613945.3 |
LINGO2
|
leucine rich repeat and Ig domain containing 2 |
| chr8_-_6926066 | 0.03 |
ENST00000297436.3
|
DEFA6
|
defensin alpha 6 |
| chr19_+_926001 | 0.03 |
ENST00000263620.8
|
ARID3A
|
AT-rich interaction domain 3A |
| chr12_-_95551417 | 0.03 |
ENST00000258499.8
|
USP44
|
ubiquitin specific peptidase 44 |
| chr6_+_20534441 | 0.03 |
ENST00000274695.8
ENST00000613575.4 |
CDKAL1
|
CDK5 regulatory subunit associated protein 1 like 1 |
| chr15_-_42208153 | 0.03 |
ENST00000348544.4
ENST00000318006.10 |
VPS39
|
VPS39 subunit of HOPS complex |
| chr14_-_106025628 | 0.03 |
ENST00000631943.1
|
IGHV7-4-1
|
immunoglobulin heavy variable 7-4-1 |
| chr9_-_110999458 | 0.03 |
ENST00000374430.6
|
LPAR1
|
lysophosphatidic acid receptor 1 |
| chr7_+_150567347 | 0.03 |
ENST00000461940.5
|
GIMAP4
|
GTPase, IMAP family member 4 |
| chrX_+_41724174 | 0.03 |
ENST00000302548.5
|
GPR82
|
G protein-coupled receptor 82 |
| chr17_-_69268812 | 0.03 |
ENST00000586811.1
|
ABCA5
|
ATP binding cassette subfamily A member 5 |
| chr20_+_11917859 | 0.03 |
ENST00000618296.4
ENST00000378226.7 |
BTBD3
|
BTB domain containing 3 |
| chr10_-_20897288 | 0.03 |
ENST00000377122.9
|
NEBL
|
nebulette |
| chr16_+_397226 | 0.03 |
ENST00000433358.5
|
NME4
|
NME/NM23 nucleoside diphosphate kinase 4 |
| chr20_-_47355657 | 0.03 |
ENST00000311275.11
|
ZMYND8
|
zinc finger MYND-type containing 8 |
| chr7_-_50450324 | 0.03 |
ENST00000356889.8
ENST00000420829.5 ENST00000448788.1 ENST00000395556.6 ENST00000433017.6 ENST00000422854.5 ENST00000435566.5 ENST00000617389.4 ENST00000611938.4 ENST00000615084.4 |
FIGNL1
|
fidgetin like 1 |
| chr16_-_66550112 | 0.03 |
ENST00000544898.6
ENST00000620035.5 ENST00000545043.6 |
TK2
|
thymidine kinase 2 |
| chr5_+_173889337 | 0.03 |
ENST00000520867.5
ENST00000334035.9 |
CPEB4
|
cytoplasmic polyadenylation element binding protein 4 |
| chr12_+_93677556 | 0.03 |
ENST00000542893.2
|
CRADD
|
CASP2 and RIPK1 domain containing adaptor with death domain |
| chr5_-_76623391 | 0.03 |
ENST00000296641.5
ENST00000504899.1 |
F2RL2
|
coagulation factor II thrombin receptor like 2 |
| chr4_+_118888918 | 0.03 |
ENST00000434046.6
|
SYNPO2
|
synaptopodin 2 |
| chr2_+_108621260 | 0.03 |
ENST00000409441.5
|
LIMS1
|
LIM zinc finger domain containing 1 |
| chr12_+_59689337 | 0.03 |
ENST00000261187.8
|
SLC16A7
|
solute carrier family 16 member 7 |
| chr15_-_26773737 | 0.03 |
ENST00000299267.8
|
GABRB3
|
gamma-aminobutyric acid type A receptor subunit beta3 |
| chr11_-_86672630 | 0.03 |
ENST00000543262.5
|
ME3
|
malic enzyme 3 |
| chr2_-_53859929 | 0.03 |
ENST00000394705.3
ENST00000406625.6 |
GPR75
ASB3
|
G protein-coupled receptor 75 ankyrin repeat and SOCS box containing 3 |
| chr2_-_40453438 | 0.03 |
ENST00000455476.5
|
SLC8A1
|
solute carrier family 8 member A1 |
| chr12_-_71157872 | 0.03 |
ENST00000546561.2
|
TSPAN8
|
tetraspanin 8 |
| chr15_+_51377247 | 0.03 |
ENST00000396399.6
|
GLDN
|
gliomedin |
| chr3_-_197573323 | 0.03 |
ENST00000358186.6
ENST00000431056.5 |
BDH1
|
3-hydroxybutyrate dehydrogenase 1 |
| chr16_+_21678514 | 0.03 |
ENST00000286149.8
ENST00000388958.8 |
OTOA
|
otoancorin |
| chr15_-_42156590 | 0.03 |
ENST00000397272.7
|
PLA2G4F
|
phospholipase A2 group IVF |
| chr9_-_14300231 | 0.03 |
ENST00000636735.1
|
NFIB
|
nuclear factor I B |
| chr5_+_141364153 | 0.03 |
ENST00000518069.2
|
PCDHGA5
|
protocadherin gamma subfamily A, 5 |
| chr9_+_87497222 | 0.03 |
ENST00000358077.9
|
DAPK1
|
death associated protein kinase 1 |
| chr16_+_89658025 | 0.03 |
ENST00000611218.1
ENST00000568929.1 |
SPATA33
|
spermatogenesis associated 33 |
| chr12_-_7695752 | 0.03 |
ENST00000329913.4
|
GDF3
|
growth differentiation factor 3 |
| chr6_-_130956371 | 0.03 |
ENST00000639623.1
ENST00000525193.5 ENST00000527659.5 |
EPB41L2
|
erythrocyte membrane protein band 4.1 like 2 |
| chr17_+_55266216 | 0.03 |
ENST00000573945.5
|
HLF
|
HLF transcription factor, PAR bZIP family member |
| chr20_+_142573 | 0.03 |
ENST00000382398.4
|
DEFB126
|
defensin beta 126 |
| chr12_-_56934403 | 0.03 |
ENST00000293502.2
|
SDR9C7
|
short chain dehydrogenase/reductase family 9C member 7 |
| chr19_-_7040179 | 0.03 |
ENST00000381394.9
|
MBD3L4
|
methyl-CpG binding domain protein 3 like 4 |
| chr12_-_21910853 | 0.03 |
ENST00000544039.5
|
ABCC9
|
ATP binding cassette subfamily C member 9 |
| chr7_-_149461056 | 0.03 |
ENST00000247930.5
|
ZNF777
|
zinc finger protein 777 |
| chr16_+_16340328 | 0.03 |
ENST00000524823.6
|
ENSG00000183889.12
|
novel member of the nuclear pore complex interacting protein NPIP gene family |
| chr11_-_5324297 | 0.03 |
ENST00000624187.1
|
OR51B2
|
olfactory receptor family 51 subfamily B member 2 |
| chr6_+_85449584 | 0.03 |
ENST00000369651.7
|
NT5E
|
5'-nucleotidase ecto |
| chr9_-_72060590 | 0.03 |
ENST00000652156.1
|
C9orf57
|
chromosome 9 open reading frame 57 |
| chr1_+_174964750 | 0.03 |
ENST00000367688.3
|
RABGAP1L
|
RAB GTPase activating protein 1 like |
| chr12_-_71157992 | 0.03 |
ENST00000247829.8
|
TSPAN8
|
tetraspanin 8 |
| chr5_+_141364231 | 0.03 |
ENST00000611914.1
|
PCDHGA5
|
protocadherin gamma subfamily A, 5 |
| chr5_-_56116946 | 0.03 |
ENST00000434982.2
|
ANKRD55
|
ankyrin repeat domain 55 |
| chr3_-_51875597 | 0.03 |
ENST00000446461.2
|
IQCF5
|
IQ motif containing F5 |
| chr12_+_53441724 | 0.03 |
ENST00000551003.5
ENST00000429243.7 ENST00000549068.5 ENST00000549740.5 ENST00000546581.5 ENST00000549581.5 ENST00000547368.5 ENST00000379786.8 ENST00000551945.5 ENST00000547717.1 |
PRR13
ENSG00000257379.1
|
proline rich 13 novel transcript |
| chr8_-_123737378 | 0.03 |
ENST00000419625.6
ENST00000262219.10 |
ANXA13
|
annexin A13 |
| chr18_-_5396265 | 0.03 |
ENST00000579951.2
|
EPB41L3
|
erythrocyte membrane protein band 4.1 like 3 |
| chr16_-_29485859 | 0.03 |
ENST00000458643.3
|
NPIPB12
|
nuclear pore complex interacting protein family member B12 |
| chr4_-_7871986 | 0.03 |
ENST00000360265.9
|
AFAP1
|
actin filament associated protein 1 |
| chr2_-_88966767 | 0.03 |
ENST00000464162.1
|
IGKV1-6
|
immunoglobulin kappa variable 1-6 |
| chr9_-_13279407 | 0.03 |
ENST00000546205.5
|
MPDZ
|
multiple PDZ domain crumbs cell polarity complex component |
| chr1_-_167518583 | 0.03 |
ENST00000392122.3
|
CD247
|
CD247 molecule |
| chr3_-_194633689 | 0.03 |
ENST00000330115.3
|
TMEM44
|
transmembrane protein 44 |
| chr2_-_168890368 | 0.03 |
ENST00000282074.7
|
SPC25
|
SPC25 component of NDC80 kinetochore complex |
| chrX_-_132128020 | 0.03 |
ENST00000298542.9
|
FRMD7
|
FERM domain containing 7 |
| chr1_-_53945584 | 0.02 |
ENST00000371377.3
|
HSPB11
|
heat shock protein family B (small) member 11 |
| chr20_+_87665 | 0.02 |
ENST00000382410.3
|
DEFB125
|
defensin beta 125 |
| chr5_-_16742221 | 0.02 |
ENST00000505695.5
|
MYO10
|
myosin X |
| chr16_-_66550142 | 0.02 |
ENST00000417693.8
ENST00000299697.12 ENST00000451102.7 |
TK2
|
thymidine kinase 2 |
| chr16_+_89657855 | 0.02 |
ENST00000564238.2
|
SPATA33
|
spermatogenesis associated 33 |
| chr6_+_42746958 | 0.02 |
ENST00000614467.4
|
BICRAL
|
BRD4 interacting chromatin remodeling complex associated protein like |
| chrX_+_44844015 | 0.02 |
ENST00000339042.6
|
DUSP21
|
dual specificity phosphatase 21 |
| chr1_+_158254414 | 0.02 |
ENST00000289429.6
|
CD1A
|
CD1a molecule |
| chr20_+_1266263 | 0.02 |
ENST00000649598.1
ENST00000381867.6 ENST00000381873.7 |
SNPH
|
syntaphilin |
| chr6_+_131637296 | 0.02 |
ENST00000358229.6
ENST00000357639.8 |
ENPP3
|
ectonucleotide pyrophosphatase/phosphodiesterase 3 |
| chr3_+_171843337 | 0.02 |
ENST00000334567.9
ENST00000619900.4 ENST00000450693.1 |
TMEM212
|
transmembrane protein 212 |
| chr12_-_49897056 | 0.02 |
ENST00000552863.5
|
FAIM2
|
Fas apoptotic inhibitory molecule 2 |
| chr8_-_100145802 | 0.02 |
ENST00000428847.3
|
FBXO43
|
F-box protein 43 |
| chr1_-_167518521 | 0.02 |
ENST00000362089.10
|
CD247
|
CD247 molecule |
| chr10_+_88586762 | 0.02 |
ENST00000371939.7
|
LIPJ
|
lipase family member J |
| chr10_+_113854610 | 0.02 |
ENST00000369301.3
|
NHLRC2
|
NHL repeat containing 2 |
| chr1_-_53945567 | 0.02 |
ENST00000371378.6
|
HSPB11
|
heat shock protein family B (small) member 11 |
| chr12_-_103495953 | 0.02 |
ENST00000552578.1
ENST00000548048.5 ENST00000548883.5 ENST00000378113.7 |
C12orf42
|
chromosome 12 open reading frame 42 |
| chr19_+_7030578 | 0.02 |
ENST00000329753.5
|
MBD3L5
|
methyl-CpG binding domain protein 3 like 5 |
| chr1_-_150235972 | 0.02 |
ENST00000534220.1
|
ANP32E
|
acidic nuclear phosphoprotein 32 family member E |
| chr3_-_194351290 | 0.02 |
ENST00000429275.1
ENST00000323830.4 |
CPN2
|
carboxypeptidase N subunit 2 |
| chr4_-_144140683 | 0.02 |
ENST00000324022.14
|
GYPA
|
glycophorin A (MNS blood group) |
| chr1_-_21050952 | 0.02 |
ENST00000264211.12
|
EIF4G3
|
eukaryotic translation initiation factor 4 gamma 3 |
| chr11_+_4329865 | 0.02 |
ENST00000640302.1
|
SSU72P3
|
SSU72 pseudogene 3 |
| chr15_-_99249523 | 0.02 |
ENST00000560235.1
ENST00000394132.7 ENST00000560860.5 ENST00000558078.5 ENST00000560772.5 |
TTC23
|
tetratricopeptide repeat domain 23 |
| chr12_+_8843236 | 0.02 |
ENST00000541459.5
|
A2ML1
|
alpha-2-macroglobulin like 1 |
| chr3_-_9952337 | 0.02 |
ENST00000411976.2
ENST00000412055.6 |
PRRT3
|
proline rich transmembrane protein 3 |
| chr1_+_206406377 | 0.02 |
ENST00000605476.5
|
SRGAP2
|
SLIT-ROBO Rho GTPase activating protein 2 |
| chr15_-_88546585 | 0.02 |
ENST00000649547.1
ENST00000558413.1 ENST00000564406.5 ENST00000268148.13 |
ENSG00000173867.10
DET1
|
novel transcript DET1 partner of COP1 E3 ubiquitin ligase |
| chr5_+_65926556 | 0.02 |
ENST00000380943.6
ENST00000416865.6 ENST00000380935.5 ENST00000284037.10 |
ERBIN
|
erbb2 interacting protein |
| chr1_-_244864560 | 0.02 |
ENST00000444376.7
|
HNRNPU
|
heterogeneous nuclear ribonucleoprotein U |
| chr1_-_160523204 | 0.02 |
ENST00000368055.1
ENST00000368057.8 ENST00000368059.7 |
SLAMF6
|
SLAM family member 6 |
| chr16_+_28751787 | 0.02 |
ENST00000357796.7
ENST00000550983.1 |
NPIPB9
|
nuclear pore complex interacting protein family member B9 |
| chr1_+_12857086 | 0.02 |
ENST00000240189.2
|
PRAMEF2
|
PRAME family member 2 |
| chr17_-_3398410 | 0.02 |
ENST00000322608.2
|
OR1E1
|
olfactory receptor family 1 subfamily E member 1 |
| chr9_-_15510289 | 0.02 |
ENST00000397519.6
|
PSIP1
|
PC4 and SFRS1 interacting protein 1 |
| chr11_+_89924064 | 0.02 |
ENST00000623787.3
|
TRIM49D2
|
tripartite motif containing 49D2 |
| chr20_+_6007245 | 0.02 |
ENST00000378868.4
|
CRLS1
|
cardiolipin synthase 1 |
| chr4_-_7872255 | 0.02 |
ENST00000382543.4
|
AFAP1
|
actin filament associated protein 1 |
| chr2_-_171231314 | 0.02 |
ENST00000521943.5
|
TLK1
|
tousled like kinase 1 |
| chr10_+_96304425 | 0.02 |
ENST00000371174.5
|
DNTT
|
DNA nucleotidylexotransferase |
| chr7_-_64982021 | 0.02 |
ENST00000610793.1
ENST00000620222.4 |
ZNF117
|
zinc finger protein 117 |
| chr1_-_205121964 | 0.02 |
ENST00000264515.11
|
RBBP5
|
RB binding protein 5, histone lysine methyltransferase complex subunit |
| chr1_-_66801276 | 0.02 |
ENST00000304526.3
|
INSL5
|
insulin like 5 |
| chr1_-_35193135 | 0.02 |
ENST00000357214.6
|
SFPQ
|
splicing factor proline and glutamine rich |
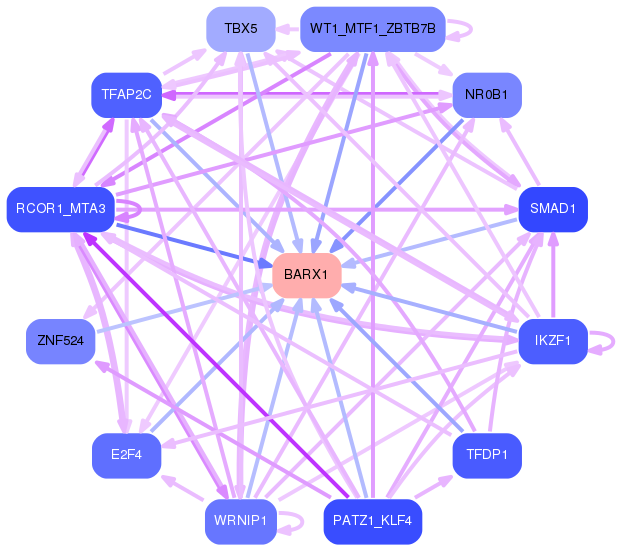
Network of associatons between targets according to the STRING database.

First level regulatory network of BARX1
Gene Ontology Analysis
Gene overrepresentation in biological process category:
| Log-likelihood per target | Total log-likelihood | Term | Description |
|---|---|---|---|
| 0.0 | 0.1 | GO:1990523 | bone regeneration(GO:1990523) |
| 0.0 | 0.2 | GO:0046092 | deoxycytidine metabolic process(GO:0046092) |
| 0.0 | 0.1 | GO:1904158 | axonemal central apparatus assembly(GO:1904158) |
| 0.0 | 0.1 | GO:1903015 | regulation of exo-alpha-sialidase activity(GO:1903015) |
| 0.0 | 0.1 | GO:0002949 | tRNA threonylcarbamoyladenosine modification(GO:0002949) |
| 0.0 | 0.0 | GO:0070859 | positive regulation of bile acid biosynthetic process(GO:0070859) positive regulation of bile acid metabolic process(GO:1904253) |
| 0.0 | 0.0 | GO:1902299 | pre-replicative complex assembly involved in nuclear cell cycle DNA replication(GO:0006267) pre-replicative complex assembly(GO:0036388) pre-replicative complex assembly involved in cell cycle DNA replication(GO:1902299) |
| 0.0 | 0.0 | GO:0061182 | negative regulation of chondrocyte development(GO:0061182) |
| 0.0 | 0.1 | GO:0034699 | transforming growth factor beta receptor complex assembly(GO:0007181) response to luteinizing hormone(GO:0034699) |
| 0.0 | 0.0 | GO:0002305 | gamma-delta intraepithelial T cell differentiation(GO:0002304) CD8-positive, gamma-delta intraepithelial T cell differentiation(GO:0002305) |
| 0.0 | 0.0 | GO:0018874 | benzoate metabolic process(GO:0018874) |
| 0.0 | 0.2 | GO:0034465 | response to carbon monoxide(GO:0034465) |
Gene overrepresentation in cellular component category:
| Log-likelihood per target | Total log-likelihood | Term | Description |
|---|---|---|---|
| 0.0 | 0.2 | GO:0034680 | integrin alpha10-beta1 complex(GO:0034680) |
| 0.0 | 0.1 | GO:1990716 | axonemal central apparatus(GO:1990716) |
| 0.0 | 0.0 | GO:0005656 | nuclear pre-replicative complex(GO:0005656) pre-replicative complex(GO:0036387) |
| 0.0 | 0.2 | GO:0098647 | collagen type VI trimer(GO:0005589) collagen beaded filament(GO:0098647) |
| 0.0 | 0.0 | GO:0034515 | proteasome storage granule(GO:0034515) |
Gene overrepresentation in molecular function category:
| Log-likelihood per target | Total log-likelihood | Term | Description |
|---|---|---|---|
| 0.0 | 0.2 | GO:0098639 | collagen binding involved in cell-matrix adhesion(GO:0098639) |
| 0.0 | 0.1 | GO:0017129 | triglyceride binding(GO:0017129) |
| 0.0 | 0.2 | GO:0004137 | deoxycytidine kinase activity(GO:0004137) thymidine kinase activity(GO:0004797) |
| 0.0 | 0.1 | GO:0003829 | beta-1,3-galactosyl-O-glycosyl-glycoprotein beta-1,6-N-acetylglucosaminyltransferase activity(GO:0003829) |
| 0.0 | 0.2 | GO:0060072 | large conductance calcium-activated potassium channel activity(GO:0060072) |
| 0.0 | 0.1 | GO:0004471 | malate dehydrogenase (decarboxylating) (NAD+) activity(GO:0004471) malate dehydrogenase (decarboxylating) (NADP+) activity(GO:0004473) |
| 0.0 | 0.0 | GO:0005148 | prolactin receptor binding(GO:0005148) |
| 0.0 | 0.2 | GO:1901612 | cardiolipin binding(GO:1901612) |
| 0.0 | 0.0 | GO:1904492 | Ac-Asp-Glu binding(GO:1904492) tetrahydrofolyl-poly(glutamate) polymer binding(GO:1904493) |
| 0.0 | 0.0 | GO:0005477 | pyruvate secondary active transmembrane transporter activity(GO:0005477) |