Project
Epithelial-Mesenchymal Transition, human (Scheel, 2011)
Navigation
Downloads
Results for BBX
Z-value: 0.51
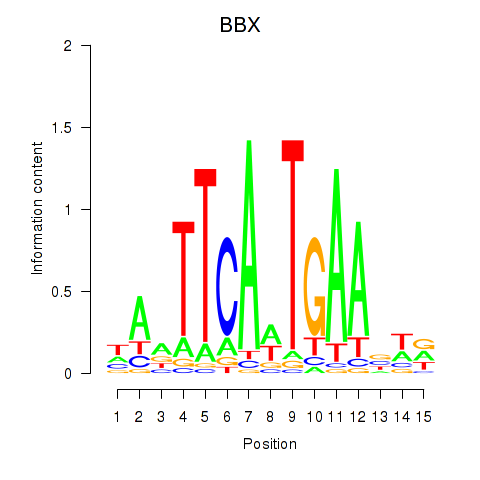
Motif logo
Transcription factors associated with BBX
| Gene Symbol | Gene ID | Gene Info |
|---|---|---|
|
BBX
|
ENSG00000114439.19 | BBX high mobility group box domain containing |
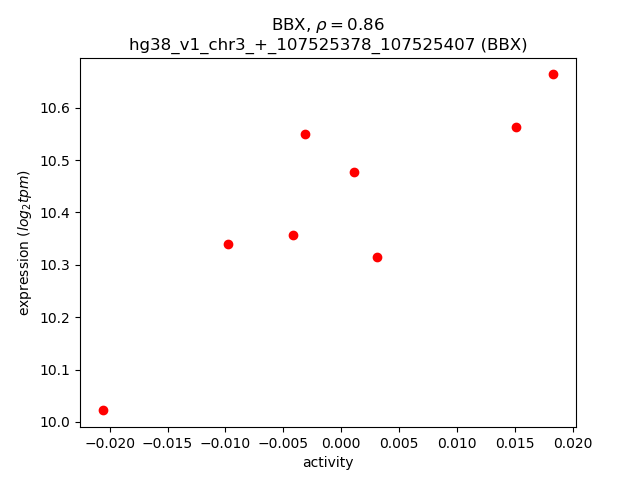
Activity-expression correlation:
| Gene | Promoter | Pearson corr. coef. | P-value | Plot |
|---|---|---|---|---|
| BBX | hg38_v1_chr3_+_107525378_107525407 | 0.86 | 6.3e-03 | Click! |
Activity profile of BBX motif
Sorted Z-values of BBX motif
| Promoter | Log-likelihood | Transcript | Gene | Gene Info |
|---|---|---|---|---|
| chr1_+_78620722 | 0.58 |
ENST00000679848.1
|
IFI44L
|
interferon induced protein 44 like |
| chr4_-_158159657 | 0.56 |
ENST00000590648.5
|
GASK1B
|
golgi associated kinase 1B |
| chr6_+_72212802 | 0.44 |
ENST00000401910.7
|
RIMS1
|
regulating synaptic membrane exocytosis 1 |
| chr9_-_92482350 | 0.44 |
ENST00000375543.2
|
ASPN
|
asporin |
| chr6_+_72212887 | 0.41 |
ENST00000523963.5
|
RIMS1
|
regulating synaptic membrane exocytosis 1 |
| chr8_-_107497909 | 0.37 |
ENST00000517746.6
|
ANGPT1
|
angiopoietin 1 |
| chr8_-_107498041 | 0.37 |
ENST00000297450.7
|
ANGPT1
|
angiopoietin 1 |
| chr9_-_92482499 | 0.36 |
ENST00000375544.7
|
ASPN
|
asporin |
| chrX_+_54807599 | 0.31 |
ENST00000375053.6
ENST00000627068.2 ENST00000375068.6 ENST00000347546.8 |
MAGED2
|
MAGE family member D2 |
| chr9_-_92404559 | 0.30 |
ENST00000262551.8
ENST00000375561.10 |
OGN
|
osteoglycin |
| chr4_-_185775271 | 0.27 |
ENST00000430503.5
ENST00000319454.10 ENST00000450341.5 |
SORBS2
|
sorbin and SH3 domain containing 2 |
| chr9_-_90642855 | 0.22 |
ENST00000637905.1
|
DIRAS2
|
DIRAS family GTPase 2 |
| chr15_+_72118392 | 0.21 |
ENST00000340912.6
|
SENP8
|
SUMO peptidase family member, NEDD8 specific |
| chr4_-_185775890 | 0.18 |
ENST00000437304.6
|
SORBS2
|
sorbin and SH3 domain containing 2 |
| chr20_-_31722854 | 0.17 |
ENST00000307677.5
|
BCL2L1
|
BCL2 like 1 |
| chr2_+_209653171 | 0.17 |
ENST00000447185.5
|
MAP2
|
microtubule associated protein 2 |
| chr20_-_31722533 | 0.16 |
ENST00000677194.1
ENST00000434194.2 ENST00000376062.6 |
BCL2L1
|
BCL2 like 1 |
| chr20_-_31722949 | 0.16 |
ENST00000376055.9
|
BCL2L1
|
BCL2 like 1 |
| chr2_-_119366682 | 0.16 |
ENST00000409877.5
ENST00000409523.1 ENST00000409466.6 |
C2orf76
|
chromosome 2 open reading frame 76 |
| chr10_+_110005804 | 0.15 |
ENST00000360162.7
|
ADD3
|
adducin 3 |
| chr4_-_185812209 | 0.15 |
ENST00000393523.6
ENST00000393528.7 ENST00000449407.6 |
SORBS2
|
sorbin and SH3 domain containing 2 |
| chr4_-_993430 | 0.14 |
ENST00000361661.6
ENST00000622731.4 |
SLC26A1
|
solute carrier family 26 member 1 |
| chr2_-_110473041 | 0.12 |
ENST00000632897.1
ENST00000413601.3 |
LIMS4
|
LIM zinc finger domain containing 4 |
| chr4_-_993376 | 0.12 |
ENST00000398520.6
ENST00000398516.3 |
SLC26A1
|
solute carrier family 26 member 1 |
| chr4_-_103099811 | 0.12 |
ENST00000504285.5
ENST00000296424.9 |
BDH2
|
3-hydroxybutyrate dehydrogenase 2 |
| chr2_+_200440649 | 0.12 |
ENST00000366118.2
|
SPATS2L
|
spermatogenesis associated serine rich 2 like |
| chr3_+_122680802 | 0.12 |
ENST00000474629.7
|
PARP14
|
poly(ADP-ribose) polymerase family member 14 |
| chr6_-_117573571 | 0.11 |
ENST00000467125.1
|
ENSG00000282218.1
|
novel protein, GOPC-ROS1 readthrough |
| chr2_-_61854119 | 0.11 |
ENST00000405894.3
|
FAM161A
|
FAM161 centrosomal protein A |
| chr2_-_61854013 | 0.11 |
ENST00000404929.6
|
FAM161A
|
FAM161 centrosomal protein A |
| chr3_-_58666765 | 0.11 |
ENST00000358781.7
|
FAM3D
|
FAM3 metabolism regulating signaling molecule D |
| chr22_+_32475235 | 0.10 |
ENST00000452138.3
|
FBXO7
|
F-box protein 7 |
| chr10_-_13972355 | 0.10 |
ENST00000264546.10
|
FRMD4A
|
FERM domain containing 4A |
| chr21_+_46635595 | 0.09 |
ENST00000451211.6
ENST00000458387.6 ENST00000397638.6 ENST00000291705.11 ENST00000397637.5 ENST00000334494.8 ENST00000397628.5 ENST00000355680.8 ENST00000440086.5 |
PRMT2
|
protein arginine methyltransferase 2 |
| chr11_+_58622659 | 0.09 |
ENST00000361987.6
|
CNTF
|
ciliary neurotrophic factor |
| chr5_+_141135199 | 0.09 |
ENST00000231134.8
ENST00000623915.1 |
PCDHB5
|
protocadherin beta 5 |
| chr22_+_32475257 | 0.09 |
ENST00000397426.5
|
FBXO7
|
F-box protein 7 |
| chr6_+_52420107 | 0.09 |
ENST00000636489.1
ENST00000637089.1 ENST00000637353.1 ENST00000637263.1 |
EFHC1
|
EF-hand domain containing 1 |
| chr3_-_146528750 | 0.09 |
ENST00000483300.5
|
PLSCR1
|
phospholipid scramblase 1 |
| chr6_+_117482634 | 0.08 |
ENST00000296955.12
ENST00000338728.10 |
DCBLD1
|
discoidin, CUB and LCCL domain containing 1 |
| chr3_+_151814102 | 0.08 |
ENST00000232892.12
|
AADAC
|
arylacetamide deacetylase |
| chr9_+_35161951 | 0.08 |
ENST00000617908.4
ENST00000619578.4 |
UNC13B
|
unc-13 homolog B |
| chr1_-_686673 | 0.08 |
ENST00000332831.4
|
OR4F16
|
olfactory receptor family 4 subfamily F member 16 |
| chr4_+_70592253 | 0.08 |
ENST00000322937.10
ENST00000613447.4 |
AMBN
|
ameloblastin |
| chr17_-_44066595 | 0.08 |
ENST00000585388.2
ENST00000293406.8 |
LSM12
|
LSM12 homolog |
| chr12_-_8612850 | 0.07 |
ENST00000229335.11
ENST00000537228.5 |
AICDA
|
activation induced cytidine deaminase |
| chr5_+_141430499 | 0.07 |
ENST00000252085.4
|
PCDHGA12
|
protocadherin gamma subfamily A, 12 |
| chr19_+_7763210 | 0.06 |
ENST00000359059.10
ENST00000596363.5 ENST00000394122.7 ENST00000327325.10 |
CLEC4M
|
C-type lectin domain family 4 member M |
| chr20_+_23440248 | 0.06 |
ENST00000246020.2
|
CSTL1
|
cystatin like 1 |
| chr2_-_230219902 | 0.06 |
ENST00000409815.6
|
SP110
|
SP110 nuclear body protein |
| chr3_-_112499457 | 0.06 |
ENST00000334529.10
|
BTLA
|
B and T lymphocyte associated |
| chr7_+_117480011 | 0.06 |
ENST00000649406.1
ENST00000648260.1 ENST00000003084.11 |
CFTR
|
CF transmembrane conductance regulator |
| chr7_-_16881967 | 0.06 |
ENST00000402239.7
ENST00000310398.7 ENST00000414935.1 |
AGR3
|
anterior gradient 3, protein disulphide isomerase family member |
| chr5_+_181367268 | 0.06 |
ENST00000456475.1
|
OR4F3
|
olfactory receptor family 4 subfamily F member 3 |
| chr12_+_18262730 | 0.06 |
ENST00000675017.1
|
PIK3C2G
|
phosphatidylinositol-4-phosphate 3-kinase catalytic subunit type 2 gamma |
| chr6_-_135497230 | 0.06 |
ENST00000681365.1
|
AHI1
|
Abelson helper integration site 1 |
| chr21_+_30396030 | 0.05 |
ENST00000355459.4
|
KRTAP13-1
|
keratin associated protein 13-1 |
| chr6_-_29375291 | 0.05 |
ENST00000396806.3
|
OR12D3
|
olfactory receptor family 12 subfamily D member 3 |
| chr12_-_99984227 | 0.05 |
ENST00000547776.6
ENST00000547010.5 |
ANKS1B
|
ankyrin repeat and sterile alpha motif domain containing 1B |
| chr17_-_75785486 | 0.05 |
ENST00000586607.5
|
H3-3B
|
H3.3 histone B |
| chr19_-_18397596 | 0.05 |
ENST00000595840.1
ENST00000339007.4 |
LRRC25
|
leucine rich repeat containing 25 |
| chr9_+_35162000 | 0.05 |
ENST00000396787.5
ENST00000378495.7 ENST00000635942.1 ENST00000378496.8 |
UNC13B
|
unc-13 homolog B |
| chr9_+_65700287 | 0.05 |
ENST00000489273.1
|
CBWD5
|
COBW domain containing 5 |
| chr1_+_95151377 | 0.05 |
ENST00000604203.1
|
TLCD4-RWDD3
|
TLCD4-RWDD3 readthrough |
| chr2_+_112181788 | 0.04 |
ENST00000272559.4
|
FBLN7
|
fibulin 7 |
| chr1_-_37514743 | 0.04 |
ENST00000448519.2
ENST00000373075.6 ENST00000373073.8 ENST00000296214.10 |
MEAF6
|
MYST/Esa1 associated factor 6 |
| chr1_+_54998927 | 0.04 |
ENST00000651561.1
|
BSND
|
barttin CLCNK type accessory subunit beta |
| chr7_+_117480052 | 0.04 |
ENST00000426809.5
ENST00000649781.1 |
CFTR
|
CF transmembrane conductance regulator |
| chr9_-_13175824 | 0.04 |
ENST00000545857.5
|
MPDZ
|
multiple PDZ domain crumbs cell polarity complex component |
| chr13_+_76948500 | 0.04 |
ENST00000377462.6
|
ACOD1
|
aconitate decarboxylase 1 |
| chr15_-_75455767 | 0.04 |
ENST00000360439.8
|
SIN3A
|
SIN3 transcription regulator family member A |
| chr16_+_56638659 | 0.03 |
ENST00000290705.12
|
MT1A
|
metallothionein 1A |
| chr2_+_33436304 | 0.03 |
ENST00000402538.7
|
RASGRP3
|
RAS guanyl releasing protein 3 |
| chr5_-_149550284 | 0.03 |
ENST00000504676.5
ENST00000515435.5 |
CSNK1A1
|
casein kinase 1 alpha 1 |
| chr7_+_66075876 | 0.03 |
ENST00000395332.8
|
ASL
|
argininosuccinate lyase |
| chr6_-_160664270 | 0.03 |
ENST00000316300.10
|
LPA
|
lipoprotein(a) |
| chr6_+_29457155 | 0.03 |
ENST00000377133.6
ENST00000377136.5 |
OR2H1
|
olfactory receptor family 2 subfamily H member 1 |
| chr1_+_152811971 | 0.03 |
ENST00000360090.4
|
LCE1B
|
late cornified envelope 1B |
| chr3_+_111542178 | 0.03 |
ENST00000283285.10
ENST00000352690.9 |
CD96
|
CD96 molecule |
| chr9_-_146140 | 0.03 |
ENST00000475990.5
|
CBWD1
|
COBW domain containing 1 |
| chr5_+_40841308 | 0.03 |
ENST00000381677.4
ENST00000254691.10 |
CARD6
|
caspase recruitment domain family member 6 |
| chr11_+_56176618 | 0.03 |
ENST00000312298.1
|
OR5J2
|
olfactory receptor family 5 subfamily J member 2 |
| chr17_-_61591192 | 0.02 |
ENST00000521764.3
|
NACA2
|
nascent polypeptide associated complex subunit alpha 2 |
| chr7_-_140924900 | 0.02 |
ENST00000646891.1
ENST00000644969.2 |
BRAF
|
B-Raf proto-oncogene, serine/threonine kinase |
| chr1_+_117420597 | 0.02 |
ENST00000449370.6
|
MAN1A2
|
mannosidase alpha class 1A member 2 |
| chr1_-_13285154 | 0.02 |
ENST00000357367.6
ENST00000614831.1 |
PRAMEF8
|
PRAME family member 8 |
| chr5_+_141182369 | 0.02 |
ENST00000609684.3
ENST00000625044.1 ENST00000623407.1 ENST00000623884.1 |
PCDHB16
ENSG00000279068.1
|
protocadherin beta 16 novel transcript |
| chr5_+_148394712 | 0.02 |
ENST00000513826.1
|
FBXO38
|
F-box protein 38 |
| chr1_+_192575765 | 0.02 |
ENST00000469578.2
ENST00000367459.8 |
RGS1
|
regulator of G protein signaling 1 |
| chr10_-_92243246 | 0.02 |
ENST00000412050.8
ENST00000614585.4 |
CPEB3
|
cytoplasmic polyadenylation element binding protein 3 |
| chr5_+_126423122 | 0.02 |
ENST00000515200.5
|
GRAMD2B
|
GRAM domain containing 2B |
| chr5_+_150660841 | 0.02 |
ENST00000297130.4
|
MYOZ3
|
myozenin 3 |
| chr8_-_28490220 | 0.02 |
ENST00000517673.5
ENST00000380254.7 ENST00000518734.5 ENST00000346498.6 |
FBXO16
|
F-box protein 16 |
| chr4_+_94489030 | 0.02 |
ENST00000510099.5
|
PDLIM5
|
PDZ and LIM domain 5 |
| chrX_-_126166273 | 0.02 |
ENST00000360028.4
|
DCAF12L2
|
DDB1 and CUL4 associated factor 12 like 2 |
| chr5_+_150661243 | 0.01 |
ENST00000517768.6
|
MYOZ3
|
myozenin 3 |
| chrX_-_141698739 | 0.01 |
ENST00000370515.3
|
SPANXD
|
SPANX family member D |
| chr14_+_94026314 | 0.01 |
ENST00000203664.10
ENST00000553723.1 |
OTUB2
|
OTU deubiquitinase, ubiquitin aldehyde binding 2 |
| chr1_-_153150884 | 0.01 |
ENST00000368748.5
|
SPRR2G
|
small proline rich protein 2G |
| chr19_+_6887560 | 0.01 |
ENST00000250572.12
ENST00000381407.9 ENST00000450315.7 ENST00000312053.9 ENST00000381404.8 |
ADGRE1
|
adhesion G protein-coupled receptor E1 |
| chr5_-_176034680 | 0.01 |
ENST00000514861.5
|
THOC3
|
THO complex 3 |
| chr6_+_54308429 | 0.01 |
ENST00000259782.9
ENST00000370864.3 |
TINAG
|
tubulointerstitial nephritis antigen |
| chr5_-_56116946 | 0.01 |
ENST00000434982.2
|
ANKRD55
|
ankyrin repeat domain 55 |
| chr16_-_28363508 | 0.00 |
ENST00000532254.1
|
NPIPB6
|
nuclear pore complex interacting protein family member B6 |
| chr5_-_135399863 | 0.00 |
ENST00000510038.1
ENST00000304332.8 |
MACROH2A1
|
macroH2A.1 histone |
| chr20_-_46684467 | 0.00 |
ENST00000372121.5
|
SLC13A3
|
solute carrier family 13 member 3 |
| chr19_+_9250930 | 0.00 |
ENST00000456448.3
|
OR7E24
|
olfactory receptor family 7 subfamily E member 24 |
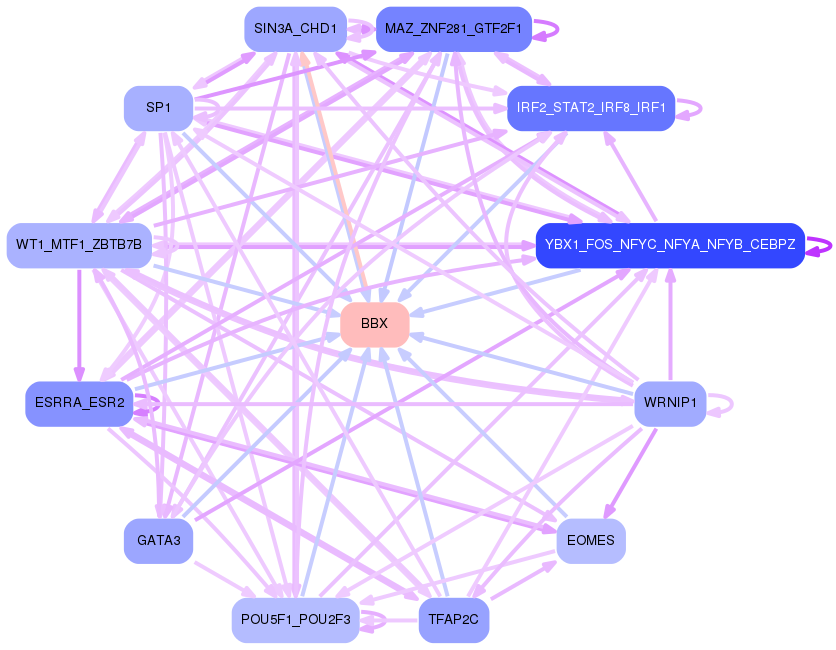
Network of associatons between targets according to the STRING database.

First level regulatory network of BBX
Gene Ontology Analysis
Gene overrepresentation in biological process category:
| Log-likelihood per target | Total log-likelihood | Term | Description |
|---|---|---|---|
| 0.2 | 0.7 | GO:0035691 | macrophage migration inhibitory factor signaling pathway(GO:0035691) |
| 0.1 | 0.8 | GO:0070171 | negative regulation of tooth mineralization(GO:0070171) |
| 0.1 | 0.5 | GO:0060154 | cellular process regulating host cell cycle in response to virus(GO:0060154) |
| 0.0 | 0.1 | GO:0010808 | positive regulation of synaptic vesicle priming(GO:0010808) |
| 0.0 | 0.9 | GO:0098828 | positive regulation of inhibitory postsynaptic potential(GO:0097151) modulation of inhibitory postsynaptic potential(GO:0098828) |
| 0.0 | 0.3 | GO:0070294 | renal sodium ion absorption(GO:0070294) |
| 0.0 | 0.1 | GO:1902161 | positive regulation of cyclic nucleotide-gated ion channel activity(GO:1902161) |
| 0.0 | 0.2 | GO:0016926 | protein desumoylation(GO:0016926) |
| 0.0 | 0.3 | GO:0034036 | purine ribonucleoside bisphosphate biosynthetic process(GO:0034036) 3'-phosphoadenosine 5'-phosphosulfate biosynthetic process(GO:0050428) |
| 0.0 | 0.1 | GO:0090310 | negative regulation of methylation-dependent chromatin silencing(GO:0090310) |
| 0.0 | 0.1 | GO:0070121 | pronephric nephron morphogenesis(GO:0039007) pronephric nephron tubule morphogenesis(GO:0039008) pronephric duct development(GO:0039022) pronephric duct morphogenesis(GO:0039023) Kupffer's vesicle development(GO:0070121) |
| 0.0 | 0.3 | GO:0042340 | keratan sulfate catabolic process(GO:0042340) |
| 0.0 | 0.1 | GO:0046668 | regulation of retinal cell programmed cell death(GO:0046668) |
| 0.0 | 0.1 | GO:0046968 | peptide antigen transport(GO:0046968) |
| 0.0 | 0.6 | GO:0003298 | physiological muscle hypertrophy(GO:0003298) physiological cardiac muscle hypertrophy(GO:0003301) cell growth involved in cardiac muscle cell development(GO:0061049) |
| 0.0 | 0.0 | GO:1901675 | negative regulation of histone H3-K27 acetylation(GO:1901675) |
Gene overrepresentation in cellular component category:
| Log-likelihood per target | Total log-likelihood | Term | Description |
|---|---|---|---|
| 0.1 | 0.2 | GO:1990038 | glial cytoplasmic inclusion(GO:0097409) classical Lewy body(GO:0097414) Lewy neurite(GO:0097462) Lewy body corona(GO:1990038) |
| 0.0 | 0.5 | GO:0097136 | Bcl-2 family protein complex(GO:0097136) |
| 0.0 | 0.1 | GO:0035189 | Rb-E2F complex(GO:0035189) |
| 0.0 | 0.1 | GO:0097058 | CRLF-CLCF1 complex(GO:0097058) |
| 0.0 | 0.2 | GO:0097442 | CA3 pyramidal cell dendrite(GO:0097442) |
| 0.0 | 0.1 | GO:0031205 | endoplasmic reticulum Sec complex(GO:0031205) |
| 0.0 | 0.1 | GO:0044305 | calyx of Held(GO:0044305) |
| 0.0 | 0.8 | GO:0048786 | presynaptic active zone(GO:0048786) |
Gene overrepresentation in molecular function category:
| Log-likelihood per target | Total log-likelihood | Term | Description |
|---|---|---|---|
| 0.0 | 0.5 | GO:0051434 | BH3 domain binding(GO:0051434) |
| 0.0 | 0.1 | GO:0003858 | 3-hydroxybutyrate dehydrogenase activity(GO:0003858) |
| 0.0 | 0.1 | GO:0005260 | channel-conductance-controlling ATPase activity(GO:0005260) |
| 0.0 | 0.1 | GO:0033142 | progesterone receptor binding(GO:0033142) |
| 0.0 | 0.2 | GO:0016929 | SUMO-specific protease activity(GO:0016929) |
| 0.0 | 0.3 | GO:0019531 | oxalate transmembrane transporter activity(GO:0019531) |
| 0.0 | 0.6 | GO:0008093 | cytoskeletal adaptor activity(GO:0008093) |
| 0.0 | 0.1 | GO:0005127 | ciliary neurotrophic factor receptor binding(GO:0005127) |
| 0.0 | 0.0 | GO:0004056 | argininosuccinate lyase activity(GO:0004056) |
Gene overrepresentation in curated gene sets: canonical pathways category:
| Log-likelihood per target | Total log-likelihood | Term | Description |
|---|---|---|---|
| 0.0 | 0.5 | SA PROGRAMMED CELL DEATH | Programmed cell death, or apoptosis, eliminates damaged or unneeded cells. |
| 0.0 | 1.1 | NABA PROTEOGLYCANS | Genes encoding proteoglycans |
Gene overrepresentation in curated gene sets: REACTOME pathways category:
| Log-likelihood per target | Total log-likelihood | Term | Description |
|---|---|---|---|
| 0.0 | 0.9 | REACTOME NOREPINEPHRINE NEUROTRANSMITTER RELEASE CYCLE | Genes involved in Norepinephrine Neurotransmitter Release Cycle |
| 0.0 | 0.7 | REACTOME TIE2 SIGNALING | Genes involved in Tie2 Signaling |
| 0.0 | 0.3 | REACTOME KERATAN SULFATE DEGRADATION | Genes involved in Keratan sulfate degradation |
| 0.0 | 0.5 | REACTOME INFLAMMASOMES | Genes involved in Inflammasomes |