Project
Epithelial-Mesenchymal Transition, human (Scheel, 2011)
Navigation
Downloads
Results for CCCUGAG
Z-value: 1.36
Motif logo

miRNA associated with seed CCCUGAG
| Name | miRBASE accession |
|---|---|
|
hsa-miR-125a-5p
|
MIMAT0000443 |
|
hsa-miR-125b-5p
|
MIMAT0000423 |
|
hsa-miR-4319
|
MIMAT0016870 |
Activity profile of CCCUGAG motif
Sorted Z-values of CCCUGAG motif
| Promoter | Log-likelihood | Transcript | Gene | Gene Info |
|---|---|---|---|---|
| chr15_+_90201301 | 1.64 |
ENST00000411539.6
|
SEMA4B
|
semaphorin 4B |
| chr2_-_31138041 | 1.62 |
ENST00000324589.9
|
GALNT14
|
polypeptide N-acetylgalactosaminyltransferase 14 |
| chr20_+_59577463 | 1.61 |
ENST00000359926.7
|
PHACTR3
|
phosphatase and actin regulator 3 |
| chr7_-_22193824 | 1.50 |
ENST00000401957.6
|
RAPGEF5
|
Rap guanine nucleotide exchange factor 5 |
| chr1_+_151511376 | 1.31 |
ENST00000427934.2
ENST00000271636.12 |
CGN
|
cingulin |
| chr2_+_17878637 | 1.29 |
ENST00000304101.9
|
KCNS3
|
potassium voltage-gated channel modifier subfamily S member 3 |
| chr1_+_109249530 | 1.28 |
ENST00000271332.4
|
CELSR2
|
cadherin EGF LAG seven-pass G-type receptor 2 |
| chr10_+_80413817 | 1.23 |
ENST00000372187.9
|
PRXL2A
|
peroxiredoxin like 2A |
| chr12_+_82686889 | 1.23 |
ENST00000321196.8
|
TMTC2
|
transmembrane O-mannosyltransferase targeting cadherins 2 |
| chr1_+_160400543 | 1.21 |
ENST00000368061.3
|
VANGL2
|
VANGL planar cell polarity protein 2 |
| chr12_+_56080155 | 1.14 |
ENST00000267101.8
|
ERBB3
|
erb-b2 receptor tyrosine kinase 3 |
| chr1_+_26529745 | 1.10 |
ENST00000374168.7
ENST00000374166.8 |
RPS6KA1
|
ribosomal protein S6 kinase A1 |
| chr10_+_80454148 | 1.07 |
ENST00000429989.7
|
TSPAN14
|
tetraspanin 14 |
| chr12_-_54385727 | 1.04 |
ENST00000551109.5
ENST00000546970.5 |
ZNF385A
|
zinc finger protein 385A |
| chr6_+_106098933 | 1.03 |
ENST00000369089.3
|
PRDM1
|
PR/SET domain 1 |
| chr2_+_74834113 | 1.03 |
ENST00000290573.7
|
HK2
|
hexokinase 2 |
| chr6_+_1312090 | 1.01 |
ENST00000296839.5
|
FOXQ1
|
forkhead box Q1 |
| chr6_+_137867414 | 0.96 |
ENST00000237289.8
ENST00000433680.1 |
TNFAIP3
|
TNF alpha induced protein 3 |
| chr11_+_59172116 | 0.96 |
ENST00000227451.4
|
DTX4
|
deltex E3 ubiquitin ligase 4 |
| chr2_-_75560893 | 0.95 |
ENST00000410113.5
ENST00000393913.8 |
EVA1A
|
eva-1 homolog A, regulator of programmed cell death |
| chr14_-_70809494 | 0.95 |
ENST00000381250.8
ENST00000554752.7 ENST00000555993.6 |
MAP3K9
|
mitogen-activated protein kinase kinase kinase 9 |
| chr8_-_65842051 | 0.90 |
ENST00000401827.8
|
PDE7A
|
phosphodiesterase 7A |
| chr17_+_57085092 | 0.89 |
ENST00000575322.1
ENST00000337714.8 |
AKAP1
|
A-kinase anchoring protein 1 |
| chr15_+_74541200 | 0.89 |
ENST00000622429.1
ENST00000346246.10 |
ARID3B
|
AT-rich interaction domain 3B |
| chr15_+_100879822 | 0.87 |
ENST00000329841.10
ENST00000557963.1 ENST00000346623.6 |
ALDH1A3
|
aldehyde dehydrogenase 1 family member A3 |
| chr15_-_44194407 | 0.85 |
ENST00000484674.5
|
FRMD5
|
FERM domain containing 5 |
| chr10_+_93893931 | 0.84 |
ENST00000371408.7
ENST00000427197.2 |
SLC35G1
|
solute carrier family 35 member G1 |
| chr1_+_32741779 | 0.84 |
ENST00000401073.7
|
KIAA1522
|
KIAA1522 |
| chr15_-_59372863 | 0.83 |
ENST00000288235.9
|
MYO1E
|
myosin IE |
| chr11_-_46918522 | 0.82 |
ENST00000378623.6
ENST00000534404.1 |
LRP4
|
LDL receptor related protein 4 |
| chr5_-_176537361 | 0.81 |
ENST00000274811.9
|
RNF44
|
ring finger protein 44 |
| chr11_-_118152775 | 0.81 |
ENST00000324727.9
|
SCN4B
|
sodium voltage-gated channel beta subunit 4 |
| chr3_+_186930518 | 0.80 |
ENST00000169298.8
ENST00000457772.6 ENST00000455441.5 ENST00000427315.5 |
ST6GAL1
|
ST6 beta-galactoside alpha-2,6-sialyltransferase 1 |
| chr9_-_136245802 | 0.73 |
ENST00000358701.10
|
QSOX2
|
quiescin sulfhydryl oxidase 2 |
| chr12_-_89352487 | 0.72 |
ENST00000548755.1
ENST00000279488.8 |
DUSP6
|
dual specificity phosphatase 6 |
| chr22_+_39994926 | 0.67 |
ENST00000333407.11
|
FAM83F
|
family with sequence similarity 83 member F |
| chr4_-_80073170 | 0.65 |
ENST00000403729.7
|
ANTXR2
|
ANTXR cell adhesion molecule 2 |
| chr18_-_46072244 | 0.63 |
ENST00000589328.5
ENST00000409746.5 |
PSTPIP2
|
proline-serine-threonine phosphatase interacting protein 2 |
| chr3_-_52056552 | 0.63 |
ENST00000495880.2
|
DUSP7
|
dual specificity phosphatase 7 |
| chr9_+_113876282 | 0.62 |
ENST00000374126.9
ENST00000615615.4 ENST00000288466.11 |
ZNF618
|
zinc finger protein 618 |
| chr15_+_68578970 | 0.62 |
ENST00000261861.10
|
CORO2B
|
coronin 2B |
| chr19_+_3185911 | 0.61 |
ENST00000246117.9
ENST00000588428.5 |
NCLN
|
nicalin |
| chr7_-_140176970 | 0.60 |
ENST00000397560.7
|
KDM7A
|
lysine demethylase 7A |
| chr1_-_43285559 | 0.60 |
ENST00000523677.6
|
C1orf210
|
chromosome 1 open reading frame 210 |
| chr3_+_126983035 | 0.60 |
ENST00000393409.3
|
PLXNA1
|
plexin A1 |
| chr1_-_217089627 | 0.59 |
ENST00000361525.7
|
ESRRG
|
estrogen related receptor gamma |
| chr6_+_17281341 | 0.59 |
ENST00000379052.10
|
RBM24
|
RNA binding motif protein 24 |
| chr22_+_28883564 | 0.58 |
ENST00000544604.7
|
ZNRF3
|
zinc and ring finger 3 |
| chr11_-_65134507 | 0.56 |
ENST00000377190.8
ENST00000294256.12 |
SYVN1
|
synoviolin 1 |
| chr2_-_9003657 | 0.55 |
ENST00000462696.1
ENST00000305997.8 |
MBOAT2
|
membrane bound O-acyltransferase domain containing 2 |
| chr10_-_71773513 | 0.54 |
ENST00000394957.8
|
VSIR
|
V-set immunoregulatory receptor |
| chr3_+_46979659 | 0.54 |
ENST00000450053.8
|
NBEAL2
|
neurobeachin like 2 |
| chr14_+_69611586 | 0.49 |
ENST00000342745.5
|
SUSD6
|
sushi domain containing 6 |
| chr19_+_7903843 | 0.48 |
ENST00000397981.7
ENST00000397979.4 ENST00000397983.7 |
MAP2K7
|
mitogen-activated protein kinase kinase 7 |
| chr12_+_4909895 | 0.48 |
ENST00000638821.1
ENST00000382545.5 |
ENSG00000256654.4
KCNA1
|
novel transcript, sense overlapping KCNA1 potassium voltage-gated channel subfamily A member 1 |
| chr6_-_40587314 | 0.47 |
ENST00000338305.7
|
LRFN2
|
leucine rich repeat and fibronectin type III domain containing 2 |
| chr8_-_140635617 | 0.47 |
ENST00000220592.10
|
AGO2
|
argonaute RISC catalytic component 2 |
| chr12_-_122896066 | 0.47 |
ENST00000267202.7
ENST00000535765.5 |
VPS37B
|
VPS37B subunit of ESCRT-I |
| chr12_+_11649666 | 0.46 |
ENST00000396373.9
|
ETV6
|
ETS variant transcription factor 6 |
| chr5_+_56815534 | 0.45 |
ENST00000399503.4
|
MAP3K1
|
mitogen-activated protein kinase kinase kinase 1 |
| chr19_-_11339573 | 0.45 |
ENST00000222120.8
|
RAB3D
|
RAB3D, member RAS oncogene family |
| chr8_-_28386417 | 0.44 |
ENST00000521185.5
ENST00000520290.5 ENST00000344423.10 |
ZNF395
|
zinc finger protein 395 |
| chr2_-_102736819 | 0.44 |
ENST00000258436.10
|
MFSD9
|
major facilitator superfamily domain containing 9 |
| chr7_-_112790372 | 0.42 |
ENST00000449743.1
ENST00000441474.1 ENST00000312814.11 ENST00000454074.5 ENST00000447395.5 |
TMEM168
|
transmembrane protein 168 |
| chr7_-_99144053 | 0.41 |
ENST00000361125.1
ENST00000361368.7 |
SMURF1
|
SMAD specific E3 ubiquitin protein ligase 1 |
| chr17_-_59707404 | 0.41 |
ENST00000393038.3
|
PTRH2
|
peptidyl-tRNA hydrolase 2 |
| chr2_-_200963633 | 0.41 |
ENST00000234296.7
|
ORC2
|
origin recognition complex subunit 2 |
| chr8_-_8893548 | 0.41 |
ENST00000276282.7
|
MFHAS1
|
malignant fibrous histiocytoma amplified sequence 1 |
| chr3_-_134029914 | 0.40 |
ENST00000493729.5
ENST00000310926.11 |
SLCO2A1
|
solute carrier organic anion transporter family member 2A1 |
| chr13_+_40789548 | 0.40 |
ENST00000338625.9
|
SLC25A15
|
solute carrier family 25 member 15 |
| chr5_-_141878396 | 0.40 |
ENST00000503492.5
ENST00000287008.8 ENST00000394536.4 |
PCDH1
|
protocadherin 1 |
| chr3_+_5187697 | 0.39 |
ENST00000256497.9
|
EDEM1
|
ER degradation enhancing alpha-mannosidase like protein 1 |
| chr3_-_52409783 | 0.38 |
ENST00000470173.1
ENST00000296288.9 ENST00000460680.6 |
BAP1
|
BRCA1 associated protein 1 |
| chr18_-_21704763 | 0.38 |
ENST00000580981.5
ENST00000289119.7 |
ABHD3
|
abhydrolase domain containing 3, phospholipase |
| chr2_+_74654228 | 0.37 |
ENST00000611975.4
ENST00000357877.7 ENST00000339773.9 ENST00000434486.5 |
SEMA4F
|
ssemaphorin 4F |
| chr10_-_14548646 | 0.36 |
ENST00000378470.5
|
FAM107B
|
family with sequence similarity 107 member B |
| chr6_+_138161932 | 0.35 |
ENST00000251691.5
|
ARFGEF3
|
ARFGEF family member 3 |
| chr6_+_7107941 | 0.35 |
ENST00000379938.7
ENST00000467782.5 ENST00000334984.10 ENST00000349384.10 |
RREB1
|
ras responsive element binding protein 1 |
| chr1_-_109397888 | 0.35 |
ENST00000256637.8
|
SORT1
|
sortilin 1 |
| chr6_+_18387326 | 0.34 |
ENST00000259939.4
|
RNF144B
|
ring finger protein 144B |
| chr11_+_45805108 | 0.34 |
ENST00000530471.1
ENST00000314134.4 |
SLC35C1
|
solute carrier family 35 member C1 |
| chr1_-_200410052 | 0.34 |
ENST00000294740.3
|
ZNF281
|
zinc finger protein 281 |
| chr2_+_147845020 | 0.34 |
ENST00000241416.12
|
ACVR2A
|
activin A receptor type 2A |
| chr16_-_23510389 | 0.34 |
ENST00000562117.1
ENST00000567468.5 ENST00000562944.5 ENST00000309859.8 |
GGA2
|
golgi associated, gamma adaptin ear containing, ARF binding protein 2 |
| chr19_+_7595830 | 0.33 |
ENST00000160298.9
ENST00000446248.4 |
CAMSAP3
|
calmodulin regulated spectrin associated protein family member 3 |
| chr4_+_110476133 | 0.33 |
ENST00000265162.10
|
ENPEP
|
glutamyl aminopeptidase |
| chr10_+_119207560 | 0.33 |
ENST00000392870.3
|
GRK5
|
G protein-coupled receptor kinase 5 |
| chr10_-_70146602 | 0.33 |
ENST00000335494.5
ENST00000287078.7 |
TYSND1
|
trypsin like peroxisomal matrix peptidase 1 |
| chr14_-_99604167 | 0.32 |
ENST00000380243.9
|
CCDC85C
|
coiled-coil domain containing 85C |
| chr12_+_45216079 | 0.32 |
ENST00000423947.7
ENST00000680498.1 ENST00000320560.13 |
ANO6
|
anoctamin 6 |
| chr15_-_79090760 | 0.32 |
ENST00000419573.7
ENST00000558480.7 |
RASGRF1
|
Ras protein specific guanine nucleotide releasing factor 1 |
| chr15_-_34367159 | 0.32 |
ENST00000314891.11
|
LPCAT4
|
lysophosphatidylcholine acyltransferase 4 |
| chr3_+_58237501 | 0.31 |
ENST00000295962.8
|
ABHD6
|
abhydrolase domain containing 6, acylglycerol lipase |
| chr4_-_110198650 | 0.31 |
ENST00000394607.7
|
ELOVL6
|
ELOVL fatty acid elongase 6 |
| chr5_-_160312524 | 0.31 |
ENST00000520748.1
ENST00000257536.13 ENST00000393977.7 |
CCNJL
|
cyclin J like |
| chr12_+_13044371 | 0.31 |
ENST00000197268.13
|
FAM234B
|
family with sequence similarity 234 member B |
| chr1_-_111140040 | 0.30 |
ENST00000286692.8
ENST00000484310.6 |
DRAM2
|
DNA damage regulated autophagy modulator 2 |
| chr8_+_38030496 | 0.30 |
ENST00000338825.5
|
EIF4EBP1
|
eukaryotic translation initiation factor 4E binding protein 1 |
| chr10_-_117005570 | 0.30 |
ENST00000260777.14
ENST00000392903.3 |
SHTN1
|
shootin 1 |
| chr20_-_54173976 | 0.30 |
ENST00000216862.8
|
CYP24A1
|
cytochrome P450 family 24 subfamily A member 1 |
| chr19_+_44891206 | 0.29 |
ENST00000405636.6
ENST00000252487.9 ENST00000592434.5 ENST00000589649.1 ENST00000426677.7 |
TOMM40
|
translocase of outer mitochondrial membrane 40 |
| chr12_+_50057548 | 0.29 |
ENST00000228468.8
ENST00000447966.7 |
ASIC1
|
acid sensing ion channel subunit 1 |
| chr1_-_6261053 | 0.28 |
ENST00000377893.3
|
GPR153
|
G protein-coupled receptor 153 |
| chr4_+_47485268 | 0.28 |
ENST00000273859.8
ENST00000504445.1 |
ATP10D
|
ATPase phospholipid transporting 10D (putative) |
| chr8_-_143617457 | 0.28 |
ENST00000529048.5
ENST00000529064.5 |
GFUS
|
GDP-L-fucose synthase |
| chr1_+_203305510 | 0.27 |
ENST00000290551.5
|
BTG2
|
BTG anti-proliferation factor 2 |
| chr20_+_2692736 | 0.27 |
ENST00000380648.9
ENST00000497450.5 |
EBF4
|
EBF family member 4 |
| chr8_-_144326908 | 0.27 |
ENST00000332324.5
|
DGAT1
|
diacylglycerol O-acyltransferase 1 |
| chr17_+_75516514 | 0.27 |
ENST00000333213.11
ENST00000545228.3 ENST00000680999.1 |
TSEN54
|
tRNA splicing endonuclease subunit 54 |
| chr6_-_79947541 | 0.26 |
ENST00000369816.5
|
ELOVL4
|
ELOVL fatty acid elongase 4 |
| chr3_+_141051339 | 0.26 |
ENST00000310546.3
|
SPSB4
|
splA/ryanodine receptor domain and SOCS box containing 4 |
| chr14_+_70907450 | 0.26 |
ENST00000304743.7
|
PCNX1
|
pecanex 1 |
| chr12_-_56636318 | 0.26 |
ENST00000549506.5
ENST00000379441.7 ENST00000551812.5 |
BAZ2A
|
bromodomain adjacent to zinc finger domain 2A |
| chr17_-_42609356 | 0.26 |
ENST00000309428.10
|
RETREG3
|
reticulophagy regulator family member 3 |
| chr7_+_90403386 | 0.26 |
ENST00000287916.8
ENST00000394604.5 ENST00000496677.6 ENST00000394605.2 ENST00000480135.1 |
CLDN12
ENSG00000273299.1
|
claudin 12 novel transcript |
| chr16_+_68264501 | 0.25 |
ENST00000618043.4
ENST00000219343.11 ENST00000566834.5 ENST00000566454.5 |
SLC7A6
|
solute carrier family 7 member 6 |
| chr5_-_55712280 | 0.25 |
ENST00000506624.5
ENST00000513275.5 ENST00000513993.5 ENST00000396865.7 ENST00000503891.5 ENST00000507109.5 |
SLC38A9
|
solute carrier family 38 member 9 |
| chr12_-_124863783 | 0.25 |
ENST00000546215.5
ENST00000415380.6 ENST00000545493.1 ENST00000261693.11 ENST00000680596.1 |
SCARB1
|
scavenger receptor class B member 1 |
| chr22_+_21417357 | 0.25 |
ENST00000407464.7
|
HIC2
|
HIC ZBTB transcriptional repressor 2 |
| chr16_-_19718175 | 0.25 |
ENST00000219837.12
|
KNOP1
|
lysine rich nucleolar protein 1 |
| chr2_+_190180835 | 0.24 |
ENST00000340623.4
|
C2orf88
|
chromosome 2 open reading frame 88 |
| chr9_-_19786928 | 0.24 |
ENST00000341998.6
ENST00000286344.3 |
SLC24A2
|
solute carrier family 24 member 2 |
| chr8_+_22999535 | 0.24 |
ENST00000251822.7
|
RHOBTB2
|
Rho related BTB domain containing 2 |
| chr19_-_4066892 | 0.24 |
ENST00000322357.9
|
ZBTB7A
|
zinc finger and BTB domain containing 7A |
| chr1_+_42380772 | 0.23 |
ENST00000431473.4
ENST00000410070.6 |
RIMKLA
|
ribosomal modification protein rimK like family member A |
| chr2_+_158456939 | 0.23 |
ENST00000389759.8
ENST00000628904.2 ENST00000389757.7 |
PKP4
|
plakophilin 4 |
| chr11_+_64306227 | 0.23 |
ENST00000405666.5
ENST00000468670.2 |
ESRRA
|
estrogen related receptor alpha |
| chr11_+_65787056 | 0.23 |
ENST00000335987.8
|
OVOL1
|
ovo like transcriptional repressor 1 |
| chr3_+_15427551 | 0.23 |
ENST00000396842.7
|
EAF1
|
ELL associated factor 1 |
| chr5_-_83720813 | 0.23 |
ENST00000515590.1
ENST00000274341.9 |
HAPLN1
|
hyaluronan and proteoglycan link protein 1 |
| chr18_-_31684504 | 0.22 |
ENST00000383131.3
ENST00000237019.11 ENST00000306851.10 |
B4GALT6
|
beta-1,4-galactosyltransferase 6 |
| chr10_+_121989187 | 0.21 |
ENST00000513429.5
ENST00000515273.5 ENST00000515603.5 |
TACC2
|
transforming acidic coiled-coil containing protein 2 |
| chr19_-_14518383 | 0.21 |
ENST00000254322.3
ENST00000595139.2 |
DNAJB1
|
DnaJ heat shock protein family (Hsp40) member B1 |
| chr17_-_5468951 | 0.21 |
ENST00000225296.8
|
DHX33
|
DEAH-box helicase 33 |
| chr5_+_58583068 | 0.21 |
ENST00000282878.6
|
RAB3C
|
RAB3C, member RAS oncogene family |
| chr1_-_156282799 | 0.21 |
ENST00000361813.5
|
SMG5
|
SMG5 nonsense mediated mRNA decay factor |
| chr16_-_85011463 | 0.21 |
ENST00000564466.5
ENST00000313732.9 |
ZDHHC7
|
zinc finger DHHC-type palmitoyltransferase 7 |
| chr5_+_79236092 | 0.21 |
ENST00000396137.5
|
JMY
|
junction mediating and regulatory protein, p53 cofactor |
| chr15_-_73368951 | 0.21 |
ENST00000261917.4
|
HCN4
|
hyperpolarization activated cyclic nucleotide gated potassium channel 4 |
| chr12_-_57078739 | 0.21 |
ENST00000379391.7
|
NEMP1
|
nuclear envelope integral membrane protein 1 |
| chr6_-_16761447 | 0.21 |
ENST00000244769.8
ENST00000436367.6 |
ATXN1
|
ataxin 1 |
| chr19_+_40191410 | 0.20 |
ENST00000253055.8
|
MAP3K10
|
mitogen-activated protein kinase kinase kinase 10 |
| chr11_+_76783349 | 0.20 |
ENST00000333090.5
|
TSKU
|
tsukushi, small leucine rich proteoglycan |
| chr4_-_99657820 | 0.20 |
ENST00000511828.2
|
C4orf54
|
chromosome 4 open reading frame 54 |
| chr9_+_128340474 | 0.20 |
ENST00000300456.5
|
SLC27A4
|
solute carrier family 27 member 4 |
| chr3_+_32817990 | 0.20 |
ENST00000383763.6
|
TRIM71
|
tripartite motif containing 71 |
| chr4_+_7192519 | 0.19 |
ENST00000507866.6
|
SORCS2
|
sortilin related VPS10 domain containing receptor 2 |
| chr15_-_72117712 | 0.19 |
ENST00000444904.5
ENST00000564571.5 |
MYO9A
|
myosin IXA |
| chr12_+_103965863 | 0.19 |
ENST00000392872.8
ENST00000537100.5 |
TDG
|
thymine DNA glycosylase |
| chr3_+_179347686 | 0.19 |
ENST00000471841.6
|
MFN1
|
mitofusin 1 |
| chr17_+_18315273 | 0.19 |
ENST00000406438.5
|
SMCR8
|
SMCR8-C9orf72 complex subunit |
| chr19_-_2721332 | 0.19 |
ENST00000588128.1
ENST00000323469.5 |
DIRAS1
|
DIRAS family GTPase 1 |
| chr18_+_33578213 | 0.19 |
ENST00000681521.1
ENST00000269197.12 |
ASXL3
|
ASXL transcriptional regulator 3 |
| chr17_+_40219276 | 0.19 |
ENST00000583268.1
ENST00000323571.9 |
WIPF2
|
WAS/WASL interacting protein family member 2 |
| chr22_+_41381923 | 0.19 |
ENST00000266304.9
|
TEF
|
TEF transcription factor, PAR bZIP family member |
| chr15_+_22786610 | 0.19 |
ENST00000337435.9
|
NIPA1
|
NIPA magnesium transporter 1 |
| chr13_-_29595670 | 0.19 |
ENST00000380752.10
|
SLC7A1
|
solute carrier family 7 member 1 |
| chr20_-_32483438 | 0.18 |
ENST00000359676.9
|
NOL4L
|
nucleolar protein 4 like |
| chr11_+_33257265 | 0.18 |
ENST00000303296.9
ENST00000379016.7 |
HIPK3
|
homeodomain interacting protein kinase 3 |
| chr3_-_57693045 | 0.18 |
ENST00000311128.10
|
DENND6A
|
DENN domain containing 6A |
| chr8_-_80874771 | 0.18 |
ENST00000327835.7
|
ZNF704
|
zinc finger protein 704 |
| chr15_+_73052449 | 0.18 |
ENST00000261908.11
|
NEO1
|
neogenin 1 |
| chr20_+_64164446 | 0.18 |
ENST00000328439.6
|
MYT1
|
myelin transcription factor 1 |
| chr1_-_157138388 | 0.18 |
ENST00000368192.9
|
ETV3
|
ETS variant transcription factor 3 |
| chr17_+_29593118 | 0.17 |
ENST00000394859.8
|
ANKRD13B
|
ankyrin repeat domain 13B |
| chr4_+_183905266 | 0.17 |
ENST00000308497.9
|
STOX2
|
storkhead box 2 |
| chr9_+_99105098 | 0.17 |
ENST00000374990.6
ENST00000374994.9 ENST00000552516.5 |
TGFBR1
|
transforming growth factor beta receptor 1 |
| chr13_-_25172278 | 0.17 |
ENST00000515384.2
ENST00000357816.2 |
AMER2
|
APC membrane recruitment protein 2 |
| chr5_+_157460173 | 0.17 |
ENST00000435489.7
ENST00000311946.8 |
NIPAL4
|
NIPA like domain containing 4 |
| chr12_+_121712740 | 0.17 |
ENST00000449592.7
|
TMEM120B
|
transmembrane protein 120B |
| chr14_-_74713041 | 0.17 |
ENST00000356357.9
ENST00000555249.1 ENST00000681599.1 ENST00000556202.5 ENST00000681099.1 |
AREL1
|
apoptosis resistant E3 ubiquitin protein ligase 1 |
| chr11_-_65614195 | 0.17 |
ENST00000309100.8
ENST00000529839.1 ENST00000526293.1 |
MAP3K11
|
mitogen-activated protein kinase kinase kinase 11 |
| chr4_+_38664189 | 0.17 |
ENST00000514033.1
ENST00000261438.10 |
KLF3
|
Kruppel like factor 3 |
| chr3_+_38453832 | 0.16 |
ENST00000352511.5
|
ACVR2B
|
activin A receptor type 2B |
| chr4_-_56435581 | 0.16 |
ENST00000264220.6
|
PPAT
|
phosphoribosyl pyrophosphate amidotransferase |
| chr11_-_102452758 | 0.16 |
ENST00000398136.7
ENST00000361236.7 |
TMEM123
|
transmembrane protein 123 |
| chrX_+_147911943 | 0.16 |
ENST00000621453.4
ENST00000218200.12 ENST00000370471.7 ENST00000440235.6 ENST00000370477.5 ENST00000621987.4 |
FMR1
|
FMRP translational regulator 1 |
| chr17_+_55751021 | 0.16 |
ENST00000268896.10
ENST00000576183.5 ENST00000573500.5 |
PCTP
|
phosphatidylcholine transfer protein |
| chr12_-_24949026 | 0.16 |
ENST00000539780.5
ENST00000546285.1 ENST00000342945.9 ENST00000261192.12 |
BCAT1
|
branched chain amino acid transaminase 1 |
| chr20_-_543770 | 0.16 |
ENST00000460062.7
ENST00000645187.1 ENST00000647348.1 ENST00000217244.9 ENST00000349736.10 |
CSNK2A1
|
casein kinase 2 alpha 1 |
| chr2_+_240435652 | 0.16 |
ENST00000264039.7
|
GPC1
|
glypican 1 |
| chr17_-_4366616 | 0.16 |
ENST00000572484.5
ENST00000396981.7 |
UBE2G1
|
ubiquitin conjugating enzyme E2 G1 |
| chr10_+_70815889 | 0.16 |
ENST00000373202.8
|
SGPL1
|
sphingosine-1-phosphate lyase 1 |
| chr19_+_11374658 | 0.16 |
ENST00000674460.1
ENST00000312423.4 |
SWSAP1
|
SWIM-type zinc finger 7 associated protein 1 |
| chr8_-_56993803 | 0.16 |
ENST00000262644.9
|
BPNT2
|
3'(2'), 5'-bisphosphate nucleotidase 2 |
| chr19_-_19643597 | 0.16 |
ENST00000587205.1
ENST00000203556.9 |
GMIP
|
GEM interacting protein |
| chr6_+_35213948 | 0.16 |
ENST00000274938.8
|
SCUBE3
|
signal peptide, CUB domain and EGF like domain containing 3 |
| chr17_-_13017952 | 0.15 |
ENST00000578071.1
ENST00000426905.7 ENST00000395962.6 ENST00000338034.9 ENST00000583371.5 |
ELAC2
|
elaC ribonuclease Z 2 |
| chr12_+_49539022 | 0.15 |
ENST00000257981.7
|
KCNH3
|
potassium voltage-gated channel subfamily H member 3 |
| chr6_+_124962420 | 0.15 |
ENST00000521654.7
ENST00000560949.5 |
RNF217
|
ring finger protein 217 |
| chr22_-_30968764 | 0.15 |
ENST00000397641.8
|
MORC2
|
MORC family CW-type zinc finger 2 |
| chr1_+_155277414 | 0.15 |
ENST00000368358.4
|
HCN3
|
hyperpolarization activated cyclic nucleotide gated potassium channel 3 |
| chr11_+_63839086 | 0.15 |
ENST00000350490.11
ENST00000402010.8 |
MARK2
|
microtubule affinity regulating kinase 2 |
| chr19_+_55339867 | 0.15 |
ENST00000255613.8
|
KMT5C
|
lysine methyltransferase 5C |
| chr9_+_74497308 | 0.15 |
ENST00000376896.8
|
RORB
|
RAR related orphan receptor B |
| chr11_+_61508742 | 0.15 |
ENST00000378075.4
|
LRRC10B
|
leucine rich repeat containing 10B |
| chr2_+_219544002 | 0.15 |
ENST00000421791.1
ENST00000373883.4 ENST00000451952.1 |
TMEM198
|
transmembrane protein 198 |
| chr2_-_38377256 | 0.15 |
ENST00000443098.5
ENST00000449130.5 ENST00000651368.1 ENST00000378954.9 ENST00000419554.6 ENST00000451483.1 ENST00000406122.5 |
ATL2
|
atlastin GTPase 2 |
| chr6_-_33580229 | 0.14 |
ENST00000374467.4
ENST00000442998.6 ENST00000360661.9 |
BAK1
|
BCL2 antagonist/killer 1 |
| chr1_+_47438036 | 0.14 |
ENST00000334793.6
|
FOXD2
|
forkhead box D2 |
Network of associatons between targets according to the STRING database.

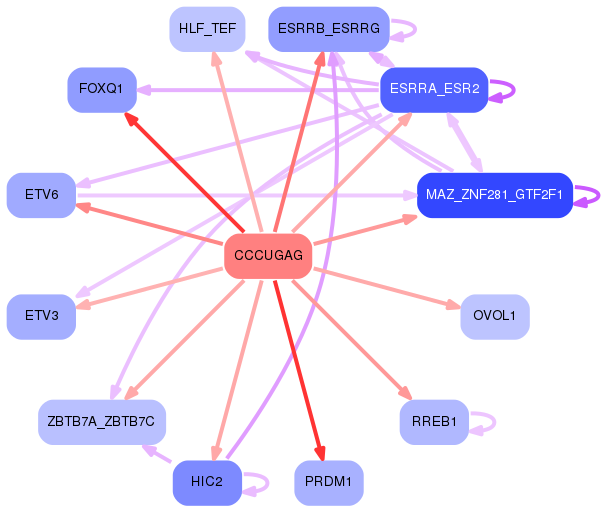
First level regulatory network of CCCUGAG
Gene Ontology Analysis
Gene overrepresentation in biological process category:
| Log-likelihood per target | Total log-likelihood | Term | Description |
|---|---|---|---|
| 0.4 | 1.2 | GO:0061341 | non-canonical Wnt signaling pathway involved in heart development(GO:0061341) planar cell polarity pathway involved in heart morphogenesis(GO:0061346) |
| 0.3 | 1.0 | GO:1990654 | regulation of extrathymic T cell differentiation(GO:0033082) sebum secreting cell proliferation(GO:1990654) |
| 0.3 | 1.0 | GO:0070429 | regulation of toll-like receptor 5 signaling pathway(GO:0034147) negative regulation of toll-like receptor 5 signaling pathway(GO:0034148) negative regulation of nucleotide-binding oligomerization domain containing 1 signaling pathway(GO:0070429) |
| 0.3 | 0.9 | GO:0060166 | olfactory pit development(GO:0060166) |
| 0.3 | 0.8 | GO:1904395 | positive regulation of skeletal muscle acetylcholine-gated channel clustering(GO:1904395) |
| 0.3 | 1.0 | GO:0070889 | mRNA localization resulting in posttranscriptional regulation of gene expression(GO:0010609) platelet alpha granule organization(GO:0070889) regulation of DNA damage response, signal transduction by p53 class mediator resulting in transcription of p21 class mediator(GO:1902162) positive regulation of DNA damage response, signal transduction by p53 class mediator resulting in transcription of p21 class mediator(GO:1902164) |
| 0.2 | 1.0 | GO:1901526 | positive regulation of macromitophagy(GO:1901526) positive regulation of mitophagy in response to mitochondrial depolarization(GO:1904925) |
| 0.2 | 0.6 | GO:0035574 | histone H4-K20 demethylation(GO:0035574) |
| 0.2 | 0.2 | GO:0060978 | angiogenesis involved in coronary vascular morphogenesis(GO:0060978) |
| 0.2 | 0.5 | GO:0050976 | detection of mechanical stimulus involved in sensory perception of touch(GO:0050976) |
| 0.2 | 1.1 | GO:2000491 | positive regulation of hepatic stellate cell activation(GO:2000491) |
| 0.2 | 0.5 | GO:1903774 | positive regulation of viral budding via host ESCRT complex(GO:1903774) |
| 0.1 | 0.7 | GO:0042663 | regulation of endodermal cell fate specification(GO:0042663) |
| 0.1 | 0.6 | GO:0038018 | Wnt receptor catabolic process(GO:0038018) |
| 0.1 | 0.4 | GO:0036510 | trimming of terminal mannose on C branch(GO:0036510) |
| 0.1 | 1.3 | GO:0021999 | neural plate anterior/posterior regionalization(GO:0021999) |
| 0.1 | 0.4 | GO:1903691 | positive regulation of wound healing, spreading of epidermal cells(GO:1903691) |
| 0.1 | 0.5 | GO:0018125 | peptidyl-cysteine methylation(GO:0018125) |
| 0.1 | 0.8 | GO:0035166 | post-embryonic hemopoiesis(GO:0035166) |
| 0.1 | 0.3 | GO:0070650 | endoplasmic reticulum polarization(GO:0061163) actin filament bundle retrograde transport(GO:0061573) actin filament bundle distribution(GO:0070650) |
| 0.1 | 0.2 | GO:1903826 | arginine transmembrane transport(GO:1903826) |
| 0.1 | 1.0 | GO:0007256 | activation of JNKK activity(GO:0007256) |
| 0.1 | 0.3 | GO:0015783 | GDP-fucose transport(GO:0015783) purine nucleotide-sugar transport(GO:0036079) |
| 0.1 | 0.8 | GO:1990034 | calcium ion export from cell(GO:1990034) |
| 0.1 | 0.2 | GO:0015920 | lipopolysaccharide transport(GO:0015920) |
| 0.1 | 0.4 | GO:1903352 | L-ornithine transmembrane transport(GO:1903352) |
| 0.1 | 0.3 | GO:0097045 | phosphatidylserine exposure on blood platelet(GO:0097045) |
| 0.1 | 0.2 | GO:1901994 | meiotic cell cycle phase transition(GO:0044771) regulation of meiotic cell cycle phase transition(GO:1901993) negative regulation of meiotic cell cycle phase transition(GO:1901994) |
| 0.1 | 0.5 | GO:0007296 | vitellogenesis(GO:0007296) |
| 0.1 | 0.3 | GO:0042369 | vitamin D catabolic process(GO:0042369) |
| 0.1 | 0.1 | GO:0002339 | B cell selection(GO:0002339) |
| 0.1 | 0.6 | GO:0060666 | dichotomous subdivision of terminal units involved in salivary gland branching(GO:0060666) |
| 0.1 | 0.2 | GO:0001579 | medium-chain fatty acid transport(GO:0001579) |
| 0.1 | 0.4 | GO:0060011 | Sertoli cell proliferation(GO:0060011) |
| 0.1 | 0.3 | GO:1990928 | response to amino acid starvation(GO:1990928) |
| 0.1 | 0.3 | GO:0050915 | sensory perception of sour taste(GO:0050915) |
| 0.1 | 0.1 | GO:1901166 | neural crest cell migration involved in autonomic nervous system development(GO:1901166) |
| 0.1 | 0.3 | GO:0045218 | zonula adherens maintenance(GO:0045218) |
| 0.1 | 0.6 | GO:0019368 | fatty acid elongation, saturated fatty acid(GO:0019367) fatty acid elongation, unsaturated fatty acid(GO:0019368) fatty acid elongation, monounsaturated fatty acid(GO:0034625) fatty acid elongation, polyunsaturated fatty acid(GO:0034626) |
| 0.1 | 0.3 | GO:0002005 | angiotensin catabolic process in blood(GO:0002005) |
| 0.1 | 0.2 | GO:1901254 | modulation by host of viral RNA genome replication(GO:0044830) positive regulation of intracellular transport of viral material(GO:1901254) |
| 0.1 | 0.4 | GO:0035522 | monoubiquitinated histone deubiquitination(GO:0035521) monoubiquitinated histone H2A deubiquitination(GO:0035522) |
| 0.1 | 0.5 | GO:0035897 | proteolysis in other organism(GO:0035897) |
| 0.1 | 0.3 | GO:0000379 | tRNA-type intron splice site recognition and cleavage(GO:0000379) |
| 0.1 | 0.5 | GO:0035087 | siRNA loading onto RISC involved in RNA interference(GO:0035087) |
| 0.1 | 0.4 | GO:0030579 | ubiquitin-dependent SMAD protein catabolic process(GO:0030579) |
| 0.1 | 0.2 | GO:0042779 | tRNA 3'-trailer cleavage, endonucleolytic(GO:0034414) tRNA 3'-trailer cleavage(GO:0042779) mitochondrial tRNA 3'-end processing(GO:1990180) |
| 0.0 | 0.2 | GO:0061073 | ciliary body morphogenesis(GO:0061073) |
| 0.0 | 0.2 | GO:1902544 | regulation of DNA N-glycosylase activity(GO:1902544) |
| 0.0 | 0.9 | GO:0006054 | N-acetylneuraminate metabolic process(GO:0006054) |
| 0.0 | 0.4 | GO:2000210 | positive regulation of anoikis(GO:2000210) |
| 0.0 | 0.3 | GO:0036155 | acylglycerol acyl-chain remodeling(GO:0036155) |
| 0.0 | 0.2 | GO:0070358 | actin polymerization-dependent cell motility(GO:0070358) |
| 0.0 | 0.2 | GO:0030200 | heparan sulfate proteoglycan catabolic process(GO:0030200) |
| 0.0 | 2.0 | GO:0050919 | negative chemotaxis(GO:0050919) |
| 0.0 | 0.1 | GO:2000523 | regulation of T cell costimulation(GO:2000523) positive regulation of T cell costimulation(GO:2000525) |
| 0.0 | 1.1 | GO:0070886 | positive regulation of calcineurin-NFAT signaling cascade(GO:0070886) |
| 0.0 | 0.3 | GO:2000124 | regulation of endocannabinoid signaling pathway(GO:2000124) |
| 0.0 | 0.3 | GO:0051005 | negative regulation of lipoprotein lipase activity(GO:0051005) |
| 0.0 | 0.1 | GO:0033025 | mast cell homeostasis(GO:0033023) mast cell apoptotic process(GO:0033024) regulation of mast cell apoptotic process(GO:0033025) |
| 0.0 | 0.3 | GO:0007217 | tachykinin receptor signaling pathway(GO:0007217) |
| 0.0 | 0.2 | GO:0009098 | branched-chain amino acid biosynthetic process(GO:0009082) leucine biosynthetic process(GO:0009098) valine biosynthetic process(GO:0009099) |
| 0.0 | 0.8 | GO:0086016 | AV node cell action potential(GO:0086016) AV node cell to bundle of His cell signaling(GO:0086027) |
| 0.0 | 0.1 | GO:0042137 | sequestering of neurotransmitter(GO:0042137) |
| 0.0 | 0.3 | GO:0018231 | peptidyl-L-cysteine S-palmitoylation(GO:0018230) peptidyl-S-diacylglycerol-L-cysteine biosynthetic process from peptidyl-cysteine(GO:0018231) |
| 0.0 | 0.9 | GO:0036152 | phosphatidylethanolamine acyl-chain remodeling(GO:0036152) |
| 0.0 | 0.4 | GO:0015693 | magnesium ion transport(GO:0015693) |
| 0.0 | 0.2 | GO:0006543 | glutamine catabolic process(GO:0006543) |
| 0.0 | 0.1 | GO:0045925 | positive regulation of female receptivity(GO:0045925) |
| 0.0 | 0.6 | GO:1904380 | endoplasmic reticulum mannose trimming(GO:1904380) |
| 0.0 | 0.1 | GO:1990168 | protein K27-linked deubiquitination(GO:1990167) protein K33-linked deubiquitination(GO:1990168) |
| 0.0 | 0.1 | GO:0050928 | negative regulation of positive chemotaxis(GO:0050928) |
| 0.0 | 0.2 | GO:2000049 | positive regulation of cell-cell adhesion mediated by cadherin(GO:2000049) |
| 0.0 | 0.4 | GO:0015732 | prostaglandin transport(GO:0015732) |
| 0.0 | 0.3 | GO:0000183 | chromatin silencing at rDNA(GO:0000183) |
| 0.0 | 0.2 | GO:0000160 | phosphorelay signal transduction system(GO:0000160) |
| 0.0 | 0.1 | GO:0034773 | histone H4-K20 trimethylation(GO:0034773) |
| 0.0 | 0.1 | GO:0007185 | transmembrane receptor protein tyrosine phosphatase signaling pathway(GO:0007185) |
| 0.0 | 0.3 | GO:0042670 | retinal cone cell differentiation(GO:0042670) retinal cone cell development(GO:0046549) |
| 0.0 | 0.9 | GO:0010738 | regulation of protein kinase A signaling(GO:0010738) |
| 0.0 | 0.2 | GO:0071321 | cellular response to cGMP(GO:0071321) |
| 0.0 | 0.1 | GO:0098583 | mastication(GO:0071626) learned vocalization behavior(GO:0098583) |
| 0.0 | 0.1 | GO:0060057 | lactose metabolic process(GO:0005988) lactose biosynthetic process(GO:0005989) apoptotic process involved in mammary gland involution(GO:0060057) positive regulation of apoptotic process involved in mammary gland involution(GO:0060058) positive regulation of apoptotic process involved in morphogenesis(GO:1902339) regulation of mammary gland involution(GO:1903519) positive regulation of mammary gland involution(GO:1903521) positive regulation of apoptotic process involved in development(GO:1904747) |
| 0.0 | 0.1 | GO:1900239 | phenotypic switching(GO:0036166) regulation of phenotypic switching(GO:1900239) |
| 0.0 | 0.1 | GO:0042360 | vitamin E metabolic process(GO:0042360) negative regulation of establishment of blood-brain barrier(GO:0090212) |
| 0.0 | 0.1 | GO:0046952 | ketone body catabolic process(GO:0046952) |
| 0.0 | 0.1 | GO:2000721 | positive regulation of transcription from RNA polymerase II promoter involved in smooth muscle cell differentiation(GO:2000721) |
| 0.0 | 0.9 | GO:0006198 | cAMP catabolic process(GO:0006198) |
| 0.0 | 0.2 | GO:0072718 | response to cisplatin(GO:0072718) |
| 0.0 | 0.9 | GO:0045747 | positive regulation of Notch signaling pathway(GO:0045747) |
| 0.0 | 0.2 | GO:0097011 | cellular response to granulocyte macrophage colony-stimulating factor stimulus(GO:0097011) response to granulocyte macrophage colony-stimulating factor(GO:0097012) |
| 0.0 | 0.1 | GO:0032485 | Ral protein signal transduction(GO:0032484) regulation of Ral protein signal transduction(GO:0032485) |
| 0.0 | 0.1 | GO:0090370 | negative regulation of cholesterol efflux(GO:0090370) |
| 0.0 | 0.1 | GO:0048205 | COPI-coated vesicle budding(GO:0035964) Golgi transport vesicle coating(GO:0048200) COPI coating of Golgi vesicle(GO:0048205) |
| 0.0 | 0.3 | GO:0031998 | regulation of fatty acid beta-oxidation(GO:0031998) |
| 0.0 | 0.1 | GO:0010735 | positive regulation of transcription via serum response element binding(GO:0010735) negative regulation of beta-amyloid clearance(GO:1900222) |
| 0.0 | 0.2 | GO:1902902 | negative regulation of autophagosome assembly(GO:1902902) |
| 0.0 | 0.0 | GO:0021784 | postganglionic parasympathetic fiber development(GO:0021784) |
| 0.0 | 0.3 | GO:0030150 | protein import into mitochondrial matrix(GO:0030150) |
| 0.0 | 0.3 | GO:0035020 | regulation of Rac protein signal transduction(GO:0035020) |
| 0.0 | 0.0 | GO:0021503 | neural fold bending(GO:0021503) |
| 0.0 | 0.1 | GO:0048549 | positive regulation of pinocytosis(GO:0048549) |
| 0.0 | 0.0 | GO:0061386 | closure of optic fissure(GO:0061386) |
| 0.0 | 0.3 | GO:0060211 | regulation of nuclear-transcribed mRNA poly(A) tail shortening(GO:0060211) positive regulation of nuclear-transcribed mRNA poly(A) tail shortening(GO:0060213) |
| 0.0 | 0.3 | GO:0045793 | positive regulation of cell size(GO:0045793) |
| 0.0 | 0.6 | GO:0031069 | hair follicle morphogenesis(GO:0031069) |
| 0.0 | 0.0 | GO:1904562 | phosphatidylinositol 5-phosphate metabolic process(GO:1904562) |
| 0.0 | 0.0 | GO:0044725 | chromatin reprogramming in the zygote(GO:0044725) |
| 0.0 | 0.1 | GO:0032927 | positive regulation of activin receptor signaling pathway(GO:0032927) |
| 0.0 | 0.3 | GO:0010172 | embryonic body morphogenesis(GO:0010172) |
| 0.0 | 0.2 | GO:0070389 | chaperone cofactor-dependent protein refolding(GO:0070389) |
| 0.0 | 0.1 | GO:0051025 | negative regulation of mRNA cleavage(GO:0031438) negative regulation of immunoglobulin secretion(GO:0051025) negative regulation of mRNA endonucleolytic cleavage involved in unfolded protein response(GO:1904721) |
| 0.0 | 0.1 | GO:1903830 | magnesium ion transmembrane transport(GO:1903830) |
| 0.0 | 0.1 | GO:0002934 | desmosome organization(GO:0002934) |
| 0.0 | 0.1 | GO:0002480 | antigen processing and presentation of exogenous peptide antigen via MHC class I, TAP-independent(GO:0002480) |
| 0.0 | 0.3 | GO:2000637 | positive regulation of gene silencing by miRNA(GO:2000637) |
| 0.0 | 0.0 | GO:0060559 | positive regulation of vitamin metabolic process(GO:0046136) positive regulation of vitamin D biosynthetic process(GO:0060557) positive regulation of calcidiol 1-monooxygenase activity(GO:0060559) |
| 0.0 | 0.0 | GO:0009298 | GDP-mannose biosynthetic process(GO:0009298) |
| 0.0 | 0.2 | GO:0033327 | Leydig cell differentiation(GO:0033327) |
| 0.0 | 0.6 | GO:1901998 | toxin transport(GO:1901998) |
| 0.0 | 0.1 | GO:0090168 | Golgi reassembly(GO:0090168) |
| 0.0 | 0.1 | GO:0034378 | chylomicron assembly(GO:0034378) |
| 0.0 | 0.6 | GO:0031648 | protein destabilization(GO:0031648) |
Gene overrepresentation in cellular component category:
| Log-likelihood per target | Total log-likelihood | Term | Description |
|---|---|---|---|
| 0.4 | 1.2 | GO:0060187 | cell pole(GO:0060187) |
| 0.2 | 0.6 | GO:0000839 | Hrd1p ubiquitin ligase ERAD-L complex(GO:0000839) |
| 0.1 | 0.4 | GO:0000939 | condensed chromosome inner kinetochore(GO:0000939) |
| 0.1 | 0.3 | GO:0098855 | HCN channel complex(GO:0098855) |
| 0.1 | 1.1 | GO:0097197 | tetraspanin-enriched microdomain(GO:0097197) |
| 0.1 | 0.4 | GO:0035517 | PR-DUB complex(GO:0035517) |
| 0.1 | 0.3 | GO:0034673 | inhibin-betaglycan-ActRII complex(GO:0034673) |
| 0.1 | 0.2 | GO:1902737 | dendritic filopodium(GO:1902737) |
| 0.0 | 0.3 | GO:0000214 | tRNA-intron endonuclease complex(GO:0000214) |
| 0.0 | 0.3 | GO:0033553 | rDNA heterochromatin(GO:0033553) |
| 0.0 | 0.6 | GO:0002116 | semaphorin receptor complex(GO:0002116) |
| 0.0 | 0.2 | GO:0097196 | Shu complex(GO:0097196) |
| 0.0 | 0.6 | GO:0016600 | flotillin complex(GO:0016600) |
| 0.0 | 0.2 | GO:0042272 | nuclear RNA export factor complex(GO:0042272) |
| 0.0 | 0.5 | GO:0098799 | outer mitochondrial membrane protein complex(GO:0098799) |
| 0.0 | 0.9 | GO:0001518 | voltage-gated sodium channel complex(GO:0001518) |
| 0.0 | 0.2 | GO:0071986 | Ragulator complex(GO:0071986) |
| 0.0 | 0.2 | GO:0090571 | RNA polymerase II transcription repressor complex(GO:0090571) |
| 0.0 | 0.5 | GO:0000813 | ESCRT I complex(GO:0000813) |
| 0.0 | 0.2 | GO:0070022 | transforming growth factor beta receptor homodimeric complex(GO:0070022) |
| 0.0 | 0.5 | GO:0005845 | mRNA cap binding complex(GO:0005845) |
| 0.0 | 0.5 | GO:0033270 | paranode region of axon(GO:0033270) |
| 0.0 | 0.3 | GO:0005915 | zonula adherens(GO:0005915) |
| 0.0 | 0.1 | GO:0031905 | early endosome lumen(GO:0031905) |
| 0.0 | 0.2 | GO:0005956 | protein kinase CK2 complex(GO:0005956) |
| 0.0 | 0.2 | GO:1990316 | ATG1/ULK1 kinase complex(GO:1990316) |
| 0.0 | 2.3 | GO:0016459 | myosin complex(GO:0016459) |
| 0.0 | 0.5 | GO:0042588 | zymogen granule(GO:0042588) |
| 0.0 | 0.1 | GO:0032937 | SREBP-SCAP-Insig complex(GO:0032937) |
| 0.0 | 0.1 | GO:0060203 | clathrin-sculpted glutamate transport vesicle(GO:0060199) clathrin-sculpted glutamate transport vesicle membrane(GO:0060203) |
| 0.0 | 0.2 | GO:0097136 | Bcl-2 family protein complex(GO:0097136) |
| 0.0 | 1.5 | GO:0032580 | Golgi cisterna membrane(GO:0032580) |
| 0.0 | 0.1 | GO:0097427 | microtubule bundle(GO:0097427) |
| 0.0 | 0.4 | GO:0044322 | endoplasmic reticulum quality control compartment(GO:0044322) |
| 0.0 | 0.3 | GO:0044295 | axonal growth cone(GO:0044295) |
| 0.0 | 0.1 | GO:0031466 | Cul5-RING ubiquitin ligase complex(GO:0031466) |
| 0.0 | 0.1 | GO:0034678 | integrin alpha8-beta1 complex(GO:0034678) |
| 0.0 | 0.0 | GO:0005592 | collagen type XI trimer(GO:0005592) |
Gene overrepresentation in molecular function category:
| Log-likelihood per target | Total log-likelihood | Term | Description |
|---|---|---|---|
| 0.3 | 1.3 | GO:0004706 | JUN kinase kinase kinase activity(GO:0004706) |
| 0.2 | 0.6 | GO:0035575 | histone demethylase activity (H4-K20 specific)(GO:0035575) |
| 0.1 | 0.7 | GO:0016971 | flavin-linked sulfhydryl oxidase activity(GO:0016971) |
| 0.1 | 0.8 | GO:0003835 | beta-galactoside alpha-2,6-sialyltransferase activity(GO:0003835) |
| 0.1 | 0.4 | GO:0052739 | phosphatidylserine 1-acylhydrolase activity(GO:0052739) |
| 0.1 | 0.5 | GO:0098808 | mRNA cap binding(GO:0098808) |
| 0.1 | 1.0 | GO:0004396 | glucokinase activity(GO:0004340) hexokinase activity(GO:0004396) fructokinase activity(GO:0008865) mannokinase activity(GO:0019158) |
| 0.1 | 1.2 | GO:0017034 | Rap guanyl-nucleotide exchange factor activity(GO:0017034) |
| 0.1 | 1.1 | GO:0038132 | neuregulin binding(GO:0038132) |
| 0.1 | 0.9 | GO:0086006 | voltage-gated sodium channel activity involved in cardiac muscle cell action potential(GO:0086006) |
| 0.1 | 0.3 | GO:0036080 | GDP-fucose transmembrane transporter activity(GO:0005457) purine nucleotide-sugar transmembrane transporter activity(GO:0036080) |
| 0.1 | 0.2 | GO:0070506 | high-density lipoprotein particle receptor activity(GO:0070506) |
| 0.1 | 1.4 | GO:0017017 | MAP kinase tyrosine/serine/threonine phosphatase activity(GO:0017017) |
| 0.1 | 0.3 | GO:0047192 | 1-alkylglycerophosphocholine O-acetyltransferase activity(GO:0047192) |
| 0.1 | 2.0 | GO:0038191 | neuropilin binding(GO:0038191) |
| 0.1 | 0.2 | GO:0072590 | N-acetyl-L-aspartate-L-glutamate ligase activity(GO:0072590) |
| 0.1 | 1.5 | GO:0004653 | polypeptide N-acetylgalactosaminyltransferase activity(GO:0004653) |
| 0.1 | 0.9 | GO:0001758 | retinal dehydrogenase activity(GO:0001758) |
| 0.1 | 0.3 | GO:0050252 | retinol O-fatty-acyltransferase activity(GO:0050252) |
| 0.1 | 0.6 | GO:0050682 | AF-2 domain binding(GO:0050682) |
| 0.1 | 0.2 | GO:0043739 | G/U mismatch-specific uracil-DNA glycosylase activity(GO:0043739) |
| 0.1 | 0.3 | GO:0005222 | intracellular cAMP activated cation channel activity(GO:0005222) |
| 0.1 | 0.6 | GO:0047144 | 2-acylglycerol-3-phosphate O-acyltransferase activity(GO:0047144) |
| 0.1 | 0.3 | GO:0070576 | vitamin D 24-hydroxylase activity(GO:0070576) |
| 0.1 | 0.4 | GO:0004045 | aminoacyl-tRNA hydrolase activity(GO:0004045) |
| 0.1 | 0.3 | GO:0010465 | nerve growth factor receptor activity(GO:0010465) |
| 0.1 | 0.3 | GO:0044736 | acid-sensing ion channel activity(GO:0044736) |
| 0.1 | 0.6 | GO:0009922 | fatty acid elongase activity(GO:0009922) 3-oxo-arachidoyl-CoA synthase activity(GO:0102336) 3-oxo-cerotoyl-CoA synthase activity(GO:0102337) 3-oxo-lignoceronyl-CoA synthase activity(GO:0102338) |
| 0.1 | 0.3 | GO:0047696 | beta-adrenergic receptor kinase activity(GO:0047696) |
| 0.1 | 0.4 | GO:0034046 | poly(G) binding(GO:0034046) |
| 0.1 | 0.2 | GO:0042781 | 3'-tRNA processing endoribonuclease activity(GO:0042781) |
| 0.0 | 0.9 | GO:0061578 | Lys63-specific deubiquitinase activity(GO:0061578) |
| 0.0 | 0.4 | GO:0000064 | L-ornithine transmembrane transporter activity(GO:0000064) |
| 0.0 | 0.2 | GO:0000155 | phosphorelay sensor kinase activity(GO:0000155) |
| 0.0 | 0.9 | GO:0048185 | activin binding(GO:0048185) |
| 0.0 | 0.4 | GO:0004571 | mannosyl-oligosaccharide 1,2-alpha-mannosidase activity(GO:0004571) |
| 0.0 | 0.2 | GO:0008273 | calcium, potassium:sodium antiporter activity(GO:0008273) |
| 0.0 | 0.1 | GO:0003858 | 3-hydroxybutyrate dehydrogenase activity(GO:0003858) |
| 0.0 | 0.6 | GO:1904264 | ubiquitin protein ligase activity involved in ERAD pathway(GO:1904264) |
| 0.0 | 0.2 | GO:0015181 | arginine transmembrane transporter activity(GO:0015181) |
| 0.0 | 1.2 | GO:0034237 | protein kinase A regulatory subunit binding(GO:0034237) |
| 0.0 | 0.1 | GO:0008431 | vitamin E binding(GO:0008431) |
| 0.0 | 1.5 | GO:0008157 | protein phosphatase 1 binding(GO:0008157) |
| 0.0 | 0.2 | GO:0052654 | branched-chain-amino-acid transaminase activity(GO:0004084) L-leucine transaminase activity(GO:0052654) L-valine transaminase activity(GO:0052655) L-isoleucine transaminase activity(GO:0052656) |
| 0.0 | 0.6 | GO:0015245 | fatty acid transporter activity(GO:0015245) |
| 0.0 | 0.3 | GO:0003831 | beta-N-acetylglucosaminylglycopeptide beta-1,4-galactosyltransferase activity(GO:0003831) |
| 0.0 | 0.8 | GO:0034185 | apolipoprotein binding(GO:0034185) |
| 0.0 | 0.6 | GO:0017154 | semaphorin receptor activity(GO:0017154) |
| 0.0 | 0.3 | GO:0000213 | tRNA-intron endonuclease activity(GO:0000213) |
| 0.0 | 0.3 | GO:0015288 | porin activity(GO:0015288) |
| 0.0 | 0.9 | GO:0005251 | delayed rectifier potassium channel activity(GO:0005251) |
| 0.0 | 0.4 | GO:0003688 | DNA replication origin binding(GO:0003688) |
| 0.0 | 0.3 | GO:0051011 | microtubule minus-end binding(GO:0051011) |
| 0.0 | 0.2 | GO:0005025 | transforming growth factor beta receptor activity, type I(GO:0005025) |
| 0.0 | 0.1 | GO:0080130 | L-phenylalanine:2-oxoglutarate aminotransferase activity(GO:0080130) |
| 0.0 | 1.0 | GO:1990841 | promoter-specific chromatin binding(GO:1990841) |
| 0.0 | 0.1 | GO:0000247 | C-8 sterol isomerase activity(GO:0000247) |
| 0.0 | 0.7 | GO:0031489 | myosin V binding(GO:0031489) |
| 0.0 | 0.5 | GO:0015095 | magnesium ion transmembrane transporter activity(GO:0015095) |
| 0.0 | 1.1 | GO:0043027 | cysteine-type endopeptidase inhibitor activity involved in apoptotic process(GO:0043027) |
| 0.0 | 0.3 | GO:0030306 | ADP-ribosylation factor binding(GO:0030306) |
| 0.0 | 0.1 | GO:0015319 | sodium:inorganic phosphate symporter activity(GO:0015319) |
| 0.0 | 0.1 | GO:0042282 | hydroxymethylglutaryl-CoA reductase (NADPH) activity(GO:0004420) hydroxymethylglutaryl-CoA reductase activity(GO:0042282) |
| 0.0 | 0.8 | GO:0000146 | microfilament motor activity(GO:0000146) |
| 0.0 | 0.9 | GO:0004115 | 3',5'-cyclic-AMP phosphodiesterase activity(GO:0004115) |
| 0.0 | 0.1 | GO:0052795 | exo-alpha-(2->3)-sialidase activity(GO:0052794) exo-alpha-(2->6)-sialidase activity(GO:0052795) exo-alpha-(2->8)-sialidase activity(GO:0052796) |
| 0.0 | 0.1 | GO:0008426 | protein kinase C inhibitor activity(GO:0008426) |
| 0.0 | 0.1 | GO:0010484 | H3 histone acetyltransferase activity(GO:0010484) |
| 0.0 | 0.2 | GO:0000182 | rDNA binding(GO:0000182) |
| 0.0 | 0.2 | GO:0008525 | phosphatidylcholine transporter activity(GO:0008525) |
| 0.0 | 0.2 | GO:0071933 | Arp2/3 complex binding(GO:0071933) |
| 0.0 | 0.1 | GO:0042799 | histone methyltransferase activity (H4-K20 specific)(GO:0042799) |
| 0.0 | 0.9 | GO:0001205 | transcriptional activator activity, RNA polymerase II distal enhancer sequence-specific binding(GO:0001205) |
| 0.0 | 0.3 | GO:0017128 | phospholipid scramblase activity(GO:0017128) |
| 0.0 | 0.2 | GO:0039706 | co-receptor binding(GO:0039706) |
| 0.0 | 0.1 | GO:0004565 | beta-galactosidase activity(GO:0004565) |
| 0.0 | 0.3 | GO:0008190 | eukaryotic initiation factor 4E binding(GO:0008190) |
| 0.0 | 0.1 | GO:0016833 | oxo-acid-lyase activity(GO:0016833) |
| 0.0 | 0.1 | GO:0035198 | miRNA binding(GO:0035198) |
| 0.0 | 0.3 | GO:0004012 | phospholipid-translocating ATPase activity(GO:0004012) |
| 0.0 | 0.3 | GO:0001163 | RNA polymerase I regulatory region DNA binding(GO:0001013) RNA polymerase I regulatory region sequence-specific DNA binding(GO:0001163) RNA polymerase I CORE element sequence-specific DNA binding(GO:0001164) |
| 0.0 | 0.1 | GO:0060698 | endoribonuclease inhibitor activity(GO:0060698) |
| 0.0 | 0.0 | GO:0016215 | stearoyl-CoA 9-desaturase activity(GO:0004768) acyl-CoA desaturase activity(GO:0016215) |
| 0.0 | 0.2 | GO:0017151 | DEAD/H-box RNA helicase binding(GO:0017151) |
| 0.0 | 0.1 | GO:0046920 | alpha-(1->3)-fucosyltransferase activity(GO:0046920) |
| 0.0 | 0.1 | GO:0003828 | alpha-N-acetylneuraminate alpha-2,8-sialyltransferase activity(GO:0003828) |
| 0.0 | 1.3 | GO:0003730 | mRNA 3'-UTR binding(GO:0003730) |
Gene overrepresentation in curated gene sets: canonical pathways category:
| Log-likelihood per target | Total log-likelihood | Term | Description |
|---|---|---|---|
| 0.0 | 1.1 | PID ANTHRAX PATHWAY | Cellular roles of Anthrax toxin |
| 0.0 | 1.6 | SA B CELL RECEPTOR COMPLEXES | Antigen binding to B cell receptors activates protein tyrosine kinases, such as the Src family, which ultimate activate MAP kinases. |
| 0.0 | 1.1 | PID ERBB NETWORK PATHWAY | ErbB receptor signaling network |
| 0.0 | 1.1 | ST JNK MAPK PATHWAY | JNK MAPK Pathway |
| 0.0 | 0.9 | PID NFKAPPAB CANONICAL PATHWAY | Canonical NF-kappaB pathway |
| 0.0 | 0.6 | PID ALK1 PATHWAY | ALK1 signaling events |
Gene overrepresentation in curated gene sets: REACTOME pathways category:
| Log-likelihood per target | Total log-likelihood | Term | Description |
|---|---|---|---|
| 0.1 | 1.9 | REACTOME TGF BETA RECEPTOR SIGNALING IN EMT EPITHELIAL TO MESENCHYMAL TRANSITION | Genes involved in TGF-beta receptor signaling in EMT (epithelial to mesenchymal transition) |
| 0.0 | 1.0 | REACTOME ERKS ARE INACTIVATED | Genes involved in ERKs are inactivated |
| 0.0 | 1.1 | REACTOME N GLYCAN ANTENNAE ELONGATION | Genes involved in N-Glycan antennae elongation |
| 0.0 | 0.5 | REACTOME MEMBRANE BINDING AND TARGETTING OF GAG PROTEINS | Genes involved in Membrane binding and targetting of GAG proteins |
| 0.0 | 1.2 | REACTOME DOWNREGULATION OF ERBB2 ERBB3 SIGNALING | Genes involved in Downregulation of ERBB2:ERBB3 signaling |
| 0.0 | 1.0 | REACTOME ERK MAPK TARGETS | Genes involved in ERK/MAPK targets |
| 0.0 | 0.9 | REACTOME ACYL CHAIN REMODELLING OF PE | Genes involved in Acyl chain remodelling of PE |
| 0.0 | 1.0 | REACTOME ACTIVATED NOTCH1 TRANSMITS SIGNAL TO THE NUCLEUS | Genes involved in Activated NOTCH1 Transmits Signal to the Nucleus |
| 0.0 | 0.6 | REACTOME SEMA3A PLEXIN REPULSION SIGNALING BY INHIBITING INTEGRIN ADHESION | Genes involved in SEMA3A-Plexin repulsion signaling by inhibiting Integrin adhesion |
| 0.0 | 0.4 | REACTOME E2F ENABLED INHIBITION OF PRE REPLICATION COMPLEX FORMATION | Genes involved in E2F-enabled inhibition of pre-replication complex formation |
| 0.0 | 0.4 | REACTOME CALNEXIN CALRETICULIN CYCLE | Genes involved in Calnexin/calreticulin cycle |
| 0.0 | 0.4 | REACTOME TRANSPORT OF ORGANIC ANIONS | Genes involved in Transport of organic anions |
| 0.0 | 1.0 | REACTOME GLUCOSE TRANSPORT | Genes involved in Glucose transport |
| 0.0 | 0.5 | REACTOME TRAF6 MEDIATED NFKB ACTIVATION | Genes involved in TRAF6 mediated NF-kB activation |
| 0.0 | 0.5 | REACTOME SIGNALING BY BMP | Genes involved in Signaling by BMP |
| 0.0 | 0.6 | REACTOME SYNTHESIS OF VERY LONG CHAIN FATTY ACYL COAS | Genes involved in Synthesis of very long-chain fatty acyl-CoAs |
| 0.0 | 0.5 | REACTOME TRANSPORT OF VITAMINS NUCLEOSIDES AND RELATED MOLECULES | Genes involved in Transport of vitamins, nucleosides, and related molecules |
| 0.0 | 0.3 | REACTOME MTORC1 MEDIATED SIGNALLING | Genes involved in mTORC1-mediated signalling |
| 0.0 | 1.1 | REACTOME VOLTAGE GATED POTASSIUM CHANNELS | Genes involved in Voltage gated Potassium channels |
| 0.0 | 0.4 | REACTOME JNK C JUN KINASES PHOSPHORYLATION AND ACTIVATION MEDIATED BY ACTIVATED HUMAN TAK1 | Genes involved in JNK (c-Jun kinases) phosphorylation and activation mediated by activated human TAK1 |
| 0.0 | 0.8 | REACTOME NEGATIVE REGULATORS OF RIG I MDA5 SIGNALING | Genes involved in Negative regulators of RIG-I/MDA5 signaling |
| 0.0 | 0.2 | REACTOME HDL MEDIATED LIPID TRANSPORT | Genes involved in HDL-mediated lipid transport |
| 0.0 | 0.2 | REACTOME PURINE RIBONUCLEOSIDE MONOPHOSPHATE BIOSYNTHESIS | Genes involved in Purine ribonucleoside monophosphate biosynthesis |
| 0.0 | 0.1 | REACTOME ENDOSOMAL VACUOLAR PATHWAY | Genes involved in Endosomal/Vacuolar pathway |