Project
Epithelial-Mesenchymal Transition, human (Scheel, 2011)
Navigation
Downloads
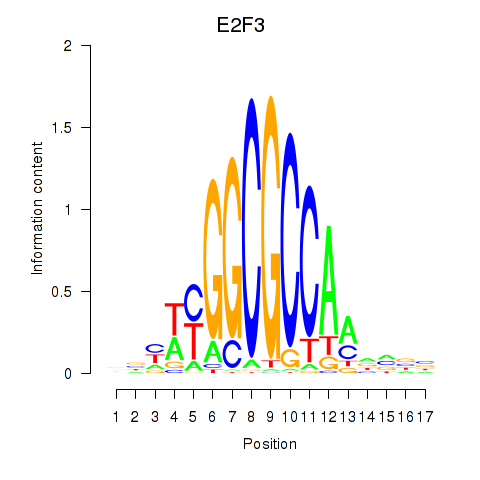
Results for E2F3
Z-value: 1.81
Motif logo
Transcription factors associated with E2F3
| Gene Symbol | Gene ID | Gene Info |
|---|---|---|
|
E2F3
|
ENSG00000112242.15 | E2F transcription factor 3 |
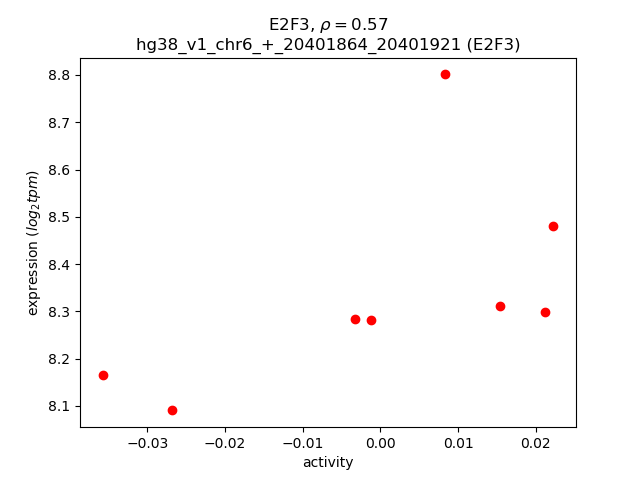
Activity-expression correlation:
| Gene | Promoter | Pearson corr. coef. | P-value | Plot |
|---|---|---|---|---|
| E2F3 | hg38_v1_chr6_+_20401864_20401921, hg38_v1_chr6_+_20403679_20403735 | 0.57 | 1.4e-01 | Click! |
Activity profile of E2F3 motif
Sorted Z-values of E2F3 motif
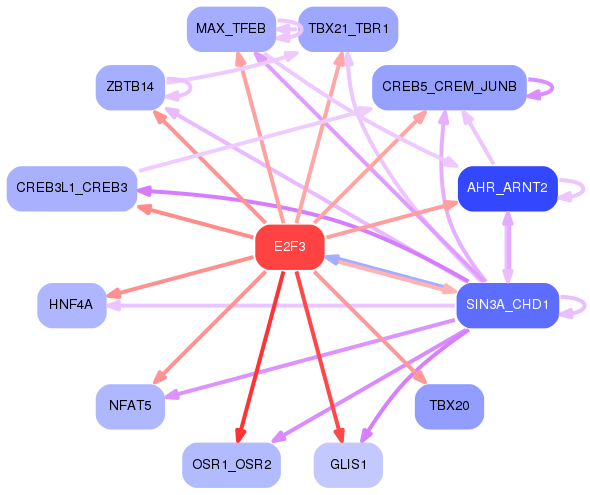
Network of associatons between targets according to the STRING database.

First level regulatory network of E2F3
Gene Ontology Analysis
Gene overrepresentation in biological process category:
| Log-likelihood per target | Total log-likelihood | Term | Description |
|---|---|---|---|
| 0.6 | 1.9 | GO:1900154 | regulation of bone trabecula formation(GO:1900154) negative regulation of bone trabecula formation(GO:1900155) |
| 0.4 | 2.5 | GO:0000720 | pyrimidine dimer repair by nucleotide-excision repair(GO:0000720) |
| 0.4 | 1.1 | GO:0046110 | xanthine metabolic process(GO:0046110) |
| 0.4 | 0.4 | GO:0035922 | pulmonary valve formation(GO:0003193) foramen ovale closure(GO:0035922) |
| 0.3 | 1.3 | GO:0051410 | detoxification of nitrogen compound(GO:0051410) cellular detoxification of nitrogen compound(GO:0070458) |
| 0.3 | 1.0 | GO:0072098 | intermediate mesoderm development(GO:0048389) pattern specification involved in mesonephros development(GO:0061227) anterior/posterior pattern specification involved in kidney development(GO:0072098) negative regulation of nephron tubule epithelial cell differentiation(GO:0072183) kidney smooth muscle tissue development(GO:0072194) negative regulation of epithelial cell differentiation involved in kidney development(GO:2000697) |
| 0.2 | 0.7 | GO:2001025 | positive regulation of response to drug(GO:2001025) |
| 0.2 | 0.7 | GO:0035720 | intraciliary anterograde transport(GO:0035720) |
| 0.2 | 0.9 | GO:1903182 | regulation of SUMO transferase activity(GO:1903182) positive regulation of SUMO transferase activity(GO:1903755) |
| 0.2 | 0.6 | GO:0046452 | dihydrofolate metabolic process(GO:0046452) |
| 0.2 | 1.5 | GO:1905123 | regulation of glucosylceramidase activity(GO:1905123) |
| 0.2 | 0.6 | GO:0019287 | isopentenyl diphosphate biosynthetic process, mevalonate pathway(GO:0019287) |
| 0.2 | 0.8 | GO:1904924 | negative regulation of mitophagy in response to mitochondrial depolarization(GO:1904924) |
| 0.2 | 0.5 | GO:1903400 | L-arginine transmembrane transport(GO:1903400) |
| 0.2 | 0.5 | GO:1904772 | hepatocyte homeostasis(GO:0036333) response to tetrachloromethane(GO:1904772) |
| 0.2 | 0.5 | GO:0006683 | galactosylceramide catabolic process(GO:0006683) |
| 0.2 | 0.5 | GO:0002339 | B cell selection(GO:0002339) positive regulation of apoptotic DNA fragmentation(GO:1902512) |
| 0.2 | 0.8 | GO:0071409 | cellular response to cycloheximide(GO:0071409) |
| 0.2 | 0.6 | GO:0097089 | methyl-branched fatty acid metabolic process(GO:0097089) |
| 0.2 | 0.3 | GO:0036146 | cellular response to mycotoxin(GO:0036146) |
| 0.2 | 0.5 | GO:0051877 | pigment granule aggregation in cell center(GO:0051877) |
| 0.1 | 1.2 | GO:0036072 | intramembranous ossification(GO:0001957) direct ossification(GO:0036072) |
| 0.1 | 0.6 | GO:0090071 | negative regulation of ribosome biogenesis(GO:0090071) |
| 0.1 | 0.4 | GO:0006045 | N-acetylglucosamine biosynthetic process(GO:0006045) glucosamine-containing compound biosynthetic process(GO:1901073) |
| 0.1 | 0.4 | GO:0006642 | triglyceride mobilization(GO:0006642) |
| 0.1 | 1.4 | GO:0019532 | oxalate transport(GO:0019532) |
| 0.1 | 0.5 | GO:0018282 | metal incorporation into metallo-sulfur cluster(GO:0018282) iron incorporation into metallo-sulfur cluster(GO:0018283) |
| 0.1 | 0.5 | GO:0086021 | SA node cell to atrial cardiac muscle cell communication by electrical coupling(GO:0086021) |
| 0.1 | 0.6 | GO:0010814 | substance P catabolic process(GO:0010814) calcitonin catabolic process(GO:0010816) endothelin maturation(GO:0034959) |
| 0.1 | 0.6 | GO:0070358 | actin polymerization-dependent cell motility(GO:0070358) |
| 0.1 | 0.4 | GO:1903294 | regulation of glutamate secretion, neurotransmission(GO:1903294) positive regulation of glutamate secretion, neurotransmission(GO:1903296) |
| 0.1 | 0.4 | GO:0051595 | response to methylglyoxal(GO:0051595) |
| 0.1 | 0.3 | GO:0099552 | trans-synaptic signaling by lipid, modulating synaptic transmission(GO:0099552) trans-synaptic signaling by endocannabinoid, modulating synaptic transmission(GO:0099553) |
| 0.1 | 0.3 | GO:1904457 | beta-glucoside metabolic process(GO:1901804) beta-glucoside catabolic process(GO:1901805) positive regulation of neuronal action potential(GO:1904457) |
| 0.1 | 0.4 | GO:0006550 | isoleucine catabolic process(GO:0006550) |
| 0.1 | 0.9 | GO:0051388 | positive regulation of neurotrophin TRK receptor signaling pathway(GO:0051388) |
| 0.1 | 0.4 | GO:0006172 | ADP biosynthetic process(GO:0006172) |
| 0.1 | 0.7 | GO:0046061 | dATP catabolic process(GO:0046061) |
| 0.1 | 0.6 | GO:0048861 | leukemia inhibitory factor signaling pathway(GO:0048861) |
| 0.1 | 0.3 | GO:0010808 | positive regulation of synaptic vesicle priming(GO:0010808) |
| 0.1 | 0.4 | GO:0032474 | otolith morphogenesis(GO:0032474) |
| 0.1 | 0.3 | GO:0014858 | negative regulation of hydrogen peroxide biosynthetic process(GO:0010730) positive regulation of skeletal muscle cell proliferation(GO:0014858) positive regulation of skeletal muscle satellite cell proliferation(GO:1902724) positive regulation of growth factor dependent skeletal muscle satellite cell proliferation(GO:1902728) |
| 0.1 | 0.4 | GO:0086097 | phospholipase C-activating angiotensin-activated signaling pathway(GO:0086097) |
| 0.1 | 0.5 | GO:0061083 | regulation of protein refolding(GO:0061083) negative regulation of protein refolding(GO:0061084) |
| 0.1 | 0.3 | GO:1901874 | negative regulation of post-translational protein modification(GO:1901874) |
| 0.1 | 0.3 | GO:0099404 | negative regulation of maintenance of sister chromatid cohesion(GO:0034092) negative regulation of maintenance of mitotic sister chromatid cohesion(GO:0034183) maintenance of mitotic sister chromatid cohesion, telomeric(GO:0099403) mitotic sister chromatid cohesion, telomeric(GO:0099404) regulation of maintenance of mitotic sister chromatid cohesion, telomeric(GO:1904907) negative regulation of maintenance of mitotic sister chromatid cohesion, telomeric(GO:1904908) |
| 0.1 | 0.4 | GO:0097056 | selenocysteinyl-tRNA(Sec) biosynthetic process(GO:0097056) |
| 0.1 | 0.4 | GO:2000051 | negative regulation of non-canonical Wnt signaling pathway(GO:2000051) |
| 0.1 | 0.3 | GO:1901301 | regulation of cargo loading into COPII-coated vesicle(GO:1901301) |
| 0.1 | 0.5 | GO:0046146 | tetrahydrobiopterin biosynthetic process(GO:0006729) tetrahydrobiopterin metabolic process(GO:0046146) |
| 0.1 | 1.1 | GO:0034465 | response to carbon monoxide(GO:0034465) |
| 0.1 | 0.3 | GO:0010387 | COP9 signalosome assembly(GO:0010387) |
| 0.1 | 0.3 | GO:0006542 | glutamine biosynthetic process(GO:0006542) |
| 0.1 | 0.3 | GO:1905000 | regulation of membrane repolarization during atrial cardiac muscle cell action potential(GO:1905000) |
| 0.1 | 0.2 | GO:0019878 | lysine biosynthetic process(GO:0009085) lysine biosynthetic process via aminoadipic acid(GO:0019878) |
| 0.1 | 0.2 | GO:1901491 | negative regulation of lymphangiogenesis(GO:1901491) |
| 0.1 | 1.0 | GO:0046600 | negative regulation of centriole replication(GO:0046600) |
| 0.1 | 0.3 | GO:0009440 | cyanate metabolic process(GO:0009439) cyanate catabolic process(GO:0009440) |
| 0.1 | 0.3 | GO:0009236 | cobalamin biosynthetic process(GO:0009236) |
| 0.1 | 0.3 | GO:0030047 | actin modification(GO:0030047) |
| 0.1 | 0.6 | GO:0038028 | insulin receptor signaling pathway via phosphatidylinositol 3-kinase(GO:0038028) |
| 0.1 | 0.7 | GO:0007598 | blood coagulation, extrinsic pathway(GO:0007598) |
| 0.1 | 0.4 | GO:0086100 | endothelin receptor signaling pathway(GO:0086100) |
| 0.1 | 1.8 | GO:0006646 | phosphatidylethanolamine biosynthetic process(GO:0006646) |
| 0.1 | 0.2 | GO:0098746 | fast, calcium ion-dependent exocytosis of neurotransmitter(GO:0098746) |
| 0.1 | 0.3 | GO:0046379 | extracellular polysaccharide biosynthetic process(GO:0045226) extracellular polysaccharide metabolic process(GO:0046379) |
| 0.1 | 0.5 | GO:1903593 | regulation of histamine secretion by mast cell(GO:1903593) |
| 0.1 | 0.5 | GO:1903300 | negative regulation of glucokinase activity(GO:0033132) negative regulation of hexokinase activity(GO:1903300) |
| 0.1 | 0.7 | GO:0060136 | embryonic process involved in female pregnancy(GO:0060136) |
| 0.1 | 0.3 | GO:0006617 | SRP-dependent cotranslational protein targeting to membrane, signal sequence recognition(GO:0006617) |
| 0.1 | 0.2 | GO:0001828 | inner cell mass cellular morphogenesis(GO:0001828) |
| 0.1 | 0.3 | GO:0003290 | atrial septum secundum morphogenesis(GO:0003290) |
| 0.1 | 0.3 | GO:0042450 | arginine biosynthetic process via ornithine(GO:0042450) |
| 0.1 | 0.8 | GO:0008635 | activation of cysteine-type endopeptidase activity involved in apoptotic process by cytochrome c(GO:0008635) |
| 0.1 | 0.2 | GO:1902905 | positive regulation of fibril organization(GO:1902905) |
| 0.1 | 0.2 | GO:0035674 | tricarboxylic acid transmembrane transport(GO:0035674) |
| 0.1 | 0.4 | GO:0006041 | glucosamine metabolic process(GO:0006041) |
| 0.1 | 0.5 | GO:0046726 | positive regulation by virus of viral protein levels in host cell(GO:0046726) |
| 0.1 | 0.4 | GO:2001033 | negative regulation of double-strand break repair via nonhomologous end joining(GO:2001033) |
| 0.1 | 0.1 | GO:1903516 | regulation of single strand break repair(GO:1903516) |
| 0.1 | 0.2 | GO:0036388 | pre-replicative complex assembly involved in nuclear cell cycle DNA replication(GO:0006267) pre-replicative complex assembly(GO:0036388) pre-replicative complex assembly involved in cell cycle DNA replication(GO:1902299) |
| 0.1 | 0.2 | GO:0031445 | regulation of heterochromatin assembly(GO:0031445) positive regulation of heterochromatin assembly(GO:0031453) |
| 0.1 | 0.6 | GO:2000189 | positive regulation of cholesterol homeostasis(GO:2000189) |
| 0.1 | 0.3 | GO:0044858 | plasma membrane raft distribution(GO:0044855) plasma membrane raft localization(GO:0044856) plasma membrane raft polarization(GO:0044858) regulation of plasma membrane raft polarization(GO:1903906) |
| 0.1 | 0.4 | GO:0046092 | deoxycytidine metabolic process(GO:0046092) |
| 0.1 | 0.3 | GO:0060800 | regulation of cell differentiation involved in embryonic placenta development(GO:0060800) |
| 0.1 | 0.2 | GO:0033567 | DNA replication, Okazaki fragment processing(GO:0033567) |
| 0.1 | 0.5 | GO:0045759 | negative regulation of action potential(GO:0045759) |
| 0.1 | 0.2 | GO:0050993 | dimethylallyl diphosphate biosynthetic process(GO:0050992) dimethylallyl diphosphate metabolic process(GO:0050993) |
| 0.1 | 0.1 | GO:2000374 | regulation of oxygen metabolic process(GO:2000374) |
| 0.1 | 0.4 | GO:0070278 | extracellular matrix constituent secretion(GO:0070278) |
| 0.1 | 0.2 | GO:0039534 | negative regulation of MDA-5 signaling pathway(GO:0039534) |
| 0.1 | 0.7 | GO:0048251 | elastic fiber assembly(GO:0048251) |
| 0.1 | 0.3 | GO:1902990 | mitotic telomere maintenance via semi-conservative replication(GO:1902990) |
| 0.1 | 0.3 | GO:0032487 | regulation of Rap protein signal transduction(GO:0032487) |
| 0.1 | 0.2 | GO:1990086 | lens fiber cell apoptotic process(GO:1990086) |
| 0.1 | 0.2 | GO:0016094 | polyprenol biosynthetic process(GO:0016094) |
| 0.1 | 0.2 | GO:0006679 | glucosylceramide biosynthetic process(GO:0006679) |
| 0.1 | 0.1 | GO:0021539 | subthalamus development(GO:0021539) |
| 0.1 | 0.3 | GO:0033490 | cholesterol biosynthetic process via desmosterol(GO:0033489) cholesterol biosynthetic process via lathosterol(GO:0033490) |
| 0.1 | 0.2 | GO:0006117 | acetaldehyde metabolic process(GO:0006117) |
| 0.1 | 0.5 | GO:1901164 | negative regulation of trophoblast cell migration(GO:1901164) |
| 0.1 | 0.3 | GO:0048318 | axial mesoderm development(GO:0048318) |
| 0.1 | 0.2 | GO:0036233 | glycine import(GO:0036233) |
| 0.1 | 0.2 | GO:0032290 | peripheral nervous system myelin formation(GO:0032290) |
| 0.1 | 0.3 | GO:0035811 | negative regulation of urine volume(GO:0035811) |
| 0.1 | 0.2 | GO:0006842 | tricarboxylic acid transport(GO:0006842) citrate transport(GO:0015746) |
| 0.0 | 0.1 | GO:0051793 | medium-chain fatty acid catabolic process(GO:0051793) |
| 0.0 | 0.5 | GO:2001300 | lipoxin metabolic process(GO:2001300) |
| 0.0 | 0.1 | GO:0014810 | positive regulation of skeletal muscle contraction by regulation of release of sequestered calcium ion(GO:0014810) |
| 0.0 | 0.3 | GO:0055005 | ventricular cardiac myofibril assembly(GO:0055005) |
| 0.0 | 0.5 | GO:0035524 | proline transmembrane transport(GO:0035524) |
| 0.0 | 0.9 | GO:0032310 | prostaglandin secretion(GO:0032310) |
| 0.0 | 0.6 | GO:2001013 | epithelial cell proliferation involved in renal tubule morphogenesis(GO:2001013) |
| 0.0 | 0.1 | GO:0042939 | glutathione transport(GO:0034635) tripeptide transport(GO:0042939) |
| 0.0 | 0.2 | GO:0016333 | morphogenesis of follicular epithelium(GO:0016333) establishment or maintenance of polarity of follicular epithelium(GO:0016334) establishment of planar polarity of follicular epithelium(GO:0042247) |
| 0.0 | 0.1 | GO:1903778 | protein localization to vacuolar membrane(GO:1903778) |
| 0.0 | 0.2 | GO:0044240 | multicellular organism lipid catabolic process(GO:0044240) |
| 0.0 | 0.1 | GO:0045957 | regulation of complement activation, alternative pathway(GO:0030451) negative regulation of complement activation, alternative pathway(GO:0045957) |
| 0.0 | 0.4 | GO:0048280 | vesicle fusion with Golgi apparatus(GO:0048280) |
| 0.0 | 0.9 | GO:0007175 | negative regulation of epidermal growth factor-activated receptor activity(GO:0007175) |
| 0.0 | 0.3 | GO:1901159 | glucuronate catabolic process(GO:0006064) glucuronate catabolic process to xylulose 5-phosphate(GO:0019640) L-ascorbic acid biosynthetic process(GO:0019853) xylulose 5-phosphate metabolic process(GO:0051167) xylulose 5-phosphate biosynthetic process(GO:1901159) |
| 0.0 | 0.7 | GO:0010991 | negative regulation of SMAD protein complex assembly(GO:0010991) |
| 0.0 | 0.1 | GO:0061075 | regulation of transcription from RNA polymerase II promoter involved in forebrain neuron fate commitment(GO:0021882) cerebral cortex GABAergic interneuron fate commitment(GO:0021893) positive regulation of neural retina development(GO:0061075) positive regulation of retina development in camera-type eye(GO:1902868) regulation of amacrine cell differentiation(GO:1902869) positive regulation of amacrine cell differentiation(GO:1902871) |
| 0.0 | 1.0 | GO:0070986 | left/right axis specification(GO:0070986) |
| 0.0 | 0.1 | GO:0070124 | mitochondrial translational initiation(GO:0070124) |
| 0.0 | 0.8 | GO:0031274 | positive regulation of pseudopodium assembly(GO:0031274) |
| 0.0 | 0.3 | GO:0006269 | DNA replication, synthesis of RNA primer(GO:0006269) |
| 0.0 | 0.2 | GO:0018032 | protein amidation(GO:0018032) |
| 0.0 | 0.1 | GO:0032712 | negative regulation of interleukin-3 production(GO:0032712) negative regulation of granulocyte colony-stimulating factor production(GO:0071656) negative regulation of macrophage colony-stimulating factor production(GO:1901257) |
| 0.0 | 0.5 | GO:0045144 | meiotic sister chromatid segregation(GO:0045144) |
| 0.0 | 0.3 | GO:0032962 | positive regulation of inositol trisphosphate biosynthetic process(GO:0032962) |
| 0.0 | 0.1 | GO:0006272 | leading strand elongation(GO:0006272) |
| 0.0 | 0.1 | GO:0009438 | methylglyoxal metabolic process(GO:0009438) |
| 0.0 | 0.2 | GO:0010587 | miRNA catabolic process(GO:0010587) |
| 0.0 | 0.2 | GO:0046946 | hydroxylysine metabolic process(GO:0046946) hydroxylysine biosynthetic process(GO:0046947) |
| 0.0 | 0.5 | GO:0060352 | cell adhesion molecule production(GO:0060352) |
| 0.0 | 0.2 | GO:1900169 | regulation of glucocorticoid mediated signaling pathway(GO:1900169) |
| 0.0 | 0.1 | GO:2001187 | positive regulation of CD8-positive, alpha-beta T cell proliferation(GO:2000566) positive regulation of CD8-positive, alpha-beta T cell activation(GO:2001187) |
| 0.0 | 0.3 | GO:2000825 | positive regulation of androgen receptor activity(GO:2000825) |
| 0.0 | 0.4 | GO:2000580 | regulation of ATP-dependent microtubule motor activity, plus-end-directed(GO:2000580) positive regulation of ATP-dependent microtubule motor activity, plus-end-directed(GO:2000582) |
| 0.0 | 0.4 | GO:1901552 | positive regulation of endothelial cell development(GO:1901552) positive regulation of establishment of endothelial barrier(GO:1903142) |
| 0.0 | 0.1 | GO:0050653 | chondroitin sulfate proteoglycan biosynthetic process, polysaccharide chain biosynthetic process(GO:0050653) |
| 0.0 | 0.5 | GO:0030043 | actin filament fragmentation(GO:0030043) |
| 0.0 | 0.6 | GO:0031163 | iron-sulfur cluster assembly(GO:0016226) metallo-sulfur cluster assembly(GO:0031163) |
| 0.0 | 0.5 | GO:0030091 | protein repair(GO:0030091) |
| 0.0 | 0.3 | GO:0006701 | progesterone biosynthetic process(GO:0006701) |
| 0.0 | 0.2 | GO:0034499 | late endosome to Golgi transport(GO:0034499) |
| 0.0 | 0.6 | GO:0001542 | ovulation from ovarian follicle(GO:0001542) |
| 0.0 | 0.6 | GO:0018214 | peptidyl-glutamic acid carboxylation(GO:0017187) protein carboxylation(GO:0018214) |
| 0.0 | 0.2 | GO:0019285 | glycine betaine biosynthetic process from choline(GO:0019285) glycine betaine metabolic process(GO:0031455) glycine betaine biosynthetic process(GO:0031456) |
| 0.0 | 0.1 | GO:0035759 | mesangial cell-matrix adhesion(GO:0035759) |
| 0.0 | 0.3 | GO:0045079 | negative regulation of chemokine biosynthetic process(GO:0045079) |
| 0.0 | 0.6 | GO:0040032 | post-embryonic body morphogenesis(GO:0040032) |
| 0.0 | 0.3 | GO:0070537 | histone H2A K63-linked deubiquitination(GO:0070537) |
| 0.0 | 0.1 | GO:0019520 | aldonic acid metabolic process(GO:0019520) D-gluconate metabolic process(GO:0019521) |
| 0.0 | 0.2 | GO:0006177 | GMP biosynthetic process(GO:0006177) |
| 0.0 | 0.1 | GO:0090234 | regulation of kinetochore assembly(GO:0090234) |
| 0.0 | 0.7 | GO:0030949 | positive regulation of vascular endothelial growth factor receptor signaling pathway(GO:0030949) |
| 0.0 | 0.2 | GO:0090598 | male genitalia morphogenesis(GO:0048808) male anatomical structure morphogenesis(GO:0090598) |
| 0.0 | 0.3 | GO:0000395 | mRNA 5'-splice site recognition(GO:0000395) |
| 0.0 | 0.3 | GO:0006659 | phosphatidylserine biosynthetic process(GO:0006659) |
| 0.0 | 0.3 | GO:2001032 | regulation of double-strand break repair via nonhomologous end joining(GO:2001032) |
| 0.0 | 0.2 | GO:0051643 | endoplasmic reticulum localization(GO:0051643) |
| 0.0 | 0.1 | GO:0070093 | negative regulation of glucagon secretion(GO:0070093) |
| 0.0 | 0.1 | GO:0000710 | meiotic mismatch repair(GO:0000710) |
| 0.0 | 0.3 | GO:0002051 | osteoblast fate commitment(GO:0002051) |
| 0.0 | 0.2 | GO:0014053 | negative regulation of gamma-aminobutyric acid secretion(GO:0014053) aspartate secretion(GO:0061528) regulation of aspartate secretion(GO:1904448) positive regulation of aspartate secretion(GO:1904450) |
| 0.0 | 0.6 | GO:0007288 | sperm axoneme assembly(GO:0007288) |
| 0.0 | 0.1 | GO:0006212 | uracil catabolic process(GO:0006212) |
| 0.0 | 0.1 | GO:0006556 | S-adenosylmethionine biosynthetic process(GO:0006556) |
| 0.0 | 0.1 | GO:0045653 | negative regulation of megakaryocyte differentiation(GO:0045653) |
| 0.0 | 0.4 | GO:0036444 | calcium ion transmembrane import into mitochondrion(GO:0036444) |
| 0.0 | 0.1 | GO:0006616 | SRP-dependent cotranslational protein targeting to membrane, translocation(GO:0006616) |
| 0.0 | 0.5 | GO:0008090 | retrograde axonal transport(GO:0008090) |
| 0.0 | 0.4 | GO:0070307 | lens fiber cell development(GO:0070307) |
| 0.0 | 0.1 | GO:0097676 | histone H3-K36 dimethylation(GO:0097676) |
| 0.0 | 0.1 | GO:0008272 | sulfate transport(GO:0008272) |
| 0.0 | 1.0 | GO:0030208 | dermatan sulfate biosynthetic process(GO:0030208) |
| 0.0 | 0.2 | GO:0006420 | arginyl-tRNA aminoacylation(GO:0006420) |
| 0.0 | 0.3 | GO:0048102 | autophagic cell death(GO:0048102) |
| 0.0 | 0.3 | GO:2000124 | regulation of endocannabinoid signaling pathway(GO:2000124) |
| 0.0 | 0.2 | GO:0060158 | phospholipase C-activating dopamine receptor signaling pathway(GO:0060158) |
| 0.0 | 0.1 | GO:0038178 | complement component C5a signaling pathway(GO:0038178) |
| 0.0 | 0.5 | GO:0071372 | cellular response to follicle-stimulating hormone stimulus(GO:0071372) |
| 0.0 | 0.6 | GO:2000480 | negative regulation of cAMP-dependent protein kinase activity(GO:2000480) |
| 0.0 | 0.2 | GO:2000324 | positive regulation of glucocorticoid receptor signaling pathway(GO:2000324) |
| 0.0 | 0.0 | GO:0061443 | endocardial cushion cell differentiation(GO:0061443) |
| 0.0 | 0.4 | GO:0031848 | protection from non-homologous end joining at telomere(GO:0031848) |
| 0.0 | 0.1 | GO:0021943 | formation of radial glial scaffolds(GO:0021943) |
| 0.0 | 0.1 | GO:0035963 | cellular response to interleukin-13(GO:0035963) |
| 0.0 | 0.7 | GO:0033540 | fatty acid beta-oxidation using acyl-CoA oxidase(GO:0033540) |
| 0.0 | 0.1 | GO:0019303 | D-ribose catabolic process(GO:0019303) |
| 0.0 | 0.1 | GO:1903070 | negative regulation of ER-associated ubiquitin-dependent protein catabolic process(GO:1903070) |
| 0.0 | 0.2 | GO:0006651 | diacylglycerol biosynthetic process(GO:0006651) |
| 0.0 | 0.3 | GO:0090267 | positive regulation of mitotic cell cycle spindle assembly checkpoint(GO:0090267) |
| 0.0 | 0.8 | GO:0034162 | toll-like receptor 9 signaling pathway(GO:0034162) |
| 0.0 | 0.1 | GO:0033386 | geranylgeranyl diphosphate metabolic process(GO:0033385) geranylgeranyl diphosphate biosynthetic process(GO:0033386) |
| 0.0 | 0.4 | GO:0060315 | negative regulation of ryanodine-sensitive calcium-release channel activity(GO:0060315) |
| 0.0 | 0.2 | GO:0051490 | negative regulation of filopodium assembly(GO:0051490) |
| 0.0 | 0.2 | GO:0009048 | dosage compensation(GO:0007549) dosage compensation by inactivation of X chromosome(GO:0009048) |
| 0.0 | 0.2 | GO:0010626 | regulation of Schwann cell proliferation(GO:0010624) negative regulation of Schwann cell proliferation(GO:0010626) |
| 0.0 | 0.1 | GO:0044878 | mitotic cytokinesis checkpoint(GO:0044878) |
| 0.0 | 0.1 | GO:0002949 | tRNA threonylcarbamoyladenosine modification(GO:0002949) |
| 0.0 | 0.6 | GO:0035493 | SNARE complex assembly(GO:0035493) |
| 0.0 | 0.3 | GO:0043985 | histone H4-R3 methylation(GO:0043985) |
| 0.0 | 0.3 | GO:1903943 | regulation of hepatocyte apoptotic process(GO:1903943) negative regulation of hepatocyte apoptotic process(GO:1903944) |
| 0.0 | 0.5 | GO:0090136 | epithelial cell-cell adhesion(GO:0090136) |
| 0.0 | 0.2 | GO:1904058 | positive regulation of sensory perception of pain(GO:1904058) |
| 0.0 | 0.1 | GO:0043328 | protein targeting to vacuole involved in ubiquitin-dependent protein catabolic process via the multivesicular body sorting pathway(GO:0043328) |
| 0.0 | 0.2 | GO:0042796 | snRNA transcription from RNA polymerase III promoter(GO:0042796) |
| 0.0 | 0.5 | GO:0070934 | CRD-mediated mRNA stabilization(GO:0070934) |
| 0.0 | 0.1 | GO:0030070 | insulin processing(GO:0030070) |
| 0.0 | 0.1 | GO:1900126 | negative regulation of hyaluronan biosynthetic process(GO:1900126) |
| 0.0 | 0.1 | GO:2000111 | positive regulation of macrophage apoptotic process(GO:2000111) |
| 0.0 | 0.2 | GO:0044791 | modulation by host of viral release from host cell(GO:0044789) positive regulation by host of viral release from host cell(GO:0044791) |
| 0.0 | 0.2 | GO:0090235 | regulation of metaphase plate congression(GO:0090235) |
| 0.0 | 0.1 | GO:1901376 | mycotoxin metabolic process(GO:0043385) aflatoxin metabolic process(GO:0046222) organic heteropentacyclic compound metabolic process(GO:1901376) |
| 0.0 | 0.2 | GO:1901529 | positive regulation of anion channel activity(GO:1901529) |
| 0.0 | 0.1 | GO:1902309 | negative regulation of peptidyl-serine dephosphorylation(GO:1902309) |
| 0.0 | 0.4 | GO:0006600 | creatine metabolic process(GO:0006600) |
| 0.0 | 0.1 | GO:0060729 | intestinal epithelial structure maintenance(GO:0060729) |
| 0.0 | 0.1 | GO:0045819 | positive regulation of glycogen catabolic process(GO:0045819) |
| 0.0 | 0.3 | GO:0042998 | positive regulation of Golgi to plasma membrane protein transport(GO:0042998) |
| 0.0 | 0.1 | GO:0051660 | establishment of centrosome localization(GO:0051660) |
| 0.0 | 1.2 | GO:0040036 | regulation of fibroblast growth factor receptor signaling pathway(GO:0040036) |
| 0.0 | 0.1 | GO:0061047 | foregut regionalization(GO:0060423) lung field specification(GO:0060424) lung induction(GO:0060492) positive regulation of branching involved in lung morphogenesis(GO:0061047) |
| 0.0 | 0.1 | GO:1903644 | regulation of chaperone-mediated protein folding(GO:1903644) |
| 0.0 | 0.2 | GO:0043456 | regulation of pentose-phosphate shunt(GO:0043456) |
| 0.0 | 0.2 | GO:0019509 | L-methionine biosynthetic process from methylthioadenosine(GO:0019509) |
| 0.0 | 0.2 | GO:0051684 | maintenance of Golgi location(GO:0051684) |
| 0.0 | 0.1 | GO:0060398 | regulation of growth hormone receptor signaling pathway(GO:0060398) |
| 0.0 | 0.3 | GO:0021877 | forebrain neuron fate commitment(GO:0021877) |
| 0.0 | 0.1 | GO:1904579 | response to thapsigargin(GO:1904578) cellular response to thapsigargin(GO:1904579) response to hypobaric hypoxia(GO:1990910) |
| 0.0 | 0.3 | GO:0010756 | positive regulation of plasminogen activation(GO:0010756) |
| 0.0 | 0.1 | GO:0030718 | germ-line stem cell population maintenance(GO:0030718) |
| 0.0 | 0.1 | GO:0052651 | monoacylglycerol metabolic process(GO:0046462) monoacylglycerol catabolic process(GO:0052651) |
| 0.0 | 0.6 | GO:0032201 | telomere maintenance via semi-conservative replication(GO:0032201) |
| 0.0 | 1.0 | GO:0034243 | regulation of transcription elongation from RNA polymerase II promoter(GO:0034243) |
| 0.0 | 0.2 | GO:0000389 | mRNA 3'-splice site recognition(GO:0000389) |
| 0.0 | 0.3 | GO:0006048 | UDP-N-acetylglucosamine biosynthetic process(GO:0006048) amino sugar biosynthetic process(GO:0046349) |
| 0.0 | 0.1 | GO:0017185 | peptidyl-lysine hydroxylation(GO:0017185) |
| 0.0 | 0.1 | GO:0070901 | mitochondrial tRNA methylation(GO:0070901) |
| 0.0 | 0.2 | GO:0032100 | positive regulation of response to food(GO:0032097) positive regulation of appetite(GO:0032100) |
| 0.0 | 0.1 | GO:0048250 | mitochondrial iron ion transport(GO:0048250) |
| 0.0 | 0.1 | GO:0060501 | positive regulation of epithelial cell proliferation involved in lung morphogenesis(GO:0060501) |
| 0.0 | 0.1 | GO:0021707 | cerebellar granular layer formation(GO:0021684) cerebellar granule cell differentiation(GO:0021707) |
| 0.0 | 1.5 | GO:0010718 | positive regulation of epithelial to mesenchymal transition(GO:0010718) |
| 0.0 | 0.3 | GO:0042182 | ketone catabolic process(GO:0042182) |
| 0.0 | 0.1 | GO:0060762 | regulation of branching involved in mammary gland duct morphogenesis(GO:0060762) |
| 0.0 | 0.4 | GO:2000675 | negative regulation of type B pancreatic cell apoptotic process(GO:2000675) |
| 0.0 | 0.1 | GO:0072272 | proximal/distal pattern formation involved in metanephric nephron development(GO:0072272) |
| 0.0 | 0.1 | GO:0071494 | positive regulation of translational initiation in response to stress(GO:0032058) cellular response to UV-C(GO:0071494) |
| 0.0 | 0.1 | GO:0007089 | traversing start control point of mitotic cell cycle(GO:0007089) |
| 0.0 | 0.1 | GO:0033387 | putrescine biosynthetic process from ornithine(GO:0033387) |
| 0.0 | 0.3 | GO:0015727 | lactate transport(GO:0015727) lactate transmembrane transport(GO:0035873) |
| 0.0 | 0.1 | GO:0072674 | multinuclear osteoclast differentiation(GO:0072674) osteoclast fusion(GO:0072675) |
| 0.0 | 0.1 | GO:0035552 | oxidative single-stranded DNA demethylation(GO:0035552) |
| 0.0 | 0.1 | GO:0032804 | negative regulation of low-density lipoprotein particle receptor catabolic process(GO:0032804) |
| 0.0 | 0.1 | GO:0032916 | positive regulation of transforming growth factor beta3 production(GO:0032916) |
| 0.0 | 0.4 | GO:0019614 | catechol-containing compound catabolic process(GO:0019614) catecholamine catabolic process(GO:0042424) |
| 0.0 | 0.2 | GO:0035694 | mitochondrial protein catabolic process(GO:0035694) |
| 0.0 | 0.1 | GO:0002036 | regulation of L-glutamate transport(GO:0002036) |
| 0.0 | 0.3 | GO:0017182 | peptidyl-diphthamide metabolic process(GO:0017182) peptidyl-diphthamide biosynthetic process from peptidyl-histidine(GO:0017183) |
| 0.0 | 0.3 | GO:0036109 | alpha-linolenic acid metabolic process(GO:0036109) |
| 0.0 | 0.0 | GO:0072172 | mesonephric tubule formation(GO:0072172) |
| 0.0 | 0.1 | GO:0046338 | phosphatidylethanolamine catabolic process(GO:0046338) |
| 0.0 | 0.2 | GO:1902857 | positive regulation of nonmotile primary cilium assembly(GO:1902857) |
| 0.0 | 0.1 | GO:0032377 | regulation of intracellular lipid transport(GO:0032377) regulation of intracellular sterol transport(GO:0032380) regulation of intracellular cholesterol transport(GO:0032383) |
| 0.0 | 0.4 | GO:0007289 | spermatid nucleus differentiation(GO:0007289) |
| 0.0 | 0.1 | GO:2001076 | regulation of metanephric ureteric bud development(GO:2001074) positive regulation of metanephric ureteric bud development(GO:2001076) |
| 0.0 | 0.2 | GO:0006102 | isocitrate metabolic process(GO:0006102) |
| 0.0 | 0.2 | GO:0072592 | oxygen metabolic process(GO:0072592) |
| 0.0 | 0.1 | GO:0098923 | retrograde trans-synaptic signaling by soluble gas(GO:0098923) trans-synaptic signaling by soluble gas(GO:0099543) |
| 0.0 | 0.1 | GO:0019626 | short-chain fatty acid catabolic process(GO:0019626) |
| 0.0 | 0.4 | GO:0000076 | DNA replication checkpoint(GO:0000076) |
| 0.0 | 0.3 | GO:0070914 | UV-damage excision repair(GO:0070914) |
| 0.0 | 0.4 | GO:0000022 | mitotic spindle elongation(GO:0000022) spindle elongation(GO:0051231) |
| 0.0 | 0.1 | GO:1904977 | lymphatic endothelial cell migration(GO:1904977) |
| 0.0 | 0.1 | GO:0035606 | peptidyl-cysteine S-trans-nitrosylation(GO:0035606) |
| 0.0 | 0.1 | GO:0034091 | regulation of maintenance of sister chromatid cohesion(GO:0034091) regulation of maintenance of mitotic sister chromatid cohesion(GO:0034182) |
| 0.0 | 0.3 | GO:0048227 | plasma membrane to endosome transport(GO:0048227) |
| 0.0 | 0.1 | GO:1901899 | positive regulation of relaxation of cardiac muscle(GO:1901899) |
| 0.0 | 0.1 | GO:0042415 | norepinephrine metabolic process(GO:0042415) |
| 0.0 | 0.3 | GO:0060155 | platelet dense granule organization(GO:0060155) |
| 0.0 | 0.1 | GO:1901355 | response to rapamycin(GO:1901355) |
| 0.0 | 0.6 | GO:0009083 | branched-chain amino acid catabolic process(GO:0009083) |
| 0.0 | 0.7 | GO:0031290 | retinal ganglion cell axon guidance(GO:0031290) |
| 0.0 | 0.1 | GO:0046080 | dUTP metabolic process(GO:0046080) dUTP catabolic process(GO:0046081) |
| 0.0 | 0.1 | GO:1902513 | regulation of organelle transport along microtubule(GO:1902513) |
| 0.0 | 0.3 | GO:0060712 | spongiotrophoblast layer development(GO:0060712) |
| 0.0 | 0.1 | GO:0090073 | positive regulation of protein homodimerization activity(GO:0090073) |
| 0.0 | 0.1 | GO:2000601 | positive regulation of Arp2/3 complex-mediated actin nucleation(GO:2000601) |
| 0.0 | 0.1 | GO:0071418 | cellular response to amine stimulus(GO:0071418) |
| 0.0 | 0.3 | GO:0051715 | cytolysis in other organism(GO:0051715) |
| 0.0 | 0.1 | GO:0097368 | establishment of Sertoli cell barrier(GO:0097368) |
| 0.0 | 0.1 | GO:2000690 | negative regulation of cardioblast differentiation(GO:0051892) regulation of cardiac muscle cell myoblast differentiation(GO:2000690) negative regulation of cardiac muscle cell myoblast differentiation(GO:2000691) |
| 0.0 | 0.1 | GO:1902809 | regulation of skeletal muscle fiber differentiation(GO:1902809) |
| 0.0 | 0.2 | GO:0045647 | negative regulation of erythrocyte differentiation(GO:0045647) |
| 0.0 | 0.0 | GO:0019482 | beta-alanine metabolic process(GO:0019482) |
| 0.0 | 0.2 | GO:0030638 | polyketide metabolic process(GO:0030638) daunorubicin metabolic process(GO:0044597) doxorubicin metabolic process(GO:0044598) |
| 0.0 | 0.1 | GO:0016480 | negative regulation of transcription from RNA polymerase III promoter(GO:0016480) |
| 0.0 | 0.1 | GO:2000583 | regulation of platelet-derived growth factor receptor-alpha signaling pathway(GO:2000583) negative regulation of platelet-derived growth factor receptor-alpha signaling pathway(GO:2000584) |
| 0.0 | 0.1 | GO:0006127 | glycerophosphate shuttle(GO:0006127) |
| 0.0 | 0.1 | GO:0046900 | tetrahydrofolylpolyglutamate metabolic process(GO:0046900) |
| 0.0 | 1.3 | GO:0006120 | mitochondrial electron transport, NADH to ubiquinone(GO:0006120) |
| 0.0 | 0.2 | GO:0045198 | establishment of epithelial cell apical/basal polarity(GO:0045198) |
| 0.0 | 0.1 | GO:0021940 | positive regulation of cerebellar granule cell precursor proliferation(GO:0021940) |
| 0.0 | 0.1 | GO:0098974 | postsynaptic actin cytoskeleton organization(GO:0098974) |
| 0.0 | 0.1 | GO:0061009 | common bile duct development(GO:0061009) |
| 0.0 | 0.5 | GO:0010586 | miRNA metabolic process(GO:0010586) |
| 0.0 | 0.2 | GO:0033234 | negative regulation of protein sumoylation(GO:0033234) |
| 0.0 | 0.2 | GO:0032927 | positive regulation of activin receptor signaling pathway(GO:0032927) |
| 0.0 | 0.1 | GO:0034316 | negative regulation of Arp2/3 complex-mediated actin nucleation(GO:0034316) |
| 0.0 | 0.0 | GO:0072434 | signal transduction involved in G2 DNA damage checkpoint(GO:0072425) signal transduction involved in mitotic G2 DNA damage checkpoint(GO:0072434) |
| 0.0 | 0.3 | GO:0051531 | NFAT protein import into nucleus(GO:0051531) |
| 0.0 | 0.1 | GO:0003431 | growth plate cartilage chondrocyte development(GO:0003431) |
| 0.0 | 0.2 | GO:0010499 | proteasomal ubiquitin-independent protein catabolic process(GO:0010499) |
| 0.0 | 0.5 | GO:0071380 | cellular response to prostaglandin E stimulus(GO:0071380) |
| 0.0 | 0.2 | GO:0006265 | DNA topological change(GO:0006265) |
| 0.0 | 0.1 | GO:1904354 | negative regulation of telomere capping(GO:1904354) |
| 0.0 | 0.3 | GO:0048304 | positive regulation of isotype switching to IgG isotypes(GO:0048304) |
| 0.0 | 0.2 | GO:0060413 | atrial septum morphogenesis(GO:0060413) |
| 0.0 | 0.1 | GO:1902525 | regulation of protein monoubiquitination(GO:1902525) |
| 0.0 | 0.1 | GO:2000270 | negative regulation of fibroblast apoptotic process(GO:2000270) |
| 0.0 | 0.0 | GO:1901895 | negative regulation of calcium-transporting ATPase activity(GO:1901895) |
| 0.0 | 0.1 | GO:0045351 | type I interferon biosynthetic process(GO:0045351) |
| 0.0 | 0.1 | GO:0048254 | snoRNA localization(GO:0048254) |
| 0.0 | 0.0 | GO:1902524 | positive regulation of protein K48-linked ubiquitination(GO:1902524) |
| 0.0 | 0.1 | GO:0003199 | endocardial cushion to mesenchymal transition involved in heart valve formation(GO:0003199) |
| 0.0 | 0.1 | GO:1900748 | positive regulation of vascular endothelial growth factor signaling pathway(GO:1900748) |
| 0.0 | 0.1 | GO:0045829 | negative regulation of isotype switching(GO:0045829) |
| 0.0 | 0.1 | GO:0043570 | maintenance of DNA repeat elements(GO:0043570) |
| 0.0 | 0.2 | GO:0001675 | acrosome assembly(GO:0001675) |
| 0.0 | 0.6 | GO:2000144 | positive regulation of DNA-templated transcription, initiation(GO:2000144) |
| 0.0 | 0.1 | GO:0035511 | oxidative DNA demethylation(GO:0035511) |
| 0.0 | 0.0 | GO:0031296 | B cell costimulation(GO:0031296) |
| 0.0 | 0.1 | GO:0042427 | serotonin biosynthetic process(GO:0042427) |
| 0.0 | 0.1 | GO:0030432 | peristalsis(GO:0030432) |
| 0.0 | 0.1 | GO:0070474 | positive regulation of uterine smooth muscle contraction(GO:0070474) |
| 0.0 | 0.5 | GO:0000470 | maturation of LSU-rRNA(GO:0000470) |
| 0.0 | 0.1 | GO:1902669 | positive regulation of axon guidance(GO:1902669) |
| 0.0 | 0.1 | GO:2001137 | positive regulation of endocytic recycling(GO:2001137) |
| 0.0 | 0.2 | GO:0006537 | glutamate biosynthetic process(GO:0006537) |
| 0.0 | 0.9 | GO:0000413 | protein peptidyl-prolyl isomerization(GO:0000413) |
| 0.0 | 0.2 | GO:0000717 | nucleotide-excision repair, DNA duplex unwinding(GO:0000717) |
| 0.0 | 0.9 | GO:0006635 | fatty acid beta-oxidation(GO:0006635) |
| 0.0 | 0.2 | GO:0043152 | induction of bacterial agglutination(GO:0043152) |
| 0.0 | 0.1 | GO:2000774 | positive regulation of cellular senescence(GO:2000774) |
| 0.0 | 0.1 | GO:0009447 | putrescine catabolic process(GO:0009447) |
| 0.0 | 0.2 | GO:0007252 | I-kappaB phosphorylation(GO:0007252) |
| 0.0 | 0.2 | GO:0032020 | ISG15-protein conjugation(GO:0032020) |
| 0.0 | 0.8 | GO:0097120 | receptor localization to synapse(GO:0097120) |
| 0.0 | 0.4 | GO:0060292 | long term synaptic depression(GO:0060292) |
| 0.0 | 0.1 | GO:0031914 | negative regulation of synaptic plasticity(GO:0031914) |
| 0.0 | 0.6 | GO:0009435 | NAD biosynthetic process(GO:0009435) |
| 0.0 | 0.0 | GO:0071047 | U1 snRNA 3'-end processing(GO:0034473) U5 snRNA 3'-end processing(GO:0034476) nuclear polyadenylation-dependent mRNA catabolic process(GO:0071042) polyadenylation-dependent mRNA catabolic process(GO:0071047) |
| 0.0 | 0.4 | GO:2001044 | regulation of integrin-mediated signaling pathway(GO:2001044) |
| 0.0 | 0.1 | GO:1990592 | protein polyufmylation(GO:1990564) protein K69-linked ufmylation(GO:1990592) |
| 0.0 | 0.1 | GO:0044565 | dendritic cell proliferation(GO:0044565) |
| 0.0 | 0.0 | GO:0007183 | SMAD protein complex assembly(GO:0007183) |
| 0.0 | 0.0 | GO:0003050 | regulation of systemic arterial blood pressure by atrial natriuretic peptide(GO:0003050) |
| 0.0 | 0.2 | GO:0000244 | spliceosomal tri-snRNP complex assembly(GO:0000244) |
| 0.0 | 0.0 | GO:0031064 | negative regulation of histone deacetylation(GO:0031064) |
| 0.0 | 0.0 | GO:0090649 | response to oxygen-glucose deprivation(GO:0090649) cellular response to oxygen-glucose deprivation(GO:0090650) |
| 0.0 | 0.1 | GO:0097350 | neutrophil clearance(GO:0097350) |
| 0.0 | 0.3 | GO:0042769 | DNA damage response, detection of DNA damage(GO:0042769) |
| 0.0 | 0.0 | GO:0046642 | negative regulation of alpha-beta T cell proliferation(GO:0046642) |
| 0.0 | 0.3 | GO:0043584 | nose development(GO:0043584) |
| 0.0 | 0.1 | GO:0071316 | cellular response to nicotine(GO:0071316) |
| 0.0 | 0.2 | GO:0051969 | regulation of transmission of nerve impulse(GO:0051969) |
| 0.0 | 0.1 | GO:0036123 | histone H3-K9 dimethylation(GO:0036123) |
| 0.0 | 0.2 | GO:0071550 | death-inducing signaling complex assembly(GO:0071550) |
| 0.0 | 0.1 | GO:0021533 | cell differentiation in hindbrain(GO:0021533) cerebellar Purkinje cell layer formation(GO:0021694) cerebellar Purkinje cell differentiation(GO:0021702) |
| 0.0 | 0.1 | GO:0048484 | enteric nervous system development(GO:0048484) |
| 0.0 | 0.2 | GO:0043248 | proteasome assembly(GO:0043248) |
| 0.0 | 0.4 | GO:0007638 | mechanosensory behavior(GO:0007638) |
| 0.0 | 0.2 | GO:0042574 | retinal metabolic process(GO:0042574) |
| 0.0 | 0.4 | GO:2000369 | regulation of clathrin-mediated endocytosis(GO:2000369) |
| 0.0 | 0.0 | GO:0090027 | negative regulation of monocyte chemotaxis(GO:0090027) |
| 0.0 | 0.1 | GO:2000660 | negative regulation of interleukin-1-mediated signaling pathway(GO:2000660) |
| 0.0 | 0.1 | GO:0030961 | peptidyl-arginine hydroxylation(GO:0030961) |
| 0.0 | 0.1 | GO:0035407 | histone H3-T11 phosphorylation(GO:0035407) |
| 0.0 | 0.0 | GO:0090038 | negative regulation of protein kinase C signaling(GO:0090038) |
| 0.0 | 0.4 | GO:0043046 | DNA methylation involved in gamete generation(GO:0043046) |
| 0.0 | 0.2 | GO:0051770 | positive regulation of nitric-oxide synthase biosynthetic process(GO:0051770) |
| 0.0 | 0.2 | GO:0030277 | maintenance of gastrointestinal epithelium(GO:0030277) |
| 0.0 | 0.3 | GO:0043162 | ubiquitin-dependent protein catabolic process via the multivesicular body sorting pathway(GO:0043162) |
| 0.0 | 0.0 | GO:0032747 | positive regulation of interleukin-23 production(GO:0032747) |
| 0.0 | 0.2 | GO:0007076 | mitotic chromosome condensation(GO:0007076) |
| 0.0 | 0.2 | GO:0034498 | early endosome to Golgi transport(GO:0034498) |
| 0.0 | 0.4 | GO:0006308 | DNA catabolic process(GO:0006308) |
| 0.0 | 1.1 | GO:0071277 | cellular response to calcium ion(GO:0071277) |
| 0.0 | 0.2 | GO:0010992 | ubiquitin homeostasis(GO:0010992) |
| 0.0 | 0.2 | GO:0090385 | phagosome-lysosome fusion(GO:0090385) |
| 0.0 | 0.1 | GO:0060754 | positive regulation of mast cell chemotaxis(GO:0060754) |
| 0.0 | 0.2 | GO:0018298 | protein-chromophore linkage(GO:0018298) |
| 0.0 | 0.2 | GO:0071803 | positive regulation of podosome assembly(GO:0071803) |
| 0.0 | 0.4 | GO:0034035 | purine ribonucleoside bisphosphate metabolic process(GO:0034035) 3'-phosphoadenosine 5'-phosphosulfate metabolic process(GO:0050427) |
| 0.0 | 0.2 | GO:0016576 | histone dephosphorylation(GO:0016576) |
| 0.0 | 0.1 | GO:0001672 | regulation of chromatin assembly or disassembly(GO:0001672) |
| 0.0 | 0.2 | GO:0060180 | female mating behavior(GO:0060180) |
| 0.0 | 0.1 | GO:0090110 | cargo loading into COPII-coated vesicle(GO:0090110) |
| 0.0 | 0.0 | GO:0009838 | abscission(GO:0009838) |
| 0.0 | 0.4 | GO:0045947 | negative regulation of translational initiation(GO:0045947) |
| 0.0 | 0.1 | GO:0032534 | regulation of microvillus assembly(GO:0032534) |
| 0.0 | 0.3 | GO:0048240 | sperm capacitation(GO:0048240) |
| 0.0 | 1.2 | GO:1902036 | regulation of hematopoietic stem cell differentiation(GO:1902036) |
| 0.0 | 0.2 | GO:0015871 | choline transport(GO:0015871) |
| 0.0 | 0.2 | GO:0010869 | regulation of receptor biosynthetic process(GO:0010869) |
| 0.0 | 0.0 | GO:0031340 | positive regulation of vesicle fusion(GO:0031340) |
| 0.0 | 0.1 | GO:0060628 | regulation of ER to Golgi vesicle-mediated transport(GO:0060628) |
| 0.0 | 0.1 | GO:0035617 | stress granule disassembly(GO:0035617) |
| 0.0 | 0.2 | GO:0006451 | selenocysteine incorporation(GO:0001514) translational readthrough(GO:0006451) |
| 0.0 | 0.0 | GO:0021526 | medial motor column neuron differentiation(GO:0021526) |
| 0.0 | 0.2 | GO:0019371 | cyclooxygenase pathway(GO:0019371) |
| 0.0 | 0.3 | GO:0060384 | innervation(GO:0060384) |
| 0.0 | 0.0 | GO:1901857 | positive regulation of cellular respiration(GO:1901857) |
| 0.0 | 0.1 | GO:0060394 | negative regulation of pathway-restricted SMAD protein phosphorylation(GO:0060394) |
| 0.0 | 0.5 | GO:0060976 | coronary vasculature development(GO:0060976) |
| 0.0 | 0.0 | GO:0002638 | negative regulation of immunoglobulin production(GO:0002638) |
| 0.0 | 0.0 | GO:0070317 | negative regulation of G0 to G1 transition(GO:0070317) |
| 0.0 | 0.4 | GO:0032012 | regulation of ARF protein signal transduction(GO:0032012) |
| 0.0 | 0.0 | GO:0018012 | N-terminal protein amino acid methylation(GO:0006480) N-terminal peptidyl-alanine methylation(GO:0018011) N-terminal peptidyl-alanine trimethylation(GO:0018012) N-terminal peptidyl-glycine methylation(GO:0018013) N-terminal peptidyl-proline dimethylation(GO:0018016) peptidyl-alanine modification(GO:0018194) N-terminal peptidyl-proline methylation(GO:0035568) N-terminal peptidyl-serine methylation(GO:0035570) N-terminal peptidyl-serine dimethylation(GO:0035572) N-terminal peptidyl-serine trimethylation(GO:0035573) |
| 0.0 | 0.1 | GO:0035610 | protein side chain deglutamylation(GO:0035610) |
| 0.0 | 0.1 | GO:0035646 | endosome to melanosome transport(GO:0035646) endosome to pigment granule transport(GO:0043485) pigment granule maturation(GO:0048757) |
| 0.0 | 0.0 | GO:0036079 | GDP-fucose transport(GO:0015783) purine nucleotide-sugar transport(GO:0036079) |
| 0.0 | 0.2 | GO:0015684 | ferrous iron transport(GO:0015684) ferrous iron transmembrane transport(GO:1903874) |
| 0.0 | 0.1 | GO:0010310 | regulation of hydrogen peroxide metabolic process(GO:0010310) |
| 0.0 | 0.1 | GO:1900226 | negative regulation of NLRP3 inflammasome complex assembly(GO:1900226) |
| 0.0 | 1.3 | GO:1905039 | carboxylic acid transmembrane transport(GO:1905039) |
| 0.0 | 0.0 | GO:2000847 | negative regulation of cortisol secretion(GO:0051463) negative regulation of steroid hormone secretion(GO:2000832) negative regulation of corticosteroid hormone secretion(GO:2000847) negative regulation of glucocorticoid secretion(GO:2000850) |
| 0.0 | 0.1 | GO:0035331 | negative regulation of hippo signaling(GO:0035331) |
| 0.0 | 0.1 | GO:0048069 | eye pigmentation(GO:0048069) |
| 0.0 | 0.1 | GO:0003417 | growth plate cartilage development(GO:0003417) |
| 0.0 | 0.1 | GO:0097646 | calcitonin family receptor signaling pathway(GO:0097646) amylin receptor signaling pathway(GO:0097647) |
| 0.0 | 0.1 | GO:0035886 | vascular smooth muscle cell differentiation(GO:0035886) |
| 0.0 | 0.2 | GO:0034975 | protein folding in endoplasmic reticulum(GO:0034975) |
| 0.0 | 0.5 | GO:0043171 | peptide catabolic process(GO:0043171) |
| 0.0 | 0.1 | GO:0051601 | exocyst localization(GO:0051601) |
| 0.0 | 0.3 | GO:1901685 | glutathione derivative metabolic process(GO:1901685) glutathione derivative biosynthetic process(GO:1901687) |
| 0.0 | 0.4 | GO:0006379 | mRNA cleavage(GO:0006379) |
| 0.0 | 0.2 | GO:0050910 | detection of mechanical stimulus involved in sensory perception of sound(GO:0050910) |
| 0.0 | 0.3 | GO:0032757 | positive regulation of interleukin-8 production(GO:0032757) |
Gene overrepresentation in cellular component category:
| Log-likelihood per target | Total log-likelihood | Term | Description |
|---|---|---|---|
| 0.3 | 2.5 | GO:0000110 | nucleotide-excision repair factor 1 complex(GO:0000110) |
| 0.2 | 0.9 | GO:1990356 | sumoylated E2 ligase complex(GO:1990356) |
| 0.2 | 0.6 | GO:0070044 | synaptobrevin 2-SNAP-25-syntaxin-1a complex(GO:0070044) |
| 0.1 | 0.8 | GO:0005594 | collagen type IX trimer(GO:0005594) |
| 0.1 | 0.5 | GO:1990578 | perinuclear endoplasmic reticulum membrane(GO:1990578) |
| 0.1 | 0.3 | GO:0097135 | cyclin E2-CDK2 complex(GO:0097135) |
| 0.1 | 0.6 | GO:0031302 | intrinsic component of endosome membrane(GO:0031302) |
| 0.1 | 0.2 | GO:0000805 | X chromosome(GO:0000805) |
| 0.1 | 0.4 | GO:0090498 | extrinsic component of Golgi membrane(GO:0090498) |
| 0.1 | 0.3 | GO:0034753 | nuclear aryl hydrocarbon receptor complex(GO:0034753) |
| 0.1 | 0.3 | GO:1902636 | kinociliary basal body(GO:1902636) |
| 0.1 | 0.3 | GO:0043293 | apoptosome(GO:0043293) |
| 0.1 | 0.4 | GO:0031510 | SUMO activating enzyme complex(GO:0031510) |
| 0.1 | 0.6 | GO:0031673 | H zone(GO:0031673) |
| 0.1 | 0.3 | GO:0000939 | condensed chromosome inner kinetochore(GO:0000939) |
| 0.1 | 0.4 | GO:0048787 | presynaptic active zone membrane(GO:0048787) |
| 0.1 | 0.9 | GO:0035686 | sperm fibrous sheath(GO:0035686) |
| 0.1 | 0.2 | GO:0005900 | oncostatin-M receptor complex(GO:0005900) |
| 0.1 | 0.6 | GO:0005658 | alpha DNA polymerase:primase complex(GO:0005658) |
| 0.1 | 0.5 | GO:0031262 | Ndc80 complex(GO:0031262) |
| 0.1 | 0.4 | GO:0008622 | epsilon DNA polymerase complex(GO:0008622) |
| 0.1 | 0.1 | GO:0005943 | phosphatidylinositol 3-kinase complex, class IA(GO:0005943) |
| 0.1 | 1.3 | GO:0044233 | ER-mitochondrion membrane contact site(GO:0044233) |
| 0.1 | 0.3 | GO:0032937 | SREBP-SCAP-Insig complex(GO:0032937) |
| 0.1 | 0.2 | GO:1990298 | mitotic checkpoint complex(GO:0033597) bub1-bub3 complex(GO:1990298) |
| 0.1 | 0.2 | GO:0070701 | mucus layer(GO:0070701) |
| 0.1 | 0.4 | GO:1990393 | 3M complex(GO:1990393) |
| 0.1 | 0.5 | GO:0000125 | PCAF complex(GO:0000125) |
| 0.1 | 0.2 | GO:0005656 | nuclear pre-replicative complex(GO:0005656) pre-replicative complex(GO:0036387) |
| 0.1 | 0.4 | GO:0070545 | PeBoW complex(GO:0070545) |
| 0.1 | 0.3 | GO:1902560 | GMP reductase complex(GO:1902560) |
| 0.1 | 0.2 | GO:0055087 | Ski complex(GO:0055087) |
| 0.1 | 0.2 | GO:0035525 | NF-kappaB p50/p65 complex(GO:0035525) |
| 0.1 | 0.3 | GO:0031523 | Myb complex(GO:0031523) |
| 0.1 | 0.5 | GO:0071546 | pi-body(GO:0071546) |
| 0.0 | 0.2 | GO:0034681 | integrin alpha11-beta1 complex(GO:0034681) |
| 0.0 | 0.1 | GO:0048269 | methionine adenosyltransferase complex(GO:0048269) |
| 0.0 | 0.3 | GO:1990246 | uniplex complex(GO:1990246) |
| 0.0 | 0.3 | GO:0032311 | angiogenin-PRI complex(GO:0032311) |
| 0.0 | 0.0 | GO:0000811 | GINS complex(GO:0000811) DNA replication preinitiation complex(GO:0031261) |
| 0.0 | 0.3 | GO:0097129 | cyclin D2-CDK4 complex(GO:0097129) |
| 0.0 | 0.3 | GO:0097149 | centralspindlin complex(GO:0097149) |
| 0.0 | 0.1 | GO:0097454 | Schwann cell microvillus(GO:0097454) |
| 0.0 | 0.5 | GO:0000015 | phosphopyruvate hydratase complex(GO:0000015) |
| 0.0 | 0.4 | GO:1990111 | spermatoproteasome complex(GO:1990111) |
| 0.0 | 0.9 | GO:0031088 | platelet dense granule membrane(GO:0031088) |
| 0.0 | 0.3 | GO:0044305 | calyx of Held(GO:0044305) |
| 0.0 | 0.5 | GO:0030991 | intraciliary transport particle A(GO:0030991) |
| 0.0 | 0.2 | GO:0060200 | clathrin-sculpted acetylcholine transport vesicle(GO:0060200) clathrin-sculpted acetylcholine transport vesicle membrane(GO:0060201) |
| 0.0 | 0.1 | GO:0000814 | ESCRT II complex(GO:0000814) |
| 0.0 | 0.8 | GO:0060077 | inhibitory synapse(GO:0060077) |
| 0.0 | 0.6 | GO:0008290 | F-actin capping protein complex(GO:0008290) |
| 0.0 | 0.2 | GO:0008537 | proteasome activator complex(GO:0008537) |
| 0.0 | 0.2 | GO:0071942 | XPC complex(GO:0071942) |
| 0.0 | 0.4 | GO:0031298 | replication fork protection complex(GO:0031298) |
| 0.0 | 0.2 | GO:0042643 | actomyosin, actin portion(GO:0042643) |
| 0.0 | 0.2 | GO:0032144 | 4-aminobutyrate transaminase complex(GO:0032144) |
| 0.0 | 0.1 | GO:0031933 | telomeric heterochromatin(GO:0031933) |
| 0.0 | 0.5 | GO:0097136 | Bcl-2 family protein complex(GO:0097136) |
| 0.0 | 0.5 | GO:0046581 | intercellular canaliculus(GO:0046581) |
| 0.0 | 0.2 | GO:0035363 | histone locus body(GO:0035363) |
| 0.0 | 1.0 | GO:0005868 | cytoplasmic dynein complex(GO:0005868) |
| 0.0 | 1.1 | GO:0030992 | intraciliary transport particle B(GO:0030992) |
| 0.0 | 0.2 | GO:0034991 | nuclear meiotic cohesin complex(GO:0034991) |
| 0.0 | 0.8 | GO:0031588 | nucleotide-activated protein kinase complex(GO:0031588) |
| 0.0 | 0.6 | GO:0017146 | NMDA selective glutamate receptor complex(GO:0017146) |
| 0.0 | 0.9 | GO:0000242 | pericentriolar material(GO:0000242) |
| 0.0 | 0.4 | GO:0005786 | signal recognition particle, endoplasmic reticulum targeting(GO:0005786) |
| 0.0 | 0.2 | GO:0031501 | mannosyltransferase complex(GO:0031501) |
| 0.0 | 0.1 | GO:0097452 | GAIT complex(GO:0097452) |
| 0.0 | 0.5 | GO:0070531 | BRCA1-A complex(GO:0070531) |
| 0.0 | 0.1 | GO:1990667 | PCSK9-AnxA2 complex(GO:1990667) |
| 0.0 | 0.2 | GO:0005947 | mitochondrial alpha-ketoglutarate dehydrogenase complex(GO:0005947) |
| 0.0 | 0.1 | GO:0043159 | acrosomal matrix(GO:0043159) |
| 0.0 | 0.3 | GO:0035985 | senescence-associated heterochromatin focus(GO:0035985) |
| 0.0 | 0.4 | GO:0031464 | Cul4A-RING E3 ubiquitin ligase complex(GO:0031464) |
| 0.0 | 0.2 | GO:0070847 | core mediator complex(GO:0070847) |
| 0.0 | 0.3 | GO:0051286 | cell tip(GO:0051286) |
| 0.0 | 0.2 | GO:0071598 | neuronal ribonucleoprotein granule(GO:0071598) |
| 0.0 | 0.3 | GO:0005964 | phosphorylase kinase complex(GO:0005964) |
| 0.0 | 0.5 | GO:0044615 | nuclear pore nuclear basket(GO:0044615) |
| 0.0 | 0.1 | GO:0031251 | PAN complex(GO:0031251) |
| 0.0 | 0.1 | GO:0032302 | MutSbeta complex(GO:0032302) |
| 0.0 | 0.1 | GO:0070876 | SOSS complex(GO:0070876) |
| 0.0 | 0.5 | GO:0070937 | CRD-mediated mRNA stability complex(GO:0070937) |
| 0.0 | 0.1 | GO:0071821 | FANCM-MHF complex(GO:0071821) |
| 0.0 | 0.3 | GO:0044327 | dendritic spine head(GO:0044327) |
| 0.0 | 0.1 | GO:0045160 | myosin I complex(GO:0045160) |
| 0.0 | 0.2 | GO:0000408 | EKC/KEOPS complex(GO:0000408) |
| 0.0 | 0.1 | GO:0048500 | signal recognition particle(GO:0048500) |
| 0.0 | 0.8 | GO:0043596 | nuclear replication fork(GO:0043596) |
| 0.0 | 0.2 | GO:0005956 | protein kinase CK2 complex(GO:0005956) |
| 0.0 | 0.1 | GO:0032301 | MutSalpha complex(GO:0032301) |
| 0.0 | 0.4 | GO:0005883 | neurofilament(GO:0005883) |
| 0.0 | 0.2 | GO:0070765 | gamma-secretase complex(GO:0070765) |
| 0.0 | 0.6 | GO:0031264 | death-inducing signaling complex(GO:0031264) |
| 0.0 | 0.1 | GO:0090571 | RNA polymerase II transcription repressor complex(GO:0090571) |
| 0.0 | 0.1 | GO:0009331 | glycerol-3-phosphate dehydrogenase complex(GO:0009331) |
| 0.0 | 0.6 | GO:0031083 | BLOC-1 complex(GO:0031083) |
| 0.0 | 0.4 | GO:0016580 | Sin3 complex(GO:0016580) |
| 0.0 | 0.1 | GO:0044326 | dendritic spine neck(GO:0044326) |
| 0.0 | 2.5 | GO:0031093 | platelet alpha granule lumen(GO:0031093) |
| 0.0 | 0.1 | GO:0045272 | plasma membrane respiratory chain complex I(GO:0045272) |
| 0.0 | 0.3 | GO:0030870 | Mre11 complex(GO:0030870) |
| 0.0 | 0.1 | GO:0034388 | Pwp2p-containing subcomplex of 90S preribosome(GO:0034388) |
| 0.0 | 0.4 | GO:0045120 | pronucleus(GO:0045120) |
| 0.0 | 1.3 | GO:0030964 | mitochondrial respiratory chain complex I(GO:0005747) NADH dehydrogenase complex(GO:0030964) respiratory chain complex I(GO:0045271) |
| 0.0 | 0.1 | GO:0071001 | U4/U6 snRNP(GO:0071001) |
| 0.0 | 0.3 | GO:0030478 | actin cap(GO:0030478) |
| 0.0 | 1.1 | GO:0031201 | SNARE complex(GO:0031201) |
| 0.0 | 0.4 | GO:0033270 | paranode region of axon(GO:0033270) |
| 0.0 | 0.1 | GO:0005971 | ribonucleoside-diphosphate reductase complex(GO:0005971) |
| 0.0 | 0.1 | GO:1990589 | ATF4-CREB1 transcription factor complex(GO:1990589) |
| 0.0 | 0.1 | GO:0030896 | checkpoint clamp complex(GO:0030896) |
| 0.0 | 0.3 | GO:0097539 | ciliary transition fiber(GO:0097539) |
| 0.0 | 1.0 | GO:0046658 | anchored component of plasma membrane(GO:0046658) |
| 0.0 | 0.1 | GO:0000229 | cytoplasmic chromosome(GO:0000229) |
| 0.0 | 0.1 | GO:0016533 | cyclin-dependent protein kinase 5 holoenzyme complex(GO:0016533) |
| 0.0 | 0.2 | GO:0032593 | insulin-responsive compartment(GO:0032593) |
| 0.0 | 0.1 | GO:1990425 | ryanodine receptor complex(GO:1990425) |
| 0.0 | 0.2 | GO:0034464 | BBSome(GO:0034464) |
| 0.0 | 0.3 | GO:0097386 | glial cell projection(GO:0097386) |
| 0.0 | 0.1 | GO:0032299 | ribonuclease H2 complex(GO:0032299) |
| 0.0 | 0.3 | GO:0008250 | oligosaccharyltransferase complex(GO:0008250) |
| 0.0 | 0.1 | GO:0033276 | transcription factor TFTC complex(GO:0033276) |
| 0.0 | 0.4 | GO:0035327 | transcriptionally active chromatin(GO:0035327) |
| 0.0 | 0.2 | GO:0008541 | proteasome regulatory particle, lid subcomplex(GO:0008541) |
| 0.0 | 0.1 | GO:0035976 | AP1 complex(GO:0035976) |
| 0.0 | 0.1 | GO:0042583 | chromaffin granule(GO:0042583) |
| 0.0 | 0.1 | GO:0020016 | ciliary pocket(GO:0020016) ciliary pocket membrane(GO:0020018) |
| 0.0 | 0.2 | GO:0097413 | Lewy body(GO:0097413) |
| 0.0 | 0.1 | GO:0061202 | clathrin-sculpted gamma-aminobutyric acid transport vesicle(GO:0061200) clathrin-sculpted gamma-aminobutyric acid transport vesicle membrane(GO:0061202) |
| 0.0 | 0.2 | GO:0030914 | STAGA complex(GO:0030914) |
| 0.0 | 0.1 | GO:1990630 | IRE1-RACK1-PP2A complex(GO:1990630) |
| 0.0 | 0.4 | GO:0080008 | Cul4-RING E3 ubiquitin ligase complex(GO:0080008) |
| 0.0 | 0.4 | GO:0005922 | connexon complex(GO:0005922) |
| 0.0 | 0.2 | GO:0000347 | THO complex(GO:0000347) THO complex part of transcription export complex(GO:0000445) |
| 0.0 | 0.1 | GO:0071012 | catalytic step 1 spliceosome(GO:0071012) |
| 0.0 | 0.1 | GO:0070761 | pre-snoRNP complex(GO:0070761) |
| 0.0 | 0.4 | GO:0005839 | proteasome core complex(GO:0005839) |
| 0.0 | 0.0 | GO:0034515 | proteasome storage granule(GO:0034515) |
| 0.0 | 1.4 | GO:0060170 | ciliary membrane(GO:0060170) |
| 0.0 | 0.1 | GO:0032777 | Piccolo NuA4 histone acetyltransferase complex(GO:0032777) |
| 0.0 | 0.1 | GO:0043190 | ATP-binding cassette (ABC) transporter complex(GO:0043190) |
| 0.0 | 1.6 | GO:0005581 | collagen trimer(GO:0005581) |
| 0.0 | 0.2 | GO:0030897 | HOPS complex(GO:0030897) |
| 0.0 | 0.1 | GO:1990635 | proximal dendrite(GO:1990635) |
| 0.0 | 0.1 | GO:0008282 | ATP-sensitive potassium channel complex(GO:0008282) |
| 0.0 | 0.1 | GO:0032044 | DSIF complex(GO:0032044) |
| 0.0 | 0.2 | GO:0036038 | MKS complex(GO:0036038) |
| 0.0 | 0.2 | GO:0070938 | contractile ring(GO:0070938) |
| 0.0 | 0.2 | GO:0044666 | MLL3/4 complex(GO:0044666) |
| 0.0 | 0.1 | GO:1903439 | calcitonin family receptor complex(GO:1903439) amylin receptor complex(GO:1903440) |
| 0.0 | 0.1 | GO:0071541 | eukaryotic translation initiation factor 3 complex, eIF3m(GO:0071541) |
| 0.0 | 0.2 | GO:0031616 | spindle pole centrosome(GO:0031616) |
| 0.0 | 0.2 | GO:0035631 | CD40 receptor complex(GO:0035631) |
| 0.0 | 0.1 | GO:0000796 | condensin complex(GO:0000796) |
| 0.0 | 0.2 | GO:0005641 | nuclear envelope lumen(GO:0005641) |
| 0.0 | 0.2 | GO:0016600 | flotillin complex(GO:0016600) |
| 0.0 | 0.5 | GO:0009925 | basal plasma membrane(GO:0009925) |
| 0.0 | 0.1 | GO:0098554 | cytoplasmic side of endoplasmic reticulum membrane(GO:0098554) |
| 0.0 | 0.1 | GO:0060091 | kinocilium(GO:0060091) |
| 0.0 | 0.1 | GO:0031931 | TORC1 complex(GO:0031931) |
| 0.0 | 0.4 | GO:0071782 | endoplasmic reticulum tubular network(GO:0071782) |
| 0.0 | 0.2 | GO:0005751 | mitochondrial respiratory chain complex IV(GO:0005751) |
| 0.0 | 0.5 | GO:0016460 | myosin II complex(GO:0016460) |
Gene overrepresentation in molecular function category:
| Log-likelihood per target | Total log-likelihood | Term | Description |
|---|---|---|---|
| 0.5 | 2.1 | GO:0004306 | ethanolamine-phosphate cytidylyltransferase activity(GO:0004306) |
| 0.3 | 2.5 | GO:1990599 | 3' overhang single-stranded DNA endodeoxyribonuclease activity(GO:1990599) |
| 0.3 | 1.1 | GO:0004031 | aldehyde oxidase activity(GO:0004031) |
| 0.3 | 1.4 | GO:0016404 | 15-hydroxyprostaglandin dehydrogenase (NAD+) activity(GO:0016404) |
| 0.3 | 1.3 | GO:0097108 | hedgehog family protein binding(GO:0097108) |
| 0.3 | 0.8 | GO:0005519 | cytoskeletal regulatory protein binding(GO:0005519) |
| 0.2 | 0.9 | GO:0061656 | SUMO conjugating enzyme activity(GO:0061656) |
| 0.2 | 0.9 | GO:0047757 | chondroitin-glucuronate 5-epimerase activity(GO:0047757) |
| 0.2 | 0.6 | GO:0000248 | C-5 sterol desaturase activity(GO:0000248) sterol desaturase activity(GO:0070704) |
| 0.2 | 0.7 | GO:0047676 | arachidonate-CoA ligase activity(GO:0047676) |
| 0.2 | 0.7 | GO:0008832 | dGTPase activity(GO:0008832) triphosphoric monoester hydrolase activity(GO:0016793) guanyl deoxyribonucleotide binding(GO:0032560) dGTP binding(GO:0032567) |
| 0.2 | 0.5 | GO:0005287 | high-affinity basic amino acid transmembrane transporter activity(GO:0005287) high-affinity arginine transmembrane transporter activity(GO:0005289) high-affinity lysine transmembrane transporter activity(GO:0005292) |
| 0.2 | 0.8 | GO:0070573 | metallodipeptidase activity(GO:0070573) |
| 0.2 | 0.5 | GO:0004336 | galactosylceramidase activity(GO:0004336) |
| 0.2 | 1.9 | GO:0016015 | morphogen activity(GO:0016015) |
| 0.2 | 0.5 | GO:0031071 | cysteine desulfurase activity(GO:0031071) |
| 0.2 | 0.6 | GO:0004146 | dihydrofolate reductase activity(GO:0004146) |
| 0.2 | 0.6 | GO:0004923 | leukemia inhibitory factor receptor activity(GO:0004923) |
| 0.1 | 1.4 | GO:0019531 | oxalate transmembrane transporter activity(GO:0019531) |
| 0.1 | 0.4 | GO:0015189 | L-lysine transmembrane transporter activity(GO:0015189) |
| 0.1 | 0.5 | GO:0004505 | phenylalanine 4-monooxygenase activity(GO:0004505) |
| 0.1 | 0.4 | GO:0031711 | angiotensin type I receptor activity(GO:0001596) bradykinin receptor binding(GO:0031711) |
| 0.1 | 0.4 | GO:0008670 | 2,4-dienoyl-CoA reductase (NADPH) activity(GO:0008670) |
| 0.1 | 0.5 | GO:0086020 | gap junction channel activity involved in SA node cell-atrial cardiac muscle cell electrical coupling(GO:0086020) |
| 0.1 | 1.1 | GO:0060072 | large conductance calcium-activated potassium channel activity(GO:0060072) |
| 0.1 | 0.7 | GO:0004720 | protein-lysine 6-oxidase activity(GO:0004720) |
| 0.1 | 0.4 | GO:0001069 | regulatory region RNA binding(GO:0001069) |
| 0.1 | 0.5 | GO:0005502 | 11-cis retinal binding(GO:0005502) |
| 0.1 | 0.3 | GO:0004874 | aryl hydrocarbon receptor activity(GO:0004874) |
| 0.1 | 0.7 | GO:0004957 | prostaglandin E receptor activity(GO:0004957) |
| 0.1 | 0.5 | GO:0090554 | phosphatidylcholine-translocating ATPase activity(GO:0090554) |
| 0.1 | 0.3 | GO:0004056 | argininosuccinate lyase activity(GO:0004056) |
| 0.1 | 0.3 | GO:0004356 | glutamate-ammonia ligase activity(GO:0004356) ammonia ligase activity(GO:0016211) acid-ammonia (or amide) ligase activity(GO:0016880) |
| 0.1 | 0.2 | GO:0004584 | dolichyl-phosphate-mannose-glycolipid alpha-mannosyltransferase activity(GO:0004584) |
| 0.1 | 0.3 | GO:0061769 | ribosylnicotinamide kinase activity(GO:0050262) ribosylnicotinate kinase activity(GO:0061769) |
| 0.1 | 0.5 | GO:0044388 | small protein activating enzyme binding(GO:0044388) |
| 0.1 | 0.3 | GO:0004949 | cannabinoid receptor activity(GO:0004949) |
| 0.1 | 0.5 | GO:0004522 | ribonuclease A activity(GO:0004522) |
| 0.1 | 0.2 | GO:0030158 | protein xylosyltransferase activity(GO:0030158) |
| 0.1 | 0.4 | GO:1990254 | keratin filament binding(GO:1990254) |
| 0.1 | 0.2 | GO:0003863 | alpha-ketoacid dehydrogenase activity(GO:0003826) 3-methyl-2-oxobutanoate dehydrogenase (2-methylpropanoyl-transferring) activity(GO:0003863) |
| 0.1 | 0.3 | GO:0004768 | stearoyl-CoA 9-desaturase activity(GO:0004768) acyl-CoA desaturase activity(GO:0016215) |
| 0.1 | 0.4 | GO:0004962 | endothelin receptor activity(GO:0004962) |
| 0.1 | 0.2 | GO:0016784 | 3-mercaptopyruvate sulfurtransferase activity(GO:0016784) |
| 0.1 | 0.3 | GO:0019797 | procollagen-proline 3-dioxygenase activity(GO:0019797) |
| 0.1 | 0.3 | GO:0005169 | neurotrophin TRKB receptor binding(GO:0005169) |
| 0.1 | 1.3 | GO:0043295 | glutathione binding(GO:0043295) |
| 0.1 | 0.2 | GO:0004421 | hydroxymethylglutaryl-CoA synthase activity(GO:0004421) |
| 0.1 | 0.2 | GO:0003829 | beta-1,3-galactosyl-O-glycosyl-glycoprotein beta-1,6-N-acetylglucosaminyltransferase activity(GO:0003829) |
| 0.1 | 0.1 | GO:0019166 | trans-2-enoyl-CoA reductase (NADPH) activity(GO:0019166) |
| 0.1 | 0.2 | GO:0008431 | vitamin E binding(GO:0008431) |
| 0.1 | 0.7 | GO:0035014 | phosphatidylinositol 3-kinase regulator activity(GO:0035014) |
| 0.1 | 0.3 | GO:0016402 | pristanoyl-CoA oxidase activity(GO:0016402) |
| 0.1 | 0.5 | GO:0005087 | Ran guanyl-nucleotide exchange factor activity(GO:0005087) |
| 0.1 | 0.3 | GO:0052654 | branched-chain-amino-acid transaminase activity(GO:0004084) L-leucine transaminase activity(GO:0052654) L-valine transaminase activity(GO:0052655) L-isoleucine transaminase activity(GO:0052656) |
| 0.1 | 0.2 | GO:0047025 | NAD(P)H dehydrogenase (quinone) activity(GO:0003955) 3-oxoacyl-[acyl-carrier-protein] reductase (NADH) activity(GO:0047025) |
| 0.1 | 0.2 | GO:0001512 | dihydronicotinamide riboside quinone reductase activity(GO:0001512) melatonin binding(GO:1904408) |
| 0.1 | 0.2 | GO:0016154 | thymidine phosphorylase activity(GO:0009032) pyrimidine-nucleoside phosphorylase activity(GO:0016154) |
| 0.1 | 0.2 | GO:0003985 | acetyl-CoA C-acetyltransferase activity(GO:0003985) |
| 0.1 | 0.3 | GO:0016657 | GMP reductase activity(GO:0003920) oxidoreductase activity, acting on NAD(P)H, nitrogenous group as acceptor(GO:0016657) |
| 0.1 | 0.6 | GO:0043023 | ribosomal large subunit binding(GO:0043023) |
| 0.1 | 0.8 | GO:0030020 | extracellular matrix structural constituent conferring tensile strength(GO:0030020) |
| 0.1 | 0.2 | GO:0004452 | isopentenyl-diphosphate delta-isomerase activity(GO:0004452) |
| 0.1 | 0.3 | GO:0015137 | citrate transmembrane transporter activity(GO:0015137) tricarboxylic acid transmembrane transporter activity(GO:0015142) |
| 0.1 | 0.2 | GO:0004360 | glutamine-fructose-6-phosphate transaminase (isomerizing) activity(GO:0004360) |
| 0.1 | 0.3 | GO:0042806 | fucose binding(GO:0042806) |
| 0.1 | 0.3 | GO:0004348 | glucosylceramidase activity(GO:0004348) |
| 0.1 | 0.5 | GO:0033743 | peptide-methionine (R)-S-oxide reductase activity(GO:0033743) |
| 0.1 | 0.4 | GO:0061133 | endopeptidase activator activity(GO:0061133) |
| 0.1 | 0.3 | GO:0050501 | hyaluronan synthase activity(GO:0050501) |
| 0.1 | 0.3 | GO:0003896 | DNA primase activity(GO:0003896) |
| 0.1 | 0.1 | GO:0004792 | thiosulfate sulfurtransferase activity(GO:0004792) |
| 0.1 | 0.2 | GO:0002094 | polyprenyltransferase activity(GO:0002094) |
| 0.1 | 0.2 | GO:0050405 | [hydroxymethylglutaryl-CoA reductase (NADPH)] kinase activity(GO:0047322) [acetyl-CoA carboxylase] kinase activity(GO:0050405) |
| 0.1 | 0.3 | GO:0003998 | acylphosphatase activity(GO:0003998) |
| 0.1 | 0.1 | GO:0003997 | acyl-CoA oxidase activity(GO:0003997) |
| 0.1 | 0.2 | GO:0016300 | tRNA (uracil) methyltransferase activity(GO:0016300) |
| 0.1 | 0.7 | GO:0097100 | supercoiled DNA binding(GO:0097100) |
| 0.1 | 0.4 | GO:0004137 | deoxycytidine kinase activity(GO:0004137) thymidine kinase activity(GO:0004797) |
| 0.1 | 0.3 | GO:0034988 | Fc-gamma receptor I complex binding(GO:0034988) |
| 0.0 | 0.2 | GO:0005219 | ryanodine-sensitive calcium-release channel activity(GO:0005219) |
| 0.0 | 0.5 | GO:0015193 | L-proline transmembrane transporter activity(GO:0015193) |
| 0.0 | 0.0 | GO:0015235 | cobalamin transporter activity(GO:0015235) |
| 0.0 | 0.1 | GO:0052810 | 1-phosphatidylinositol-5-kinase activity(GO:0052810) |
| 0.0 | 0.3 | GO:0030197 | extracellular matrix constituent, lubricant activity(GO:0030197) |
| 0.0 | 0.1 | GO:0001861 | complement component C4b receptor activity(GO:0001861) complement component C3b receptor activity(GO:0004877) |
| 0.0 | 0.8 | GO:0016846 | carbon-sulfur lyase activity(GO:0016846) |
| 0.0 | 0.5 | GO:0005412 | glucose:sodium symporter activity(GO:0005412) |
| 0.0 | 0.5 | GO:0004634 | phosphopyruvate hydratase activity(GO:0004634) |
| 0.0 | 0.1 | GO:0045322 | unmethylated CpG binding(GO:0045322) |
| 0.0 | 0.2 | GO:0004504 | peptidylglycine monooxygenase activity(GO:0004504) peptidylamidoglycolate lyase activity(GO:0004598) |
| 0.0 | 0.2 | GO:0032184 | SUMO polymer binding(GO:0032184) |
| 0.0 | 0.1 | GO:0035514 | DNA demethylase activity(GO:0035514) |
| 0.0 | 0.2 | GO:0015199 | amino-acid betaine transmembrane transporter activity(GO:0015199) carnitine transmembrane transporter activity(GO:0015226) |
| 0.0 | 0.1 | GO:0031862 | prostanoid receptor binding(GO:0031862) |
| 0.0 | 0.1 | GO:0000386 | second spliceosomal transesterification activity(GO:0000386) |
| 0.0 | 0.7 | GO:0045159 | myosin II binding(GO:0045159) |
| 0.0 | 0.0 | GO:0005462 | UDP-N-acetylglucosamine transmembrane transporter activity(GO:0005462) |
| 0.0 | 0.2 | GO:0008475 | procollagen-lysine 5-dioxygenase activity(GO:0008475) procollagen glucosyltransferase activity(GO:0033823) |
| 0.0 | 0.2 | GO:0016428 | tRNA (cytosine-5-)-methyltransferase activity(GO:0016428) |
| 0.0 | 0.1 | GO:0090541 | MIT domain binding(GO:0090541) |
| 0.0 | 1.7 | GO:0005540 | hyaluronic acid binding(GO:0005540) |
| 0.0 | 0.1 | GO:0080023 | 3R-hydroxyacyl-CoA dehydratase activity(GO:0080023) |
| 0.0 | 0.4 | GO:0004032 | alditol:NADP+ 1-oxidoreductase activity(GO:0004032) |
| 0.0 | 0.2 | GO:0035241 | protein-arginine omega-N monomethyltransferase activity(GO:0035241) |
| 0.0 | 0.5 | GO:0051434 | BH3 domain binding(GO:0051434) |
| 0.0 | 0.4 | GO:0008379 | thioredoxin peroxidase activity(GO:0008379) |
| 0.0 | 0.1 | GO:0047661 | racemase and epimerase activity, acting on amino acids and derivatives(GO:0016855) racemase activity, acting on amino acids and derivatives(GO:0036361) amino-acid racemase activity(GO:0047661) |
| 0.0 | 0.1 | GO:0016649 | electron-transferring-flavoprotein dehydrogenase activity(GO:0004174) oxidoreductase activity, acting on the CH-NH group of donors, quinone or similar compound as acceptor(GO:0016649) |
| 0.0 | 0.2 | GO:0035501 | MH1 domain binding(GO:0035501) |
| 0.0 | 0.8 | GO:0005149 | interleukin-1 receptor binding(GO:0005149) |
| 0.0 | 0.2 | GO:0004074 | biliverdin reductase activity(GO:0004074) |
| 0.0 | 0.2 | GO:0016639 | oxidoreductase activity, acting on the CH-NH2 group of donors, NAD or NADP as acceptor(GO:0016639) |
| 0.0 | 0.1 | GO:0050542 | icosanoid binding(GO:0050542) fatty acid derivative binding(GO:1901567) |
| 0.0 | 0.3 | GO:0061665 | SUMO ligase activity(GO:0061665) |
| 0.0 | 0.2 | GO:0047179 | platelet-activating factor acetyltransferase activity(GO:0047179) |
| 0.0 | 0.2 | GO:0032145 | 4-aminobutyrate transaminase activity(GO:0003867) succinate-semialdehyde dehydrogenase binding(GO:0032145) (S)-3-amino-2-methylpropionate transaminase activity(GO:0047298) |
| 0.0 | 0.1 | GO:0004157 | dihydropyrimidinase activity(GO:0004157) |
| 0.0 | 0.2 | GO:0005330 | dopamine:sodium symporter activity(GO:0005330) |
| 0.0 | 0.1 | GO:0070991 | medium-chain-acyl-CoA dehydrogenase activity(GO:0070991) |
| 0.0 | 0.1 | GO:0010858 | calcium-dependent protein kinase inhibitor activity(GO:0008427) calcium-dependent protein kinase regulator activity(GO:0010858) |
| 0.0 | 0.4 | GO:0016176 | superoxide-generating NADPH oxidase activator activity(GO:0016176) |
| 0.0 | 0.4 | GO:0035312 | 5'-3' exodeoxyribonuclease activity(GO:0035312) |
| 0.0 | 0.2 | GO:0008410 | CoA-transferase activity(GO:0008410) |
| 0.0 | 0.2 | GO:0047066 | phospholipid-hydroperoxide glutathione peroxidase activity(GO:0047066) |
| 0.0 | 0.4 | GO:0010859 | calcium-dependent cysteine-type endopeptidase inhibitor activity(GO:0010859) |
| 0.0 | 0.7 | GO:0004861 | cyclin-dependent protein serine/threonine kinase inhibitor activity(GO:0004861) |
| 0.0 | 1.4 | GO:0017075 | syntaxin-1 binding(GO:0017075) |
| 0.0 | 0.6 | GO:0008140 | cAMP response element binding protein binding(GO:0008140) |
| 0.0 | 0.2 | GO:0004814 | arginine-tRNA ligase activity(GO:0004814) |
| 0.0 | 0.1 | GO:0003953 | NAD+ nucleosidase activity(GO:0003953) |
| 0.0 | 0.2 | GO:0004666 | prostaglandin-endoperoxide synthase activity(GO:0004666) |
| 0.0 | 0.1 | GO:0004878 | complement component C5a receptor activity(GO:0004878) |
| 0.0 | 0.2 | GO:0050254 | rhodopsin kinase activity(GO:0050254) |
| 0.0 | 1.0 | GO:0097200 | cysteine-type endopeptidase activity involved in execution phase of apoptosis(GO:0097200) |
| 0.0 | 0.2 | GO:0046538 | bisphosphoglycerate mutase activity(GO:0004082) phosphoglycerate mutase activity(GO:0004619) 2,3-bisphosphoglycerate-dependent phosphoglycerate mutase activity(GO:0046538) |
| 0.0 | 0.3 | GO:0035368 | selenocysteine insertion sequence binding(GO:0035368) |
| 0.0 | 0.3 | GO:0005000 | vasopressin receptor activity(GO:0005000) |
| 0.0 | 0.4 | GO:0031386 | protein tag(GO:0031386) |
| 0.0 | 0.3 | GO:0004969 | histamine receptor activity(GO:0004969) |
| 0.0 | 0.7 | GO:0031418 | L-ascorbic acid binding(GO:0031418) |
| 0.0 | 0.3 | GO:0031730 | CCR5 chemokine receptor binding(GO:0031730) |
| 0.0 | 0.1 | GO:0005163 | nerve growth factor receptor binding(GO:0005163) |
| 0.0 | 0.6 | GO:0008603 | cAMP-dependent protein kinase regulator activity(GO:0008603) |
| 0.0 | 0.6 | GO:0035497 | cAMP response element binding(GO:0035497) |
| 0.0 | 0.1 | GO:0015616 | DNA translocase activity(GO:0015616) |
| 0.0 | 0.1 | GO:0004449 | isocitrate dehydrogenase (NAD+) activity(GO:0004449) |
| 0.0 | 0.1 | GO:0042954 | lipoprotein transporter activity(GO:0042954) |
| 0.0 | 0.2 | GO:0036033 | mediator complex binding(GO:0036033) |
| 0.0 | 0.1 | GO:0030549 | acetylcholine receptor activator activity(GO:0030549) |
| 0.0 | 0.1 | GO:0004616 | phosphogluconate dehydrogenase (decarboxylating) activity(GO:0004616) |
| 0.0 | 1.3 | GO:0005164 | tumor necrosis factor receptor binding(GO:0005164) |
| 0.0 | 0.1 | GO:0032795 | heterotrimeric G-protein binding(GO:0032795) |
| 0.0 | 0.3 | GO:0050291 | sphingosine N-acyltransferase activity(GO:0050291) |
| 0.0 | 0.1 | GO:0035673 | oligopeptide transmembrane transporter activity(GO:0035673) |
| 0.0 | 0.3 | GO:0016206 | catechol O-methyltransferase activity(GO:0016206) |
| 0.0 | 0.3 | GO:0004689 | phosphorylase kinase activity(GO:0004689) |
| 0.0 | 0.2 | GO:0015093 | ferrous iron transmembrane transporter activity(GO:0015093) |
| 0.0 | 0.1 | GO:0035605 | peptidyl-cysteine S-nitrosylase activity(GO:0035605) |
| 0.0 | 0.2 | GO:0039552 | RIG-I binding(GO:0039552) |
| 0.0 | 0.1 | GO:0050211 | procollagen galactosyltransferase activity(GO:0050211) |
| 0.0 | 0.4 | GO:0045504 | dynein heavy chain binding(GO:0045504) |
| 0.0 | 0.6 | GO:0031852 | mu-type opioid receptor binding(GO:0031852) |
| 0.0 | 0.1 | GO:0003988 | acetyl-CoA C-acyltransferase activity(GO:0003988) |
| 0.0 | 0.6 | GO:0070878 | primary miRNA binding(GO:0070878) |
| 0.0 | 0.1 | GO:0050571 | 1,5-anhydro-D-fructose reductase activity(GO:0050571) |
| 0.0 | 0.6 | GO:0004185 | serine-type carboxypeptidase activity(GO:0004185) |
| 0.0 | 0.1 | GO:0035402 | histone kinase activity (H3-T11 specific)(GO:0035402) |
| 0.0 | 0.3 | GO:0004523 | RNA-DNA hybrid ribonuclease activity(GO:0004523) |
| 0.0 | 0.3 | GO:0015129 | lactate transmembrane transporter activity(GO:0015129) |
| 0.0 | 0.3 | GO:0005005 | transmembrane-ephrin receptor activity(GO:0005005) |
| 0.0 | 0.3 | GO:0003995 | acyl-CoA dehydrogenase activity(GO:0003995) |
| 0.0 | 0.3 | GO:0008312 | 7S RNA binding(GO:0008312) |
| 0.0 | 0.1 | GO:0008192 | RNA guanylyltransferase activity(GO:0008192) |
| 0.0 | 0.2 | GO:0030021 | extracellular matrix structural constituent conferring compression resistance(GO:0030021) structural constituent of tooth enamel(GO:0030345) |
| 0.0 | 0.2 | GO:0098639 | collagen binding involved in cell-matrix adhesion(GO:0098639) |
| 0.0 | 0.1 | GO:1904047 | S-adenosyl-L-methionine binding(GO:1904047) |
| 0.0 | 1.1 | GO:0043539 | protein serine/threonine kinase activator activity(GO:0043539) |
| 0.0 | 0.2 | GO:0032142 | single guanine insertion binding(GO:0032142) |
| 0.0 | 0.2 | GO:0043813 | phosphatidylinositol-3,5-bisphosphate 5-phosphatase activity(GO:0043813) |
| 0.0 | 0.2 | GO:0016840 | carbon-nitrogen lyase activity(GO:0016840) |
| 0.0 | 0.1 | GO:0004948 | calcitonin receptor activity(GO:0004948) |
| 0.0 | 0.1 | GO:0030060 | L-malate dehydrogenase activity(GO:0030060) |
| 0.0 | 0.1 | GO:0016427 | tRNA (cytosine) methyltransferase activity(GO:0016427) |
| 0.0 | 0.3 | GO:1990247 | N6-methyladenosine-containing RNA binding(GO:1990247) |
| 0.0 | 1.4 | GO:0050136 | NADH dehydrogenase (ubiquinone) activity(GO:0008137) NADH dehydrogenase (quinone) activity(GO:0050136) |
| 0.0 | 0.1 | GO:0052590 | sn-glycerol-3-phosphate:ubiquinone oxidoreductase activity(GO:0052590) sn-glycerol-3-phosphate:ubiquinone-8 oxidoreductase activity(GO:0052591) |
| 0.0 | 0.1 | GO:0016230 | sphingomyelin phosphodiesterase activator activity(GO:0016230) |
| 0.0 | 0.4 | GO:0008409 | 5'-3' exonuclease activity(GO:0008409) |
| 0.0 | 0.1 | GO:0004995 | tachykinin receptor activity(GO:0004995) |
| 0.0 | 0.5 | GO:0070403 | NAD+ binding(GO:0070403) |
| 0.0 | 0.2 | GO:0030292 | protein tyrosine kinase inhibitor activity(GO:0030292) |
| 0.0 | 0.4 | GO:0015245 | fatty acid transporter activity(GO:0015245) |
| 0.0 | 0.1 | GO:0004359 | glutaminase activity(GO:0004359) |
| 0.0 | 0.3 | GO:0070492 | oligosaccharide binding(GO:0070492) |
| 0.0 | 0.1 | GO:0047237 | glucuronylgalactosylproteoglycan 4-beta-N-acetylgalactosaminyltransferase activity(GO:0047237) |
| 0.0 | 1.0 | GO:0005484 | SNAP receptor activity(GO:0005484) |
| 0.0 | 0.4 | GO:0047372 | acylglycerol lipase activity(GO:0047372) |
| 0.0 | 0.1 | GO:0001632 | leukotriene B4 receptor activity(GO:0001632) |
| 0.0 | 0.4 | GO:0016538 | cyclin-dependent protein serine/threonine kinase regulator activity(GO:0016538) |
| 0.0 | 0.1 | GO:0004376 | glycolipid mannosyltransferase activity(GO:0004376) |
| 0.0 | 0.3 | GO:0004065 | arylsulfatase activity(GO:0004065) |
| 0.0 | 0.1 | GO:0003860 | 3-hydroxyisobutyryl-CoA hydrolase activity(GO:0003860) |
| 0.0 | 0.3 | GO:0000774 | adenyl-nucleotide exchange factor activity(GO:0000774) |
| 0.0 | 0.1 | GO:0052836 | inositol 5-diphosphate pentakisphosphate 5-kinase activity(GO:0052836) inositol diphosphate tetrakisphosphate kinase activity(GO:0052839) |
| 0.0 | 0.6 | GO:0051010 | microtubule plus-end binding(GO:0051010) |
| 0.0 | 0.2 | GO:0071532 | ankyrin repeat binding(GO:0071532) |
| 0.0 | 0.1 | GO:0004170 | dUTP diphosphatase activity(GO:0004170) |
| 0.0 | 0.1 | GO:0004165 | dodecenoyl-CoA delta-isomerase activity(GO:0004165) |
| 0.0 | 0.1 | GO:0004748 | ribonucleoside-diphosphate reductase activity, thioredoxin disulfide as acceptor(GO:0004748) oxidoreductase activity, acting on CH or CH2 groups, disulfide as acceptor(GO:0016728) ribonucleoside-diphosphate reductase activity(GO:0061731) |
| 0.0 | 0.1 | GO:0004161 | dimethylallyltranstransferase activity(GO:0004161) geranyltranstransferase activity(GO:0004337) |
| 0.0 | 0.2 | GO:0030274 | LIM domain binding(GO:0030274) |
| 0.0 | 0.1 | GO:0004852 | uroporphyrinogen-III synthase activity(GO:0004852) |
| 0.0 | 0.3 | GO:0043522 | leucine zipper domain binding(GO:0043522) |
| 0.0 | 0.0 | GO:0070052 | collagen V binding(GO:0070052) |
| 0.0 | 0.1 | GO:0070363 | mitochondrial light strand promoter sense binding(GO:0070363) |
| 0.0 | 0.3 | GO:0005003 | ephrin receptor activity(GO:0005003) |
| 0.0 | 1.0 | GO:0050699 | WW domain binding(GO:0050699) |
| 0.0 | 0.2 | GO:0038049 | transcription factor activity, ligand-activated RNA polymerase II transcription factor binding(GO:0038049) |
| 0.0 | 0.1 | GO:0005381 | iron ion transmembrane transporter activity(GO:0005381) |
| 0.0 | 0.3 | GO:0005068 | transmembrane receptor protein tyrosine kinase adaptor activity(GO:0005068) |
| 0.0 | 0.0 | GO:0032139 | dinucleotide insertion or deletion binding(GO:0032139) |
| 0.0 | 0.1 | GO:0009019 | tRNA (guanine-N1-)-methyltransferase activity(GO:0009019) |
| 0.0 | 0.4 | GO:0008191 | metalloendopeptidase inhibitor activity(GO:0008191) |
| 0.0 | 0.7 | GO:0008327 | methyl-CpG binding(GO:0008327) |
| 0.0 | 0.1 | GO:0098973 | structural constituent of synapse(GO:0098918) structural constituent of postsynaptic actin cytoskeleton(GO:0098973) |
| 0.0 | 0.1 | GO:0071253 | connexin binding(GO:0071253) |
| 0.0 | 0.4 | GO:0019206 | nucleoside kinase activity(GO:0019206) |
| 0.0 | 0.2 | GO:0070181 | small ribosomal subunit rRNA binding(GO:0070181) |
| 0.0 | 0.1 | GO:0031628 | opioid receptor binding(GO:0031628) |
| 0.0 | 1.1 | GO:0001102 | RNA polymerase II activating transcription factor binding(GO:0001102) |
| 0.0 | 1.2 | GO:0035255 | ionotropic glutamate receptor binding(GO:0035255) |
| 0.0 | 0.1 | GO:0034584 | piRNA binding(GO:0034584) |
| 0.0 | 0.8 | GO:0005158 | insulin receptor binding(GO:0005158) |
| 0.0 | 0.4 | GO:0005351 | sugar:proton symporter activity(GO:0005351) cation:sugar symporter activity(GO:0005402) |
| 0.0 | 0.4 | GO:0008190 | eukaryotic initiation factor 4E binding(GO:0008190) |
| 0.0 | 0.2 | GO:0035381 | extracellular ATP-gated cation channel activity(GO:0004931) ATP-gated ion channel activity(GO:0035381) |
| 0.0 | 0.5 | GO:0004298 | threonine-type endopeptidase activity(GO:0004298) threonine-type peptidase activity(GO:0070003) |
| 0.0 | 0.1 | GO:0004045 | aminoacyl-tRNA hydrolase activity(GO:0004045) |
| 0.0 | 0.1 | GO:0016714 | oxidoreductase activity, acting on paired donors, with incorporation or reduction of molecular oxygen, reduced pteridine as one donor, and incorporation of one atom of oxygen(GO:0016714) |
| 0.0 | 0.3 | GO:0005522 | profilin binding(GO:0005522) |
| 0.0 | 0.2 | GO:0015187 | glycine transmembrane transporter activity(GO:0015187) |
| 0.0 | 0.7 | GO:0030742 | GTP-dependent protein binding(GO:0030742) |
| 0.0 | 0.1 | GO:0008454 | alpha-1,3-mannosylglycoprotein 4-beta-N-acetylglucosaminyltransferase activity(GO:0008454) |
| 0.0 | 0.5 | GO:0005086 | ARF guanyl-nucleotide exchange factor activity(GO:0005086) |
| 0.0 | 0.5 | GO:0017056 | structural constituent of nuclear pore(GO:0017056) |
| 0.0 | 0.2 | GO:0043024 | ribosomal small subunit binding(GO:0043024) |
| 0.0 | 1.3 | GO:0030374 | ligand-dependent nuclear receptor transcription coactivator activity(GO:0030374) |
| 0.0 | 0.2 | GO:0030306 | ADP-ribosylation factor binding(GO:0030306) |
| 0.0 | 0.3 | GO:0042609 | CD4 receptor binding(GO:0042609) |
| 0.0 | 0.1 | GO:0004738 | pyruvate dehydrogenase activity(GO:0004738) pyruvate dehydrogenase [NAD(P)+] activity(GO:0034603) pyruvate dehydrogenase (NAD+) activity(GO:0034604) |
| 0.0 | 0.1 | GO:0034617 | nitric-oxide synthase activity(GO:0004517) tetrahydrobiopterin binding(GO:0034617) |
| 0.0 | 0.3 | GO:0042800 | histone methyltransferase activity (H3-K4 specific)(GO:0042800) |
| 0.0 | 0.1 | GO:0042799 | histone methyltransferase activity (H4-K20 specific)(GO:0042799) |
| 0.0 | 0.6 | GO:0051539 | 4 iron, 4 sulfur cluster binding(GO:0051539) |
| 0.0 | 0.9 | GO:0005547 | phosphatidylinositol-3,4,5-trisphosphate binding(GO:0005547) |
| 0.0 | 0.2 | GO:0009881 | photoreceptor activity(GO:0009881) |
| 0.0 | 0.1 | GO:0003831 | beta-N-acetylglucosaminylglycopeptide beta-1,4-galactosyltransferase activity(GO:0003831) |
| 0.0 | 0.1 | GO:0010997 | anaphase-promoting complex binding(GO:0010997) |
| 0.0 | 0.1 | GO:0070290 | N-acylphosphatidylethanolamine-specific phospholipase D activity(GO:0070290) |
| 0.0 | 0.1 | GO:0047756 | chondroitin 4-sulfotransferase activity(GO:0047756) 3'-phosphoadenosine 5'-phosphosulfate binding(GO:0050656) |
| 0.0 | 0.1 | GO:0016406 | carnitine O-acyltransferase activity(GO:0016406) |
| 0.0 | 0.3 | GO:0003887 | DNA-directed DNA polymerase activity(GO:0003887) |
| 0.0 | 0.1 | GO:0017162 | aryl hydrocarbon receptor binding(GO:0017162) |
| 0.0 | 0.3 | GO:0032794 | GTPase activating protein binding(GO:0032794) |
| 0.0 | 0.0 | GO:0003958 | NADPH-hemoprotein reductase activity(GO:0003958) |
| 0.0 | 0.2 | GO:0050072 | m7G(5')pppN diphosphatase activity(GO:0050072) |
| 0.0 | 1.4 | GO:0008080 | N-acetyltransferase activity(GO:0008080) |
| 0.0 | 0.9 | GO:0035064 | methylated histone binding(GO:0035064) |
| 0.0 | 0.1 | GO:0097371 | MDM2/MDM4 family protein binding(GO:0097371) |
| 0.0 | 0.3 | GO:0017081 | chloride channel regulator activity(GO:0017081) |
| 0.0 | 0.1 | GO:0043183 | vascular endothelial growth factor receptor 1 binding(GO:0043183) |
| 0.0 | 0.0 | GO:0060001 | minus-end directed microfilament motor activity(GO:0060001) |
| 0.0 | 0.4 | GO:0000900 | translation repressor activity, nucleic acid binding(GO:0000900) |
| 0.0 | 0.0 | GO:0102344 | 3-hydroxy-behenoyl-CoA dehydratase activity(GO:0102344) 3-hydroxy-lignoceroyl-CoA dehydratase activity(GO:0102345) |
| 0.0 | 0.2 | GO:0004691 | cAMP-dependent protein kinase activity(GO:0004691) |
| 0.0 | 0.1 | GO:0004920 | interleukin-10 receptor activity(GO:0004920) |
| 0.0 | 0.4 | GO:0005184 | neuropeptide hormone activity(GO:0005184) |
| 0.0 | 0.1 | GO:0004749 | ribose phosphate diphosphokinase activity(GO:0004749) |
| 0.0 | 1.0 | GO:0004004 | RNA helicase activity(GO:0003724) ATP-dependent RNA helicase activity(GO:0004004) RNA-dependent ATPase activity(GO:0008186) |
| 0.0 | 0.0 | GO:0004450 | isocitrate dehydrogenase activity(GO:0004448) isocitrate dehydrogenase (NADP+) activity(GO:0004450) (R)-2-hydroxyglutarate dehydrogenase activity(GO:0051990) |
| 0.0 | 0.1 | GO:0070740 | tubulin-glutamic acid ligase activity(GO:0070740) |
| 0.0 | 0.1 | GO:0001094 | TFIID-class transcription factor binding(GO:0001094) |
| 0.0 | 0.2 | GO:0004791 | thioredoxin-disulfide reductase activity(GO:0004791) |
| 0.0 | 0.6 | GO:0017046 | peptide hormone binding(GO:0017046) |
| 0.0 | 0.0 | GO:0004677 | DNA-dependent protein kinase activity(GO:0004677) |
| 0.0 | 0.1 | GO:0004118 | cGMP-stimulated cyclic-nucleotide phosphodiesterase activity(GO:0004118) |
| 0.0 | 0.0 | GO:0071207 | histone pre-mRNA stem-loop binding(GO:0071207) |
| 0.0 | 0.1 | GO:0043199 | sulfate binding(GO:0043199) |
| 0.0 | 0.0 | GO:0071885 | N-terminal protein N-methyltransferase activity(GO:0071885) |
| 0.0 | 0.1 | GO:0004565 | beta-galactosidase activity(GO:0004565) |
| 0.0 | 0.2 | GO:0016854 | racemase and epimerase activity(GO:0016854) |
| 0.0 | 0.0 | GO:0098770 | FBXO family protein binding(GO:0098770) |
| 0.0 | 0.5 | GO:0015026 | coreceptor activity(GO:0015026) |
| 0.0 | 0.4 | GO:0044183 | protein binding involved in protein folding(GO:0044183) |
| 0.0 | 1.2 | GO:0001618 | virus receptor activity(GO:0001618) |
| 0.0 | 0.2 | GO:1990841 | promoter-specific chromatin binding(GO:1990841) |
| 0.0 | 0.4 | GO:0004364 | glutathione transferase activity(GO:0004364) |
| 0.0 | 0.2 | GO:0001223 | transcription coactivator binding(GO:0001223) |
Gene overrepresentation in curated gene sets: canonical pathways category:
| Log-likelihood per target | Total log-likelihood | Term | Description |
|---|---|---|---|
| 0.1 | 0.1 | PID S1P S1P1 PATHWAY | S1P1 pathway |
| 0.1 | 2.3 | PID HEDGEHOG 2PATHWAY | Signaling events mediated by the Hedgehog family |
| 0.1 | 1.3 | PID RANBP2 PATHWAY | Sumoylation by RanBP2 regulates transcriptional repression |
| 0.0 | 0.4 | PID INSULIN GLUCOSE PATHWAY | Insulin-mediated glucose transport |
| 0.0 | 0.2 | SIG PIP3 SIGNALING IN B LYMPHOCYTES | Genes related to PIP3 signaling in B lymphocytes |
| 0.0 | 0.1 | PID ERB GENOMIC PATHWAY | Validated nuclear estrogen receptor beta network |
| 0.0 | 0.7 | SA REG CASCADE OF CYCLIN EXPR | Expression of cyclins regulates progression through the cell cycle by activating cyclin-dependent kinases. |
| 0.0 | 2.3 | PID BMP PATHWAY | BMP receptor signaling |
| 0.0 | 0.6 | SA PROGRAMMED CELL DEATH | Programmed cell death, or apoptosis, eliminates damaged or unneeded cells. |
| 0.0 | 0.3 | PID ERBB1 RECEPTOR PROXIMAL PATHWAY | EGF receptor (ErbB1) signaling pathway |
| 0.0 | 0.6 | PID AURORA A PATHWAY | Aurora A signaling |
| 0.0 | 0.1 | PID IL12 STAT4 PATHWAY | IL12 signaling mediated by STAT4 |
| 0.0 | 0.7 | PID TOLL ENDOGENOUS PATHWAY | Endogenous TLR signaling |
| 0.0 | 1.2 | NABA COLLAGENS | Genes encoding collagen proteins |
| 0.0 | 0.6 | PID ARF 3PATHWAY | Arf1 pathway |
| 0.0 | 1.4 | PID ATF2 PATHWAY | ATF-2 transcription factor network |
| 0.0 | 0.2 | PID RHOA PATHWAY | RhoA signaling pathway |
| 0.0 | 0.2 | PID ARF6 DOWNSTREAM PATHWAY | Arf6 downstream pathway |
| 0.0 | 0.5 | PID P38 MK2 PATHWAY | p38 signaling mediated by MAPKAP kinases |
| 0.0 | 2.2 | PID SMAD2 3NUCLEAR PATHWAY | Regulation of nuclear SMAD2/3 signaling |
| 0.0 | 0.6 | PID IL27 PATHWAY | IL27-mediated signaling events |
| 0.0 | 0.6 | PID NFKAPPAB CANONICAL PATHWAY | Canonical NF-kappaB pathway |
| 0.0 | 0.3 | ST G ALPHA I PATHWAY | G alpha i Pathway |
| 0.0 | 0.4 | PID IL6 7 PATHWAY | IL6-mediated signaling events |
| 0.0 | 0.2 | PID EPHA2 FWD PATHWAY | EPHA2 forward signaling |
| 0.0 | 0.7 | PID HIV NEF PATHWAY | HIV-1 Nef: Negative effector of Fas and TNF-alpha |
| 0.0 | 0.4 | PID S1P S1P2 PATHWAY | S1P2 pathway |
| 0.0 | 0.1 | PID WNT SIGNALING PATHWAY | Wnt signaling network |
| 0.0 | 0.2 | PID PI3KCI AKT PATHWAY | Class I PI3K signaling events mediated by Akt |
| 0.0 | 0.2 | PID TCR JNK PATHWAY | JNK signaling in the CD4+ TCR pathway |
| 0.0 | 0.4 | PID SYNDECAN 4 PATHWAY | Syndecan-4-mediated signaling events |
| 0.0 | 0.7 | SIG INSULIN RECEPTOR PATHWAY IN CARDIAC MYOCYTES | Genes related to the insulin receptor pathway |
| 0.0 | 0.4 | PID NECTIN PATHWAY | Nectin adhesion pathway |
| 0.0 | 0.2 | PID MAPK TRK PATHWAY | Trk receptor signaling mediated by the MAPK pathway |
| 0.0 | 0.6 | PID TCR CALCIUM PATHWAY | Calcium signaling in the CD4+ TCR pathway |
| 0.0 | 0.6 | PID INTEGRIN A4B1 PATHWAY | Alpha4 beta1 integrin signaling events |
| 0.0 | 0.3 | PID PI3K PLC TRK PATHWAY | Trk receptor signaling mediated by PI3K and PLC-gamma |
| 0.0 | 0.1 | PID IL3 PATHWAY | IL3-mediated signaling events |
| 0.0 | 0.4 | PID RET PATHWAY | Signaling events regulated by Ret tyrosine kinase |
| 0.0 | 0.1 | PID TCR RAS PATHWAY | Ras signaling in the CD4+ TCR pathway |
| 0.0 | 0.5 | PID P38 ALPHA BETA DOWNSTREAM PATHWAY | Signaling mediated by p38-alpha and p38-beta |
| 0.0 | 0.3 | ST GA13 PATHWAY | G alpha 13 Pathway |
| 0.0 | 0.8 | PID PLK1 PATHWAY | PLK1 signaling events |
| 0.0 | 0.7 | PID ERBB1 INTERNALIZATION PATHWAY | Internalization of ErbB1 |
| 0.0 | 0.3 | PID EPHB FWD PATHWAY | EPHB forward signaling |
| 0.0 | 0.9 | PID RAC1 PATHWAY | RAC1 signaling pathway |
| 0.0 | 0.1 | SA G2 AND M PHASES | Cdc25 activates the cdc2/cyclin B complex to induce the G2/M transition. |
| 0.0 | 0.4 | PID ANGIOPOIETIN RECEPTOR PATHWAY | Angiopoietin receptor Tie2-mediated signaling |
| 0.0 | 0.2 | PID MYC PATHWAY | C-MYC pathway |
| 0.0 | 0.2 | PID IL2 STAT5 PATHWAY | IL2 signaling events mediated by STAT5 |
| 0.0 | 0.4 | NABA BASEMENT MEMBRANES | Genes encoding structural components of basement membranes |
| 0.0 | 0.3 | PID ATM PATHWAY | ATM pathway |
| 0.0 | 0.1 | PID PI3KCI PATHWAY | Class I PI3K signaling events |
| 0.0 | 0.3 | PID CONE PATHWAY | Visual signal transduction: Cones |
Gene overrepresentation in curated gene sets: REACTOME pathways category:
| Log-likelihood per target | Total log-likelihood | Term | Description |
|---|---|---|---|
| 0.1 | 1.8 | REACTOME SYNTHESIS OF PE | Genes involved in Synthesis of PE |
| 0.1 | 2.6 | REACTOME FORMATION OF INCISION COMPLEX IN GG NER | Genes involved in Formation of incision complex in GG-NER |
| 0.1 | 0.8 | REACTOME TRAF6 MEDIATED IRF7 ACTIVATION IN TLR7 8 OR 9 SIGNALING | Genes involved in TRAF6 mediated IRF7 activation in TLR7/8 or 9 signaling |
| 0.1 | 1.1 | REACTOME MITOCHONDRIAL FATTY ACID BETA OXIDATION | Genes involved in Mitochondrial Fatty Acid Beta-Oxidation |
| 0.1 | 1.5 | REACTOME REGULATION OF INSULIN LIKE GROWTH FACTOR IGF ACTIVITY BY INSULIN LIKE GROWTH FACTOR BINDING PROTEINS IGFBPS | Genes involved in Regulation of Insulin-like Growth Factor (IGF) Activity by Insulin-like Growth Factor Binding Proteins (IGFBPs) |
| 0.1 | 0.4 | REACTOME GLOBAL GENOMIC NER GG NER | Genes involved in Global Genomic NER (GG-NER) |
| 0.1 | 0.7 | REACTOME PROSTANOID LIGAND RECEPTORS | Genes involved in Prostanoid ligand receptors |
| 0.1 | 1.2 | REACTOME NOREPINEPHRINE NEUROTRANSMITTER RELEASE CYCLE | Genes involved in Norepinephrine Neurotransmitter Release Cycle |
| 0.1 | 0.1 | REACTOME DOWNREGULATION OF ERBB2 ERBB3 SIGNALING | Genes involved in Downregulation of ERBB2:ERBB3 signaling |
| 0.0 | 0.7 | REACTOME PROCESSIVE SYNTHESIS ON THE LAGGING STRAND | Genes involved in Processive synthesis on the lagging strand |
| 0.0 | 1.0 | REACTOME NOTCH HLH TRANSCRIPTION PATHWAY | Genes involved in Notch-HLH transcription pathway |
| 0.0 | 1.5 | REACTOME CASPASE MEDIATED CLEAVAGE OF CYTOSKELETAL PROTEINS | Genes involved in Caspase-mediated cleavage of cytoskeletal proteins |
| 0.0 | 0.4 | REACTOME APOBEC3G MEDIATED RESISTANCE TO HIV1 INFECTION | Genes involved in APOBEC3G mediated resistance to HIV-1 infection |
| 0.0 | 0.5 | REACTOME SYNTHESIS OF BILE ACIDS AND BILE SALTS VIA 24 HYDROXYCHOLESTEROL | Genes involved in Synthesis of bile acids and bile salts via 24-hydroxycholesterol |
| 0.0 | 0.7 | REACTOME SIGNAL ATTENUATION | Genes involved in Signal attenuation |
| 0.0 | 1.0 | REACTOME BRANCHED CHAIN AMINO ACID CATABOLISM | Genes involved in Branched-chain amino acid catabolism |
| 0.0 | 0.6 | REACTOME IL 6 SIGNALING | Genes involved in Interleukin-6 signaling |
| 0.0 | 0.3 | REACTOME ALPHA LINOLENIC ACID ALA METABOLISM | Genes involved in alpha-linolenic acid (ALA) metabolism |
| 0.0 | 0.6 | REACTOME GAMMA CARBOXYLATION TRANSPORT AND AMINO TERMINAL CLEAVAGE OF PROTEINS | Genes involved in Gamma-carboxylation, transport, and amino-terminal cleavage of proteins |
| 0.0 | 0.5 | REACTOME ROLE OF DCC IN REGULATING APOPTOSIS | Genes involved in Role of DCC in regulating apoptosis |
| 0.0 | 0.9 | REACTOME G1 S SPECIFIC TRANSCRIPTION | Genes involved in G1/S-Specific Transcription |
| 0.0 | 1.2 | REACTOME CHOLESTEROL BIOSYNTHESIS | Genes involved in Cholesterol biosynthesis |
| 0.0 | 0.7 | REACTOME G0 AND EARLY G1 | Genes involved in G0 and Early G1 |
| 0.0 | 0.8 | REACTOME PEROXISOMAL LIPID METABOLISM | Genes involved in Peroxisomal lipid metabolism |
| 0.0 | 0.7 | REACTOME TIE2 SIGNALING | Genes involved in Tie2 Signaling |
| 0.0 | 0.3 | REACTOME ASSOCIATION OF LICENSING FACTORS WITH THE PRE REPLICATIVE COMPLEX | Genes involved in Association of licensing factors with the pre-replicative complex |
| 0.0 | 0.7 | REACTOME POST CHAPERONIN TUBULIN FOLDING PATHWAY | Genes involved in Post-chaperonin tubulin folding pathway |
| 0.0 | 0.4 | REACTOME CALNEXIN CALRETICULIN CYCLE | Genes involved in Calnexin/calreticulin cycle |
| 0.0 | 0.6 | REACTOME PROTEOLYTIC CLEAVAGE OF SNARE COMPLEX PROTEINS | Genes involved in Proteolytic cleavage of SNARE complex proteins |
| 0.0 | 0.1 | REACTOME CONVERSION FROM APC C CDC20 TO APC C CDH1 IN LATE ANAPHASE | Genes involved in Conversion from APC/C:Cdc20 to APC/C:Cdh1 in late anaphase |
| 0.0 | 0.1 | REACTOME PKA MEDIATED PHOSPHORYLATION OF CREB | Genes involved in PKA-mediated phosphorylation of CREB |
| 0.0 | 0.1 | REACTOME G2 M DNA DAMAGE CHECKPOINT | Genes involved in G2/M DNA damage checkpoint |
| 0.0 | 11.8 | REACTOME GENERIC TRANSCRIPTION PATHWAY | Genes involved in Generic Transcription Pathway |
| 0.0 | 0.7 | REACTOME DOWNREGULATION OF TGF BETA RECEPTOR SIGNALING | Genes involved in Downregulation of TGF-beta receptor signaling |
| 0.0 | 0.7 | REACTOME CELL EXTRACELLULAR MATRIX INTERACTIONS | Genes involved in Cell-extracellular matrix interactions |
| 0.0 | 0.2 | REACTOME COPI MEDIATED TRANSPORT | Genes involved in COPI Mediated Transport |
| 0.0 | 0.2 | REACTOME NFKB IS ACTIVATED AND SIGNALS SURVIVAL | Genes involved in NF-kB is activated and signals survival |
| 0.0 | 0.5 | REACTOME GAP JUNCTION ASSEMBLY | Genes involved in Gap junction assembly |
| 0.0 | 0.3 | REACTOME REGULATION OF WATER BALANCE BY RENAL AQUAPORINS | Genes involved in Regulation of Water Balance by Renal Aquaporins |
| 0.0 | 0.2 | REACTOME THROMBOXANE SIGNALLING THROUGH TP RECEPTOR | Genes involved in Thromboxane signalling through TP receptor |
| 0.0 | 0.3 | REACTOME GLUTAMATE NEUROTRANSMITTER RELEASE CYCLE | Genes involved in Glutamate Neurotransmitter Release Cycle |
| 0.0 | 0.2 | REACTOME OPSINS | Genes involved in Opsins |
| 0.0 | 1.6 | REACTOME RESPIRATORY ELECTRON TRANSPORT | Genes involved in Respiratory electron transport |
| 0.0 | 0.8 | REACTOME GLUTATHIONE CONJUGATION | Genes involved in Glutathione conjugation |
| 0.0 | 1.3 | REACTOME GLUCAGON SIGNALING IN METABOLIC REGULATION | Genes involved in Glucagon signaling in metabolic regulation |
| 0.0 | 0.5 | REACTOME G ALPHA Z SIGNALLING EVENTS | Genes involved in G alpha (z) signalling events |
| 0.0 | 1.1 | REACTOME MEIOTIC SYNAPSIS | Genes involved in Meiotic Synapsis |
| 0.0 | 0.2 | REACTOME SIGNALING BY NOTCH3 | Genes involved in Signaling by NOTCH3 |
| 0.0 | 1.4 | REACTOME COLLAGEN FORMATION | Genes involved in Collagen formation |
| 0.0 | 1.1 | REACTOME CROSS PRESENTATION OF SOLUBLE EXOGENOUS ANTIGENS ENDOSOMES | Genes involved in Cross-presentation of soluble exogenous antigens (endosomes) |
| 0.0 | 1.8 | REACTOME MITOTIC PROMETAPHASE | Genes involved in Mitotic Prometaphase |
| 0.0 | 0.3 | REACTOME HORMONE SENSITIVE LIPASE HSL MEDIATED TRIACYLGLYCEROL HYDROLYSIS | Genes involved in Hormone-sensitive lipase (HSL)-mediated triacylglycerol hydrolysis |
| 0.0 | 0.3 | REACTOME BILE SALT AND ORGANIC ANION SLC TRANSPORTERS | Genes involved in Bile salt and organic anion SLC transporters |
| 0.0 | 1.2 | REACTOME LOSS OF NLP FROM MITOTIC CENTROSOMES | Genes involved in Loss of Nlp from mitotic centrosomes |
| 0.0 | 0.4 | REACTOME GENERATION OF SECOND MESSENGER MOLECULES | Genes involved in Generation of second messenger molecules |
| 0.0 | 0.3 | REACTOME SIGNALING BY NODAL | Genes involved in Signaling by NODAL |
| 0.0 | 0.3 | REACTOME PROLACTIN RECEPTOR SIGNALING | Genes involved in Prolactin receptor signaling |
| 0.0 | 0.5 | REACTOME SYNTHESIS AND INTERCONVERSION OF NUCLEOTIDE DI AND TRIPHOSPHATES | Genes involved in Synthesis and interconversion of nucleotide di- and triphosphates |
| 0.0 | 0.3 | REACTOME GLYCOGEN BREAKDOWN GLYCOGENOLYSIS | Genes involved in Glycogen breakdown (glycogenolysis) |
| 0.0 | 0.1 | REACTOME REGULATION OF THE FANCONI ANEMIA PATHWAY | Genes involved in Regulation of the Fanconi anemia pathway |
| 0.0 | 0.5 | REACTOME G1 PHASE | Genes involved in G1 Phase |
| 0.0 | 1.8 | REACTOME RESPONSE TO ELEVATED PLATELET CYTOSOLIC CA2 | Genes involved in Response to elevated platelet cytosolic Ca2+ |
| 0.0 | 0.4 | REACTOME SYNTHESIS OF VERY LONG CHAIN FATTY ACYL COAS | Genes involved in Synthesis of very long-chain fatty acyl-CoAs |
| 0.0 | 0.1 | REACTOME REGULATION OF ORNITHINE DECARBOXYLASE ODC | Genes involved in Regulation of ornithine decarboxylase (ODC) |
| 0.0 | 0.6 | REACTOME GLUCONEOGENESIS | Genes involved in Gluconeogenesis |
| 0.0 | 0.3 | REACTOME GABA SYNTHESIS RELEASE REUPTAKE AND DEGRADATION | Genes involved in GABA synthesis, release, reuptake and degradation |
| 0.0 | 0.2 | REACTOME ORGANIC CATION ANION ZWITTERION TRANSPORT | Genes involved in Organic cation/anion/zwitterion transport |
| 0.0 | 0.3 | REACTOME PHOSPHORYLATION OF CD3 AND TCR ZETA CHAINS | Genes involved in Phosphorylation of CD3 and TCR zeta chains |
| 0.0 | 0.1 | REACTOME P53 INDEPENDENT G1 S DNA DAMAGE CHECKPOINT | Genes involved in p53-Independent G1/S DNA damage checkpoint |
| 0.0 | 0.3 | REACTOME EXTRINSIC PATHWAY FOR APOPTOSIS | Genes involved in Extrinsic Pathway for Apoptosis |
| 0.0 | 0.3 | REACTOME ERK MAPK TARGETS | Genes involved in ERK/MAPK targets |
| 0.0 | 0.2 | REACTOME THE ACTIVATION OF ARYLSULFATASES | Genes involved in The activation of arylsulfatases |
| 0.0 | 0.3 | REACTOME SULFUR AMINO ACID METABOLISM | Genes involved in Sulfur amino acid metabolism |
| 0.0 | 0.2 | REACTOME SIGNALLING TO P38 VIA RIT AND RIN | Genes involved in Signalling to p38 via RIT and RIN |
| 0.0 | 0.1 | REACTOME FORMATION OF THE HIV1 EARLY ELONGATION COMPLEX | Genes involved in Formation of the HIV-1 Early Elongation Complex |