Project
Epithelial-Mesenchymal Transition, human (Scheel, 2011)
Navigation
Downloads
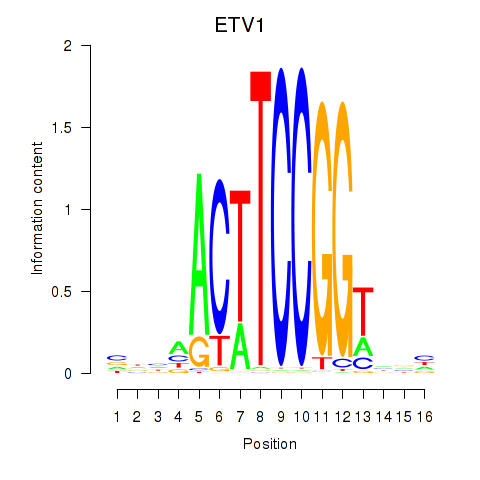
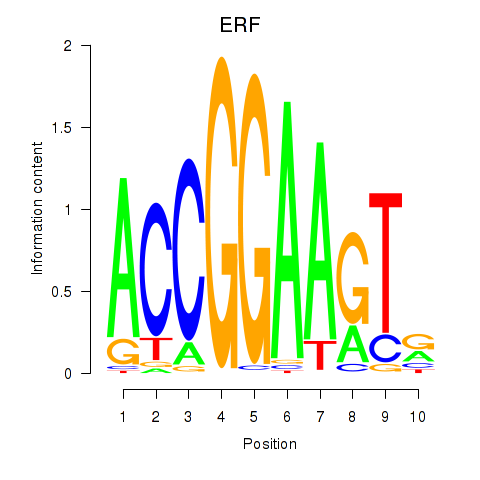
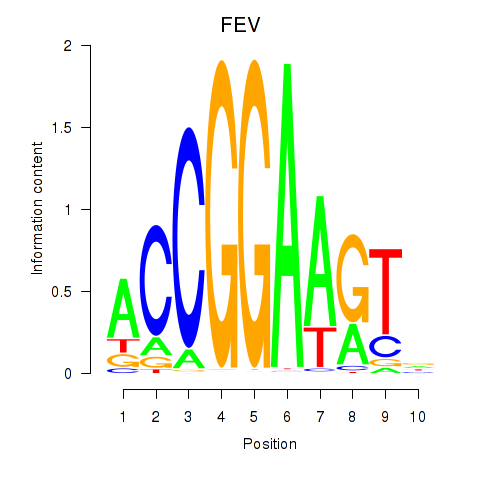
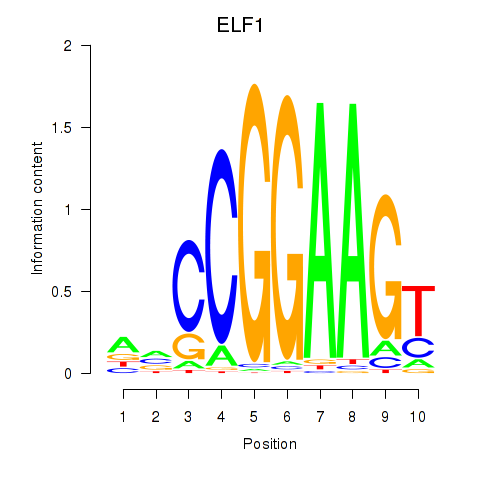
Results for ETV1_ERF_FEV_ELF1
Z-value: 1.42
Motif logo
Transcription factors associated with ETV1_ERF_FEV_ELF1
| Gene Symbol | Gene ID | Gene Info |
|---|---|---|
|
ETV1
|
ENSG00000006468.14 | ETS variant transcription factor 1 |
|
ERF
|
ENSG00000105722.10 | ETS2 repressor factor |
|
FEV
|
ENSG00000163497.3 | FEV transcription factor, ETS family member |
|
ELF1
|
ENSG00000120690.16 | E74 like ETS transcription factor 1 |
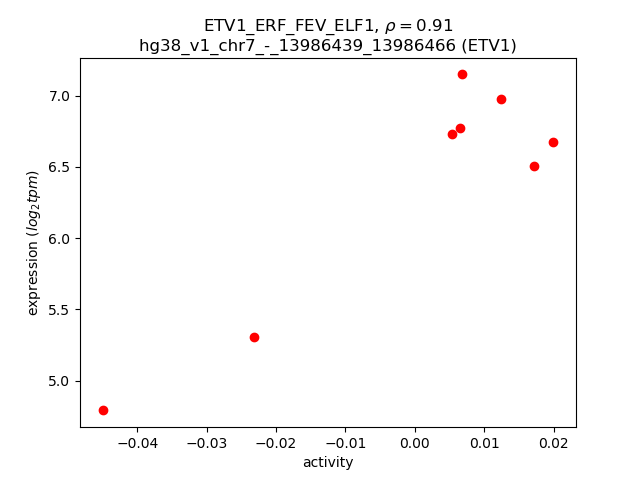
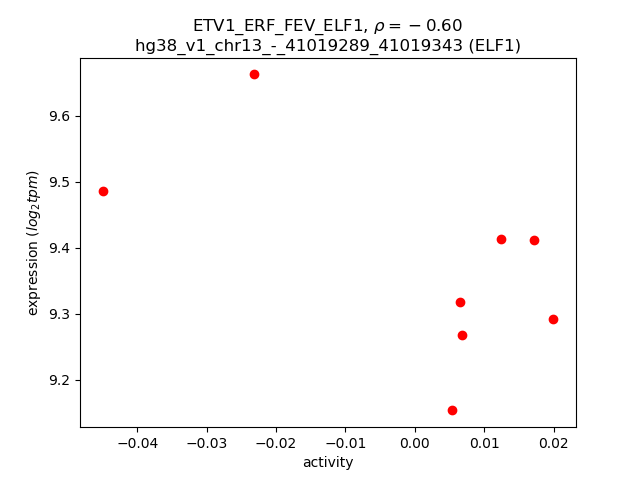
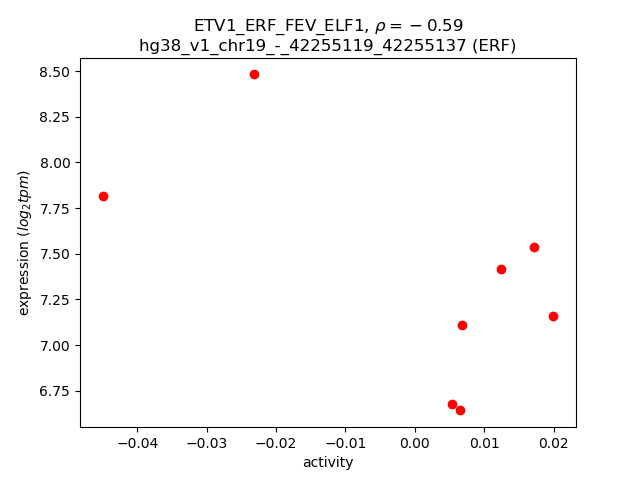
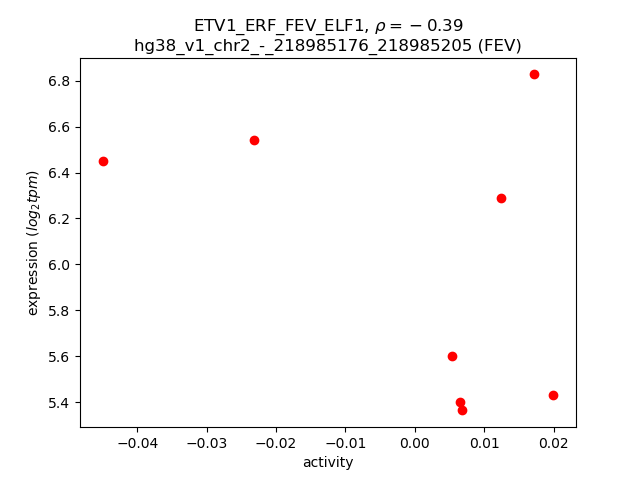
Activity-expression correlation:
| Gene | Promoter | Pearson corr. coef. | P-value | Plot |
|---|---|---|---|---|
| ETV1 | hg38_v1_chr7_-_13986439_13986466 | 0.91 | 1.5e-03 | Click! |
| ELF1 | hg38_v1_chr13_-_41019289_41019343 | -0.60 | 1.2e-01 | Click! |
| ERF | hg38_v1_chr19_-_42255119_42255137 | -0.59 | 1.2e-01 | Click! |
| FEV | hg38_v1_chr2_-_218985176_218985205 | -0.39 | 3.4e-01 | Click! |
Activity profile of ETV1_ERF_FEV_ELF1 motif
Sorted Z-values of ETV1_ERF_FEV_ELF1 motif
Network of associatons between targets according to the STRING database.

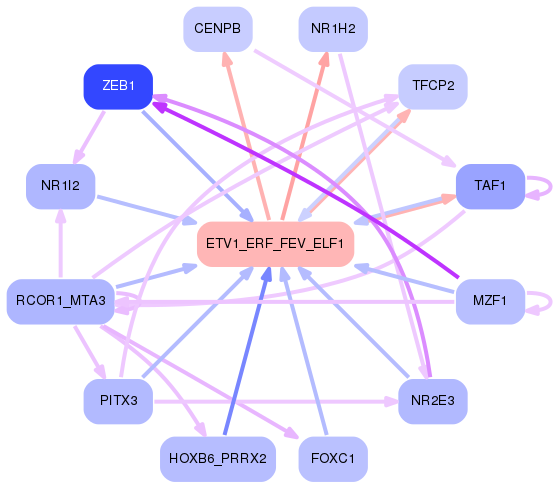
First level regulatory network of ETV1_ERF_FEV_ELF1
Gene Ontology Analysis
Gene overrepresentation in biological process category:
| Log-likelihood per target | Total log-likelihood | Term | Description |
|---|---|---|---|
| 0.8 | 2.5 | GO:0035638 | patched ligand maturation(GO:0007225) signal maturation(GO:0035638) |
| 0.7 | 3.0 | GO:0090301 | regulation of neural crest formation(GO:0090299) negative regulation of neural crest formation(GO:0090301) negative regulation of fibroblast growth factor receptor signaling pathway involved in neural plate anterior/posterior pattern formation(GO:2000314) |
| 0.6 | 4.5 | GO:0000720 | pyrimidine dimer repair by nucleotide-excision repair(GO:0000720) |
| 0.6 | 2.6 | GO:0018283 | metal incorporation into metallo-sulfur cluster(GO:0018282) iron incorporation into metallo-sulfur cluster(GO:0018283) |
| 0.6 | 3.2 | GO:0003065 | positive regulation of heart rate by epinephrine(GO:0003065) |
| 0.5 | 0.5 | GO:0018307 | enzyme active site formation(GO:0018307) |
| 0.5 | 3.9 | GO:0021678 | third ventricle development(GO:0021678) |
| 0.5 | 2.9 | GO:0006050 | mannosamine metabolic process(GO:0006050) N-acetylmannosamine metabolic process(GO:0006051) |
| 0.5 | 1.9 | GO:0034444 | regulation of plasma lipoprotein particle oxidation(GO:0034444) negative regulation of plasma lipoprotein particle oxidation(GO:0034445) |
| 0.5 | 1.4 | GO:0060661 | submandibular salivary gland formation(GO:0060661) hair follicle cell proliferation(GO:0071335) regulation of hair follicle cell proliferation(GO:0071336) positive regulation of hair follicle cell proliferation(GO:0071338) |
| 0.4 | 2.9 | GO:0018103 | protein C-linked glycosylation(GO:0018103) peptidyl-tryptophan modification(GO:0018211) protein C-linked glycosylation via tryptophan(GO:0018317) protein C-linked glycosylation via 2'-alpha-mannosyl-L-tryptophan(GO:0018406) |
| 0.4 | 1.2 | GO:2000537 | regulation of B cell chemotaxis(GO:2000537) positive regulation of B cell chemotaxis(GO:2000538) |
| 0.4 | 1.9 | GO:0090182 | regulation of secretion of lysosomal enzymes(GO:0090182) |
| 0.4 | 2.2 | GO:0097498 | endothelial tube lumen extension(GO:0097498) |
| 0.3 | 1.0 | GO:1904578 | response to thapsigargin(GO:1904578) cellular response to thapsigargin(GO:1904579) |
| 0.3 | 0.3 | GO:1903006 | regulation of protein K63-linked deubiquitination(GO:1903004) positive regulation of protein K63-linked deubiquitination(GO:1903006) |
| 0.3 | 2.6 | GO:0006290 | pyrimidine dimer repair(GO:0006290) |
| 0.3 | 2.3 | GO:2000825 | positive regulation of androgen receptor activity(GO:2000825) |
| 0.3 | 2.3 | GO:0006203 | dGTP catabolic process(GO:0006203) dATP catabolic process(GO:0046061) |
| 0.3 | 0.8 | GO:0042779 | tRNA 3'-trailer cleavage, endonucleolytic(GO:0034414) tRNA 3'-trailer cleavage(GO:0042779) |
| 0.3 | 0.8 | GO:0090285 | negative regulation of protein glycosylation in Golgi(GO:0090285) |
| 0.3 | 0.8 | GO:0090365 | regulation of mRNA modification(GO:0090365) |
| 0.3 | 1.8 | GO:0045079 | negative regulation of chemokine biosynthetic process(GO:0045079) |
| 0.3 | 1.0 | GO:1990166 | protein localization to site of double-strand break(GO:1990166) |
| 0.2 | 1.0 | GO:0006408 | snRNA export from nucleus(GO:0006408) |
| 0.2 | 0.7 | GO:1901896 | positive regulation of calcium-transporting ATPase activity(GO:1901896) |
| 0.2 | 0.7 | GO:2000097 | chronological cell aging(GO:0001300) regulation of smooth muscle cell-matrix adhesion(GO:2000097) |
| 0.2 | 1.0 | GO:0030821 | negative regulation of cyclic nucleotide catabolic process(GO:0030806) negative regulation of cAMP catabolic process(GO:0030821) |
| 0.2 | 1.2 | GO:0061428 | negative regulation of transcription from RNA polymerase II promoter in response to hypoxia(GO:0061428) |
| 0.2 | 1.2 | GO:0006933 | negative regulation of cell adhesion involved in substrate-bound cell migration(GO:0006933) |
| 0.2 | 2.8 | GO:0001302 | replicative cell aging(GO:0001302) |
| 0.2 | 0.9 | GO:0043311 | positive regulation of eosinophil degranulation(GO:0043311) positive regulation of eosinophil activation(GO:1902568) |
| 0.2 | 1.5 | GO:0016344 | meiotic chromosome movement towards spindle pole(GO:0016344) |
| 0.2 | 0.6 | GO:0090149 | mitochondrial membrane fission(GO:0090149) |
| 0.2 | 1.8 | GO:0070294 | renal sodium ion absorption(GO:0070294) |
| 0.2 | 0.6 | GO:0035674 | tricarboxylic acid transmembrane transport(GO:0035674) |
| 0.2 | 1.6 | GO:0034201 | response to oleic acid(GO:0034201) |
| 0.2 | 1.2 | GO:2000158 | positive regulation of ubiquitin-specific protease activity(GO:2000158) |
| 0.2 | 0.8 | GO:0006121 | mitochondrial electron transport, succinate to ubiquinone(GO:0006121) |
| 0.2 | 0.4 | GO:0010273 | detoxification of copper ion(GO:0010273) stress response to copper ion(GO:1990169) |
| 0.2 | 0.7 | GO:0021539 | subthalamus development(GO:0021539) |
| 0.2 | 0.9 | GO:0099590 | neurotransmitter receptor internalization(GO:0099590) |
| 0.2 | 0.6 | GO:0000350 | generation of catalytic spliceosome for second transesterification step(GO:0000350) |
| 0.2 | 0.5 | GO:2001153 | regulation of renal water transport(GO:2001151) positive regulation of renal water transport(GO:2001153) |
| 0.2 | 1.4 | GO:0060154 | cellular process regulating host cell cycle in response to virus(GO:0060154) |
| 0.2 | 0.7 | GO:1903756 | regulation of transcription from RNA polymerase II promoter by histone modification(GO:1903756) negative regulation of transcription from RNA polymerase II promoter by histone modification(GO:1903758) |
| 0.2 | 1.7 | GO:0048280 | vesicle fusion with Golgi apparatus(GO:0048280) |
| 0.2 | 1.2 | GO:0051344 | negative regulation of cyclic-nucleotide phosphodiesterase activity(GO:0051344) |
| 0.2 | 0.5 | GO:1904017 | cellular response to Thyroglobulin triiodothyronine(GO:1904017) |
| 0.2 | 1.0 | GO:0010796 | regulation of multivesicular body size(GO:0010796) |
| 0.2 | 0.8 | GO:0006420 | arginyl-tRNA aminoacylation(GO:0006420) |
| 0.2 | 1.1 | GO:1990592 | protein polyufmylation(GO:1990564) protein K69-linked ufmylation(GO:1990592) |
| 0.2 | 0.5 | GO:0002416 | IgG immunoglobulin transcytosis in epithelial cells mediated by FcRn immunoglobulin receptor(GO:0002416) |
| 0.2 | 0.5 | GO:0032304 | negative regulation of icosanoid secretion(GO:0032304) |
| 0.2 | 1.8 | GO:0035845 | photoreceptor cell outer segment organization(GO:0035845) |
| 0.1 | 0.1 | GO:0036245 | cellular response to menadione(GO:0036245) |
| 0.1 | 0.7 | GO:0044565 | dendritic cell proliferation(GO:0044565) |
| 0.1 | 1.9 | GO:0006662 | glycerol ether metabolic process(GO:0006662) |
| 0.1 | 2.4 | GO:0035878 | nail development(GO:0035878) |
| 0.1 | 0.3 | GO:0006447 | regulation of translational initiation by iron(GO:0006447) |
| 0.1 | 1.6 | GO:0043152 | induction of bacterial agglutination(GO:0043152) |
| 0.1 | 0.6 | GO:1904980 | positive regulation of endosome organization(GO:1904980) |
| 0.1 | 0.1 | GO:0046070 | dGTP metabolic process(GO:0046070) |
| 0.1 | 2.1 | GO:0016559 | peroxisome fission(GO:0016559) |
| 0.1 | 0.4 | GO:0032712 | negative regulation of interleukin-3 production(GO:0032712) negative regulation of granulocyte colony-stimulating factor production(GO:0071656) negative regulation of macrophage colony-stimulating factor production(GO:1901257) |
| 0.1 | 0.7 | GO:0007228 | positive regulation of hh target transcription factor activity(GO:0007228) |
| 0.1 | 0.4 | GO:0090234 | regulation of kinetochore assembly(GO:0090234) |
| 0.1 | 0.4 | GO:2000642 | negative regulation of early endosome to late endosome transport(GO:2000642) |
| 0.1 | 0.4 | GO:1903422 | negative regulation of synaptic vesicle recycling(GO:1903422) negative regulation of membrane invagination(GO:1905154) calcium ion regulated lysosome exocytosis(GO:1990927) |
| 0.1 | 0.4 | GO:1903722 | regulation of centriole elongation(GO:1903722) |
| 0.1 | 0.5 | GO:0019355 | nicotinamide nucleotide biosynthetic process from aspartate(GO:0019355) 'de novo' NAD biosynthetic process from aspartate(GO:0034628) |
| 0.1 | 1.0 | GO:0090625 | mRNA cleavage involved in gene silencing by siRNA(GO:0090625) |
| 0.1 | 0.5 | GO:0018106 | peptidyl-histidine phosphorylation(GO:0018106) |
| 0.1 | 0.7 | GO:0060399 | positive regulation of growth hormone receptor signaling pathway(GO:0060399) |
| 0.1 | 0.6 | GO:2000286 | receptor internalization involved in canonical Wnt signaling pathway(GO:2000286) |
| 0.1 | 2.9 | GO:0042135 | neurotransmitter catabolic process(GO:0042135) |
| 0.1 | 0.4 | GO:0042631 | cellular response to water deprivation(GO:0042631) |
| 0.1 | 0.5 | GO:0097155 | fasciculation of sensory neuron axon(GO:0097155) |
| 0.1 | 0.5 | GO:0060800 | regulation of cell differentiation involved in embryonic placenta development(GO:0060800) |
| 0.1 | 0.7 | GO:0019276 | UDP-N-acetylgalactosamine metabolic process(GO:0019276) |
| 0.1 | 0.6 | GO:0070086 | ubiquitin-dependent endocytosis(GO:0070086) |
| 0.1 | 0.7 | GO:2000189 | positive regulation of cholesterol homeostasis(GO:2000189) |
| 0.1 | 0.3 | GO:0072248 | metanephric glomerular epithelium development(GO:0072244) metanephric glomerular visceral epithelial cell differentiation(GO:0072248) metanephric glomerular visceral epithelial cell development(GO:0072249) metanephric glomerular epithelial cell differentiation(GO:0072312) metanephric glomerular epithelial cell development(GO:0072313) |
| 0.1 | 0.3 | GO:1901491 | negative regulation of lymphangiogenesis(GO:1901491) |
| 0.1 | 0.7 | GO:1903378 | positive regulation of oxidative stress-induced neuron intrinsic apoptotic signaling pathway(GO:1903378) |
| 0.1 | 0.3 | GO:1901668 | regulation of superoxide dismutase activity(GO:1901668) |
| 0.1 | 0.5 | GO:0010847 | regulation of chromatin assembly(GO:0010847) |
| 0.1 | 0.5 | GO:0016480 | negative regulation of transcription from RNA polymerase III promoter(GO:0016480) |
| 0.1 | 0.5 | GO:1902626 | assembly of large subunit precursor of preribosome(GO:1902626) |
| 0.1 | 0.2 | GO:0051030 | snRNA transport(GO:0051030) |
| 0.1 | 0.4 | GO:0006617 | SRP-dependent cotranslational protein targeting to membrane, signal sequence recognition(GO:0006617) |
| 0.1 | 1.9 | GO:0032785 | negative regulation of DNA-templated transcription, elongation(GO:0032785) |
| 0.1 | 1.4 | GO:0015074 | DNA integration(GO:0015074) |
| 0.1 | 1.0 | GO:0034141 | positive regulation of toll-like receptor 3 signaling pathway(GO:0034141) |
| 0.1 | 1.8 | GO:0045116 | protein neddylation(GO:0045116) |
| 0.1 | 0.3 | GO:0060266 | negative regulation of respiratory burst involved in inflammatory response(GO:0060266) |
| 0.1 | 0.3 | GO:1903259 | exon-exon junction complex disassembly(GO:1903259) |
| 0.1 | 0.8 | GO:0017062 | respiratory chain complex III assembly(GO:0017062) mitochondrial respiratory chain complex III assembly(GO:0034551) |
| 0.1 | 0.3 | GO:2000182 | regulation of interleukin-1 biosynthetic process(GO:0045360) positive regulation of interleukin-1 biosynthetic process(GO:0045362) interleukin-1 beta biosynthetic process(GO:0050720) response to interleukin-8(GO:0098758) cellular response to interleukin-8(GO:0098759) regulation of progesterone biosynthetic process(GO:2000182) |
| 0.1 | 1.5 | GO:0034498 | early endosome to Golgi transport(GO:0034498) |
| 0.1 | 0.2 | GO:1990180 | mitochondrial tRNA 3'-end processing(GO:1990180) |
| 0.1 | 0.4 | GO:0071955 | recycling endosome to Golgi transport(GO:0071955) |
| 0.1 | 0.1 | GO:0050653 | chondroitin sulfate proteoglycan biosynthetic process, polysaccharide chain biosynthetic process(GO:0050653) |
| 0.1 | 0.2 | GO:1902824 | positive regulation of late endosome to lysosome transport(GO:1902824) |
| 0.1 | 0.3 | GO:0019520 | aldonic acid metabolic process(GO:0019520) D-gluconate metabolic process(GO:0019521) |
| 0.1 | 1.1 | GO:0070914 | UV-damage excision repair(GO:0070914) |
| 0.1 | 0.5 | GO:1904306 | regulation of gastro-intestinal system smooth muscle contraction(GO:1904304) positive regulation of gastro-intestinal system smooth muscle contraction(GO:1904306) |
| 0.1 | 1.4 | GO:0046051 | UTP metabolic process(GO:0046051) |
| 0.1 | 0.2 | GO:1902766 | skeletal muscle satellite cell migration(GO:1902766) |
| 0.1 | 0.5 | GO:1902897 | regulation of postsynaptic density protein 95 clustering(GO:1902897) |
| 0.1 | 1.6 | GO:0033617 | mitochondrial respiratory chain complex IV assembly(GO:0033617) |
| 0.1 | 0.4 | GO:0010793 | regulation of mRNA export from nucleus(GO:0010793) |
| 0.1 | 0.8 | GO:0016255 | attachment of GPI anchor to protein(GO:0016255) |
| 0.1 | 1.8 | GO:0032515 | negative regulation of phosphoprotein phosphatase activity(GO:0032515) |
| 0.1 | 4.3 | GO:0000413 | protein peptidyl-prolyl isomerization(GO:0000413) |
| 0.1 | 0.5 | GO:0061624 | fructose catabolic process(GO:0006001) fructose catabolic process to hydroxyacetone phosphate and glyceraldehyde-3-phosphate(GO:0061624) |
| 0.1 | 0.4 | GO:0016240 | autophagosome docking(GO:0016240) |
| 0.1 | 0.6 | GO:0000707 | meiotic DNA recombinase assembly(GO:0000707) |
| 0.1 | 2.1 | GO:0044804 | nucleophagy(GO:0044804) |
| 0.1 | 0.3 | GO:0036496 | regulation of translational initiation by eIF2 alpha dephosphorylation(GO:0036496) |
| 0.1 | 1.0 | GO:0000290 | deadenylation-dependent decapping of nuclear-transcribed mRNA(GO:0000290) |
| 0.1 | 0.4 | GO:0018094 | protein polyglycylation(GO:0018094) |
| 0.1 | 1.1 | GO:0000244 | spliceosomal tri-snRNP complex assembly(GO:0000244) |
| 0.1 | 0.2 | GO:0042412 | taurine biosynthetic process(GO:0042412) |
| 0.1 | 1.6 | GO:0000028 | ribosomal small subunit assembly(GO:0000028) |
| 0.1 | 0.4 | GO:2000346 | negative regulation of hepatocyte proliferation(GO:2000346) |
| 0.1 | 1.3 | GO:2000480 | negative regulation of cAMP-dependent protein kinase activity(GO:2000480) |
| 0.1 | 0.3 | GO:0090035 | regulation of chaperone-mediated protein complex assembly(GO:0090034) positive regulation of chaperone-mediated protein complex assembly(GO:0090035) |
| 0.1 | 0.2 | GO:0061511 | centriole elongation(GO:0061511) |
| 0.1 | 0.3 | GO:0051643 | endoplasmic reticulum localization(GO:0051643) |
| 0.1 | 0.3 | GO:0033512 | L-lysine catabolic process to acetyl-CoA via saccharopine(GO:0033512) |
| 0.1 | 0.2 | GO:1904868 | telomerase catalytic core complex assembly(GO:1904868) regulation of telomerase catalytic core complex assembly(GO:1904882) positive regulation of telomerase catalytic core complex assembly(GO:1904884) |
| 0.1 | 0.2 | GO:0006566 | threonine metabolic process(GO:0006566) |
| 0.1 | 2.0 | GO:0048490 | anterograde synaptic vesicle transport(GO:0048490) synaptic vesicle cytoskeletal transport(GO:0099514) synaptic vesicle transport along microtubule(GO:0099517) |
| 0.1 | 0.3 | GO:0015910 | peroxisomal long-chain fatty acid import(GO:0015910) |
| 0.1 | 0.6 | GO:0051001 | negative regulation of nitric-oxide synthase activity(GO:0051001) |
| 0.1 | 0.4 | GO:0019255 | glucosamine metabolic process(GO:0006041) glucose 1-phosphate metabolic process(GO:0019255) |
| 0.1 | 0.2 | GO:0032058 | positive regulation of translational initiation in response to stress(GO:0032058) cellular response to UV-C(GO:0071494) |
| 0.1 | 1.5 | GO:0016558 | protein import into peroxisome matrix(GO:0016558) |
| 0.1 | 0.3 | GO:0097056 | selenocysteinyl-tRNA(Sec) biosynthetic process(GO:0097056) |
| 0.1 | 0.4 | GO:0010757 | negative regulation of plasminogen activation(GO:0010757) |
| 0.1 | 1.2 | GO:0031665 | negative regulation of lipopolysaccharide-mediated signaling pathway(GO:0031665) |
| 0.1 | 0.2 | GO:0009051 | pentose-phosphate shunt, oxidative branch(GO:0009051) |
| 0.1 | 0.9 | GO:0030157 | pancreatic juice secretion(GO:0030157) |
| 0.1 | 0.5 | GO:0070164 | negative regulation of adiponectin secretion(GO:0070164) |
| 0.1 | 2.0 | GO:0051131 | chaperone-mediated protein complex assembly(GO:0051131) |
| 0.1 | 0.4 | GO:0051771 | negative regulation of nitric-oxide synthase biosynthetic process(GO:0051771) |
| 0.1 | 1.1 | GO:0006020 | inositol metabolic process(GO:0006020) |
| 0.1 | 0.6 | GO:1901525 | negative regulation of macromitophagy(GO:1901525) |
| 0.1 | 0.2 | GO:0016334 | morphogenesis of follicular epithelium(GO:0016333) establishment or maintenance of polarity of follicular epithelium(GO:0016334) establishment of planar polarity of follicular epithelium(GO:0042247) |
| 0.1 | 0.7 | GO:0070862 | negative regulation of protein exit from endoplasmic reticulum(GO:0070862) negative regulation of retrograde protein transport, ER to cytosol(GO:1904153) |
| 0.1 | 0.3 | GO:1903361 | protein localization to basolateral plasma membrane(GO:1903361) |
| 0.1 | 0.2 | GO:0001927 | exocyst assembly(GO:0001927) |
| 0.1 | 0.8 | GO:0007288 | sperm axoneme assembly(GO:0007288) |
| 0.1 | 0.2 | GO:0034139 | regulation of toll-like receptor 3 signaling pathway(GO:0034139) |
| 0.1 | 0.2 | GO:1900227 | positive regulation of NLRP3 inflammasome complex assembly(GO:1900227) |
| 0.1 | 0.6 | GO:0098535 | de novo centriole assembly(GO:0098535) |
| 0.1 | 1.6 | GO:0043101 | purine-containing compound salvage(GO:0043101) |
| 0.1 | 0.2 | GO:0032792 | negative regulation of CREB transcription factor activity(GO:0032792) |
| 0.1 | 0.4 | GO:2000814 | regulation of unidimensional cell growth(GO:0051510) negative regulation of unidimensional cell growth(GO:0051511) establishment of cell polarity regulating cell shape(GO:0071964) regulation of establishment or maintenance of cell polarity regulating cell shape(GO:2000769) positive regulation of establishment or maintenance of cell polarity regulating cell shape(GO:2000771) regulation of establishment of cell polarity regulating cell shape(GO:2000782) positive regulation of establishment of cell polarity regulating cell shape(GO:2000784) positive regulation of barbed-end actin filament capping(GO:2000814) |
| 0.1 | 0.7 | GO:0015986 | energy coupled proton transport, down electrochemical gradient(GO:0015985) ATP synthesis coupled proton transport(GO:0015986) |
| 0.1 | 0.2 | GO:0044313 | protein K6-linked deubiquitination(GO:0044313) |
| 0.1 | 0.2 | GO:0046203 | spermidine catabolic process(GO:0046203) |
| 0.1 | 0.2 | GO:1903033 | regulation of microtubule plus-end binding(GO:1903031) positive regulation of microtubule plus-end binding(GO:1903033) |
| 0.1 | 0.4 | GO:1900748 | positive regulation of vascular endothelial growth factor signaling pathway(GO:1900748) |
| 0.1 | 0.2 | GO:0043323 | regulation of natural killer cell degranulation(GO:0043321) positive regulation of natural killer cell degranulation(GO:0043323) |
| 0.1 | 1.6 | GO:0045948 | positive regulation of translational initiation(GO:0045948) |
| 0.1 | 0.1 | GO:1901857 | positive regulation of cellular respiration(GO:1901857) |
| 0.1 | 0.5 | GO:1901727 | positive regulation of histone deacetylase activity(GO:1901727) |
| 0.1 | 0.2 | GO:0048162 | preantral ovarian follicle growth(GO:0001546) multi-layer follicle stage(GO:0048162) |
| 0.1 | 0.3 | GO:1902774 | late endosome to lysosome transport(GO:1902774) |
| 0.1 | 0.2 | GO:0048213 | Golgi vesicle prefusion complex stabilization(GO:0048213) |
| 0.0 | 0.6 | GO:1902083 | negative regulation of peptidyl-cysteine S-nitrosylation(GO:1902083) |
| 0.0 | 0.2 | GO:0098789 | pre-mRNA cleavage required for polyadenylation(GO:0098789) |
| 0.0 | 0.4 | GO:0097500 | receptor localization to nonmotile primary cilium(GO:0097500) |
| 0.0 | 0.4 | GO:2001106 | regulation of Rho guanyl-nucleotide exchange factor activity(GO:2001106) |
| 0.0 | 1.4 | GO:0071447 | cellular response to hydroperoxide(GO:0071447) |
| 0.0 | 0.2 | GO:0046619 | optic placode formation(GO:0001743) optic placode formation involved in camera-type eye formation(GO:0046619) |
| 0.0 | 0.5 | GO:1903944 | regulation of hepatocyte apoptotic process(GO:1903943) negative regulation of hepatocyte apoptotic process(GO:1903944) |
| 0.0 | 0.2 | GO:0048936 | peripheral nervous system neuron axonogenesis(GO:0048936) |
| 0.0 | 0.1 | GO:1900190 | biofilm formation(GO:0042710) single-species biofilm formation(GO:0044010) single-species biofilm formation in or on host organism(GO:0044407) regulation of single-species biofilm formation(GO:1900190) negative regulation of single-species biofilm formation(GO:1900191) regulation of single-species biofilm formation in or on host organism(GO:1900228) negative regulation of single-species biofilm formation in or on host organism(GO:1900229) |
| 0.0 | 0.9 | GO:0045899 | positive regulation of RNA polymerase II transcriptional preinitiation complex assembly(GO:0045899) |
| 0.0 | 0.0 | GO:0010726 | positive regulation of hydrogen peroxide metabolic process(GO:0010726) |
| 0.0 | 0.1 | GO:1902525 | regulation of protein monoubiquitination(GO:1902525) |
| 0.0 | 0.4 | GO:0075525 | viral translational termination-reinitiation(GO:0075525) |
| 0.0 | 0.6 | GO:0043983 | histone H4-K12 acetylation(GO:0043983) |
| 0.0 | 0.3 | GO:0061743 | motor learning(GO:0061743) |
| 0.0 | 0.4 | GO:0030242 | pexophagy(GO:0030242) |
| 0.0 | 0.4 | GO:1902857 | positive regulation of nonmotile primary cilium assembly(GO:1902857) |
| 0.0 | 0.1 | GO:0090135 | actin filament branching(GO:0090135) |
| 0.0 | 4.3 | GO:0042147 | retrograde transport, endosome to Golgi(GO:0042147) |
| 0.0 | 0.2 | GO:0071418 | cellular response to amine stimulus(GO:0071418) |
| 0.0 | 0.2 | GO:0006550 | isoleucine catabolic process(GO:0006550) |
| 0.0 | 1.2 | GO:0031063 | regulation of histone deacetylation(GO:0031063) |
| 0.0 | 0.3 | GO:0070940 | dephosphorylation of RNA polymerase II C-terminal domain(GO:0070940) |
| 0.0 | 0.4 | GO:2000270 | negative regulation of fibroblast apoptotic process(GO:2000270) |
| 0.0 | 0.4 | GO:0000447 | endonucleolytic cleavage in ITS1 to separate SSU-rRNA from 5.8S rRNA and LSU-rRNA from tricistronic rRNA transcript (SSU-rRNA, 5.8S rRNA, LSU-rRNA)(GO:0000447) |
| 0.0 | 0.1 | GO:2000439 | positive regulation of monocyte extravasation(GO:2000439) |
| 0.0 | 0.4 | GO:0051013 | microtubule severing(GO:0051013) |
| 0.0 | 0.1 | GO:1905244 | regulation of modification of synaptic structure(GO:1905244) |
| 0.0 | 0.1 | GO:1900110 | negative regulation of histone H3-K9 dimethylation(GO:1900110) negative regulation of histone H4-K16 acetylation(GO:2000619) |
| 0.0 | 0.5 | GO:0060059 | embryonic retina morphogenesis in camera-type eye(GO:0060059) |
| 0.0 | 0.4 | GO:0010724 | regulation of definitive erythrocyte differentiation(GO:0010724) |
| 0.0 | 1.3 | GO:0000715 | nucleotide-excision repair, DNA damage recognition(GO:0000715) |
| 0.0 | 0.3 | GO:0045007 | depurination(GO:0045007) |
| 0.0 | 0.1 | GO:0036292 | DNA rewinding(GO:0036292) |
| 0.0 | 0.6 | GO:0060632 | regulation of microtubule-based movement(GO:0060632) |
| 0.0 | 0.7 | GO:0032625 | interleukin-21 production(GO:0032625) interleukin-21 secretion(GO:0072619) |
| 0.0 | 0.2 | GO:0039506 | modulation by virus of host molecular function(GO:0039506) suppression by virus of host molecular function(GO:0039507) suppression by virus of host catalytic activity(GO:0039513) modulation by virus of host catalytic activity(GO:0039516) suppression by virus of host cysteine-type endopeptidase activity involved in apoptotic process(GO:0039650) negative regulation by symbiont of host catalytic activity(GO:0052053) negative regulation by symbiont of host molecular function(GO:0052056) modulation by symbiont of host catalytic activity(GO:0052148) |
| 0.0 | 0.9 | GO:0090190 | positive regulation of branching involved in ureteric bud morphogenesis(GO:0090190) |
| 0.0 | 0.2 | GO:2000812 | regulation of barbed-end actin filament capping(GO:2000812) |
| 0.0 | 0.2 | GO:0006102 | isocitrate metabolic process(GO:0006102) |
| 0.0 | 0.1 | GO:0002384 | hepatic immune response(GO:0002384) |
| 0.0 | 0.2 | GO:1903265 | positive regulation of tumor necrosis factor-mediated signaling pathway(GO:1903265) |
| 0.0 | 0.1 | GO:0000415 | negative regulation of histone H3-K36 methylation(GO:0000415) |
| 0.0 | 0.2 | GO:1902231 | positive regulation of intrinsic apoptotic signaling pathway in response to DNA damage(GO:1902231) |
| 0.0 | 0.2 | GO:0021966 | corticospinal neuron axon guidance(GO:0021966) |
| 0.0 | 0.1 | GO:0002636 | positive regulation of germinal center formation(GO:0002636) |
| 0.0 | 1.4 | GO:0034314 | Arp2/3 complex-mediated actin nucleation(GO:0034314) |
| 0.0 | 0.1 | GO:0070370 | heat acclimation(GO:0010286) cellular heat acclimation(GO:0070370) |
| 0.0 | 0.1 | GO:0051463 | negative regulation of cortisol secretion(GO:0051463) |
| 0.0 | 0.4 | GO:0015846 | polyamine transport(GO:0015846) |
| 0.0 | 0.3 | GO:1903800 | positive regulation of production of miRNAs involved in gene silencing by miRNA(GO:1903800) |
| 0.0 | 0.3 | GO:0010936 | negative regulation of macrophage cytokine production(GO:0010936) |
| 0.0 | 0.1 | GO:0090027 | negative regulation of monocyte chemotaxis(GO:0090027) |
| 0.0 | 0.4 | GO:0042276 | error-prone translesion synthesis(GO:0042276) |
| 0.0 | 0.5 | GO:0002315 | marginal zone B cell differentiation(GO:0002315) |
| 0.0 | 0.4 | GO:0051601 | exocyst localization(GO:0051601) |
| 0.0 | 0.1 | GO:0006556 | S-adenosylmethionine biosynthetic process(GO:0006556) |
| 0.0 | 0.3 | GO:0033088 | regulation of immature T cell proliferation in thymus(GO:0033084) negative regulation of immature T cell proliferation in thymus(GO:0033088) |
| 0.0 | 0.4 | GO:0042998 | positive regulation of Golgi to plasma membrane protein transport(GO:0042998) |
| 0.0 | 0.2 | GO:0019075 | virus maturation(GO:0019075) |
| 0.0 | 1.3 | GO:0000188 | inactivation of MAPK activity(GO:0000188) |
| 0.0 | 1.5 | GO:0032008 | positive regulation of TOR signaling(GO:0032008) |
| 0.0 | 0.6 | GO:0061162 | establishment of monopolar cell polarity(GO:0061162) establishment or maintenance of monopolar cell polarity(GO:0061339) |
| 0.0 | 0.6 | GO:0070987 | error-free translesion synthesis(GO:0070987) |
| 0.0 | 0.1 | GO:0016476 | regulation of embryonic cell shape(GO:0016476) |
| 0.0 | 0.2 | GO:0051414 | response to cortisol(GO:0051414) |
| 0.0 | 0.7 | GO:0006388 | tRNA splicing, via endonucleolytic cleavage and ligation(GO:0006388) |
| 0.0 | 0.2 | GO:0043137 | DNA replication, removal of RNA primer(GO:0043137) |
| 0.0 | 0.1 | GO:0050717 | positive regulation of interleukin-1 alpha production(GO:0032730) positive regulation of interleukin-1 alpha secretion(GO:0050717) |
| 0.0 | 0.0 | GO:1902990 | mitotic telomere maintenance via semi-conservative replication(GO:1902990) |
| 0.0 | 0.2 | GO:0036438 | maintenance of lens transparency(GO:0036438) |
| 0.0 | 0.6 | GO:1901748 | leukotriene D4 metabolic process(GO:1901748) leukotriene D4 biosynthetic process(GO:1901750) |
| 0.0 | 0.1 | GO:0018364 | peptidyl-glutamine methylation(GO:0018364) |
| 0.0 | 0.1 | GO:0006740 | NADPH regeneration(GO:0006740) |
| 0.0 | 0.0 | GO:0061110 | dense core granule biogenesis(GO:0061110) regulation of dense core granule biogenesis(GO:2000705) |
| 0.0 | 1.7 | GO:0042993 | positive regulation of transcription factor import into nucleus(GO:0042993) |
| 0.0 | 0.3 | GO:0010626 | regulation of Schwann cell proliferation(GO:0010624) negative regulation of Schwann cell proliferation(GO:0010626) |
| 0.0 | 0.1 | GO:0002188 | translation reinitiation(GO:0002188) |
| 0.0 | 0.5 | GO:2001214 | positive regulation of vasculogenesis(GO:2001214) |
| 0.0 | 0.2 | GO:0032534 | regulation of microvillus assembly(GO:0032534) |
| 0.0 | 2.2 | GO:1902017 | regulation of cilium assembly(GO:1902017) |
| 0.0 | 0.3 | GO:0035542 | regulation of SNARE complex assembly(GO:0035542) |
| 0.0 | 0.1 | GO:0001692 | histamine metabolic process(GO:0001692) |
| 0.0 | 0.2 | GO:0050703 | interleukin-1 alpha production(GO:0032610) interleukin-1 alpha secretion(GO:0050703) |
| 0.0 | 0.3 | GO:0017185 | peptidyl-lysine hydroxylation(GO:0017185) |
| 0.0 | 0.1 | GO:2000078 | positive regulation of type B pancreatic cell development(GO:2000078) |
| 0.0 | 0.8 | GO:0090383 | phagosome acidification(GO:0090383) |
| 0.0 | 0.1 | GO:1903232 | melanosome assembly(GO:1903232) |
| 0.0 | 0.4 | GO:0001514 | selenocysteine incorporation(GO:0001514) translational readthrough(GO:0006451) |
| 0.0 | 0.2 | GO:1903608 | protein localization to cytoplasmic stress granule(GO:1903608) |
| 0.0 | 0.4 | GO:0035646 | endosome to melanosome transport(GO:0035646) endosome to pigment granule transport(GO:0043485) pigment granule maturation(GO:0048757) |
| 0.0 | 0.1 | GO:0005986 | sucrose biosynthetic process(GO:0005986) |
| 0.0 | 0.3 | GO:0046838 | phosphorylated carbohydrate dephosphorylation(GO:0046838) inositol phosphate dephosphorylation(GO:0046855) |
| 0.0 | 0.2 | GO:0035694 | mitochondrial protein catabolic process(GO:0035694) |
| 0.0 | 3.6 | GO:0006614 | SRP-dependent cotranslational protein targeting to membrane(GO:0006614) |
| 0.0 | 0.1 | GO:0006620 | posttranslational protein targeting to membrane(GO:0006620) |
| 0.0 | 0.1 | GO:0010430 | fatty acid omega-oxidation(GO:0010430) |
| 0.0 | 0.4 | GO:0045023 | G0 to G1 transition(GO:0045023) |
| 0.0 | 0.1 | GO:0044007 | negative regulation of transcription from RNA polymerase II promoter in response to UV-induced DNA damage(GO:0010768) transmission of virus(GO:0019089) dissemination or transmission of symbiont from host(GO:0044007) dissemination or transmission of organism from other organism involved in symbiotic interaction(GO:0051821) |
| 0.0 | 0.2 | GO:0002353 | kinin cascade(GO:0002254) plasma kallikrein-kinin cascade(GO:0002353) |
| 0.0 | 0.2 | GO:0035879 | plasma membrane lactate transport(GO:0035879) |
| 0.0 | 0.2 | GO:0046146 | tetrahydrobiopterin biosynthetic process(GO:0006729) tetrahydrobiopterin metabolic process(GO:0046146) |
| 0.0 | 0.1 | GO:0014810 | positive regulation of skeletal muscle contraction by regulation of release of sequestered calcium ion(GO:0014810) |
| 0.0 | 0.1 | GO:0035873 | lactate transport(GO:0015727) lactate transmembrane transport(GO:0035873) |
| 0.0 | 0.1 | GO:1990502 | dense core granule maturation(GO:1990502) |
| 0.0 | 0.1 | GO:0070682 | proteasome regulatory particle assembly(GO:0070682) |
| 0.0 | 0.1 | GO:0098974 | postsynaptic actin cytoskeleton organization(GO:0098974) |
| 0.0 | 2.3 | GO:0043966 | histone H3 acetylation(GO:0043966) |
| 0.0 | 0.6 | GO:0006853 | carnitine shuttle(GO:0006853) |
| 0.0 | 0.1 | GO:0016259 | selenocysteine metabolic process(GO:0016259) |
| 0.0 | 0.2 | GO:0045039 | protein import into mitochondrial inner membrane(GO:0045039) |
| 0.0 | 0.3 | GO:0006657 | CDP-choline pathway(GO:0006657) |
| 0.0 | 0.1 | GO:0090071 | negative regulation of ribosome biogenesis(GO:0090071) |
| 0.0 | 0.3 | GO:0070307 | lens fiber cell development(GO:0070307) |
| 0.0 | 0.3 | GO:0007258 | JUN phosphorylation(GO:0007258) |
| 0.0 | 0.0 | GO:0036090 | cleavage furrow ingression(GO:0036090) |
| 0.0 | 0.0 | GO:0045643 | regulation of eosinophil differentiation(GO:0045643) positive regulation of eosinophil differentiation(GO:0045645) |
| 0.0 | 0.8 | GO:0036151 | phosphatidylcholine acyl-chain remodeling(GO:0036151) |
| 0.0 | 0.2 | GO:0042426 | choline catabolic process(GO:0042426) |
| 0.0 | 0.1 | GO:0002032 | desensitization of G-protein coupled receptor protein signaling pathway by arrestin(GO:0002032) |
| 0.0 | 0.2 | GO:0032377 | regulation of intracellular lipid transport(GO:0032377) regulation of intracellular sterol transport(GO:0032380) regulation of intracellular cholesterol transport(GO:0032383) |
| 0.0 | 0.1 | GO:0045347 | negative regulation of MHC class II biosynthetic process(GO:0045347) |
| 0.0 | 0.1 | GO:0006003 | fructose 2,6-bisphosphate metabolic process(GO:0006003) |
| 0.0 | 0.9 | GO:0006706 | steroid catabolic process(GO:0006706) |
| 0.0 | 0.3 | GO:0043562 | cellular response to nitrogen starvation(GO:0006995) cellular response to nitrogen levels(GO:0043562) |
| 0.0 | 0.5 | GO:0042772 | DNA damage response, signal transduction by p53 class mediator resulting in transcription of p21 class mediator(GO:0006978) DNA damage response, signal transduction resulting in transcription(GO:0042772) |
| 0.0 | 0.1 | GO:0035513 | oxidative RNA demethylation(GO:0035513) oxidative single-stranded RNA demethylation(GO:0035553) |
| 0.0 | 0.4 | GO:0006123 | mitochondrial electron transport, cytochrome c to oxygen(GO:0006123) |
| 0.0 | 0.3 | GO:0006108 | malate metabolic process(GO:0006108) |
| 0.0 | 0.4 | GO:0032516 | positive regulation of phosphoprotein phosphatase activity(GO:0032516) |
| 0.0 | 0.0 | GO:0000915 | assembly of actomyosin apparatus involved in cytokinesis(GO:0000912) actomyosin contractile ring assembly(GO:0000915) actomyosin contractile ring organization(GO:0044837) |
| 0.0 | 0.2 | GO:0009249 | protein lipoylation(GO:0009249) |
| 0.0 | 0.1 | GO:0031627 | telomeric loop formation(GO:0031627) |
| 0.0 | 0.5 | GO:0006646 | phosphatidylethanolamine biosynthetic process(GO:0006646) |
| 0.0 | 0.1 | GO:2000174 | pro-T cell differentiation(GO:0002572) regulation of pro-T cell differentiation(GO:2000174) positive regulation of pro-T cell differentiation(GO:2000176) |
| 0.0 | 0.3 | GO:0043374 | CD8-positive, alpha-beta T cell differentiation(GO:0043374) |
| 0.0 | 0.1 | GO:0045410 | positive regulation of interleukin-6 biosynthetic process(GO:0045410) |
| 0.0 | 0.1 | GO:0015742 | alpha-ketoglutarate transport(GO:0015742) |
| 0.0 | 0.1 | GO:0014826 | vein smooth muscle contraction(GO:0014826) |
| 0.0 | 0.3 | GO:0032201 | telomere maintenance via semi-conservative replication(GO:0032201) |
| 0.0 | 0.1 | GO:0036215 | response to stem cell factor(GO:0036215) cellular response to stem cell factor stimulus(GO:0036216) Kit signaling pathway(GO:0038109) |
| 0.0 | 0.2 | GO:0006122 | mitochondrial electron transport, ubiquinol to cytochrome c(GO:0006122) |
| 0.0 | 1.0 | GO:0072661 | protein targeting to plasma membrane(GO:0072661) |
| 0.0 | 0.4 | GO:0034656 | nucleobase-containing small molecule catabolic process(GO:0034656) |
| 0.0 | 0.1 | GO:1902109 | negative regulation of mitochondrial membrane permeability involved in apoptotic process(GO:1902109) |
| 0.0 | 0.2 | GO:0032025 | response to cobalt ion(GO:0032025) |
| 0.0 | 0.0 | GO:0006104 | succinyl-CoA metabolic process(GO:0006104) |
| 0.0 | 0.8 | GO:0097178 | ruffle assembly(GO:0097178) |
| 0.0 | 0.2 | GO:0035583 | sequestering of TGFbeta in extracellular matrix(GO:0035583) |
| 0.0 | 1.3 | GO:0033275 | muscle filament sliding(GO:0030049) actin-myosin filament sliding(GO:0033275) |
| 0.0 | 0.2 | GO:0070236 | negative regulation of activation-induced cell death of T cells(GO:0070236) |
| 0.0 | 0.1 | GO:0060849 | radial pattern formation(GO:0009956) regulation of transcription involved in lymphatic endothelial cell fate commitment(GO:0060849) |
| 0.0 | 0.0 | GO:0089700 | protein kinase D signaling(GO:0089700) |
| 0.0 | 0.1 | GO:0010746 | regulation of plasma membrane long-chain fatty acid transport(GO:0010746) negative regulation of plasma membrane long-chain fatty acid transport(GO:0010748) |
| 0.0 | 0.0 | GO:0097676 | histone H3-K36 dimethylation(GO:0097676) |
| 0.0 | 0.2 | GO:1904354 | negative regulation of telomere capping(GO:1904354) |
| 0.0 | 0.4 | GO:0016024 | CDP-diacylglycerol biosynthetic process(GO:0016024) |
| 0.0 | 0.1 | GO:0043000 | Golgi to plasma membrane CFTR protein transport(GO:0043000) |
| 0.0 | 0.1 | GO:0016584 | nucleosome positioning(GO:0016584) |
| 0.0 | 0.9 | GO:0060976 | coronary vasculature development(GO:0060976) |
| 0.0 | 0.3 | GO:1904322 | response to forskolin(GO:1904321) cellular response to forskolin(GO:1904322) |
| 0.0 | 0.1 | GO:0019348 | dolichol metabolic process(GO:0019348) |
| 0.0 | 0.1 | GO:0031584 | activation of phospholipase D activity(GO:0031584) |
| 0.0 | 0.3 | GO:1990118 | sodium ion import across plasma membrane(GO:0098719) sodium ion import into cell(GO:1990118) |
| 0.0 | 0.1 | GO:0010587 | miRNA catabolic process(GO:0010587) |
| 0.0 | 0.2 | GO:0097396 | response to interleukin-17(GO:0097396) cellular response to interleukin-17(GO:0097398) |
| 0.0 | 0.2 | GO:0010992 | ubiquitin homeostasis(GO:0010992) |
| 0.0 | 0.3 | GO:1902187 | negative regulation of viral release from host cell(GO:1902187) |
| 0.0 | 0.1 | GO:0071550 | death-inducing signaling complex assembly(GO:0071550) |
| 0.0 | 0.3 | GO:0045008 | depyrimidination(GO:0045008) |
| 0.0 | 0.2 | GO:0097354 | protein prenylation(GO:0018342) prenylation(GO:0097354) |
| 0.0 | 0.3 | GO:0033539 | fatty acid beta-oxidation using acyl-CoA dehydrogenase(GO:0033539) |
| 0.0 | 0.1 | GO:0045226 | extracellular polysaccharide biosynthetic process(GO:0045226) extracellular polysaccharide metabolic process(GO:0046379) |
| 0.0 | 0.1 | GO:0001880 | Mullerian duct regression(GO:0001880) |
| 0.0 | 0.1 | GO:0034058 | endosomal vesicle fusion(GO:0034058) |
| 0.0 | 0.0 | GO:0002101 | tRNA wobble cytosine modification(GO:0002101) |
| 0.0 | 0.1 | GO:0055129 | L-proline biosynthetic process(GO:0055129) |
| 0.0 | 0.9 | GO:0070979 | protein K11-linked ubiquitination(GO:0070979) |
| 0.0 | 0.3 | GO:0030033 | microvillus assembly(GO:0030033) |
| 0.0 | 0.1 | GO:0021553 | olfactory nerve development(GO:0021553) |
| 0.0 | 0.2 | GO:0090110 | cargo loading into COPII-coated vesicle(GO:0090110) |
| 0.0 | 0.4 | GO:2000352 | negative regulation of endothelial cell apoptotic process(GO:2000352) |
| 0.0 | 0.0 | GO:0042946 | glucoside transport(GO:0042946) |
| 0.0 | 0.4 | GO:0051894 | positive regulation of focal adhesion assembly(GO:0051894) |
| 0.0 | 1.0 | GO:0071260 | cellular response to mechanical stimulus(GO:0071260) |
| 0.0 | 1.4 | GO:0035308 | negative regulation of protein dephosphorylation(GO:0035308) |
| 0.0 | 0.8 | GO:0009060 | aerobic respiration(GO:0009060) |
| 0.0 | 1.7 | GO:0070126 | mitochondrial translational termination(GO:0070126) |
| 0.0 | 0.3 | GO:0005513 | detection of calcium ion(GO:0005513) |
| 0.0 | 0.3 | GO:0061298 | retina vasculature development in camera-type eye(GO:0061298) |
| 0.0 | 0.3 | GO:1903392 | negative regulation of focal adhesion assembly(GO:0051895) negative regulation of adherens junction organization(GO:1903392) |
| 0.0 | 0.1 | GO:0060294 | cilium movement involved in cell motility(GO:0060294) |
| 0.0 | 0.1 | GO:0001306 | age-dependent response to oxidative stress(GO:0001306) age-dependent response to reactive oxygen species(GO:0001315) regulation of systemic arterial blood pressure by acetylcholine(GO:0003068) vasodilation by acetylcholine involved in regulation of systemic arterial blood pressure(GO:0003069) regulation of systemic arterial blood pressure by neurotransmitter(GO:0003070) age-dependent general metabolic decline(GO:0007571) |
| 0.0 | 0.2 | GO:0019934 | cGMP-mediated signaling(GO:0019934) |
| 0.0 | 0.2 | GO:2001197 | regulation of basement membrane assembly involved in embryonic body morphogenesis(GO:1904259) positive regulation of basement membrane assembly involved in embryonic body morphogenesis(GO:1904261) basement membrane assembly involved in embryonic body morphogenesis(GO:2001197) |
| 0.0 | 0.2 | GO:0080111 | DNA demethylation(GO:0080111) |
| 0.0 | 0.1 | GO:0038030 | non-canonical Wnt signaling pathway via MAPK cascade(GO:0038030) non-canonical Wnt signaling pathway via JNK cascade(GO:0038031) |
| 0.0 | 0.5 | GO:0016578 | histone deubiquitination(GO:0016578) |
| 0.0 | 0.0 | GO:1990314 | cellular response to insulin-like growth factor stimulus(GO:1990314) |
| 0.0 | 0.1 | GO:0030422 | production of siRNA involved in RNA interference(GO:0030422) |
| 0.0 | 0.0 | GO:0002314 | germinal center B cell differentiation(GO:0002314) |
| 0.0 | 0.1 | GO:0040033 | miRNA mediated inhibition of translation(GO:0035278) negative regulation of translation, ncRNA-mediated(GO:0040033) regulation of translation, ncRNA-mediated(GO:0045974) |
| 0.0 | 0.3 | GO:0032802 | low-density lipoprotein particle receptor catabolic process(GO:0032802) |
| 0.0 | 0.2 | GO:2000574 | regulation of microtubule motor activity(GO:2000574) |
| 0.0 | 0.9 | GO:0006120 | mitochondrial electron transport, NADH to ubiquinone(GO:0006120) |
| 0.0 | 0.1 | GO:0000389 | mRNA 3'-splice site recognition(GO:0000389) |
| 0.0 | 0.3 | GO:0006301 | postreplication repair(GO:0006301) |
| 0.0 | 0.1 | GO:0051490 | negative regulation of filopodium assembly(GO:0051490) |
| 0.0 | 0.2 | GO:0036158 | outer dynein arm assembly(GO:0036158) |
| 0.0 | 0.1 | GO:0051045 | negative regulation of membrane protein ectodomain proteolysis(GO:0051045) |
| 0.0 | 0.4 | GO:0000305 | response to oxygen radical(GO:0000305) |
| 0.0 | 0.1 | GO:0046618 | drug export(GO:0046618) |
| 0.0 | 1.8 | GO:0038096 | immune response-regulating cell surface receptor signaling pathway involved in phagocytosis(GO:0002433) Fc-gamma receptor signaling pathway involved in phagocytosis(GO:0038096) |
| 0.0 | 0.0 | GO:0009216 | dADP phosphorylation(GO:0006174) dGDP phosphorylation(GO:0006186) AMP phosphorylation(GO:0006756) purine deoxyribonucleoside triphosphate biosynthetic process(GO:0009216) CDP phosphorylation(GO:0061508) dAMP phosphorylation(GO:0061565) CMP phosphorylation(GO:0061566) dCMP phosphorylation(GO:0061567) GDP phosphorylation(GO:0061568) UDP phosphorylation(GO:0061569) dCDP phosphorylation(GO:0061570) TDP phosphorylation(GO:0061571) |
| 0.0 | 0.1 | GO:1903237 | negative regulation of leukocyte tethering or rolling(GO:1903237) |
| 0.0 | 0.3 | GO:0042753 | positive regulation of circadian rhythm(GO:0042753) |
| 0.0 | 1.0 | GO:0070527 | platelet aggregation(GO:0070527) |
| 0.0 | 0.2 | GO:0061635 | regulation of protein complex stability(GO:0061635) |
| 0.0 | 0.1 | GO:0031642 | negative regulation of myelination(GO:0031642) |
| 0.0 | 0.4 | GO:1902751 | positive regulation of cell cycle G2/M phase transition(GO:1902751) |
| 0.0 | 0.3 | GO:0071420 | cellular response to histamine(GO:0071420) |
| 0.0 | 0.0 | GO:0018032 | protein amidation(GO:0018032) |
| 0.0 | 0.1 | GO:0007185 | transmembrane receptor protein tyrosine phosphatase signaling pathway(GO:0007185) |
| 0.0 | 0.1 | GO:0030388 | fructose 1,6-bisphosphate metabolic process(GO:0030388) |
| 0.0 | 0.1 | GO:0090154 | positive regulation of sphingolipid biosynthetic process(GO:0090154) positive regulation of ceramide biosynthetic process(GO:2000304) |
| 0.0 | 0.1 | GO:0070935 | 3'-UTR-mediated mRNA stabilization(GO:0070935) |
| 0.0 | 0.3 | GO:0006700 | C21-steroid hormone biosynthetic process(GO:0006700) |
| 0.0 | 0.1 | GO:2001171 | regulation of ATP biosynthetic process(GO:2001169) positive regulation of ATP biosynthetic process(GO:2001171) |
| 0.0 | 0.1 | GO:0031274 | positive regulation of pseudopodium assembly(GO:0031274) |
| 0.0 | 0.9 | GO:0016266 | O-glycan processing(GO:0016266) |
| 0.0 | 0.0 | GO:0070945 | neutrophil mediated killing of gram-negative bacterium(GO:0070945) |
| 0.0 | 0.1 | GO:0090385 | phagosome-lysosome fusion(GO:0090385) |
| 0.0 | 0.7 | GO:0048199 | vesicle coating(GO:0006901) vesicle targeting, to, from or within Golgi(GO:0048199) vesicle targeting, rough ER to cis-Golgi(GO:0048207) COPII vesicle coating(GO:0048208) |
| 0.0 | 0.5 | GO:0050775 | positive regulation of dendrite morphogenesis(GO:0050775) |
| 0.0 | 0.9 | GO:0006890 | retrograde vesicle-mediated transport, Golgi to ER(GO:0006890) |
| 0.0 | 0.0 | GO:0009305 | protein biotinylation(GO:0009305) histone biotinylation(GO:0071110) |
| 0.0 | 0.5 | GO:0035235 | ionotropic glutamate receptor signaling pathway(GO:0035235) |
| 0.0 | 0.1 | GO:1903300 | negative regulation of glucokinase activity(GO:0033132) negative regulation of hexokinase activity(GO:1903300) |
| 0.0 | 0.1 | GO:0014877 | response to muscle inactivity involved in regulation of muscle adaptation(GO:0014877) response to denervation involved in regulation of muscle adaptation(GO:0014894) |
| 0.0 | 0.0 | GO:1904908 | negative regulation of maintenance of sister chromatid cohesion(GO:0034092) negative regulation of maintenance of mitotic sister chromatid cohesion(GO:0034183) protein auto-ADP-ribosylation(GO:0070213) maintenance of mitotic sister chromatid cohesion, telomeric(GO:0099403) mitotic sister chromatid cohesion, telomeric(GO:0099404) regulation of maintenance of mitotic sister chromatid cohesion, telomeric(GO:1904907) negative regulation of maintenance of mitotic sister chromatid cohesion, telomeric(GO:1904908) |
Gene overrepresentation in cellular component category:
| Log-likelihood per target | Total log-likelihood | Term | Description |
|---|---|---|---|
| 0.6 | 4.5 | GO:0000110 | nucleotide-excision repair factor 1 complex(GO:0000110) |
| 0.5 | 1.9 | GO:0034365 | discoidal high-density lipoprotein particle(GO:0034365) |
| 0.3 | 1.6 | GO:1902560 | GMP reductase complex(GO:1902560) |
| 0.3 | 0.9 | GO:1902636 | kinociliary basal body(GO:1902636) |
| 0.3 | 1.9 | GO:1990726 | Lsm1-7-Pat1 complex(GO:1990726) |
| 0.2 | 3.3 | GO:0005862 | muscle thin filament tropomyosin(GO:0005862) |
| 0.2 | 0.7 | GO:0034657 | GID complex(GO:0034657) |
| 0.2 | 0.6 | GO:0000814 | ESCRT II complex(GO:0000814) |
| 0.2 | 1.1 | GO:0032044 | DSIF complex(GO:0032044) |
| 0.2 | 0.6 | GO:0033565 | ESCRT-0 complex(GO:0033565) |
| 0.2 | 0.8 | GO:0005846 | nuclear cap binding complex(GO:0005846) |
| 0.2 | 2.4 | GO:0000322 | storage vacuole(GO:0000322) |
| 0.2 | 1.3 | GO:0089701 | U2AF(GO:0089701) |
| 0.2 | 0.9 | GO:0005943 | phosphatidylinositol 3-kinase complex, class IA(GO:0005943) |
| 0.2 | 3.7 | GO:0031588 | nucleotide-activated protein kinase complex(GO:0031588) |
| 0.2 | 2.2 | GO:0097136 | Bcl-2 family protein complex(GO:0097136) |
| 0.2 | 1.1 | GO:0000408 | EKC/KEOPS complex(GO:0000408) |
| 0.2 | 2.3 | GO:0000124 | SAGA complex(GO:0000124) |
| 0.2 | 0.9 | GO:0070545 | PeBoW complex(GO:0070545) |
| 0.2 | 1.8 | GO:0016593 | Cdc73/Paf1 complex(GO:0016593) |
| 0.1 | 1.8 | GO:0034045 | pre-autophagosomal structure membrane(GO:0034045) |
| 0.1 | 1.2 | GO:0034751 | aryl hydrocarbon receptor complex(GO:0034751) |
| 0.1 | 1.1 | GO:0071986 | Ragulator complex(GO:0071986) |
| 0.1 | 1.5 | GO:0005786 | signal recognition particle, endoplasmic reticulum targeting(GO:0005786) |
| 0.1 | 2.8 | GO:0005885 | Arp2/3 protein complex(GO:0005885) |
| 0.1 | 0.8 | GO:0042765 | GPI-anchor transamidase complex(GO:0042765) |
| 0.1 | 1.2 | GO:0042719 | mitochondrial intermembrane space protein transporter complex(GO:0042719) |
| 0.1 | 2.1 | GO:0030008 | TRAPP complex(GO:0030008) |
| 0.1 | 0.5 | GO:0070876 | SOSS complex(GO:0070876) |
| 0.1 | 0.5 | GO:0031510 | SUMO activating enzyme complex(GO:0031510) |
| 0.1 | 0.8 | GO:0032021 | NELF complex(GO:0032021) |
| 0.1 | 0.4 | GO:0033596 | TSC1-TSC2 complex(GO:0033596) |
| 0.1 | 1.2 | GO:0031465 | Cul4B-RING E3 ubiquitin ligase complex(GO:0031465) |
| 0.1 | 0.3 | GO:0043260 | laminin-11 complex(GO:0043260) |
| 0.1 | 2.1 | GO:0016461 | unconventional myosin complex(GO:0016461) |
| 0.1 | 1.4 | GO:0034464 | BBSome(GO:0034464) |
| 0.1 | 1.0 | GO:0005964 | phosphorylase kinase complex(GO:0005964) |
| 0.1 | 0.8 | GO:0005797 | Golgi medial cisterna(GO:0005797) |
| 0.1 | 0.3 | GO:0034272 | phosphatidylinositol 3-kinase complex, class III, type I(GO:0034271) phosphatidylinositol 3-kinase complex, class III, type II(GO:0034272) |
| 0.1 | 2.5 | GO:0031083 | BLOC-1 complex(GO:0031083) |
| 0.1 | 1.4 | GO:0030126 | COPI vesicle coat(GO:0030126) |
| 0.1 | 0.7 | GO:0031464 | Cul4A-RING E3 ubiquitin ligase complex(GO:0031464) |
| 0.1 | 0.3 | GO:0005602 | complement component C1 complex(GO:0005602) |
| 0.1 | 0.6 | GO:0033063 | Rad51B-Rad51C-Rad51D-XRCC2 complex(GO:0033063) |
| 0.1 | 0.2 | GO:0043293 | apoptosome(GO:0043293) |
| 0.1 | 0.6 | GO:0000812 | Swr1 complex(GO:0000812) |
| 0.1 | 0.3 | GO:0030289 | protein phosphatase 4 complex(GO:0030289) |
| 0.1 | 1.1 | GO:0030897 | HOPS complex(GO:0030897) |
| 0.1 | 0.6 | GO:1990130 | Iml1 complex(GO:1990130) |
| 0.1 | 1.2 | GO:0017146 | NMDA selective glutamate receptor complex(GO:0017146) |
| 0.1 | 0.4 | GO:0020018 | ciliary pocket(GO:0020016) ciliary pocket membrane(GO:0020018) |
| 0.1 | 0.2 | GO:0033185 | dolichol-phosphate-mannose synthase complex(GO:0033185) |
| 0.1 | 0.2 | GO:0035370 | UBC13-UEV1A complex(GO:0035370) |
| 0.1 | 0.4 | GO:0048787 | presynaptic active zone membrane(GO:0048787) |
| 0.1 | 0.7 | GO:0030123 | AP-3 adaptor complex(GO:0030123) |
| 0.1 | 0.3 | GO:0071942 | XPC complex(GO:0071942) |
| 0.1 | 0.8 | GO:0033588 | Elongator holoenzyme complex(GO:0033588) |
| 0.1 | 0.7 | GO:0072559 | NLRP3 inflammasome complex(GO:0072559) |
| 0.1 | 0.7 | GO:0031595 | nuclear proteasome complex(GO:0031595) |
| 0.1 | 0.4 | GO:1990393 | 3M complex(GO:1990393) |
| 0.1 | 0.9 | GO:0008385 | IkappaB kinase complex(GO:0008385) |
| 0.1 | 0.6 | GO:0036157 | outer dynein arm(GO:0036157) |
| 0.1 | 0.7 | GO:0042587 | glycogen granule(GO:0042587) |
| 0.1 | 0.3 | GO:1990425 | ryanodine receptor complex(GO:1990425) |
| 0.1 | 0.2 | GO:0005674 | transcription factor TFIIF complex(GO:0005674) |
| 0.1 | 0.8 | GO:0005750 | mitochondrial respiratory chain complex III(GO:0005750) respiratory chain complex III(GO:0045275) |
| 0.1 | 0.4 | GO:0071797 | LUBAC complex(GO:0071797) |
| 0.1 | 1.0 | GO:0030127 | COPII vesicle coat(GO:0030127) |
| 0.1 | 0.3 | GO:0045272 | plasma membrane respiratory chain complex I(GO:0045272) |
| 0.1 | 0.5 | GO:0032777 | Piccolo NuA4 histone acetyltransferase complex(GO:0032777) |
| 0.1 | 0.2 | GO:0000407 | pre-autophagosomal structure(GO:0000407) |
| 0.1 | 0.6 | GO:0000015 | phosphopyruvate hydratase complex(GO:0000015) |
| 0.1 | 1.5 | GO:0000145 | exocyst(GO:0000145) |
| 0.1 | 0.9 | GO:0035068 | micro-ribonucleoprotein complex(GO:0035068) |
| 0.1 | 0.2 | GO:0070435 | Shc-EGFR complex(GO:0070435) |
| 0.1 | 0.4 | GO:0043541 | UDP-N-acetylglucosamine transferase complex(GO:0043541) |
| 0.1 | 0.5 | GO:0030914 | STAGA complex(GO:0030914) |
| 0.1 | 0.1 | GO:0031264 | death-inducing signaling complex(GO:0031264) |
| 0.1 | 0.9 | GO:0016600 | flotillin complex(GO:0016600) |
| 0.1 | 0.3 | GO:0033553 | rDNA heterochromatin(GO:0033553) |
| 0.0 | 0.1 | GO:0097543 | ciliary inversin compartment(GO:0097543) |
| 0.0 | 1.5 | GO:0005682 | U5 snRNP(GO:0005682) |
| 0.0 | 0.1 | GO:0090498 | extrinsic component of Golgi membrane(GO:0090498) |
| 0.0 | 0.2 | GO:0019815 | B cell receptor complex(GO:0019815) |
| 0.0 | 1.2 | GO:0036020 | endolysosome membrane(GO:0036020) |
| 0.0 | 0.2 | GO:0030906 | retromer, cargo-selective complex(GO:0030906) |
| 0.0 | 0.9 | GO:0005689 | U12-type spliceosomal complex(GO:0005689) |
| 0.0 | 0.4 | GO:0016272 | prefoldin complex(GO:0016272) |
| 0.0 | 0.2 | GO:0034274 | Atg12-Atg5-Atg16 complex(GO:0034274) |
| 0.0 | 0.2 | GO:0042643 | actomyosin, actin portion(GO:0042643) |
| 0.0 | 0.5 | GO:0071014 | post-mRNA release spliceosomal complex(GO:0071014) |
| 0.0 | 0.2 | GO:0000439 | core TFIIH complex(GO:0000439) |
| 0.0 | 0.7 | GO:0031209 | SCAR complex(GO:0031209) |
| 0.0 | 1.4 | GO:0005779 | integral component of peroxisomal membrane(GO:0005779) intrinsic component of peroxisomal membrane(GO:0031231) |
| 0.0 | 0.2 | GO:0034098 | VCP-NPL4-UFD1 AAA ATPase complex(GO:0034098) |
| 0.0 | 0.1 | GO:0048269 | methionine adenosyltransferase complex(GO:0048269) |
| 0.0 | 0.6 | GO:0071203 | WASH complex(GO:0071203) |
| 0.0 | 1.6 | GO:0005669 | transcription factor TFIID complex(GO:0005669) |
| 0.0 | 3.2 | GO:0022627 | cytosolic small ribosomal subunit(GO:0022627) |
| 0.0 | 0.4 | GO:0031371 | ubiquitin conjugating enzyme complex(GO:0031371) |
| 0.0 | 0.5 | GO:0000164 | protein phosphatase type 1 complex(GO:0000164) |
| 0.0 | 3.9 | GO:0005776 | autophagosome(GO:0005776) |
| 0.0 | 0.2 | GO:0097362 | MCM8-MCM9 complex(GO:0097362) |
| 0.0 | 2.0 | GO:0016460 | myosin II complex(GO:0016460) |
| 0.0 | 3.5 | GO:0030670 | phagocytic vesicle membrane(GO:0030670) |
| 0.0 | 1.0 | GO:0035267 | NuA4 histone acetyltransferase complex(GO:0035267) H4/H2A histone acetyltransferase complex(GO:0043189) H4 histone acetyltransferase complex(GO:1902562) |
| 0.0 | 0.1 | GO:0005828 | kinetochore microtubule(GO:0005828) |
| 0.0 | 0.5 | GO:0033178 | proton-transporting two-sector ATPase complex, catalytic domain(GO:0033178) |
| 0.0 | 3.8 | GO:0032588 | trans-Golgi network membrane(GO:0032588) |
| 0.0 | 0.2 | GO:0005854 | nascent polypeptide-associated complex(GO:0005854) |
| 0.0 | 0.1 | GO:0033263 | CORVET complex(GO:0033263) |
| 0.0 | 0.1 | GO:0017119 | Golgi transport complex(GO:0017119) |
| 0.0 | 1.6 | GO:0016592 | mediator complex(GO:0016592) |
| 0.0 | 0.3 | GO:0030905 | retromer, tubulation complex(GO:0030905) |
| 0.0 | 0.2 | GO:0002177 | manchette(GO:0002177) |
| 0.0 | 0.2 | GO:0005947 | mitochondrial alpha-ketoglutarate dehydrogenase complex(GO:0005947) |
| 0.0 | 0.2 | GO:0033391 | chromatoid body(GO:0033391) |
| 0.0 | 0.2 | GO:0097255 | R2TP complex(GO:0097255) |
| 0.0 | 0.3 | GO:0043190 | ATP-binding cassette (ABC) transporter complex(GO:0043190) |
| 0.0 | 0.6 | GO:0097342 | CD95 death-inducing signaling complex(GO:0031265) ripoptosome(GO:0097342) |
| 0.0 | 0.3 | GO:0005869 | dynactin complex(GO:0005869) |
| 0.0 | 0.4 | GO:0019773 | proteasome core complex, alpha-subunit complex(GO:0019773) |
| 0.0 | 1.5 | GO:0008180 | COP9 signalosome(GO:0008180) |
| 0.0 | 0.6 | GO:0070971 | endoplasmic reticulum exit site(GO:0070971) |
| 0.0 | 2.0 | GO:0005778 | peroxisomal membrane(GO:0005778) microbody membrane(GO:0031903) |
| 0.0 | 0.6 | GO:0030132 | clathrin coat of coated pit(GO:0030132) |
| 0.0 | 0.6 | GO:0097440 | apical dendrite(GO:0097440) |
| 0.0 | 0.2 | GO:0030904 | retromer complex(GO:0030904) |
| 0.0 | 0.5 | GO:0005832 | chaperonin-containing T-complex(GO:0005832) |
| 0.0 | 0.1 | GO:0043625 | delta DNA polymerase complex(GO:0043625) |
| 0.0 | 2.7 | GO:0031093 | platelet alpha granule lumen(GO:0031093) |
| 0.0 | 1.6 | GO:0005762 | organellar large ribosomal subunit(GO:0000315) mitochondrial large ribosomal subunit(GO:0005762) |
| 0.0 | 0.1 | GO:0005896 | interleukin-6 receptor complex(GO:0005896) |
| 0.0 | 0.4 | GO:0005662 | DNA replication factor A complex(GO:0005662) |
| 0.0 | 0.0 | GO:0048500 | signal recognition particle(GO:0048500) |
| 0.0 | 0.1 | GO:0070931 | Golgi-associated vesicle lumen(GO:0070931) |
| 0.0 | 0.4 | GO:0005671 | Ada2/Gcn5/Ada3 transcription activator complex(GO:0005671) |
| 0.0 | 1.1 | GO:0008023 | transcription elongation factor complex(GO:0008023) |
| 0.0 | 0.9 | GO:0005680 | anaphase-promoting complex(GO:0005680) |
| 0.0 | 2.5 | GO:0015934 | large ribosomal subunit(GO:0015934) |
| 0.0 | 0.5 | GO:0045495 | P granule(GO:0043186) pole plasm(GO:0045495) germ plasm(GO:0060293) |
| 0.0 | 2.2 | GO:0071013 | catalytic step 2 spliceosome(GO:0071013) |
| 0.0 | 0.1 | GO:0036502 | Derlin-1-VIMP complex(GO:0036502) |
| 0.0 | 0.2 | GO:0016602 | CCAAT-binding factor complex(GO:0016602) |
| 0.0 | 0.1 | GO:1990879 | CST complex(GO:1990879) |
| 0.0 | 0.8 | GO:0035861 | site of double-strand break(GO:0035861) |
| 0.0 | 0.1 | GO:0098837 | postsynaptic recycling endosome(GO:0098837) |
| 0.0 | 0.2 | GO:0042405 | nuclear inclusion body(GO:0042405) |
| 0.0 | 0.2 | GO:0008290 | F-actin capping protein complex(GO:0008290) |
| 0.0 | 0.2 | GO:0072669 | tRNA-splicing ligase complex(GO:0072669) |
| 0.0 | 0.1 | GO:0044614 | nuclear pore cytoplasmic filaments(GO:0044614) |
| 0.0 | 0.1 | GO:0001405 | presequence translocase-associated import motor(GO:0001405) |
| 0.0 | 0.6 | GO:0030117 | membrane coat(GO:0030117) coated membrane(GO:0048475) |
| 0.0 | 1.1 | GO:0045271 | mitochondrial respiratory chain complex I(GO:0005747) NADH dehydrogenase complex(GO:0030964) respiratory chain complex I(GO:0045271) |
| 0.0 | 0.2 | GO:0031618 | nuclear pericentric heterochromatin(GO:0031618) |
| 0.0 | 0.1 | GO:0045240 | dihydrolipoyl dehydrogenase complex(GO:0045240) |
| 0.0 | 4.5 | GO:0001726 | ruffle(GO:0001726) |
| 0.0 | 0.1 | GO:0005658 | alpha DNA polymerase:primase complex(GO:0005658) |
| 0.0 | 0.1 | GO:0033018 | sarcoplasmic reticulum lumen(GO:0033018) |
| 0.0 | 0.6 | GO:0000123 | histone acetyltransferase complex(GO:0000123) |
| 0.0 | 0.1 | GO:0030915 | Smc5-Smc6 complex(GO:0030915) |
| 0.0 | 0.3 | GO:0097539 | ciliary transition fiber(GO:0097539) |
| 0.0 | 1.3 | GO:0005811 | lipid particle(GO:0005811) |
| 0.0 | 0.1 | GO:0032311 | angiogenin-PRI complex(GO:0032311) |
| 0.0 | 0.7 | GO:0005782 | peroxisomal matrix(GO:0005782) microbody lumen(GO:0031907) |
| 0.0 | 0.3 | GO:0042622 | photoreceptor outer segment membrane(GO:0042622) |
| 0.0 | 0.1 | GO:0072357 | PTW/PP1 phosphatase complex(GO:0072357) |
| 0.0 | 0.1 | GO:0031332 | RISC complex(GO:0016442) RNAi effector complex(GO:0031332) |
| 0.0 | 0.1 | GO:0045180 | basal cortex(GO:0045180) |
| 0.0 | 0.1 | GO:0034709 | methylosome(GO:0034709) |
| 0.0 | 0.7 | GO:0043198 | dendritic shaft(GO:0043198) |
| 0.0 | 0.4 | GO:1902711 | GABA-A receptor complex(GO:1902711) |
| 0.0 | 0.2 | GO:0061700 | GATOR2 complex(GO:0061700) |
| 0.0 | 0.0 | GO:0031085 | BLOC-3 complex(GO:0031085) |
| 0.0 | 0.4 | GO:0005720 | nuclear heterochromatin(GO:0005720) |
| 0.0 | 0.1 | GO:0005853 | eukaryotic translation elongation factor 1 complex(GO:0005853) |
| 0.0 | 0.1 | GO:0005751 | mitochondrial respiratory chain complex IV(GO:0005751) |
| 0.0 | 0.4 | GO:0002080 | acrosomal membrane(GO:0002080) |
| 0.0 | 0.0 | GO:0071204 | histone pre-mRNA 3'end processing complex(GO:0071204) |
| 0.0 | 0.0 | GO:0010370 | perinucleolar chromocenter(GO:0010370) |
| 0.0 | 0.0 | GO:0014802 | terminal cisterna(GO:0014802) |
| 0.0 | 0.2 | GO:0005839 | proteasome core complex(GO:0005839) |
| 0.0 | 0.0 | GO:0008537 | proteasome activator complex(GO:0008537) |
Gene overrepresentation in molecular function category:
| Log-likelihood per target | Total log-likelihood | Term | Description |
|---|---|---|---|
| 0.9 | 2.6 | GO:0031071 | cysteine desulfurase activity(GO:0031071) |
| 0.8 | 2.3 | GO:0044714 | GTP diphosphatase activity(GO:0036219) 2-hydroxy-adenosine triphosphate pyrophosphatase activity(GO:0044713) 2-hydroxy-(deoxy)adenosine-triphosphate pyrophosphatase activity(GO:0044714) ATP diphosphatase activity(GO:0047693) |
| 0.7 | 2.9 | GO:0045127 | N-acetylglucosamine kinase activity(GO:0045127) |
| 0.6 | 4.5 | GO:1990599 | 3' overhang single-stranded DNA endodeoxyribonuclease activity(GO:1990599) |
| 0.5 | 1.6 | GO:0035375 | zymogen binding(GO:0035375) |
| 0.5 | 1.4 | GO:0032427 | GBD domain binding(GO:0032427) |
| 0.4 | 1.1 | GO:0052815 | medium-chain acyl-CoA hydrolase activity(GO:0052815) long-chain acyl-CoA hydrolase activity(GO:0052816) |
| 0.4 | 1.4 | GO:0061628 | H3K27me3 modified histone binding(GO:0061628) |
| 0.4 | 1.8 | GO:0008113 | peptide-methionine (S)-S-oxide reductase activity(GO:0008113) |
| 0.3 | 1.6 | GO:0003920 | GMP reductase activity(GO:0003920) oxidoreductase activity, acting on NAD(P)H, nitrogenous group as acceptor(GO:0016657) |
| 0.3 | 1.8 | GO:0003998 | acylphosphatase activity(GO:0003998) |
| 0.3 | 1.5 | GO:0033857 | diphosphoinositol-pentakisphosphate kinase activity(GO:0033857) |
| 0.3 | 0.8 | GO:0042781 | 3'-tRNA processing endoribonuclease activity(GO:0042781) |
| 0.3 | 0.8 | GO:0035248 | alpha-1,4-N-acetylgalactosaminyltransferase activity(GO:0035248) |
| 0.2 | 2.2 | GO:0016206 | catechol O-methyltransferase activity(GO:0016206) |
| 0.2 | 0.7 | GO:0030156 | benzodiazepine receptor binding(GO:0030156) |
| 0.2 | 0.9 | GO:0034191 | apolipoprotein A-I receptor binding(GO:0034191) |
| 0.2 | 0.9 | GO:0004773 | steryl-sulfatase activity(GO:0004773) |
| 0.2 | 1.5 | GO:0030628 | pre-mRNA 3'-splice site binding(GO:0030628) |
| 0.2 | 4.1 | GO:0070513 | death domain binding(GO:0070513) |
| 0.2 | 0.8 | GO:0032089 | NACHT domain binding(GO:0032089) |
| 0.2 | 1.0 | GO:0032810 | sterol response element binding(GO:0032810) |
| 0.2 | 1.2 | GO:0035800 | deubiquitinase activator activity(GO:0035800) |
| 0.2 | 1.0 | GO:0016230 | sphingomyelin phosphodiesterase activator activity(GO:0016230) |
| 0.2 | 0.8 | GO:0002046 | opsin binding(GO:0002046) |
| 0.2 | 1.5 | GO:0030942 | endoplasmic reticulum signal peptide binding(GO:0030942) |
| 0.2 | 0.7 | GO:0008665 | 2'-phosphotransferase activity(GO:0008665) |
| 0.2 | 2.7 | GO:0004679 | AMP-activated protein kinase activity(GO:0004679) |
| 0.2 | 0.7 | GO:0000702 | oxidized base lesion DNA N-glycosylase activity(GO:0000702) |
| 0.2 | 0.5 | GO:0033142 | progesterone receptor binding(GO:0033142) |
| 0.2 | 0.8 | GO:0004814 | arginine-tRNA ligase activity(GO:0004814) |
| 0.1 | 0.1 | GO:0046899 | nucleoside triphosphate adenylate kinase activity(GO:0046899) |
| 0.1 | 0.8 | GO:0003923 | GPI-anchor transamidase activity(GO:0003923) |
| 0.1 | 0.5 | GO:0000309 | nicotinamide-nucleotide adenylyltransferase activity(GO:0000309) |
| 0.1 | 0.4 | GO:0043682 | copper-exporting ATPase activity(GO:0004008) phosphoglycerate kinase activity(GO:0004618) copper-transporting ATPase activity(GO:0043682) |
| 0.1 | 1.0 | GO:0036435 | K48-linked polyubiquitin binding(GO:0036435) |
| 0.1 | 0.5 | GO:0019770 | IgG receptor activity(GO:0019770) |
| 0.1 | 0.9 | GO:0008121 | ubiquinol-cytochrome-c reductase activity(GO:0008121) oxidoreductase activity, acting on diphenols and related substances as donors, cytochrome as acceptor(GO:0016681) |
| 0.1 | 0.6 | GO:0015199 | amino-acid betaine transmembrane transporter activity(GO:0015199) carnitine transmembrane transporter activity(GO:0015226) |
| 0.1 | 2.3 | GO:0015197 | peptide transporter activity(GO:0015197) |
| 0.1 | 0.3 | GO:0035663 | Toll-like receptor 2 binding(GO:0035663) |
| 0.1 | 0.7 | GO:0043812 | phosphatidylinositol-4-phosphate phosphatase activity(GO:0043812) |
| 0.1 | 0.5 | GO:0004792 | thiosulfate sulfurtransferase activity(GO:0004792) |
| 0.1 | 1.2 | GO:0004972 | NMDA glutamate receptor activity(GO:0004972) |
| 0.1 | 0.9 | GO:0036402 | proteasome-activating ATPase activity(GO:0036402) |
| 0.1 | 0.4 | GO:0070137 | ubiquitin-like protein-specific endopeptidase activity(GO:0070137) SUMO-specific endopeptidase activity(GO:0070139) |
| 0.1 | 0.5 | GO:0044736 | acid-sensing ion channel activity(GO:0044736) |
| 0.1 | 0.6 | GO:0015137 | citrate transmembrane transporter activity(GO:0015137) tricarboxylic acid transmembrane transporter activity(GO:0015142) |
| 0.1 | 1.0 | GO:0004689 | phosphorylase kinase activity(GO:0004689) |
| 0.1 | 2.9 | GO:0000030 | mannosyltransferase activity(GO:0000030) |
| 0.1 | 1.3 | GO:0031386 | protein tag(GO:0031386) |
| 0.1 | 0.4 | GO:0008192 | RNA guanylyltransferase activity(GO:0008192) |
| 0.1 | 0.5 | GO:0018479 | benzaldehyde dehydrogenase (NAD+) activity(GO:0018479) |
| 0.1 | 0.5 | GO:0043125 | ErbB-3 class receptor binding(GO:0043125) |
| 0.1 | 0.9 | GO:0046935 | 1-phosphatidylinositol-3-kinase regulator activity(GO:0046935) |
| 0.1 | 0.3 | GO:0042809 | vitamin D receptor binding(GO:0042809) |
| 0.1 | 1.0 | GO:0008603 | cAMP-dependent protein kinase regulator activity(GO:0008603) |
| 0.1 | 0.9 | GO:0043023 | ribosomal large subunit binding(GO:0043023) |
| 0.1 | 0.3 | GO:0000404 | heteroduplex DNA loop binding(GO:0000404) |
| 0.1 | 0.3 | GO:0016855 | racemase and epimerase activity, acting on amino acids and derivatives(GO:0016855) racemase activity, acting on amino acids and derivatives(GO:0036361) amino-acid racemase activity(GO:0047661) |
| 0.1 | 0.3 | GO:0004577 | N-acetylglucosaminyldiphosphodolichol N-acetylglucosaminyltransferase activity(GO:0004577) |
| 0.1 | 2.2 | GO:0000339 | RNA cap binding(GO:0000339) |
| 0.1 | 0.7 | GO:0051373 | FATZ binding(GO:0051373) |
| 0.1 | 0.9 | GO:0070739 | protein-glutamic acid ligase activity(GO:0070739) |
| 0.1 | 0.6 | GO:0005000 | vasopressin receptor activity(GO:0005000) |
| 0.1 | 0.4 | GO:0004105 | choline-phosphate cytidylyltransferase activity(GO:0004105) |
| 0.1 | 1.0 | GO:0017162 | aryl hydrocarbon receptor binding(GO:0017162) |
| 0.1 | 0.4 | GO:0047631 | ADP-ribose diphosphatase activity(GO:0047631) |
| 0.1 | 0.6 | GO:0019237 | centromeric DNA binding(GO:0019237) |
| 0.1 | 0.2 | GO:0003826 | alpha-ketoacid dehydrogenase activity(GO:0003826) 3-methyl-2-oxobutanoate dehydrogenase (2-methylpropanoyl-transferring) activity(GO:0003863) |
| 0.1 | 4.6 | GO:0003755 | peptidyl-prolyl cis-trans isomerase activity(GO:0003755) |
| 0.1 | 0.4 | GO:0070735 | protein-glycine ligase activity(GO:0070735) |
| 0.1 | 0.5 | GO:0050815 | phosphoserine binding(GO:0050815) |
| 0.1 | 0.2 | GO:0004782 | sulfinoalanine decarboxylase activity(GO:0004782) |
| 0.1 | 0.1 | GO:0003941 | L-serine ammonia-lyase activity(GO:0003941) |
| 0.1 | 0.3 | GO:0032184 | SUMO polymer binding(GO:0032184) |
| 0.1 | 0.3 | GO:0050253 | retinyl-palmitate esterase activity(GO:0050253) |
| 0.1 | 0.4 | GO:0004614 | phosphoglucomutase activity(GO:0004614) |
| 0.1 | 0.2 | GO:0004157 | dihydropyrimidinase activity(GO:0004157) |
| 0.1 | 0.2 | GO:0004345 | glucose-6-phosphate dehydrogenase activity(GO:0004345) |
| 0.1 | 0.2 | GO:0060001 | minus-end directed microfilament motor activity(GO:0060001) |
| 0.1 | 0.6 | GO:0008553 | hydrogen-exporting ATPase activity, phosphorylative mechanism(GO:0008553) |
| 0.1 | 2.9 | GO:0030296 | protein tyrosine kinase activator activity(GO:0030296) |
| 0.1 | 0.2 | GO:0061769 | ribosylnicotinamide kinase activity(GO:0050262) ribosylnicotinate kinase activity(GO:0061769) |
| 0.1 | 1.3 | GO:0004653 | polypeptide N-acetylgalactosaminyltransferase activity(GO:0004653) |
| 0.1 | 1.5 | GO:0016805 | dipeptidase activity(GO:0016805) |
| 0.1 | 1.1 | GO:0005522 | profilin binding(GO:0005522) |
| 0.1 | 0.3 | GO:1990460 | leptin receptor binding(GO:1990460) |
| 0.1 | 0.5 | GO:0008379 | thioredoxin peroxidase activity(GO:0008379) |
| 0.1 | 1.4 | GO:0102391 | decanoate--CoA ligase activity(GO:0102391) |
| 0.1 | 0.3 | GO:0019776 | Atg8 ligase activity(GO:0019776) |
| 0.1 | 0.6 | GO:0004634 | phosphopyruvate hydratase activity(GO:0004634) |
| 0.1 | 6.2 | GO:0008307 | structural constituent of muscle(GO:0008307) |
| 0.1 | 0.3 | GO:0051021 | GDP-dissociation inhibitor binding(GO:0051021) Rho GDP-dissociation inhibitor binding(GO:0051022) |
| 0.1 | 0.7 | GO:0032036 | myosin heavy chain binding(GO:0032036) |
| 0.1 | 0.2 | GO:0004505 | phenylalanine 4-monooxygenase activity(GO:0004505) |
| 0.1 | 0.4 | GO:0099529 | neurotransmitter receptor activity involved in regulation of postsynaptic membrane potential(GO:0099529) transmitter-gated ion channel activity involved in regulation of postsynaptic membrane potential(GO:1904315) |
| 0.1 | 2.6 | GO:0005484 | SNAP receptor activity(GO:0005484) |
| 0.1 | 0.8 | GO:0050693 | LBD domain binding(GO:0050693) |
| 0.1 | 0.4 | GO:0003909 | DNA ligase activity(GO:0003909) DNA ligase (ATP) activity(GO:0003910) |
| 0.1 | 0.4 | GO:0008158 | hedgehog receptor activity(GO:0008158) |
| 0.1 | 1.0 | GO:0034452 | dynactin binding(GO:0034452) |
| 0.0 | 0.4 | GO:0005168 | neurotrophin TRKA receptor binding(GO:0005168) |
| 0.0 | 0.5 | GO:0008318 | protein prenyltransferase activity(GO:0008318) |
| 0.0 | 1.8 | GO:0004550 | nucleoside diphosphate kinase activity(GO:0004550) |
| 0.0 | 0.1 | GO:0005519 | cytoskeletal regulatory protein binding(GO:0005519) |
| 0.0 | 0.1 | GO:0031691 | alpha-1A adrenergic receptor binding(GO:0031691) follicle-stimulating hormone receptor binding(GO:0031762) |
| 0.0 | 0.1 | GO:0033981 | D-dopachrome decarboxylase activity(GO:0033981) |
| 0.0 | 0.7 | GO:0004865 | protein serine/threonine phosphatase inhibitor activity(GO:0004865) |
| 0.0 | 0.9 | GO:0070273 | phosphatidylinositol-4-phosphate binding(GO:0070273) |
| 0.0 | 1.3 | GO:0070008 | serine-type exopeptidase activity(GO:0070008) |
| 0.0 | 0.3 | GO:0030060 | L-malate dehydrogenase activity(GO:0030060) |
| 0.0 | 0.4 | GO:0035368 | selenocysteine insertion sequence binding(GO:0035368) |
| 0.0 | 0.4 | GO:0071532 | ankyrin repeat binding(GO:0071532) |
| 0.0 | 2.5 | GO:0032266 | phosphatidylinositol-3-phosphate binding(GO:0032266) |
| 0.0 | 1.3 | GO:0017160 | Ral GTPase binding(GO:0017160) |
| 0.0 | 1.4 | GO:0017025 | TBP-class protein binding(GO:0017025) |
| 0.0 | 0.4 | GO:1990948 | ligase inhibitor activity(GO:0055104) ubiquitin ligase inhibitor activity(GO:1990948) |
| 0.0 | 1.2 | GO:0016922 | ligand-dependent nuclear receptor binding(GO:0016922) |
| 0.0 | 0.3 | GO:0044729 | hemi-methylated DNA-binding(GO:0044729) |
| 0.0 | 0.5 | GO:0042975 | peroxisome proliferator activated receptor binding(GO:0042975) |
| 0.0 | 0.2 | GO:0004852 | uroporphyrinogen-III synthase activity(GO:0004852) |
| 0.0 | 0.1 | GO:0000386 | second spliceosomal transesterification activity(GO:0000386) |
| 0.0 | 0.3 | GO:0035500 | MH2 domain binding(GO:0035500) |
| 0.0 | 0.2 | GO:0086062 | voltage-gated sodium channel activity involved in Purkinje myocyte action potential(GO:0086062) |
| 0.0 | 0.1 | GO:0071566 | UFM1 activating enzyme activity(GO:0071566) |
| 0.0 | 0.4 | GO:0008568 | microtubule-severing ATPase activity(GO:0008568) |
| 0.0 | 1.0 | GO:0035615 | clathrin adaptor activity(GO:0035615) endocytic adaptor activity(GO:0098748) |
| 0.0 | 0.5 | GO:0030371 | translation repressor activity(GO:0030371) |
| 0.0 | 0.2 | GO:0004677 | DNA-dependent protein kinase activity(GO:0004677) |
| 0.0 | 0.1 | GO:0008746 | NAD(P)+ transhydrogenase activity(GO:0008746) oxidoreductase activity, acting on NAD(P)H, NAD(P) as acceptor(GO:0016652) |
| 0.0 | 0.2 | GO:0016453 | C-acetyltransferase activity(GO:0016453) |
| 0.0 | 1.3 | GO:0004707 | MAP kinase activity(GO:0004707) |
| 0.0 | 1.5 | GO:0017134 | fibroblast growth factor binding(GO:0017134) |
| 0.0 | 0.2 | GO:0004449 | isocitrate dehydrogenase (NAD+) activity(GO:0004449) |
| 0.0 | 0.3 | GO:0005324 | long-chain fatty acid transporter activity(GO:0005324) |
| 0.0 | 0.1 | GO:0070119 | ciliary neurotrophic factor binding(GO:0070119) |
| 0.0 | 0.2 | GO:0004359 | glutaminase activity(GO:0004359) |
| 0.0 | 0.2 | GO:0004694 | eukaryotic translation initiation factor 2alpha kinase activity(GO:0004694) |
| 0.0 | 1.2 | GO:0005092 | GDP-dissociation inhibitor activity(GO:0005092) |
| 0.0 | 0.1 | GO:0016979 | lipoate-protein ligase activity(GO:0016979) |
| 0.0 | 0.1 | GO:0015140 | malate transmembrane transporter activity(GO:0015140) |
| 0.0 | 0.4 | GO:0016004 | phospholipase activator activity(GO:0016004) |
| 0.0 | 0.2 | GO:0052655 | branched-chain-amino-acid transaminase activity(GO:0004084) L-leucine transaminase activity(GO:0052654) L-valine transaminase activity(GO:0052655) L-isoleucine transaminase activity(GO:0052656) |
| 0.0 | 0.2 | GO:0004017 | adenylate kinase activity(GO:0004017) |
| 0.0 | 1.2 | GO:0017075 | syntaxin-1 binding(GO:0017075) |
| 0.0 | 0.4 | GO:0019957 | C-C chemokine binding(GO:0019957) |
| 0.0 | 0.1 | GO:0019788 | NEDD8 transferase activity(GO:0019788) |
| 0.0 | 0.2 | GO:0004862 | cAMP-dependent protein kinase inhibitor activity(GO:0004862) |
| 0.0 | 0.2 | GO:0016427 | tRNA (cytosine) methyltransferase activity(GO:0016427) |
| 0.0 | 1.1 | GO:0001103 | RNA polymerase II repressing transcription factor binding(GO:0001103) |
| 0.0 | 0.1 | GO:0003988 | acetyl-CoA C-acyltransferase activity(GO:0003988) |
| 0.0 | 0.1 | GO:0004140 | dephospho-CoA kinase activity(GO:0004140) |
| 0.0 | 0.9 | GO:0097200 | cysteine-type endopeptidase activity involved in execution phase of apoptosis(GO:0097200) |
| 0.0 | 0.6 | GO:0036374 | glutathione hydrolase activity(GO:0036374) |
| 0.0 | 0.2 | GO:0003997 | acyl-CoA oxidase activity(GO:0003997) |
| 0.0 | 0.2 | GO:0016212 | kynurenine-oxoglutarate transaminase activity(GO:0016212) kynurenine aminotransferase activity(GO:0036137) |
| 0.0 | 0.8 | GO:0008656 | cysteine-type endopeptidase activator activity involved in apoptotic process(GO:0008656) |
| 0.0 | 0.1 | GO:0000822 | inositol hexakisphosphate binding(GO:0000822) |
| 0.0 | 0.1 | GO:0008410 | CoA-transferase activity(GO:0008410) |
| 0.0 | 0.1 | GO:0047237 | glucuronylgalactosylproteoglycan 4-beta-N-acetylgalactosaminyltransferase activity(GO:0047237) |
| 0.0 | 0.3 | GO:0015129 | lactate transmembrane transporter activity(GO:0015129) |
| 0.0 | 0.6 | GO:0016668 | oxidoreductase activity, acting on a sulfur group of donors, NAD(P) as acceptor(GO:0016668) |
| 0.0 | 0.3 | GO:0030911 | TPR domain binding(GO:0030911) |
| 0.0 | 0.1 | GO:0042132 | fructose 1,6-bisphosphate 1-phosphatase activity(GO:0042132) |
| 0.0 | 0.2 | GO:1990446 | U1 snRNP binding(GO:1990446) |
| 0.0 | 0.2 | GO:0004468 | lysine N-acetyltransferase activity, acting on acetyl phosphate as donor(GO:0004468) |
| 0.0 | 0.3 | GO:0035005 | 1-phosphatidylinositol-4-phosphate 3-kinase activity(GO:0035005) |
| 0.0 | 1.1 | GO:0071889 | 14-3-3 protein binding(GO:0071889) |
| 0.0 | 0.1 | GO:0003896 | DNA primase activity(GO:0003896) |
| 0.0 | 0.5 | GO:0052629 | phosphatidylinositol-3,5-bisphosphate 3-phosphatase activity(GO:0052629) |
| 0.0 | 0.6 | GO:0097602 | cullin family protein binding(GO:0097602) |
| 0.0 | 0.1 | GO:0098918 | structural constituent of synapse(GO:0098918) structural constituent of postsynaptic actin cytoskeleton(GO:0098973) |
| 0.0 | 0.4 | GO:0045504 | dynein heavy chain binding(GO:0045504) |
| 0.0 | 0.1 | GO:0003990 | acetylcholinesterase activity(GO:0003990) |
| 0.0 | 0.2 | GO:0004534 | 5'-3' exoribonuclease activity(GO:0004534) |
| 0.0 | 0.3 | GO:1990247 | N6-methyladenosine-containing RNA binding(GO:1990247) |
| 0.0 | 0.4 | GO:0000150 | recombinase activity(GO:0000150) |
| 0.0 | 0.8 | GO:0051537 | 2 iron, 2 sulfur cluster binding(GO:0051537) |
| 0.0 | 0.2 | GO:0030267 | hydroxypyruvate reductase activity(GO:0016618) glyoxylate reductase (NADP) activity(GO:0030267) |
| 0.0 | 0.3 | GO:0005004 | GPI-linked ephrin receptor activity(GO:0005004) |
| 0.0 | 1.6 | GO:0030374 | ligand-dependent nuclear receptor transcription coactivator activity(GO:0030374) |
| 0.0 | 0.2 | GO:0043426 | MRF binding(GO:0043426) |
| 0.0 | 0.3 | GO:0015386 | potassium:proton antiporter activity(GO:0015386) |
| 0.0 | 0.1 | GO:0003873 | 6-phosphofructo-2-kinase activity(GO:0003873) |
| 0.0 | 1.0 | GO:0044390 | ubiquitin-like protein conjugating enzyme binding(GO:0044390) |
| 0.0 | 0.1 | GO:0035515 | oxidative RNA demethylase activity(GO:0035515) |
| 0.0 | 3.2 | GO:0001104 | RNA polymerase II transcription cofactor activity(GO:0001104) |
| 0.0 | 0.5 | GO:0031369 | translation initiation factor binding(GO:0031369) |
| 0.0 | 0.0 | GO:0004331 | fructose-2,6-bisphosphate 2-phosphatase activity(GO:0004331) |
| 0.0 | 5.2 | GO:0003735 | structural constituent of ribosome(GO:0003735) |
| 0.0 | 0.2 | GO:0008597 | calcium-dependent protein serine/threonine phosphatase regulator activity(GO:0008597) |
| 0.0 | 0.2 | GO:0008109 | N-acetyllactosaminide beta-1,6-N-acetylglucosaminyltransferase activity(GO:0008109) |
| 0.0 | 0.1 | GO:0043515 | kinetochore binding(GO:0043515) |
| 0.0 | 0.4 | GO:0008190 | eukaryotic initiation factor 4E binding(GO:0008190) |
| 0.0 | 1.5 | GO:0017112 | Rab guanyl-nucleotide exchange factor activity(GO:0017112) |
| 0.0 | 0.1 | GO:0034353 | RNA pyrophosphohydrolase activity(GO:0034353) |
| 0.0 | 0.8 | GO:0004709 | MAP kinase kinase kinase activity(GO:0004709) |
| 0.0 | 0.1 | GO:0016748 | succinyltransferase activity(GO:0016748) |
| 0.0 | 0.1 | GO:0034235 | GPI anchor binding(GO:0034235) |
| 0.0 | 0.3 | GO:0043274 | phospholipase binding(GO:0043274) |
| 0.0 | 0.1 | GO:0052739 | phosphatidylserine 1-acylhydrolase activity(GO:0052739) |
| 0.0 | 0.1 | GO:0015307 | drug:proton antiporter activity(GO:0015307) |
| 0.0 | 0.2 | GO:0004704 | NF-kappaB-inducing kinase activity(GO:0004704) |
| 0.0 | 0.2 | GO:0016290 | palmitoyl-CoA hydrolase activity(GO:0016290) |
| 0.0 | 0.2 | GO:0016846 | carbon-sulfur lyase activity(GO:0016846) |
| 0.0 | 1.0 | GO:0008137 | NADH dehydrogenase (ubiquinone) activity(GO:0008137) NADH dehydrogenase (quinone) activity(GO:0050136) |
| 0.0 | 0.1 | GO:0004735 | pyrroline-5-carboxylate reductase activity(GO:0004735) |
| 0.0 | 0.1 | GO:0031708 | endothelin B receptor binding(GO:0031708) |
| 0.0 | 0.2 | GO:0030023 | extracellular matrix constituent conferring elasticity(GO:0030023) |
| 0.0 | 0.0 | GO:0051538 | 3 iron, 4 sulfur cluster binding(GO:0051538) |
| 0.0 | 0.3 | GO:0008140 | cAMP response element binding protein binding(GO:0008140) |
| 0.0 | 0.2 | GO:0004523 | RNA-DNA hybrid ribonuclease activity(GO:0004523) |
| 0.0 | 0.1 | GO:0008798 | beta-aspartyl-peptidase activity(GO:0008798) |
| 0.0 | 0.1 | GO:0003958 | NADPH-hemoprotein reductase activity(GO:0003958) |
| 0.0 | 0.0 | GO:0005137 | interleukin-5 receptor binding(GO:0005137) |
| 0.0 | 0.1 | GO:0030618 | transforming growth factor beta receptor, pathway-specific cytoplasmic mediator activity(GO:0030618) |
| 0.0 | 0.5 | GO:0000900 | translation repressor activity, nucleic acid binding(GO:0000900) |
| 0.0 | 0.2 | GO:0032050 | clathrin heavy chain binding(GO:0032050) |
| 0.0 | 0.3 | GO:0042609 | CD4 receptor binding(GO:0042609) |
| 0.0 | 1.3 | GO:0001540 | beta-amyloid binding(GO:0001540) |
| 0.0 | 0.1 | GO:0019136 | deoxynucleoside kinase activity(GO:0019136) |
| 0.0 | 0.2 | GO:0008420 | CTD phosphatase activity(GO:0008420) |
| 0.0 | 0.0 | GO:0042947 | glucoside transmembrane transporter activity(GO:0042947) |
| 0.0 | 0.5 | GO:0070566 | adenylyltransferase activity(GO:0070566) |
| 0.0 | 0.4 | GO:0035198 | miRNA binding(GO:0035198) |
| 0.0 | 0.1 | GO:0003839 | gamma-glutamylcyclotransferase activity(GO:0003839) |
| 0.0 | 0.1 | GO:0015526 | hexose phosphate transmembrane transporter activity(GO:0015119) organophosphate:inorganic phosphate antiporter activity(GO:0015315) hexose-phosphate:inorganic phosphate antiporter activity(GO:0015526) glucose 6-phosphate:inorganic phosphate antiporter activity(GO:0061513) |
| 0.0 | 0.1 | GO:0061133 | endopeptidase activator activity(GO:0061133) |
| 0.0 | 0.8 | GO:0035255 | ionotropic glutamate receptor binding(GO:0035255) |
| 0.0 | 0.1 | GO:1990050 | phosphatidic acid transporter activity(GO:1990050) |
| 0.0 | 1.4 | GO:0016209 | antioxidant activity(GO:0016209) |
| 0.0 | 0.4 | GO:0005247 | voltage-gated chloride channel activity(GO:0005247) |
| 0.0 | 0.3 | GO:0071949 | FAD binding(GO:0071949) |
| 0.0 | 0.0 | GO:0071207 | histone pre-mRNA stem-loop binding(GO:0071207) |
| 0.0 | 0.2 | GO:0045236 | CXCR chemokine receptor binding(GO:0045236) |
| 0.0 | 3.7 | GO:0019902 | phosphatase binding(GO:0019902) |
| 0.0 | 0.0 | GO:0000104 | succinate dehydrogenase activity(GO:0000104) |
| 0.0 | 0.4 | GO:0070530 | K63-linked polyubiquitin binding(GO:0070530) |
| 0.0 | 0.5 | GO:0005184 | neuropeptide hormone activity(GO:0005184) |
| 0.0 | 0.1 | GO:0050501 | hyaluronan synthase activity(GO:0050501) |
| 0.0 | 0.0 | GO:0004750 | ribulose-phosphate 3-epimerase activity(GO:0004750) |
| 0.0 | 2.4 | GO:0017137 | Rab GTPase binding(GO:0017137) |
| 0.0 | 0.1 | GO:0016312 | inositol bisphosphate phosphatase activity(GO:0016312) |
| 0.0 | 0.1 | GO:0031435 | mitogen-activated protein kinase kinase kinase binding(GO:0031435) |
| 0.0 | 3.2 | GO:0003713 | transcription coactivator activity(GO:0003713) |
| 0.0 | 0.5 | GO:0044183 | protein binding involved in protein folding(GO:0044183) |
| 0.0 | 0.0 | GO:0004598 | peptidylglycine monooxygenase activity(GO:0004504) peptidylamidoglycolate lyase activity(GO:0004598) |
| 0.0 | 0.1 | GO:0001165 | RNA polymerase I upstream control element sequence-specific DNA binding(GO:0001165) |
| 0.0 | 0.1 | GO:0017034 | Rap guanyl-nucleotide exchange factor activity(GO:0017034) |
| 0.0 | 0.2 | GO:0000774 | adenyl-nucleotide exchange factor activity(GO:0000774) |
| 0.0 | 0.0 | GO:0005010 | insulin-like growth factor-activated receptor activity(GO:0005010) |
| 0.0 | 0.1 | GO:0042799 | histone methyltransferase activity (H4-K20 specific)(GO:0042799) |
| 0.0 | 0.2 | GO:0000062 | fatty-acyl-CoA binding(GO:0000062) |
| 0.0 | 2.0 | GO:0005200 | structural constituent of cytoskeleton(GO:0005200) |
| 0.0 | 0.3 | GO:0004298 | threonine-type endopeptidase activity(GO:0004298) threonine-type peptidase activity(GO:0070003) |
| 0.0 | 0.1 | GO:0008273 | calcium, potassium:sodium antiporter activity(GO:0008273) |
| 0.0 | 0.1 | GO:0070290 | N-acylphosphatidylethanolamine-specific phospholipase D activity(GO:0070290) |
| 0.0 | 0.1 | GO:0001135 | transcription factor activity, RNA polymerase II transcription factor recruiting(GO:0001135) |
| 0.0 | 0.2 | GO:0019992 | diacylglycerol binding(GO:0019992) |
| 0.0 | 0.4 | GO:0005086 | ARF guanyl-nucleotide exchange factor activity(GO:0005086) |
| 0.0 | 0.0 | GO:0004080 | biotin-[acetyl-CoA-carboxylase] ligase activity(GO:0004077) biotin-[methylcrotonoyl-CoA-carboxylase] ligase activity(GO:0004078) biotin-[methylmalonyl-CoA-carboxytransferase] ligase activity(GO:0004079) biotin-[propionyl-CoA-carboxylase (ATP-hydrolyzing)] ligase activity(GO:0004080) biotin-protein ligase activity(GO:0018271) |
| 0.0 | 0.5 | GO:0030552 | cAMP binding(GO:0030552) |
| 0.0 | 0.1 | GO:0016015 | morphogen activity(GO:0016015) BMP binding(GO:0036122) |
Gene overrepresentation in curated gene sets: canonical pathways category:
| Log-likelihood per target | Total log-likelihood | Term | Description |
|---|---|---|---|
| 0.1 | 2.7 | PID ARF 3PATHWAY | Arf1 pathway |
| 0.1 | 1.8 | PID S1P S1P4 PATHWAY | S1P4 pathway |
| 0.1 | 1.3 | SA PROGRAMMED CELL DEATH | Programmed cell death, or apoptosis, eliminates damaged or unneeded cells. |
| 0.1 | 1.7 | SA PTEN PATHWAY | PTEN is a tumor suppressor that dephosphorylates the lipid messenger phosphatidylinositol triphosphate. |
| 0.0 | 1.9 | PID HIV NEF PATHWAY | HIV-1 Nef: Negative effector of Fas and TNF-alpha |
| 0.0 | 2.1 | PID TRAIL PATHWAY | TRAIL signaling pathway |
| 0.0 | 2.5 | PID RXR VDR PATHWAY | RXR and RAR heterodimerization with other nuclear receptor |
| 0.0 | 1.1 | PID TCR JNK PATHWAY | JNK signaling in the CD4+ TCR pathway |
| 0.0 | 3.6 | PID P53 REGULATION PATHWAY | p53 pathway |
| 0.0 | 0.4 | SA FAS SIGNALING | The TNF-type receptor Fas induces apoptosis on ligand binding. |
| 0.0 | 1.4 | PID P38 MK2 PATHWAY | p38 signaling mediated by MAPKAP kinases |
| 0.0 | 0.7 | PID RANBP2 PATHWAY | Sumoylation by RanBP2 regulates transcriptional repression |
| 0.0 | 0.9 | PID INSULIN GLUCOSE PATHWAY | Insulin-mediated glucose transport |
| 0.0 | 1.0 | ST GA12 PATHWAY | G alpha 12 Pathway |
| 0.0 | 1.9 | PID NETRIN PATHWAY | Netrin-mediated signaling events |
| 0.0 | 1.6 | PID HIF2PATHWAY | HIF-2-alpha transcription factor network |
| 0.0 | 0.7 | PID PI3K PLC TRK PATHWAY | Trk receptor signaling mediated by PI3K and PLC-gamma |
| 0.0 | 0.3 | PID FAK PATHWAY | Signaling events mediated by focal adhesion kinase |
| 0.0 | 1.4 | SIG REGULATION OF THE ACTIN CYTOSKELETON BY RHO GTPASES | Genes related to regulation of the actin cytoskeleton |
| 0.0 | 0.2 | ST INTERFERON GAMMA PATHWAY | Interferon gamma pathway. |
| 0.0 | 1.1 | PID AURORA A PATHWAY | Aurora A signaling |
| 0.0 | 0.4 | ST GAQ PATHWAY | G alpha q Pathway |
| 0.0 | 1.2 | SIG PIP3 SIGNALING IN B LYMPHOCYTES | Genes related to PIP3 signaling in B lymphocytes |
| 0.0 | 0.2 | ST TYPE I INTERFERON PATHWAY | Type I Interferon (alpha/beta IFN) Pathway |
| 0.0 | 0.3 | SA G1 AND S PHASES | Cdk2, 4, and 6 bind cyclin D in G1, while cdk2/cyclin E promotes the G1/S transition. |
| 0.0 | 1.7 | PID VEGFR1 2 PATHWAY | Signaling events mediated by VEGFR1 and VEGFR2 |
| 0.0 | 0.7 | PID EPHB FWD PATHWAY | EPHB forward signaling |
| 0.0 | 0.7 | PID MYC PATHWAY | C-MYC pathway |
| 0.0 | 1.0 | PID IL6 7 PATHWAY | IL6-mediated signaling events |
| 0.0 | 0.6 | PID IL8 CXCR1 PATHWAY | IL8- and CXCR1-mediated signaling events |
| 0.0 | 0.6 | PID INSULIN PATHWAY | Insulin Pathway |
| 0.0 | 1.3 | PID AR TF PATHWAY | Regulation of Androgen receptor activity |
| 0.0 | 0.4 | PID THROMBIN PAR1 PATHWAY | PAR1-mediated thrombin signaling events |
| 0.0 | 0.4 | PID ALK2 PATHWAY | ALK2 signaling events |
| 0.0 | 0.8 | PID FCER1 PATHWAY | Fc-epsilon receptor I signaling in mast cells |
| 0.0 | 0.9 | PID A6B1 A6B4 INTEGRIN PATHWAY | a6b1 and a6b4 Integrin signaling |
| 0.0 | 0.4 | PID P38 MKK3 6PATHWAY | p38 MAPK signaling pathway |
| 0.0 | 0.4 | PID SYNDECAN 2 PATHWAY | Syndecan-2-mediated signaling events |
| 0.0 | 0.7 | PID INTEGRIN A4B1 PATHWAY | Alpha4 beta1 integrin signaling events |
| 0.0 | 0.2 | PID RET PATHWAY | Signaling events regulated by Ret tyrosine kinase |
| 0.0 | 0.6 | PID ECADHERIN NASCENT AJ PATHWAY | E-cadherin signaling in the nascent adherens junction |
| 0.0 | 0.2 | PID IL1 PATHWAY | IL1-mediated signaling events |
| 0.0 | 0.8 | PID ILK PATHWAY | Integrin-linked kinase signaling |
| 0.0 | 0.5 | PID PS1 PATHWAY | Presenilin action in Notch and Wnt signaling |
| 0.0 | 0.2 | PID NECTIN PATHWAY | Nectin adhesion pathway |
| 0.0 | 0.7 | PID CDC42 REG PATHWAY | Regulation of CDC42 activity |
| 0.0 | 0.4 | PID HEDGEHOG GLI PATHWAY | Hedgehog signaling events mediated by Gli proteins |
| 0.0 | 0.7 | PID PDGFRB PATHWAY | PDGFR-beta signaling pathway |
Gene overrepresentation in curated gene sets: REACTOME pathways category:
| Log-likelihood per target | Total log-likelihood | Term | Description |
|---|---|---|---|
| 0.4 | 2.0 | REACTOME FORMATION OF TRANSCRIPTION COUPLED NER TC NER REPAIR COMPLEX | Genes involved in Formation of transcription-coupled NER (TC-NER) repair complex |
| 0.2 | 3.2 | REACTOME ALPHA LINOLENIC ACID ALA METABOLISM | Genes involved in alpha-linolenic acid (ALA) metabolism |
| 0.2 | 1.7 | REACTOME ABORTIVE ELONGATION OF HIV1 TRANSCRIPT IN THE ABSENCE OF TAT | Genes involved in Abortive elongation of HIV-1 transcript in the absence of Tat |
| 0.2 | 3.2 | REACTOME REGULATION OF RHEB GTPASE ACTIVITY BY AMPK | Genes involved in Regulation of Rheb GTPase activity by AMPK |
| 0.2 | 1.9 | REACTOME COPI MEDIATED TRANSPORT | Genes involved in COPI Mediated Transport |
| 0.1 | 2.4 | REACTOME ROLE OF DCC IN REGULATING APOPTOSIS | Genes involved in Role of DCC in regulating apoptosis |
| 0.1 | 4.2 | REACTOME FORMATION OF INCISION COMPLEX IN GG NER | Genes involved in Formation of incision complex in GG-NER |
| 0.1 | 1.3 | REACTOME APOBEC3G MEDIATED RESISTANCE TO HIV1 INFECTION | Genes involved in APOBEC3G mediated resistance to HIV-1 infection |
| 0.1 | 5.6 | REACTOME SMOOTH MUSCLE CONTRACTION | Genes involved in Smooth Muscle Contraction |
| 0.1 | 3.6 | REACTOME RNA POL II TRANSCRIPTION PRE INITIATION AND PROMOTER OPENING | Genes involved in RNA Polymerase II Transcription Pre-Initiation And Promoter Opening |
| 0.1 | 1.7 | REACTOME PURINE SALVAGE | Genes involved in Purine salvage |
| 0.1 | 2.4 | REACTOME SEMA4D INDUCED CELL MIGRATION AND GROWTH CONE COLLAPSE | Genes involved in Sema4D induced cell migration and growth-cone collapse |
| 0.1 | 1.5 | REACTOME MRNA DECAY BY 5 TO 3 EXORIBONUCLEASE | Genes involved in mRNA Decay by 5' to 3' Exoribonuclease |
| 0.1 | 0.8 | REACTOME IRAK1 RECRUITS IKK COMPLEX | Genes involved in IRAK1 recruits IKK complex |
| 0.1 | 0.9 | REACTOME THE ACTIVATION OF ARYLSULFATASES | Genes involved in The activation of arylsulfatases |
| 0.0 | 0.5 | REACTOME RAF MAP KINASE CASCADE | Genes involved in RAF/MAP kinase cascade |
| 0.0 | 1.3 | REACTOME RETROGRADE NEUROTROPHIN SIGNALLING | Genes involved in Retrograde neurotrophin signalling |
| 0.0 | 1.5 | REACTOME INSULIN SYNTHESIS AND PROCESSING | Genes involved in Insulin Synthesis and Processing |
| 0.0 | 0.9 | REACTOME ERKS ARE INACTIVATED | Genes involved in ERKs are inactivated |
| 0.0 | 1.3 | REACTOME TIE2 SIGNALING | Genes involved in Tie2 Signaling |
| 0.0 | 0.7 | REACTOME SYNTHESIS OF PIPS AT THE LATE ENDOSOME MEMBRANE | Genes involved in Synthesis of PIPs at the late endosome membrane |
| 0.0 | 1.1 | REACTOME SIGNAL REGULATORY PROTEIN SIRP FAMILY INTERACTIONS | Genes involved in Signal regulatory protein (SIRP) family interactions |
| 0.0 | 2.8 | REACTOME FORMATION OF THE TERNARY COMPLEX AND SUBSEQUENTLY THE 43S COMPLEX | Genes involved in Formation of the ternary complex, and subsequently, the 43S complex |
| 0.0 | 0.1 | REACTOME SCF BETA TRCP MEDIATED DEGRADATION OF EMI1 | Genes involved in SCF-beta-TrCP mediated degradation of Emi1 |
| 0.0 | 0.3 | REACTOME PROLONGED ERK ACTIVATION EVENTS | Genes involved in Prolonged ERK activation events |
| 0.0 | 0.9 | REACTOME PKA MEDIATED PHOSPHORYLATION OF CREB | Genes involved in PKA-mediated phosphorylation of CREB |
| 0.0 | 1.3 | REACTOME TRAF6 MEDIATED IRF7 ACTIVATION | Genes involved in TRAF6 mediated IRF7 activation |
| 0.0 | 1.1 | REACTOME LYSOSOME VESICLE BIOGENESIS | Genes involved in Lysosome Vesicle Biogenesis |
| 0.0 | 0.7 | REACTOME CITRIC ACID CYCLE TCA CYCLE | Genes involved in Citric acid cycle (TCA cycle) |
| 0.0 | 1.1 | REACTOME TGF BETA RECEPTOR SIGNALING ACTIVATES SMADS | Genes involved in TGF-beta receptor signaling activates SMADs |
| 0.0 | 0.5 | REACTOME ACTIVATED AMPK STIMULATES FATTY ACID OXIDATION IN MUSCLE | Genes involved in Activated AMPK stimulates fatty-acid oxidation in muscle |
| 0.0 | 2.6 | REACTOME RESPIRATORY ELECTRON TRANSPORT | Genes involved in Respiratory electron transport |
| 0.0 | 1.0 | REACTOME CASPASE MEDIATED CLEAVAGE OF CYTOSKELETAL PROTEINS | Genes involved in Caspase-mediated cleavage of cytoskeletal proteins |
| 0.0 | 1.2 | REACTOME SYNTHESIS OF PIPS AT THE PLASMA MEMBRANE | Genes involved in Synthesis of PIPs at the plasma membrane |
| 0.0 | 2.8 | REACTOME INFLUENZA VIRAL RNA TRANSCRIPTION AND REPLICATION | Genes involved in Influenza Viral RNA Transcription and Replication |
| 0.0 | 1.1 | REACTOME INTRINSIC PATHWAY FOR APOPTOSIS | Genes involved in Intrinsic Pathway for Apoptosis |
| 0.0 | 0.5 | REACTOME BASE FREE SUGAR PHOSPHATE REMOVAL VIA THE SINGLE NUCLEOTIDE REPLACEMENT PATHWAY | Genes involved in Base-free sugar-phosphate removal via the single-nucleotide replacement pathway |
| 0.0 | 14.2 | REACTOME GENERIC TRANSCRIPTION PATHWAY | Genes involved in Generic Transcription Pathway |
| 0.0 | 0.6 | REACTOME PROTEOLYTIC CLEAVAGE OF SNARE COMPLEX PROTEINS | Genes involved in Proteolytic cleavage of SNARE complex proteins |
| 0.0 | 0.8 | REACTOME INSULIN RECEPTOR RECYCLING | Genes involved in Insulin receptor recycling |
| 0.0 | 0.3 | REACTOME CREATION OF C4 AND C2 ACTIVATORS | Genes involved in Creation of C4 and C2 activators |
| 0.0 | 0.0 | REACTOME SOS MEDIATED SIGNALLING | Genes involved in SOS-mediated signalling |
| 0.0 | 1.6 | REACTOME GLUCONEOGENESIS | Genes involved in Gluconeogenesis |
| 0.0 | 0.6 | REACTOME EXTRINSIC PATHWAY FOR APOPTOSIS | Genes involved in Extrinsic Pathway for Apoptosis |
| 0.0 | 0.3 | REACTOME SYNTHESIS OF PIPS AT THE GOLGI MEMBRANE | Genes involved in Synthesis of PIPs at the Golgi membrane |
| 0.0 | 0.8 | REACTOME SYNTHESIS OF PA | Genes involved in Synthesis of PA |
| 0.0 | 0.2 | REACTOME G2 M DNA DAMAGE CHECKPOINT | Genes involved in G2/M DNA damage checkpoint |
| 0.0 | 0.7 | REACTOME CONVERSION FROM APC C CDC20 TO APC C CDH1 IN LATE ANAPHASE | Genes involved in Conversion from APC/C:Cdc20 to APC/C:Cdh1 in late anaphase |
| 0.0 | 0.8 | REACTOME MHC CLASS II ANTIGEN PRESENTATION | Genes involved in MHC class II antigen presentation |
| 0.0 | 1.7 | REACTOME METABOLISM OF VITAMINS AND COFACTORS | Genes involved in Metabolism of vitamins and cofactors |
| 0.0 | 0.5 | REACTOME RAP1 SIGNALLING | Genes involved in Rap1 signalling |
| 0.0 | 0.7 | REACTOME SYNTHESIS OF PC | Genes involved in Synthesis of PC |
| 0.0 | 0.1 | REACTOME INHIBITION OF REPLICATION INITIATION OF DAMAGED DNA BY RB1 E2F1 | Genes involved in Inhibition of replication initiation of damaged DNA by RB1/E2F1 |
| 0.0 | 0.1 | REACTOME RNA POL II PRE TRANSCRIPTION EVENTS | Genes involved in RNA Polymerase II Pre-transcription Events |
| 0.0 | 0.7 | REACTOME SYNTHESIS AND INTERCONVERSION OF NUCLEOTIDE DI AND TRIPHOSPHATES | Genes involved in Synthesis and interconversion of nucleotide di- and triphosphates |
| 0.0 | 0.2 | REACTOME GAP JUNCTION DEGRADATION | Genes involved in Gap junction degradation |
| 0.0 | 0.5 | REACTOME SIGNALING BY HIPPO | Genes involved in Signaling by Hippo |
| 0.0 | 0.4 | REACTOME JNK C JUN KINASES PHOSPHORYLATION AND ACTIVATION MEDIATED BY ACTIVATED HUMAN TAK1 | Genes involved in JNK (c-Jun kinases) phosphorylation and activation mediated by activated human TAK1 |
| 0.0 | 0.3 | REACTOME CYCLIN A B1 ASSOCIATED EVENTS DURING G2 M TRANSITION | Genes involved in Cyclin A/B1 associated events during G2/M transition |
| 0.0 | 0.2 | REACTOME TRYPTOPHAN CATABOLISM | Genes involved in Tryptophan catabolism |
| 0.0 | 0.4 | REACTOME REGULATION OF IFNG SIGNALING | Genes involved in Regulation of IFNG signaling |
| 0.0 | 0.5 | REACTOME ANTIGEN PRESENTATION FOLDING ASSEMBLY AND PEPTIDE LOADING OF CLASS I MHC | Genes involved in Antigen Presentation: Folding, assembly and peptide loading of class I MHC |
| 0.0 | 0.2 | REACTOME REGULATION OF IFNA SIGNALING | Genes involved in Regulation of IFNA signaling |
| 0.0 | 0.4 | REACTOME MRNA SPLICING MINOR PATHWAY | Genes involved in mRNA Splicing - Minor Pathway |
| 0.0 | 1.5 | REACTOME PPARA ACTIVATES GENE EXPRESSION | Genes involved in PPARA Activates Gene Expression |
| 0.0 | 1.3 | REACTOME MYD88 MAL CASCADE INITIATED ON PLASMA MEMBRANE | Genes involved in MyD88:Mal cascade initiated on plasma membrane |
| 0.0 | 0.6 | REACTOME GLUTATHIONE CONJUGATION | Genes involved in Glutathione conjugation |
| 0.0 | 0.1 | REACTOME IL 6 SIGNALING | Genes involved in Interleukin-6 signaling |
| 0.0 | 0.4 | REACTOME PROLACTIN RECEPTOR SIGNALING | Genes involved in Prolactin receptor signaling |
| 0.0 | 0.2 | REACTOME SYNTHESIS OF SUBSTRATES IN N GLYCAN BIOSYTHESIS | Genes involved in Synthesis of substrates in N-glycan biosythesis |
| 0.0 | 0.1 | REACTOME AKT PHOSPHORYLATES TARGETS IN THE CYTOSOL | Genes involved in AKT phosphorylates targets in the cytosol |
| 0.0 | 0.1 | REACTOME RESOLUTION OF AP SITES VIA THE MULTIPLE NUCLEOTIDE PATCH REPLACEMENT PATHWAY | Genes involved in Resolution of AP sites via the multiple-nucleotide patch replacement pathway |
| 0.0 | 0.4 | REACTOME BRANCHED CHAIN AMINO ACID CATABOLISM | Genes involved in Branched-chain amino acid catabolism |
| 0.0 | 0.2 | REACTOME CRMPS IN SEMA3A SIGNALING | Genes involved in CRMPs in Sema3A signaling |
| 0.0 | 0.3 | REACTOME ABCA TRANSPORTERS IN LIPID HOMEOSTASIS | Genes involved in ABCA transporters in lipid homeostasis |
| 0.0 | 0.9 | REACTOME O LINKED GLYCOSYLATION OF MUCINS | Genes involved in O-linked glycosylation of mucins |
| 0.0 | 0.3 | REACTOME GLYCOGEN BREAKDOWN GLYCOGENOLYSIS | Genes involved in Glycogen breakdown (glycogenolysis) |
| 0.0 | 0.4 | REACTOME SEMA3A PAK DEPENDENT AXON REPULSION | Genes involved in Sema3A PAK dependent Axon repulsion |
| 0.0 | 0.4 | REACTOME GABA A RECEPTOR ACTIVATION | Genes involved in GABA A receptor activation |
| 0.0 | 0.3 | REACTOME SULFUR AMINO ACID METABOLISM | Genes involved in Sulfur amino acid metabolism |
| 0.0 | 0.4 | REACTOME REGULATION OF HYPOXIA INDUCIBLE FACTOR HIF BY OXYGEN | Genes involved in Regulation of Hypoxia-inducible Factor (HIF) by Oxygen |
| 0.0 | 0.5 | REACTOME CGMP EFFECTS | Genes involved in cGMP effects |
| 0.0 | 0.3 | REACTOME G BETA GAMMA SIGNALLING THROUGH PI3KGAMMA | Genes involved in G beta:gamma signalling through PI3Kgamma |
| 0.0 | 0.1 | REACTOME NEGATIVE REGULATION OF THE PI3K AKT NETWORK | Genes involved in Negative regulation of the PI3K/AKT network |
| 0.0 | 0.1 | REACTOME NEF MEDIATES DOWN MODULATION OF CELL SURFACE RECEPTORS BY RECRUITING THEM TO CLATHRIN ADAPTERS | Genes involved in Nef-mediates down modulation of cell surface receptors by recruiting them to clathrin adapters |
| 0.0 | 0.2 | REACTOME EGFR DOWNREGULATION | Genes involved in EGFR downregulation |
| 0.0 | 2.8 | REACTOME ANTIGEN PROCESSING UBIQUITINATION PROTEASOME DEGRADATION | Genes involved in Antigen processing: Ubiquitination & Proteasome degradation |
| 0.0 | 0.4 | REACTOME CELL EXTRACELLULAR MATRIX INTERACTIONS | Genes involved in Cell-extracellular matrix interactions |
| 0.0 | 0.2 | REACTOME BILE SALT AND ORGANIC ANION SLC TRANSPORTERS | Genes involved in Bile salt and organic anion SLC transporters |
| 0.0 | 0.2 | REACTOME COMMON PATHWAY | Genes involved in Common Pathway |
| 0.0 | 0.2 | REACTOME OTHER SEMAPHORIN INTERACTIONS | Genes involved in Other semaphorin interactions |