Project
Epithelial-Mesenchymal Transition, human (Scheel, 2011)
Navigation
Downloads
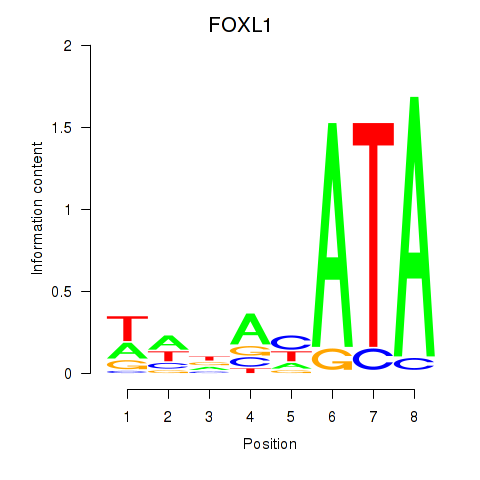
Results for FOXL1
Z-value: 1.08
Motif logo
Transcription factors associated with FOXL1
| Gene Symbol | Gene ID | Gene Info |
|---|---|---|
|
FOXL1
|
ENSG00000176678.6 | forkhead box L1 |
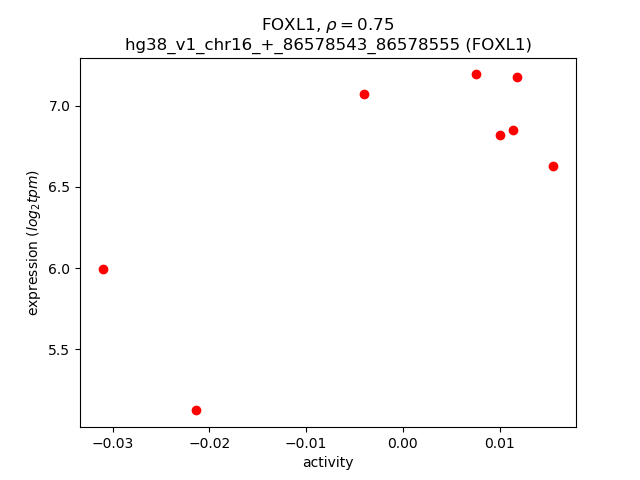
Activity-expression correlation:
| Gene | Promoter | Pearson corr. coef. | P-value | Plot |
|---|---|---|---|---|
| FOXL1 | hg38_v1_chr16_+_86578543_86578555 | 0.75 | 3.1e-02 | Click! |
Activity profile of FOXL1 motif
Sorted Z-values of FOXL1 motif
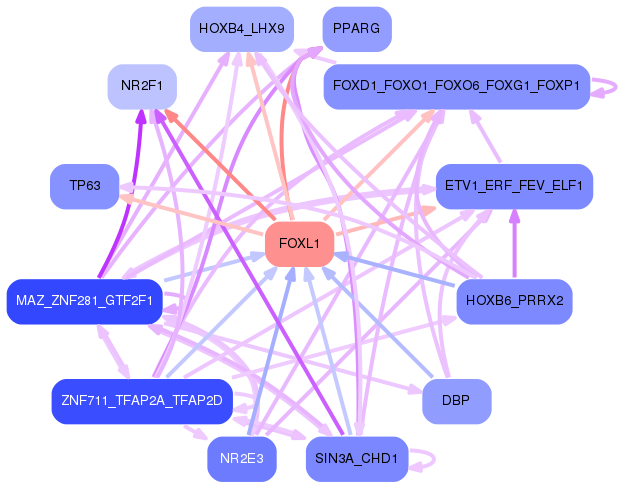
Network of associatons between targets according to the STRING database.

First level regulatory network of FOXL1
Gene Ontology Analysis
Gene overrepresentation in biological process category:
| Log-likelihood per target | Total log-likelihood | Term | Description |
|---|---|---|---|
| 1.1 | 3.4 | GO:1903015 | regulation of exo-alpha-sialidase activity(GO:1903015) |
| 0.7 | 12.5 | GO:1900747 | negative regulation of vascular endothelial growth factor signaling pathway(GO:1900747) |
| 0.6 | 2.2 | GO:1990523 | bone regeneration(GO:1990523) |
| 0.5 | 3.3 | GO:2000230 | negative regulation of pancreatic stellate cell proliferation(GO:2000230) |
| 0.5 | 2.8 | GO:0070171 | negative regulation of tooth mineralization(GO:0070171) |
| 0.4 | 2.5 | GO:0060414 | aorta smooth muscle tissue morphogenesis(GO:0060414) |
| 0.3 | 1.6 | GO:0008218 | bioluminescence(GO:0008218) |
| 0.2 | 0.5 | GO:0046110 | xanthine metabolic process(GO:0046110) |
| 0.2 | 0.9 | GO:0097325 | melanocyte proliferation(GO:0097325) |
| 0.2 | 1.5 | GO:1901475 | pyruvate transport(GO:0006848) pyruvate transmembrane transport(GO:1901475) |
| 0.2 | 0.6 | GO:0061182 | negative regulation of chondrocyte development(GO:0061182) |
| 0.2 | 0.5 | GO:0048058 | compound eye corneal lens development(GO:0048058) |
| 0.2 | 0.5 | GO:2000097 | regulation of smooth muscle cell-matrix adhesion(GO:2000097) |
| 0.1 | 1.9 | GO:0034465 | response to carbon monoxide(GO:0034465) |
| 0.1 | 2.3 | GO:0002315 | marginal zone B cell differentiation(GO:0002315) |
| 0.1 | 1.2 | GO:0007598 | blood coagulation, extrinsic pathway(GO:0007598) |
| 0.1 | 0.4 | GO:0098746 | fast, calcium ion-dependent exocytosis of neurotransmitter(GO:0098746) |
| 0.1 | 3.0 | GO:0051923 | sulfation(GO:0051923) |
| 0.1 | 0.3 | GO:0019878 | lysine biosynthetic process(GO:0009085) lysine biosynthetic process via aminoadipic acid(GO:0019878) |
| 0.1 | 5.2 | GO:0000188 | inactivation of MAPK activity(GO:0000188) |
| 0.1 | 0.3 | GO:0035026 | leading edge cell differentiation(GO:0035026) |
| 0.1 | 0.4 | GO:0086097 | phospholipase C-activating angiotensin-activated signaling pathway(GO:0086097) |
| 0.1 | 0.4 | GO:0018032 | protein amidation(GO:0018032) |
| 0.1 | 0.6 | GO:0097498 | endothelial tube lumen extension(GO:0097498) |
| 0.1 | 0.9 | GO:0043152 | induction of bacterial agglutination(GO:0043152) |
| 0.1 | 0.3 | GO:0031443 | fast-twitch skeletal muscle fiber contraction(GO:0031443) |
| 0.1 | 0.3 | GO:2000661 | positive regulation of interleukin-1-mediated signaling pathway(GO:2000661) |
| 0.1 | 0.1 | GO:0002314 | germinal center B cell differentiation(GO:0002314) |
| 0.1 | 0.3 | GO:0046379 | extracellular polysaccharide biosynthetic process(GO:0045226) extracellular polysaccharide metabolic process(GO:0046379) |
| 0.1 | 0.2 | GO:0002769 | natural killer cell inhibitory signaling pathway(GO:0002769) |
| 0.1 | 0.3 | GO:1903575 | cornified envelope assembly(GO:1903575) |
| 0.1 | 0.2 | GO:0034092 | negative regulation of maintenance of sister chromatid cohesion(GO:0034092) negative regulation of maintenance of mitotic sister chromatid cohesion(GO:0034183) maintenance of mitotic sister chromatid cohesion, telomeric(GO:0099403) mitotic sister chromatid cohesion, telomeric(GO:0099404) regulation of maintenance of mitotic sister chromatid cohesion, telomeric(GO:1904907) negative regulation of maintenance of mitotic sister chromatid cohesion, telomeric(GO:1904908) |
| 0.1 | 0.2 | GO:0046725 | negative regulation by virus of viral protein levels in host cell(GO:0046725) negative regulation of metanephric nephron tubule epithelial cell differentiation(GO:0072308) |
| 0.1 | 0.6 | GO:0051388 | positive regulation of neurotrophin TRK receptor signaling pathway(GO:0051388) |
| 0.1 | 0.2 | GO:0002874 | regulation of chronic inflammatory response to antigenic stimulus(GO:0002874) positive regulation of chronic inflammatory response to antigenic stimulus(GO:0002876) |
| 0.1 | 0.6 | GO:0036371 | protein localization to T-tubule(GO:0036371) |
| 0.1 | 0.4 | GO:0050916 | sensory perception of sweet taste(GO:0050916) sensory perception of umami taste(GO:0050917) |
| 0.1 | 1.5 | GO:0055003 | cardiac myofibril assembly(GO:0055003) |
| 0.1 | 1.0 | GO:0006069 | ethanol oxidation(GO:0006069) |
| 0.1 | 0.4 | GO:0019348 | dolichol metabolic process(GO:0019348) |
| 0.1 | 1.0 | GO:0042340 | keratan sulfate catabolic process(GO:0042340) |
| 0.1 | 0.2 | GO:0045897 | positive regulation of transcription during mitosis(GO:0045897) |
| 0.1 | 0.1 | GO:2000538 | regulation of B cell chemotaxis(GO:2000537) positive regulation of B cell chemotaxis(GO:2000538) |
| 0.1 | 0.2 | GO:0035262 | gonad morphogenesis(GO:0035262) |
| 0.1 | 1.8 | GO:0070886 | positive regulation of calcineurin-NFAT signaling cascade(GO:0070886) |
| 0.1 | 0.4 | GO:0032417 | positive regulation of sodium:proton antiporter activity(GO:0032417) |
| 0.1 | 0.5 | GO:0002318 | myeloid progenitor cell differentiation(GO:0002318) |
| 0.1 | 0.1 | GO:1901979 | regulation of inward rectifier potassium channel activity(GO:1901979) |
| 0.1 | 1.3 | GO:0033141 | positive regulation of peptidyl-serine phosphorylation of STAT protein(GO:0033141) |
| 0.1 | 0.6 | GO:0071492 | cellular response to UV-A(GO:0071492) |
| 0.1 | 0.2 | GO:0036060 | filtration diaphragm assembly(GO:0036058) slit diaphragm assembly(GO:0036060) |
| 0.1 | 0.8 | GO:0060155 | platelet dense granule organization(GO:0060155) |
| 0.1 | 0.1 | GO:0071630 | nucleus-associated proteasomal ubiquitin-dependent protein catabolic process(GO:0071630) |
| 0.1 | 0.4 | GO:0071386 | cellular response to corticosterone stimulus(GO:0071386) |
| 0.1 | 0.3 | GO:0010760 | negative regulation of macrophage chemotaxis(GO:0010760) |
| 0.1 | 0.6 | GO:0046600 | negative regulation of centriole replication(GO:0046600) |
| 0.1 | 0.2 | GO:1901421 | positive regulation of response to alcohol(GO:1901421) |
| 0.1 | 0.6 | GO:0006824 | cobalt ion transport(GO:0006824) |
| 0.1 | 1.5 | GO:0071447 | cellular response to hydroperoxide(GO:0071447) |
| 0.1 | 0.3 | GO:0001880 | Mullerian duct regression(GO:0001880) |
| 0.1 | 0.3 | GO:0048861 | leukemia inhibitory factor signaling pathway(GO:0048861) |
| 0.1 | 0.2 | GO:0019287 | isopentenyl diphosphate biosynthetic process, mevalonate pathway(GO:0019287) |
| 0.0 | 0.1 | GO:0038162 | erythropoietin-mediated signaling pathway(GO:0038162) |
| 0.0 | 0.1 | GO:2000360 | negative regulation of binding of sperm to zona pellucida(GO:2000360) |
| 0.0 | 0.1 | GO:0055011 | atrial cardiac muscle cell differentiation(GO:0055011) atrial cardiac muscle cell development(GO:0055014) |
| 0.0 | 0.4 | GO:2000124 | regulation of endocannabinoid signaling pathway(GO:2000124) |
| 0.0 | 0.5 | GO:2000096 | positive regulation of Wnt signaling pathway, planar cell polarity pathway(GO:2000096) |
| 0.0 | 1.4 | GO:0030728 | ovulation(GO:0030728) |
| 0.0 | 0.1 | GO:0002949 | tRNA threonylcarbamoyladenosine modification(GO:0002949) |
| 0.0 | 0.4 | GO:0070649 | formin-nucleated actin cable assembly(GO:0070649) |
| 0.0 | 0.2 | GO:0052651 | monoacylglycerol metabolic process(GO:0046462) monoacylglycerol catabolic process(GO:0052651) |
| 0.0 | 0.3 | GO:0044245 | polysaccharide digestion(GO:0044245) |
| 0.0 | 0.1 | GO:1901804 | beta-glucoside metabolic process(GO:1901804) beta-glucoside catabolic process(GO:1901805) positive regulation of neuronal action potential(GO:1904457) |
| 0.0 | 0.2 | GO:0030821 | negative regulation of cyclic nucleotide catabolic process(GO:0030806) negative regulation of cAMP catabolic process(GO:0030821) |
| 0.0 | 0.6 | GO:0070307 | lens fiber cell development(GO:0070307) |
| 0.0 | 0.1 | GO:0042732 | D-xylose metabolic process(GO:0042732) |
| 0.0 | 0.2 | GO:2000158 | positive regulation of ubiquitin-specific protease activity(GO:2000158) |
| 0.0 | 0.6 | GO:0048739 | cardiac muscle fiber development(GO:0048739) |
| 0.0 | 0.2 | GO:0002322 | B cell proliferation involved in immune response(GO:0002322) |
| 0.0 | 0.4 | GO:2001106 | regulation of Rho guanyl-nucleotide exchange factor activity(GO:2001106) |
| 0.0 | 0.4 | GO:1903943 | regulation of hepatocyte apoptotic process(GO:1903943) negative regulation of hepatocyte apoptotic process(GO:1903944) |
| 0.0 | 0.6 | GO:0051967 | negative regulation of synaptic transmission, glutamatergic(GO:0051967) |
| 0.0 | 0.1 | GO:1900228 | biofilm formation(GO:0042710) single-species biofilm formation(GO:0044010) single-species biofilm formation in or on host organism(GO:0044407) regulation of single-species biofilm formation(GO:1900190) negative regulation of single-species biofilm formation(GO:1900191) regulation of single-species biofilm formation in or on host organism(GO:1900228) negative regulation of single-species biofilm formation in or on host organism(GO:1900229) |
| 0.0 | 0.1 | GO:1903719 | regulation of I-kappaB phosphorylation(GO:1903719) positive regulation of I-kappaB phosphorylation(GO:1903721) |
| 0.0 | 0.3 | GO:0070294 | renal sodium ion absorption(GO:0070294) |
| 0.0 | 0.0 | GO:2000301 | negative regulation of synaptic vesicle exocytosis(GO:2000301) |
| 0.0 | 0.2 | GO:1901727 | positive regulation of histone deacetylase activity(GO:1901727) |
| 0.0 | 0.1 | GO:2000354 | regulation of ovarian follicle development(GO:2000354) |
| 0.0 | 0.1 | GO:0039007 | pronephric nephron morphogenesis(GO:0039007) pronephric nephron tubule morphogenesis(GO:0039008) pronephric duct development(GO:0039022) pronephric duct morphogenesis(GO:0039023) Kupffer's vesicle development(GO:0070121) |
| 0.0 | 0.1 | GO:0005986 | sucrose biosynthetic process(GO:0005986) |
| 0.0 | 0.2 | GO:2000580 | regulation of ATP-dependent microtubule motor activity, plus-end-directed(GO:2000580) positive regulation of ATP-dependent microtubule motor activity, plus-end-directed(GO:2000582) |
| 0.0 | 0.1 | GO:0038060 | nitric oxide-cGMP-mediated signaling pathway(GO:0038060) |
| 0.0 | 0.4 | GO:0046520 | sphingoid biosynthetic process(GO:0046520) |
| 0.0 | 0.2 | GO:1904306 | regulation of gastro-intestinal system smooth muscle contraction(GO:1904304) positive regulation of gastro-intestinal system smooth muscle contraction(GO:1904306) |
| 0.0 | 0.2 | GO:0097210 | response to gonadotropin-releasing hormone(GO:0097210) cellular response to gonadotropin-releasing hormone(GO:0097211) |
| 0.0 | 0.2 | GO:0006740 | NADPH regeneration(GO:0006740) |
| 0.0 | 0.3 | GO:0048280 | vesicle fusion with Golgi apparatus(GO:0048280) |
| 0.0 | 0.1 | GO:0003366 | cell-matrix adhesion involved in ameboidal cell migration(GO:0003366) |
| 0.0 | 0.1 | GO:1904977 | lymphatic endothelial cell migration(GO:1904977) |
| 0.0 | 0.5 | GO:0046007 | negative regulation of activated T cell proliferation(GO:0046007) |
| 0.0 | 0.1 | GO:0002361 | CD4-positive, CD25-positive, alpha-beta regulatory T cell differentiation(GO:0002361) |
| 0.0 | 0.3 | GO:0033314 | mitotic DNA replication checkpoint(GO:0033314) |
| 0.0 | 0.3 | GO:1902857 | positive regulation of nonmotile primary cilium assembly(GO:1902857) |
| 0.0 | 2.0 | GO:0006910 | phagocytosis, recognition(GO:0006910) |
| 0.0 | 0.2 | GO:0019255 | UDP-glucuronate biosynthetic process(GO:0006065) glucose 1-phosphate metabolic process(GO:0019255) |
| 0.0 | 0.1 | GO:0006106 | fumarate metabolic process(GO:0006106) |
| 0.0 | 0.2 | GO:1903026 | negative regulation of RNA polymerase II regulatory region sequence-specific DNA binding(GO:1903026) |
| 0.0 | 0.1 | GO:0007341 | penetration of zona pellucida(GO:0007341) |
| 0.0 | 0.2 | GO:0036072 | intramembranous ossification(GO:0001957) direct ossification(GO:0036072) |
| 0.0 | 0.1 | GO:0010693 | negative regulation of alkaline phosphatase activity(GO:0010693) negative regulation of epithelial to mesenchymal transition involved in endocardial cushion formation(GO:1905006) |
| 0.0 | 0.1 | GO:2000255 | negative regulation of male germ cell proliferation(GO:2000255) |
| 0.0 | 0.1 | GO:0045337 | geranyl diphosphate metabolic process(GO:0033383) geranyl diphosphate biosynthetic process(GO:0033384) farnesyl diphosphate biosynthetic process(GO:0045337) |
| 0.0 | 0.2 | GO:0006659 | phosphatidylserine biosynthetic process(GO:0006659) |
| 0.0 | 0.1 | GO:1904124 | microglial cell migration(GO:1904124) regulation of microglial cell migration(GO:1904139) |
| 0.0 | 0.1 | GO:0040038 | polar body extrusion after meiotic divisions(GO:0040038) |
| 0.0 | 0.4 | GO:0090110 | cargo loading into COPII-coated vesicle(GO:0090110) |
| 0.0 | 0.1 | GO:1990569 | UDP-N-acetylglucosamine transport(GO:0015788) UDP-N-acetylglucosamine transmembrane transport(GO:1990569) |
| 0.0 | 0.1 | GO:0030718 | germ-line stem cell population maintenance(GO:0030718) positive regulation of meiosis I(GO:0060903) |
| 0.0 | 0.4 | GO:0051531 | NFAT protein import into nucleus(GO:0051531) |
| 0.0 | 0.2 | GO:0039526 | suppression by virus of host apoptotic process(GO:0019050) modulation by virus of host apoptotic process(GO:0039526) |
| 0.0 | 0.3 | GO:1900119 | positive regulation of execution phase of apoptosis(GO:1900119) |
| 0.0 | 0.2 | GO:0090261 | positive regulation of inclusion body assembly(GO:0090261) |
| 0.0 | 0.1 | GO:0043091 | L-arginine import(GO:0043091) arginine import(GO:0090467) |
| 0.0 | 0.1 | GO:0019521 | aldonic acid metabolic process(GO:0019520) D-gluconate metabolic process(GO:0019521) |
| 0.0 | 0.1 | GO:0071418 | cellular response to amine stimulus(GO:0071418) |
| 0.0 | 0.2 | GO:0098735 | positive regulation of the force of heart contraction(GO:0098735) |
| 0.0 | 0.2 | GO:0060054 | positive regulation of epithelial cell proliferation involved in wound healing(GO:0060054) |
| 0.0 | 0.0 | GO:0042223 | positive regulation of interleukin-3 production(GO:0032752) interleukin-3 biosynthetic process(GO:0042223) regulation of interleukin-3 biosynthetic process(GO:0045399) positive regulation of interleukin-3 biosynthetic process(GO:0045401) |
| 0.0 | 0.3 | GO:0010745 | negative regulation of macrophage derived foam cell differentiation(GO:0010745) |
| 0.0 | 0.2 | GO:0002175 | protein localization to paranode region of axon(GO:0002175) |
| 0.0 | 3.8 | GO:0007229 | integrin-mediated signaling pathway(GO:0007229) |
| 0.0 | 0.4 | GO:0070986 | left/right axis specification(GO:0070986) |
| 0.0 | 0.2 | GO:0010891 | negative regulation of sequestering of triglyceride(GO:0010891) |
| 0.0 | 0.1 | GO:0006931 | substrate-dependent cell migration, cell attachment to substrate(GO:0006931) |
| 0.0 | 0.7 | GO:0051482 | positive regulation of cytosolic calcium ion concentration involved in phospholipase C-activating G-protein coupled signaling pathway(GO:0051482) |
| 0.0 | 0.1 | GO:0031456 | glycine betaine biosynthetic process from choline(GO:0019285) glycine betaine metabolic process(GO:0031455) glycine betaine biosynthetic process(GO:0031456) |
| 0.0 | 0.2 | GO:0072592 | oxygen metabolic process(GO:0072592) |
| 0.0 | 0.2 | GO:0032000 | positive regulation of fatty acid beta-oxidation(GO:0032000) |
| 0.0 | 0.0 | GO:0002436 | immune complex clearance(GO:0002434) immune complex clearance by monocytes and macrophages(GO:0002436) regulation of immune complex clearance by monocytes and macrophages(GO:0090264) |
| 0.0 | 0.0 | GO:1904049 | negative regulation of spontaneous neurotransmitter secretion(GO:1904049) |
| 0.0 | 0.1 | GO:0051919 | positive regulation of fibrinolysis(GO:0051919) |
| 0.0 | 0.1 | GO:0060708 | spongiotrophoblast differentiation(GO:0060708) |
| 0.0 | 0.1 | GO:0001920 | negative regulation of receptor recycling(GO:0001920) |
| 0.0 | 0.2 | GO:0010898 | positive regulation of triglyceride catabolic process(GO:0010898) |
| 0.0 | 0.1 | GO:0071896 | protein localization to adherens junction(GO:0071896) |
| 0.0 | 0.5 | GO:0048935 | peripheral nervous system neuron differentiation(GO:0048934) peripheral nervous system neuron development(GO:0048935) |
| 0.0 | 0.2 | GO:1904354 | negative regulation of telomere capping(GO:1904354) |
| 0.0 | 0.1 | GO:0040030 | regulation of molecular function, epigenetic(GO:0040030) |
| 0.0 | 0.0 | GO:0006533 | aspartate catabolic process(GO:0006533) |
| 0.0 | 0.1 | GO:0046900 | tetrahydrofolylpolyglutamate metabolic process(GO:0046900) |
| 0.0 | 0.0 | GO:0019541 | propionate metabolic process(GO:0019541) |
| 0.0 | 0.3 | GO:0032625 | interleukin-21 production(GO:0032625) interleukin-21 secretion(GO:0072619) |
| 0.0 | 0.2 | GO:0048245 | eosinophil chemotaxis(GO:0048245) |
| 0.0 | 0.1 | GO:0002378 | immunoglobulin biosynthetic process(GO:0002378) |
| 0.0 | 0.1 | GO:1902283 | negative regulation of primary amine oxidase activity(GO:1902283) |
| 0.0 | 0.1 | GO:0090119 | vesicle-mediated cholesterol transport(GO:0090119) |
| 0.0 | 0.1 | GO:0097338 | response to clozapine(GO:0097338) |
| 0.0 | 0.8 | GO:0000038 | very long-chain fatty acid metabolic process(GO:0000038) |
| 0.0 | 0.1 | GO:0048388 | endosomal lumen acidification(GO:0048388) |
| 0.0 | 0.0 | GO:0014810 | positive regulation of skeletal muscle contraction by regulation of release of sequestered calcium ion(GO:0014810) |
| 0.0 | 0.1 | GO:0051684 | maintenance of Golgi location(GO:0051684) |
| 0.0 | 0.2 | GO:1904424 | regulation of GTP binding(GO:1904424) |
| 0.0 | 0.0 | GO:0061011 | hepatic duct development(GO:0061011) |
| 0.0 | 0.1 | GO:0035754 | B cell chemotaxis(GO:0035754) |
| 0.0 | 0.0 | GO:1903410 | lysine import(GO:0034226) L-lysine import(GO:0061461) L-lysine import into cell(GO:1903410) |
| 0.0 | 0.0 | GO:0007161 | calcium-independent cell-matrix adhesion(GO:0007161) |
| 0.0 | 0.0 | GO:0038178 | complement component C5a signaling pathway(GO:0038178) |
| 0.0 | 0.3 | GO:0070168 | negative regulation of bone mineralization(GO:0030502) negative regulation of biomineral tissue development(GO:0070168) |
| 0.0 | 0.1 | GO:0046103 | adenosine catabolic process(GO:0006154) inosine biosynthetic process(GO:0046103) |
| 0.0 | 0.1 | GO:0007079 | mitotic chromosome movement towards spindle pole(GO:0007079) |
| 0.0 | 0.3 | GO:0034389 | lipid particle organization(GO:0034389) |
| 0.0 | 0.0 | GO:0002728 | negative regulation of natural killer cell cytokine production(GO:0002728) |
| 0.0 | 0.1 | GO:0010265 | SCF complex assembly(GO:0010265) |
| 0.0 | 0.0 | GO:0046121 | deoxyribonucleoside catabolic process(GO:0046121) |
| 0.0 | 0.1 | GO:0009597 | detection of virus(GO:0009597) |
| 0.0 | 0.0 | GO:1900133 | regulation of renin secretion into blood stream(GO:1900133) |
| 0.0 | 0.2 | GO:0072257 | metanephric nephron tubule epithelial cell differentiation(GO:0072257) regulation of metanephric nephron tubule epithelial cell differentiation(GO:0072307) |
| 0.0 | 0.1 | GO:0031119 | tRNA pseudouridine synthesis(GO:0031119) |
| 0.0 | 0.1 | GO:0045835 | negative regulation of meiotic nuclear division(GO:0045835) |
| 0.0 | 0.0 | GO:0032848 | cochlear nucleus development(GO:0021747) negative regulation of cellular pH reduction(GO:0032848) CD8-positive, alpha-beta T cell lineage commitment(GO:0043375) negative regulation of retinal cell programmed cell death(GO:0046671) |
| 0.0 | 0.0 | GO:1903565 | negative regulation of protein localization to cilium(GO:1903565) regulation of protein localization to ciliary membrane(GO:1903567) negative regulation of protein localization to ciliary membrane(GO:1903568) |
| 0.0 | 0.2 | GO:0048227 | plasma membrane to endosome transport(GO:0048227) |
| 0.0 | 0.1 | GO:0033623 | regulation of integrin activation(GO:0033623) |
| 0.0 | 0.0 | GO:0021965 | spinal cord ventral commissure morphogenesis(GO:0021965) |
| 0.0 | 0.0 | GO:1990926 | short-term synaptic potentiation(GO:1990926) |
| 0.0 | 0.1 | GO:1990426 | homologous recombination-dependent replication fork processing(GO:1990426) |
| 0.0 | 0.1 | GO:0031022 | nuclear migration along microfilament(GO:0031022) |
| 0.0 | 0.1 | GO:0000395 | mRNA 5'-splice site recognition(GO:0000395) |
| 0.0 | 0.4 | GO:0051894 | positive regulation of focal adhesion assembly(GO:0051894) |
| 0.0 | 0.3 | GO:0048240 | sperm capacitation(GO:0048240) |
| 0.0 | 0.1 | GO:0099566 | regulation of postsynaptic cytosolic calcium ion concentration(GO:0099566) |
| 0.0 | 0.0 | GO:0097156 | fasciculation of motor neuron axon(GO:0097156) |
| 0.0 | 0.2 | GO:0051988 | regulation of attachment of spindle microtubules to kinetochore(GO:0051988) |
| 0.0 | 0.5 | GO:0051491 | positive regulation of filopodium assembly(GO:0051491) |
| 0.0 | 0.0 | GO:1903383 | neuron intrinsic apoptotic signaling pathway in response to hydrogen peroxide(GO:0036482) positive regulation of mitochondrial electron transport, NADH to ubiquinone(GO:1902958) regulation of hydrogen peroxide-induced neuron intrinsic apoptotic signaling pathway(GO:1903383) negative regulation of hydrogen peroxide-induced neuron intrinsic apoptotic signaling pathway(GO:1903384) |
| 0.0 | 0.1 | GO:1900028 | negative regulation of ruffle assembly(GO:1900028) |
| 0.0 | 0.0 | GO:0002370 | natural killer cell cytokine production(GO:0002370) regulation of natural killer cell cytokine production(GO:0002727) |
| 0.0 | 0.0 | GO:0046878 | positive regulation of saliva secretion(GO:0046878) |
Gene overrepresentation in cellular component category:
| Log-likelihood per target | Total log-likelihood | Term | Description |
|---|---|---|---|
| 1.0 | 12.5 | GO:0005589 | collagen type VI trimer(GO:0005589) collagen beaded filament(GO:0098647) |
| 0.8 | 4.0 | GO:0034680 | integrin alpha10-beta1 complex(GO:0034680) |
| 0.2 | 2.5 | GO:0098643 | fibrillar collagen trimer(GO:0005583) banded collagen fibril(GO:0098643) |
| 0.1 | 0.4 | GO:1990578 | perinuclear endoplasmic reticulum membrane(GO:1990578) |
| 0.1 | 1.3 | GO:0030478 | actin cap(GO:0030478) |
| 0.1 | 0.9 | GO:0071438 | invadopodium membrane(GO:0071438) |
| 0.1 | 0.4 | GO:0060200 | clathrin-sculpted acetylcholine transport vesicle(GO:0060200) clathrin-sculpted acetylcholine transport vesicle membrane(GO:0060201) |
| 0.1 | 6.6 | GO:1904724 | tertiary granule lumen(GO:1904724) |
| 0.1 | 0.3 | GO:0070022 | transforming growth factor beta receptor homodimeric complex(GO:0070022) |
| 0.1 | 0.2 | GO:0097224 | sperm connecting piece(GO:0097224) |
| 0.1 | 0.2 | GO:0031933 | telomeric heterochromatin(GO:0031933) |
| 0.0 | 0.3 | GO:0097442 | CA3 pyramidal cell dendrite(GO:0097442) |
| 0.0 | 0.4 | GO:0031211 | serine C-palmitoyltransferase complex(GO:0017059) endoplasmic reticulum palmitoyltransferase complex(GO:0031211) |
| 0.0 | 0.2 | GO:0036021 | endolysosome lumen(GO:0036021) |
| 0.0 | 1.9 | GO:0042571 | immunoglobulin complex, circulating(GO:0042571) |
| 0.0 | 0.2 | GO:0097149 | centralspindlin complex(GO:0097149) |
| 0.0 | 0.7 | GO:0042589 | zymogen granule membrane(GO:0042589) |
| 0.0 | 0.9 | GO:0005614 | interstitial matrix(GO:0005614) |
| 0.0 | 0.1 | GO:0000333 | telomerase catalytic core complex(GO:0000333) |
| 0.0 | 0.1 | GO:0034669 | integrin alpha4-beta7 complex(GO:0034669) |
| 0.0 | 0.8 | GO:0031083 | BLOC-1 complex(GO:0031083) |
| 0.0 | 3.7 | GO:0005796 | Golgi lumen(GO:0005796) |
| 0.0 | 0.2 | GO:0070852 | cell body fiber(GO:0070852) |
| 0.0 | 0.6 | GO:0001518 | voltage-gated sodium channel complex(GO:0001518) |
| 0.0 | 0.1 | GO:0010370 | perinucleolar chromocenter(GO:0010370) |
| 0.0 | 0.2 | GO:0005579 | membrane attack complex(GO:0005579) |
| 0.0 | 0.1 | GO:0071942 | XPC complex(GO:0071942) |
| 0.0 | 0.2 | GO:0031467 | Cul7-RING ubiquitin ligase complex(GO:0031467) |
| 0.0 | 0.2 | GO:0036128 | CatSper complex(GO:0036128) |
| 0.0 | 0.1 | GO:0033150 | cytoskeletal calyx(GO:0033150) |
| 0.0 | 0.5 | GO:0043194 | axon initial segment(GO:0043194) |
| 0.0 | 0.4 | GO:0030127 | COPII vesicle coat(GO:0030127) |
| 0.0 | 0.5 | GO:0031265 | CD95 death-inducing signaling complex(GO:0031265) |
| 0.0 | 0.3 | GO:0071203 | WASH complex(GO:0071203) |
| 0.0 | 0.6 | GO:0097431 | mitotic spindle pole(GO:0097431) |
| 0.0 | 0.5 | GO:0032591 | dendritic spine membrane(GO:0032591) |
| 0.0 | 0.1 | GO:1990423 | RZZ complex(GO:1990423) |
| 0.0 | 0.2 | GO:0098651 | basement membrane collagen trimer(GO:0098651) |
| 0.0 | 0.5 | GO:0031045 | dense core granule(GO:0031045) |
| 0.0 | 0.0 | GO:0032437 | cuticular plate(GO:0032437) |
| 0.0 | 0.2 | GO:0031595 | nuclear proteasome complex(GO:0031595) |
| 0.0 | 0.4 | GO:0043220 | Schmidt-Lanterman incisure(GO:0043220) |
| 0.0 | 0.1 | GO:0000408 | EKC/KEOPS complex(GO:0000408) |
| 0.0 | 0.2 | GO:0033270 | paranode region of axon(GO:0033270) |
| 0.0 | 1.9 | GO:0031594 | neuromuscular junction(GO:0031594) |
| 0.0 | 0.1 | GO:0033593 | BRCA2-MAGE-D1 complex(GO:0033593) |
| 0.0 | 2.2 | GO:0005901 | caveola(GO:0005901) |
| 0.0 | 0.8 | GO:0032839 | dendrite cytoplasm(GO:0032839) |
| 0.0 | 0.1 | GO:0044530 | supraspliceosomal complex(GO:0044530) |
| 0.0 | 0.1 | GO:0034388 | Pwp2p-containing subcomplex of 90S preribosome(GO:0034388) |
| 0.0 | 0.0 | GO:0070195 | growth hormone receptor complex(GO:0070195) |
| 0.0 | 0.4 | GO:0071141 | SMAD protein complex(GO:0071141) |
| 0.0 | 0.2 | GO:0031314 | extrinsic component of mitochondrial inner membrane(GO:0031314) |
| 0.0 | 0.2 | GO:0097136 | Bcl-2 family protein complex(GO:0097136) |
| 0.0 | 2.7 | GO:0090575 | RNA polymerase II transcription factor complex(GO:0090575) |
| 0.0 | 0.1 | GO:0005854 | nascent polypeptide-associated complex(GO:0005854) |
| 0.0 | 0.3 | GO:0000145 | exocyst(GO:0000145) |
| 0.0 | 0.1 | GO:0043196 | varicosity(GO:0043196) |
| 0.0 | 0.1 | GO:0044614 | nuclear pore cytoplasmic filaments(GO:0044614) |
| 0.0 | 0.1 | GO:0000243 | commitment complex(GO:0000243) |
| 0.0 | 0.3 | GO:0005868 | cytoplasmic dynein complex(GO:0005868) |
| 0.0 | 0.7 | GO:0031430 | M band(GO:0031430) |
| 0.0 | 0.0 | GO:0048269 | methionine adenosyltransferase complex(GO:0048269) |
| 0.0 | 0.1 | GO:0030061 | mitochondrial crista(GO:0030061) |
Gene overrepresentation in molecular function category:
| Log-likelihood per target | Total log-likelihood | Term | Description |
|---|---|---|---|
| 0.5 | 1.5 | GO:0005477 | pyruvate secondary active transmembrane transporter activity(GO:0005477) |
| 0.5 | 4.0 | GO:0098639 | collagen binding involved in cell-matrix adhesion(GO:0098639) |
| 0.5 | 0.5 | GO:0004031 | aldehyde oxidase activity(GO:0004031) |
| 0.4 | 3.3 | GO:0001849 | complement component C1q binding(GO:0001849) |
| 0.3 | 3.3 | GO:0050692 | DBD domain binding(GO:0050692) |
| 0.3 | 1.8 | GO:0044323 | retinoic acid-responsive element binding(GO:0044323) |
| 0.3 | 0.8 | GO:0035375 | zymogen binding(GO:0035375) |
| 0.2 | 2.0 | GO:0060072 | large conductance calcium-activated potassium channel activity(GO:0060072) |
| 0.2 | 0.2 | GO:0070052 | collagen V binding(GO:0070052) |
| 0.2 | 2.5 | GO:0048407 | platelet-derived growth factor binding(GO:0048407) |
| 0.2 | 5.0 | GO:0001965 | G-protein alpha-subunit binding(GO:0001965) |
| 0.2 | 3.0 | GO:0004062 | aryl sulfotransferase activity(GO:0004062) |
| 0.1 | 0.6 | GO:0015057 | thrombin receptor activity(GO:0015057) |
| 0.1 | 0.7 | GO:0023024 | MHC class I protein complex binding(GO:0023024) |
| 0.1 | 12.2 | GO:0050840 | extracellular matrix binding(GO:0050840) |
| 0.1 | 0.4 | GO:0001596 | angiotensin type I receptor activity(GO:0001596) |
| 0.1 | 1.0 | GO:0004024 | alcohol dehydrogenase activity, zinc-dependent(GO:0004024) |
| 0.1 | 2.5 | GO:0031005 | filamin binding(GO:0031005) |
| 0.1 | 0.4 | GO:0004504 | peptidylglycine monooxygenase activity(GO:0004504) peptidylamidoglycolate lyase activity(GO:0004598) |
| 0.1 | 0.4 | GO:0033765 | 3-oxo-5-alpha-steroid 4-dehydrogenase activity(GO:0003865) steroid dehydrogenase activity, acting on the CH-CH group of donors(GO:0033765) cholestenone 5-alpha-reductase activity(GO:0047751) |
| 0.1 | 0.4 | GO:0016454 | serine C-palmitoyltransferase activity(GO:0004758) C-palmitoyltransferase activity(GO:0016454) |
| 0.1 | 1.3 | GO:0005132 | type I interferon receptor binding(GO:0005132) |
| 0.1 | 0.7 | GO:0015277 | kainate selective glutamate receptor activity(GO:0015277) |
| 0.1 | 0.2 | GO:0015616 | DNA translocase activity(GO:0015616) |
| 0.1 | 0.5 | GO:0015562 | efflux transmembrane transporter activity(GO:0015562) |
| 0.1 | 0.3 | GO:0050501 | hyaluronan synthase activity(GO:0050501) |
| 0.1 | 0.3 | GO:1990430 | extracellular matrix protein binding(GO:1990430) |
| 0.1 | 0.3 | GO:0004909 | interleukin-1, Type I, activating receptor activity(GO:0004909) |
| 0.1 | 0.3 | GO:0004923 | leukemia inhibitory factor receptor activity(GO:0004923) |
| 0.1 | 0.2 | GO:0004556 | alpha-amylase activity(GO:0004556) |
| 0.1 | 0.4 | GO:0030348 | syntaxin-3 binding(GO:0030348) |
| 0.1 | 0.4 | GO:0015189 | L-lysine transmembrane transporter activity(GO:0015189) |
| 0.1 | 0.2 | GO:0031531 | thyrotropin-releasing hormone receptor binding(GO:0031531) |
| 0.1 | 0.4 | GO:0070892 | lipoteichoic acid receptor activity(GO:0070892) |
| 0.0 | 0.8 | GO:0016290 | palmitoyl-CoA hydrolase activity(GO:0016290) |
| 0.0 | 0.1 | GO:0046848 | hydroxyapatite binding(GO:0046848) |
| 0.0 | 1.3 | GO:0005523 | tropomyosin binding(GO:0005523) |
| 0.0 | 0.4 | GO:0010997 | anaphase-promoting complex binding(GO:0010997) |
| 0.0 | 0.2 | GO:0003983 | UTP:glucose-1-phosphate uridylyltransferase activity(GO:0003983) UTP-monosaccharide-1-phosphate uridylyltransferase activity(GO:0051748) |
| 0.0 | 3.1 | GO:0005518 | collagen binding(GO:0005518) |
| 0.0 | 1.4 | GO:0017075 | syntaxin-1 binding(GO:0017075) |
| 0.0 | 0.2 | GO:0035800 | deubiquitinase activator activity(GO:0035800) |
| 0.0 | 0.2 | GO:0004471 | malate dehydrogenase (decarboxylating) (NAD+) activity(GO:0004471) malate dehydrogenase (decarboxylating) (NADP+) activity(GO:0004473) |
| 0.0 | 0.4 | GO:0046935 | 1-phosphatidylinositol-3-kinase regulator activity(GO:0046935) |
| 0.0 | 0.3 | GO:0030618 | transforming growth factor beta receptor, pathway-specific cytoplasmic mediator activity(GO:0030618) |
| 0.0 | 0.2 | GO:0030109 | HLA-B specific inhibitory MHC class I receptor activity(GO:0030109) |
| 0.0 | 0.5 | GO:0031419 | cobalamin binding(GO:0031419) |
| 0.0 | 0.1 | GO:0042132 | fructose 1,6-bisphosphate 1-phosphatase activity(GO:0042132) |
| 0.0 | 1.9 | GO:0034987 | immunoglobulin receptor binding(GO:0034987) |
| 0.0 | 0.1 | GO:0016652 | NAD(P)+ transhydrogenase activity(GO:0008746) oxidoreductase activity, acting on NAD(P)H, NAD(P) as acceptor(GO:0016652) |
| 0.0 | 0.6 | GO:0047372 | acylglycerol lipase activity(GO:0047372) |
| 0.0 | 0.1 | GO:0043035 | chromatin insulator sequence binding(GO:0043035) |
| 0.0 | 0.9 | GO:0008239 | dipeptidyl-peptidase activity(GO:0008239) |
| 0.0 | 0.2 | GO:0005324 | long-chain fatty acid transporter activity(GO:0005324) |
| 0.0 | 0.1 | GO:0050146 | nucleoside phosphotransferase activity(GO:0050146) |
| 0.0 | 0.1 | GO:0000822 | inositol hexakisphosphate binding(GO:0000822) |
| 0.0 | 0.1 | GO:0004348 | glucosylceramidase activity(GO:0004348) |
| 0.0 | 1.0 | GO:0005540 | hyaluronic acid binding(GO:0005540) |
| 0.0 | 0.2 | GO:0004499 | N,N-dimethylaniline monooxygenase activity(GO:0004499) |
| 0.0 | 0.1 | GO:0005462 | UDP-N-acetylglucosamine transmembrane transporter activity(GO:0005462) |
| 0.0 | 0.1 | GO:0034584 | piRNA binding(GO:0034584) |
| 0.0 | 0.1 | GO:0051990 | isocitrate dehydrogenase (NADP+) activity(GO:0004450) (R)-2-hydroxyglutarate dehydrogenase activity(GO:0051990) |
| 0.0 | 0.1 | GO:0004558 | alpha-1,4-glucosidase activity(GO:0004558) |
| 0.0 | 0.1 | GO:0005124 | N-formyl peptide receptor activity(GO:0004982) scavenger receptor binding(GO:0005124) |
| 0.0 | 0.1 | GO:0004852 | uroporphyrinogen-III synthase activity(GO:0004852) |
| 0.0 | 0.2 | GO:0099580 | ion antiporter activity involved in regulation of postsynaptic membrane potential(GO:0099580) |
| 0.0 | 0.4 | GO:0008140 | cAMP response element binding protein binding(GO:0008140) |
| 0.0 | 0.5 | GO:0051371 | muscle alpha-actinin binding(GO:0051371) |
| 0.0 | 0.1 | GO:0005502 | 11-cis retinal binding(GO:0005502) |
| 0.0 | 0.1 | GO:0072320 | volume-sensitive chloride channel activity(GO:0072320) |
| 0.0 | 0.1 | GO:0003998 | acylphosphatase activity(GO:0003998) |
| 0.0 | 0.2 | GO:0051434 | BH3 domain binding(GO:0051434) |
| 0.0 | 0.1 | GO:0008454 | alpha-1,3-mannosylglycoprotein 4-beta-N-acetylglucosaminyltransferase activity(GO:0008454) |
| 0.0 | 0.6 | GO:1905030 | voltage-gated sodium channel activity(GO:0005248) voltage-gated ion channel activity involved in regulation of postsynaptic membrane potential(GO:1905030) |
| 0.0 | 0.1 | GO:0052595 | tryptamine:oxygen oxidoreductase (deaminating) activity(GO:0052593) aminoacetone:oxygen oxidoreductase(deaminating) activity(GO:0052594) aliphatic-amine oxidase activity(GO:0052595) phenethylamine:oxygen oxidoreductase (deaminating) activity(GO:0052596) |
| 0.0 | 0.3 | GO:0004745 | retinol dehydrogenase activity(GO:0004745) |
| 0.0 | 0.1 | GO:0004161 | dimethylallyltranstransferase activity(GO:0004161) geranyltranstransferase activity(GO:0004337) |
| 0.0 | 0.1 | GO:0004800 | thyroxine 5'-deiodinase activity(GO:0004800) |
| 0.0 | 0.1 | GO:0030346 | protein phosphatase 2B binding(GO:0030346) |
| 0.0 | 0.2 | GO:0045504 | dynein heavy chain binding(GO:0045504) |
| 0.0 | 0.1 | GO:0071553 | uridine nucleotide receptor activity(GO:0015065) G-protein coupled pyrimidinergic nucleotide receptor activity(GO:0071553) |
| 0.0 | 0.1 | GO:0042806 | fucose binding(GO:0042806) glycosphingolipid binding(GO:0043208) |
| 0.0 | 0.2 | GO:0032027 | myosin light chain binding(GO:0032027) |
| 0.0 | 1.8 | GO:0030165 | PDZ domain binding(GO:0030165) |
| 0.0 | 0.0 | GO:0004878 | complement component C5a receptor activity(GO:0004878) |
| 0.0 | 0.1 | GO:0030021 | extracellular matrix structural constituent conferring compression resistance(GO:0030021) structural constituent of tooth enamel(GO:0030345) |
| 0.0 | 0.1 | GO:0008192 | RNA guanylyltransferase activity(GO:0008192) |
| 0.0 | 0.1 | GO:0030375 | thyroid hormone receptor activator activity(GO:0010861) thyroid hormone receptor coactivator activity(GO:0030375) |
| 0.0 | 0.1 | GO:0034714 | type III transforming growth factor beta receptor binding(GO:0034714) |
| 0.0 | 1.1 | GO:0048306 | calcium-dependent protein binding(GO:0048306) |
| 0.0 | 0.3 | GO:0019215 | intermediate filament binding(GO:0019215) |
| 0.0 | 0.1 | GO:0047179 | platelet-activating factor acetyltransferase activity(GO:0047179) |
| 0.0 | 0.1 | GO:0047374 | methylumbelliferyl-acetate deacetylase activity(GO:0047374) |
| 0.0 | 0.1 | GO:0035673 | oligopeptide transmembrane transporter activity(GO:0035673) |
| 0.0 | 0.3 | GO:0070628 | proteasome binding(GO:0070628) |
| 0.0 | 0.1 | GO:0001609 | G-protein coupled adenosine receptor activity(GO:0001609) |
| 0.0 | 0.1 | GO:0008379 | thioredoxin peroxidase activity(GO:0008379) |
| 0.0 | 0.4 | GO:0016646 | oxidoreductase activity, acting on the CH-NH group of donors, NAD or NADP as acceptor(GO:0016646) |
| 0.0 | 0.3 | GO:0098748 | clathrin adaptor activity(GO:0035615) endocytic adaptor activity(GO:0098748) |
| 0.0 | 0.1 | GO:0047756 | chondroitin 4-sulfotransferase activity(GO:0047756) |
| 0.0 | 0.3 | GO:0031489 | myosin V binding(GO:0031489) |
| 0.0 | 0.7 | GO:0030507 | spectrin binding(GO:0030507) |
| 0.0 | 0.5 | GO:0005123 | death receptor binding(GO:0005123) |
| 0.0 | 0.0 | GO:0005042 | netrin receptor activity(GO:0005042) |
| 0.0 | 0.3 | GO:0004862 | cAMP-dependent protein kinase inhibitor activity(GO:0004862) |
| 0.0 | 0.1 | GO:0061649 | ubiquitinated histone binding(GO:0061649) |
| 0.0 | 0.1 | GO:0019237 | centromeric DNA binding(GO:0019237) |
| 0.0 | 0.2 | GO:0042609 | CD4 receptor binding(GO:0042609) |
Gene overrepresentation in curated gene sets: canonical pathways category:
| Log-likelihood per target | Total log-likelihood | Term | Description |
|---|---|---|---|
| 0.3 | 15.6 | NABA PROTEOGLYCANS | Genes encoding proteoglycans |
| 0.1 | 4.1 | PID INTEGRIN CS PATHWAY | Integrin family cell surface interactions |
| 0.1 | 3.4 | ST MYOCYTE AD PATHWAY | Myocyte Adrenergic Pathway is a specific case of the generalized Adrenergic Pathway. |
| 0.0 | 2.9 | PID RXR VDR PATHWAY | RXR and RAR heterodimerization with other nuclear receptor |
| 0.0 | 0.4 | PID PI3K PLC TRK PATHWAY | Trk receptor signaling mediated by PI3K and PLC-gamma |
| 0.0 | 0.6 | PID THROMBIN PAR4 PATHWAY | PAR4-mediated thrombin signaling events |
| 0.0 | 1.4 | PID SYNDECAN 4 PATHWAY | Syndecan-4-mediated signaling events |
| 0.0 | 1.6 | PID SYNDECAN 2 PATHWAY | Syndecan-2-mediated signaling events |
| 0.0 | 2.4 | PID CDC42 REG PATHWAY | Regulation of CDC42 activity |
| 0.0 | 0.4 | ST TYPE I INTERFERON PATHWAY | Type I Interferon (alpha/beta IFN) Pathway |
| 0.0 | 2.3 | PID ENDOTHELIN PATHWAY | Endothelins |
| 0.0 | 1.5 | PID NETRIN PATHWAY | Netrin-mediated signaling events |
| 0.0 | 7.0 | NABA ECM GLYCOPROTEINS | Genes encoding structural ECM glycoproteins |
| 0.0 | 0.5 | SA FAS SIGNALING | The TNF-type receptor Fas induces apoptosis on ligand binding. |
| 0.0 | 0.1 | ST G ALPHA I PATHWAY | G alpha i Pathway |
| 0.0 | 0.5 | PID INTEGRIN2 PATHWAY | Beta2 integrin cell surface interactions |
| 0.0 | 0.3 | PID ALK2 PATHWAY | ALK2 signaling events |
| 0.0 | 0.1 | PID AR NONGENOMIC PATHWAY | Nongenotropic Androgen signaling |
| 0.0 | 0.2 | SA PROGRAMMED CELL DEATH | Programmed cell death, or apoptosis, eliminates damaged or unneeded cells. |
| 0.0 | 0.7 | PID ECADHERIN STABILIZATION PATHWAY | Stabilization and expansion of the E-cadherin adherens junction |
| 0.0 | 0.1 | SA G2 AND M PHASES | Cdc25 activates the cdc2/cyclin B complex to induce the G2/M transition. |
| 0.0 | 0.7 | PID ARF6 TRAFFICKING PATHWAY | Arf6 trafficking events |
| 0.0 | 0.4 | PID P38 MK2 PATHWAY | p38 signaling mediated by MAPKAP kinases |
| 0.0 | 0.8 | PID ILK PATHWAY | Integrin-linked kinase signaling |
Gene overrepresentation in curated gene sets: REACTOME pathways category:
| Log-likelihood per target | Total log-likelihood | Term | Description |
|---|---|---|---|
| 0.4 | 12.5 | REACTOME CS DS DEGRADATION | Genes involved in CS/DS degradation |
| 0.1 | 0.1 | REACTOME ADP SIGNALLING THROUGH P2RY12 | Genes involved in ADP signalling through P2Y purinoceptor 12 |
| 0.1 | 3.0 | REACTOME CYTOSOLIC SULFONATION OF SMALL MOLECULES | Genes involved in Cytosolic sulfonation of small molecules |
| 0.1 | 1.4 | REACTOME ROLE OF DCC IN REGULATING APOPTOSIS | Genes involved in Role of DCC in regulating apoptosis |
| 0.1 | 1.6 | REACTOME BILE SALT AND ORGANIC ANION SLC TRANSPORTERS | Genes involved in Bile salt and organic anion SLC transporters |
| 0.1 | 1.0 | REACTOME KERATAN SULFATE DEGRADATION | Genes involved in Keratan sulfate degradation |
| 0.1 | 1.0 | REACTOME ETHANOL OXIDATION | Genes involved in Ethanol oxidation |
| 0.1 | 1.6 | REACTOME HS GAG DEGRADATION | Genes involved in HS-GAG degradation |
| 0.1 | 5.2 | REACTOME G ALPHA Z SIGNALLING EVENTS | Genes involved in G alpha (z) signalling events |
| 0.1 | 0.1 | REACTOME DOWNSTREAM TCR SIGNALING | Genes involved in Downstream TCR signaling |
| 0.1 | 0.6 | REACTOME DIGESTION OF DIETARY CARBOHYDRATE | Genes involved in Digestion of dietary carbohydrate |
| 0.0 | 1.0 | REACTOME NOREPINEPHRINE NEUROTRANSMITTER RELEASE CYCLE | Genes involved in Norepinephrine Neurotransmitter Release Cycle |
| 0.0 | 0.7 | REACTOME ANDROGEN BIOSYNTHESIS | Genes involved in Androgen biosynthesis |
| 0.0 | 4.3 | REACTOME NUCLEAR RECEPTOR TRANSCRIPTION PATHWAY | Genes involved in Nuclear Receptor transcription pathway |
| 0.0 | 0.2 | REACTOME TRAF6 MEDIATED IRF7 ACTIVATION | Genes involved in TRAF6 mediated IRF7 activation |
| 0.0 | 2.7 | REACTOME NCAM1 INTERACTIONS | Genes involved in NCAM1 interactions |
| 0.0 | 1.6 | REACTOME SMOOTH MUSCLE CONTRACTION | Genes involved in Smooth Muscle Contraction |
| 0.0 | 4.1 | REACTOME INTEGRIN CELL SURFACE INTERACTIONS | Genes involved in Integrin cell surface interactions |
| 0.0 | 0.6 | REACTOME THROMBIN SIGNALLING THROUGH PROTEINASE ACTIVATED RECEPTORS PARS | Genes involved in Thrombin signalling through proteinase activated receptors (PARs) |
| 0.0 | 1.1 | REACTOME FORMATION OF FIBRIN CLOT CLOTTING CASCADE | Genes involved in Formation of Fibrin Clot (Clotting Cascade) |
| 0.0 | 0.5 | REACTOME CRMPS IN SEMA3A SIGNALING | Genes involved in CRMPs in Sema3A signaling |
| 0.0 | 0.6 | REACTOME SIGNALING BY FGFR1 FUSION MUTANTS | Genes involved in Signaling by FGFR1 fusion mutants |
| 0.0 | 0.5 | REACTOME CELL EXTRACELLULAR MATRIX INTERACTIONS | Genes involved in Cell-extracellular matrix interactions |
| 0.0 | 0.4 | REACTOME PROTEOLYTIC CLEAVAGE OF SNARE COMPLEX PROTEINS | Genes involved in Proteolytic cleavage of SNARE complex proteins |
| 0.0 | 0.9 | REACTOME AMINO ACID TRANSPORT ACROSS THE PLASMA MEMBRANE | Genes involved in Amino acid transport across the plasma membrane |
| 0.0 | 0.4 | REACTOME PKA MEDIATED PHOSPHORYLATION OF CREB | Genes involved in PKA-mediated phosphorylation of CREB |
| 0.0 | 0.4 | REACTOME ANTIGEN PRESENTATION FOLDING ASSEMBLY AND PEPTIDE LOADING OF CLASS I MHC | Genes involved in Antigen Presentation: Folding, assembly and peptide loading of class I MHC |
| 0.0 | 0.3 | REACTOME HORMONE SENSITIVE LIPASE HSL MEDIATED TRIACYLGLYCEROL HYDROLYSIS | Genes involved in Hormone-sensitive lipase (HSL)-mediated triacylglycerol hydrolysis |
| 0.0 | 0.3 | REACTOME TRAF3 DEPENDENT IRF ACTIVATION PATHWAY | Genes involved in TRAF3-dependent IRF activation pathway |
| 0.0 | 0.2 | REACTOME P2Y RECEPTORS | Genes involved in P2Y receptors |
| 0.0 | 0.2 | REACTOME ERKS ARE INACTIVATED | Genes involved in ERKs are inactivated |
| 0.0 | 0.5 | REACTOME ABC FAMILY PROTEINS MEDIATED TRANSPORT | Genes involved in ABC-family proteins mediated transport |