Project
Epithelial-Mesenchymal Transition, human (Scheel, 2011)
Navigation
Downloads
Results for GAGGUAG
Z-value: 1.11
Motif logo

miRNA associated with seed GAGGUAG
| Name | miRBASE accession |
|---|---|
|
hsa-let-7a-5p
|
MIMAT0000062 |
|
hsa-let-7b-5p
|
MIMAT0000063 |
|
hsa-let-7c-5p
|
MIMAT0000064 |
|
hsa-let-7d-5p
|
MIMAT0000065 |
|
hsa-let-7e-5p
|
MIMAT0000066 |
|
hsa-let-7f-5p
|
MIMAT0000067 |
|
hsa-let-7g-5p
|
MIMAT0000414 |
|
hsa-let-7i-5p
|
MIMAT0000415 |
|
hsa-miR-4458
|
MIMAT0018980 |
|
hsa-miR-4500
|
MIMAT0019036 |
|
hsa-miR-98-5p
|
MIMAT0000096 |
Activity profile of GAGGUAG motif
Sorted Z-values of GAGGUAG motif
| Promoter | Log-likelihood | Transcript | Gene | Gene Info |
|---|---|---|---|---|
| chr10_-_98268186 | 2.61 |
ENST00000260702.4
|
LOXL4
|
lysyl oxidase like 4 |
| chr1_-_242524687 | 1.15 |
ENST00000442594.6
ENST00000536534.7 |
PLD5
|
phospholipase D family member 5 |
| chr5_+_167754918 | 1.00 |
ENST00000519204.5
|
TENM2
|
teneurin transmembrane protein 2 |
| chr12_+_72272360 | 0.92 |
ENST00000547300.2
ENST00000261180.10 |
TRHDE
|
thyrotropin releasing hormone degrading enzyme |
| chr3_-_69386079 | 0.89 |
ENST00000398540.8
|
FRMD4B
|
FERM domain containing 4B |
| chr1_-_9129085 | 0.87 |
ENST00000377411.5
|
GPR157
|
G protein-coupled receptor 157 |
| chr1_-_153390976 | 0.87 |
ENST00000368732.5
ENST00000368733.4 |
S100A8
|
S100 calcium binding protein A8 |
| chr1_+_59814939 | 0.87 |
ENST00000371208.5
|
HOOK1
|
hook microtubule tethering protein 1 |
| chrX_+_37685773 | 0.86 |
ENST00000378616.5
|
XK
|
X-linked Kx blood group |
| chr19_-_51020019 | 0.82 |
ENST00000309958.7
|
KLK10
|
kallikrein related peptidase 10 |
| chr8_+_28494190 | 0.81 |
ENST00000537916.2
ENST00000240093.8 ENST00000523546.1 |
FZD3
|
frizzled class receptor 3 |
| chr1_+_152514474 | 0.78 |
ENST00000368790.4
|
CRCT1
|
cysteine rich C-terminal 1 |
| chr5_-_140346596 | 0.77 |
ENST00000230990.7
|
HBEGF
|
heparin binding EGF like growth factor |
| chr20_+_6767678 | 0.75 |
ENST00000378827.5
|
BMP2
|
bone morphogenetic protein 2 |
| chr2_-_27212256 | 0.74 |
ENST00000414408.5
ENST00000310574.8 |
SLC5A6
|
solute carrier family 5 member 6 |
| chr4_+_83536097 | 0.73 |
ENST00000395226.6
ENST00000264409.5 |
GPAT3
|
glycerol-3-phosphate acyltransferase 3 |
| chr1_-_28176665 | 0.72 |
ENST00000373857.8
|
PTAFR
|
platelet activating factor receptor |
| chr2_+_17541157 | 0.72 |
ENST00000406397.1
|
VSNL1
|
visinin like 1 |
| chr2_+_197705353 | 0.71 |
ENST00000282276.8
|
MARS2
|
methionyl-tRNA synthetase 2, mitochondrial |
| chr5_+_148826600 | 0.68 |
ENST00000305988.6
|
ADRB2
|
adrenoceptor beta 2 |
| chr8_+_60678705 | 0.68 |
ENST00000423902.7
|
CHD7
|
chromodomain helicase DNA binding protein 7 |
| chr18_+_11689210 | 0.66 |
ENST00000334049.11
|
GNAL
|
G protein subunit alpha L |
| chr14_+_67533282 | 0.65 |
ENST00000329153.10
|
PLEKHH1
|
pleckstrin homology, MyTH4 and FERM domain containing H1 |
| chr6_+_137867414 | 0.65 |
ENST00000237289.8
ENST00000433680.1 |
TNFAIP3
|
TNF alpha induced protein 3 |
| chr6_+_12290353 | 0.64 |
ENST00000379375.6
|
EDN1
|
endothelin 1 |
| chr20_-_47786553 | 0.63 |
ENST00000467815.5
ENST00000359930.8 ENST00000484875.5 |
SULF2
|
sulfatase 2 |
| chr1_-_227947924 | 0.63 |
ENST00000272164.6
|
WNT9A
|
Wnt family member 9A |
| chr22_-_39244969 | 0.62 |
ENST00000331163.11
|
PDGFB
|
platelet derived growth factor subunit B |
| chr6_+_106098933 | 0.61 |
ENST00000369089.3
|
PRDM1
|
PR/SET domain 1 |
| chr11_+_76860859 | 0.58 |
ENST00000679754.1
ENST00000534206.5 ENST00000680583.1 ENST00000532485.6 ENST00000526597.5 ENST00000533873.1 |
ACER3
|
alkaline ceramidase 3 |
| chr15_+_74541200 | 0.58 |
ENST00000622429.1
ENST00000346246.10 |
ARID3B
|
AT-rich interaction domain 3B |
| chr18_-_50195138 | 0.58 |
ENST00000285039.12
|
MYO5B
|
myosin VB |
| chr7_+_90403386 | 0.57 |
ENST00000287916.8
ENST00000394604.5 ENST00000496677.6 ENST00000394605.2 ENST00000480135.1 |
CLDN12
ENSG00000273299.1
|
claudin 12 novel transcript |
| chr6_-_99349647 | 0.55 |
ENST00000389677.6
|
FAXC
|
failed axon connections homolog, metaxin like GST domain containing |
| chr12_+_4273751 | 0.55 |
ENST00000675880.1
ENST00000261254.8 |
CCND2
|
cyclin D2 |
| chr2_+_74834113 | 0.53 |
ENST00000290573.7
|
HK2
|
hexokinase 2 |
| chr14_-_52695543 | 0.52 |
ENST00000395686.8
|
ERO1A
|
endoplasmic reticulum oxidoreductase 1 alpha |
| chr3_-_185498964 | 0.52 |
ENST00000296254.3
|
TMEM41A
|
transmembrane protein 41A |
| chr8_-_121641424 | 0.50 |
ENST00000303924.5
|
HAS2
|
hyaluronan synthase 2 |
| chr9_+_114155526 | 0.50 |
ENST00000356083.8
|
COL27A1
|
collagen type XXVII alpha 1 chain |
| chr16_-_17470953 | 0.50 |
ENST00000261381.7
|
XYLT1
|
xylosyltransferase 1 |
| chr17_+_9021501 | 0.49 |
ENST00000173229.7
|
NTN1
|
netrin 1 |
| chr8_+_24914942 | 0.48 |
ENST00000433454.3
|
NEFM
|
neurofilament medium |
| chr7_+_107580215 | 0.46 |
ENST00000465919.5
ENST00000005259.9 ENST00000445771.6 ENST00000479917.5 ENST00000421217.5 ENST00000457837.5 |
BCAP29
|
B cell receptor associated protein 29 |
| chr1_-_204411804 | 0.46 |
ENST00000367188.5
|
PPP1R15B
|
protein phosphatase 1 regulatory subunit 15B |
| chr1_+_32465046 | 0.45 |
ENST00000609129.2
|
ZBTB8B
|
zinc finger and BTB domain containing 8B |
| chr15_+_75206014 | 0.44 |
ENST00000567617.1
|
C15orf39
|
chromosome 15 open reading frame 39 |
| chr1_+_19312296 | 0.44 |
ENST00000375155.7
ENST00000375153.8 |
SLC66A1
|
solute carrier family 66 member 1 |
| chr6_-_79947541 | 0.44 |
ENST00000369816.5
|
ELOVL4
|
ELOVL fatty acid elongase 4 |
| chr2_+_108719473 | 0.44 |
ENST00000283195.11
|
RANBP2
|
RAN binding protein 2 |
| chr3_-_48188356 | 0.43 |
ENST00000351231.7
ENST00000437972.1 ENST00000302506.8 |
CDC25A
|
cell division cycle 25A |
| chr6_-_96837460 | 0.43 |
ENST00000229955.4
|
GPR63
|
G protein-coupled receptor 63 |
| chr2_+_69915100 | 0.43 |
ENST00000264444.7
|
MXD1
|
MAX dimerization protein 1 |
| chrX_-_118116746 | 0.42 |
ENST00000371882.5
ENST00000545703.5 ENST00000540167.5 |
KLHL13
|
kelch like family member 13 |
| chr12_-_57078739 | 0.42 |
ENST00000379391.7
|
NEMP1
|
nuclear envelope integral membrane protein 1 |
| chr8_+_73294594 | 0.42 |
ENST00000240285.10
|
RDH10
|
retinol dehydrogenase 10 |
| chr16_+_66880503 | 0.42 |
ENST00000568869.1
ENST00000311765.4 ENST00000561704.1 ENST00000568398.1 ENST00000566776.1 |
PDP2
|
pyruvate dehyrogenase phosphatase catalytic subunit 2 |
| chr2_+_147845020 | 0.42 |
ENST00000241416.12
|
ACVR2A
|
activin A receptor type 2A |
| chr7_-_138981307 | 0.41 |
ENST00000440172.5
ENST00000422774.2 |
KIAA1549
|
KIAA1549 |
| chr10_+_99659430 | 0.41 |
ENST00000370489.5
|
ENTPD7
|
ectonucleoside triphosphate diphosphohydrolase 7 |
| chr6_-_3457018 | 0.41 |
ENST00000436008.6
ENST00000406686.8 |
SLC22A23
|
solute carrier family 22 member 23 |
| chr8_-_126558461 | 0.40 |
ENST00000304916.4
|
LRATD2
|
LRAT domain containing 2 |
| chr7_+_20330893 | 0.40 |
ENST00000222573.5
|
ITGB8
|
integrin subunit beta 8 |
| chr5_-_55712280 | 0.40 |
ENST00000506624.5
ENST00000513275.5 ENST00000513993.5 ENST00000396865.7 ENST00000503891.5 ENST00000507109.5 |
SLC38A9
|
solute carrier family 38 member 9 |
| chr6_+_41638438 | 0.40 |
ENST00000441667.5
ENST00000230321.11 ENST00000373050.8 ENST00000446650.1 ENST00000435476.1 |
MDFI
|
MyoD family inhibitor |
| chr9_-_71768386 | 0.40 |
ENST00000377066.9
ENST00000377044.9 |
CEMIP2
|
cell migration inducing hyaluronidase 2 |
| chr22_+_29073024 | 0.40 |
ENST00000400335.9
|
KREMEN1
|
kringle containing transmembrane protein 1 |
| chr15_+_80695277 | 0.39 |
ENST00000258884.5
ENST00000558464.1 |
ABHD17C
|
abhydrolase domain containing 17C, depalmitoylase |
| chr12_+_48978313 | 0.39 |
ENST00000293549.4
|
WNT1
|
Wnt family member 1 |
| chr8_-_29350666 | 0.39 |
ENST00000240100.7
|
DUSP4
|
dual specificity phosphatase 4 |
| chr1_-_225427897 | 0.38 |
ENST00000421383.1
ENST00000272163.9 |
LBR
|
lamin B receptor |
| chr12_+_88142290 | 0.38 |
ENST00000549011.5
ENST00000551088.1 ENST00000266712.11 |
TMTC3
|
transmembrane O-mannosyltransferase targeting cadherins 3 |
| chr10_-_68471911 | 0.38 |
ENST00000358410.8
ENST00000399180.3 |
DNA2
|
DNA replication helicase/nuclease 2 |
| chrX_+_49922605 | 0.37 |
ENST00000376088.7
|
CLCN5
|
chloride voltage-gated channel 5 |
| chr1_+_160400543 | 0.37 |
ENST00000368061.3
|
VANGL2
|
VANGL planar cell polarity protein 2 |
| chr9_-_123184233 | 0.36 |
ENST00000447404.6
|
STRBP
|
spermatid perinuclear RNA binding protein |
| chr4_-_170003738 | 0.36 |
ENST00000502832.1
ENST00000393704.3 |
MFAP3L
|
microfibril associated protein 3 like |
| chrX_+_16786421 | 0.36 |
ENST00000398155.4
ENST00000380122.10 |
TXLNG
|
taxilin gamma |
| chr15_+_39581068 | 0.36 |
ENST00000397591.2
ENST00000260356.6 |
THBS1
|
thrombospondin 1 |
| chr3_-_79019444 | 0.35 |
ENST00000618833.4
ENST00000436010.6 ENST00000618846.4 |
ROBO1
|
roundabout guidance receptor 1 |
| chr2_+_32165841 | 0.35 |
ENST00000357055.7
ENST00000435660.5 ENST00000440718.5 ENST00000379343.6 ENST00000282587.9 ENST00000406369.2 |
SLC30A6
|
solute carrier family 30 member 6 |
| chr6_+_116877236 | 0.35 |
ENST00000332958.3
|
RFX6
|
regulatory factor X6 |
| chr5_+_149730260 | 0.34 |
ENST00000360453.8
ENST00000394320.7 ENST00000309241.10 |
PPARGC1B
|
PPARG coactivator 1 beta |
| chr8_+_97644164 | 0.34 |
ENST00000336273.8
|
MTDH
|
metadherin |
| chr5_-_37371061 | 0.34 |
ENST00000513532.1
ENST00000231498.8 |
NUP155
|
nucleoporin 155 |
| chr9_+_99105098 | 0.33 |
ENST00000374990.6
ENST00000374994.9 ENST00000552516.5 |
TGFBR1
|
transforming growth factor beta receptor 1 |
| chr6_+_70413462 | 0.33 |
ENST00000418814.7
ENST00000515280.5 ENST00000507085.5 ENST00000457062.6 ENST00000361499.7 |
FAM135A
|
family with sequence similarity 135 member A |
| chr19_+_33796846 | 0.33 |
ENST00000590771.5
ENST00000589786.5 ENST00000284006.10 ENST00000683859.1 ENST00000588881.5 |
KCTD15
|
potassium channel tetramerization domain containing 15 |
| chr2_+_119223815 | 0.33 |
ENST00000393106.6
ENST00000393110.7 ENST00000409811.5 ENST00000393107.2 |
STEAP3
|
STEAP3 metalloreductase |
| chr7_-_139036017 | 0.32 |
ENST00000275766.2
|
ZC3HAV1L
|
zinc finger CCCH-type containing, antiviral 1 like |
| chr16_+_2429427 | 0.32 |
ENST00000397066.9
|
CCNF
|
cyclin F |
| chr9_-_34376878 | 0.32 |
ENST00000297625.8
|
MYORG
|
myogenesis regulating glycosidase (putative) |
| chr1_-_40665654 | 0.31 |
ENST00000372684.8
|
RIMS3
|
regulating synaptic membrane exocytosis 3 |
| chr3_+_112086364 | 0.31 |
ENST00000264848.10
|
C3orf52
|
chromosome 3 open reading frame 52 |
| chr12_-_101830926 | 0.31 |
ENST00000299314.12
|
GNPTAB
|
N-acetylglucosamine-1-phosphate transferase subunits alpha and beta |
| chr12_-_92929236 | 0.31 |
ENST00000322349.13
|
EEA1
|
early endosome antigen 1 |
| chr12_-_95217373 | 0.31 |
ENST00000549499.1
ENST00000546711.5 ENST00000343958.9 |
FGD6
|
FYVE, RhoGEF and PH domain containing 6 |
| chrX_+_119236274 | 0.30 |
ENST00000217971.8
|
PGRMC1
|
progesterone receptor membrane component 1 |
| chrX_+_21839599 | 0.30 |
ENST00000379484.10
|
MBTPS2
|
membrane bound transcription factor peptidase, site 2 |
| chr10_+_71964373 | 0.30 |
ENST00000373115.5
|
CHST3
|
carbohydrate sulfotransferase 3 |
| chr15_+_32030506 | 0.29 |
ENST00000306901.9
ENST00000636440.1 |
CHRNA7
|
cholinergic receptor nicotinic alpha 7 subunit |
| chr7_-_92833896 | 0.29 |
ENST00000265734.8
|
CDK6
|
cyclin dependent kinase 6 |
| chr11_+_20599602 | 0.29 |
ENST00000525748.6
|
SLC6A5
|
solute carrier family 6 member 5 |
| chrX_-_33128360 | 0.29 |
ENST00000378677.6
|
DMD
|
dystrophin |
| chr19_+_51311638 | 0.29 |
ENST00000270642.9
|
IGLON5
|
IgLON family member 5 |
| chr17_-_40565459 | 0.29 |
ENST00000578085.1
ENST00000246657.2 |
CCR7
|
C-C motif chemokine receptor 7 |
| chr10_-_102114935 | 0.28 |
ENST00000361198.9
|
LDB1
|
LIM domain binding 1 |
| chr5_+_56815534 | 0.28 |
ENST00000399503.4
|
MAP3K1
|
mitogen-activated protein kinase kinase kinase 1 |
| chr14_-_70809494 | 0.28 |
ENST00000381250.8
ENST00000554752.7 ENST00000555993.6 |
MAP3K9
|
mitogen-activated protein kinase kinase kinase 9 |
| chr22_+_25564628 | 0.27 |
ENST00000324198.11
|
GRK3
|
G protein-coupled receptor kinase 3 |
| chr8_-_143541425 | 0.27 |
ENST00000262577.6
|
ZC3H3
|
zinc finger CCCH-type containing 3 |
| chr15_+_90001300 | 0.27 |
ENST00000268154.9
|
ZNF710
|
zinc finger protein 710 |
| chr2_+_99337364 | 0.27 |
ENST00000617677.1
ENST00000289371.11 |
EIF5B
|
eukaryotic translation initiation factor 5B |
| chr2_+_231395702 | 0.27 |
ENST00000287590.6
|
B3GNT7
|
UDP-GlcNAc:betaGal beta-1,3-N-acetylglucosaminyltransferase 7 |
| chr1_-_211830748 | 0.27 |
ENST00000366997.9
|
LPGAT1
|
lysophosphatidylglycerol acyltransferase 1 |
| chr22_+_21417357 | 0.26 |
ENST00000407464.7
|
HIC2
|
HIC ZBTB transcriptional repressor 2 |
| chr16_-_2196575 | 0.26 |
ENST00000343516.8
|
CASKIN1
|
CASK interacting protein 1 |
| chr9_+_4662281 | 0.26 |
ENST00000381883.5
|
PLPP6
|
phospholipid phosphatase 6 |
| chr22_+_50185894 | 0.26 |
ENST00000380909.9
ENST00000303434.8 |
TRABD
|
TraB domain containing |
| chr17_+_3636749 | 0.26 |
ENST00000046640.9
ENST00000574218.1 ENST00000399306.7 |
CTNS
|
cystinosin, lysosomal cystine transporter |
| chr9_-_108934060 | 0.26 |
ENST00000675406.1
ENST00000676237.1 ENST00000675825.1 ENST00000675052.1 ENST00000674535.1 ENST00000674938.1 ENST00000374647.10 |
ELP1
|
elongator acetyltransferase complex subunit 1 |
| chr12_-_12562851 | 0.26 |
ENST00000298573.9
|
DUSP16
|
dual specificity phosphatase 16 |
| chr8_-_103415085 | 0.26 |
ENST00000297578.9
|
SLC25A32
|
solute carrier family 25 member 32 |
| chr17_-_79009731 | 0.25 |
ENST00000392446.10
ENST00000590370.5 ENST00000591625.5 |
CANT1
|
calcium activated nucleotidase 1 |
| chr1_-_211579064 | 0.25 |
ENST00000367001.5
|
SLC30A1
|
solute carrier family 30 member 1 |
| chr20_-_51802509 | 0.25 |
ENST00000371539.7
ENST00000217086.9 |
SALL4
|
spalt like transcription factor 4 |
| chr2_+_218710821 | 0.25 |
ENST00000392102.6
ENST00000457313.5 ENST00000415717.5 |
TTLL4
|
tubulin tyrosine ligase like 4 |
| chr2_+_74654228 | 0.25 |
ENST00000611975.4
ENST00000357877.7 ENST00000339773.9 ENST00000434486.5 |
SEMA4F
|
ssemaphorin 4F |
| chr3_-_52056552 | 0.25 |
ENST00000495880.2
|
DUSP7
|
dual specificity phosphatase 7 |
| chr13_+_51584435 | 0.25 |
ENST00000612477.1
ENST00000298125.7 |
WDFY2
|
WD repeat and FYVE domain containing 2 |
| chr7_+_76461676 | 0.24 |
ENST00000425780.5
ENST00000456590.5 ENST00000451769.5 ENST00000324432.9 ENST00000457529.5 ENST00000446600.5 ENST00000430490.7 ENST00000413936.6 ENST00000423646.5 ENST00000438930.5 |
DTX2
|
deltex E3 ubiquitin ligase 2 |
| chr1_-_184754808 | 0.24 |
ENST00000318130.13
ENST00000367512.7 |
EDEM3
|
ER degradation enhancing alpha-mannosidase like protein 3 |
| chr19_+_46746046 | 0.24 |
ENST00000601299.5
ENST00000595570.5 ENST00000598271.5 ENST00000597313.5 ENST00000593875.5 ENST00000391909.7 ENST00000318584.10 ENST00000602250.5 ENST00000595868.5 ENST00000600629.5 ENST00000602181.5 ENST00000593800.5 ENST00000600227.5 ENST00000600005.5 ENST00000594467.5 ENST00000596460.5 |
FKRP
|
fukutin related protein |
| chr1_-_55215345 | 0.24 |
ENST00000294383.7
|
USP24
|
ubiquitin specific peptidase 24 |
| chr9_+_113221528 | 0.23 |
ENST00000374212.5
|
SLC31A1
|
solute carrier family 31 member 1 |
| chr1_-_246931326 | 0.23 |
ENST00000366508.5
ENST00000326225.3 |
AHCTF1
|
AT-hook containing transcription factor 1 |
| chrX_-_24672654 | 0.23 |
ENST00000379145.5
|
PCYT1B
|
phosphate cytidylyltransferase 1, choline, beta |
| chr11_-_27472698 | 0.23 |
ENST00000389858.4
ENST00000379214.9 |
LGR4
|
leucine rich repeat containing G protein-coupled receptor 4 |
| chr16_+_7332839 | 0.23 |
ENST00000355637.9
|
RBFOX1
|
RNA binding fox-1 homolog 1 |
| chr20_+_50731571 | 0.23 |
ENST00000371610.7
|
PARD6B
|
par-6 family cell polarity regulator beta |
| chr9_-_10612966 | 0.23 |
ENST00000381196.9
|
PTPRD
|
protein tyrosine phosphatase receptor type D |
| chr2_+_10122315 | 0.23 |
ENST00000360566.6
|
RRM2
|
ribonucleotide reductase regulatory subunit M2 |
| chr12_+_119593758 | 0.23 |
ENST00000426426.3
|
TMEM233
|
transmembrane protein 233 |
| chr2_+_128091166 | 0.23 |
ENST00000259253.11
|
UGGT1
|
UDP-glucose glycoprotein glucosyltransferase 1 |
| chr5_-_160312524 | 0.23 |
ENST00000520748.1
ENST00000257536.13 ENST00000393977.7 |
CCNJL
|
cyclin J like |
| chr21_-_28992815 | 0.23 |
ENST00000361371.10
|
LTN1
|
listerin E3 ubiquitin protein ligase 1 |
| chr6_+_11093753 | 0.23 |
ENST00000416247.4
|
SMIM13
|
small integral membrane protein 13 |
| chr12_-_89524734 | 0.23 |
ENST00000529983.3
|
GALNT4
|
polypeptide N-acetylgalactosaminyltransferase 4 |
| chr3_-_171460368 | 0.22 |
ENST00000436636.7
ENST00000465393.1 ENST00000341852.10 |
TNIK
|
TRAF2 and NCK interacting kinase |
| chr15_+_22786610 | 0.22 |
ENST00000337435.9
|
NIPA1
|
NIPA magnesium transporter 1 |
| chr1_-_93180261 | 0.22 |
ENST00000370280.1
ENST00000479918.5 |
TMED5
|
transmembrane p24 trafficking protein 5 |
| chr2_-_230068905 | 0.22 |
ENST00000457406.5
ENST00000295190.9 |
SLC16A14
|
solute carrier family 16 member 14 |
| chr2_+_152718604 | 0.22 |
ENST00000326446.10
|
ARL6IP6
|
ADP ribosylation factor like GTPase 6 interacting protein 6 |
| chr15_+_81000913 | 0.22 |
ENST00000267984.4
|
TLNRD1
|
talin rod domain containing 1 |
| chr12_+_1691011 | 0.22 |
ENST00000357103.5
|
ADIPOR2
|
adiponectin receptor 2 |
| chr10_+_86756580 | 0.22 |
ENST00000372037.8
|
BMPR1A
|
bone morphogenetic protein receptor type 1A |
| chr16_+_30923565 | 0.22 |
ENST00000338343.10
|
FBXL19
|
F-box and leucine rich repeat protein 19 |
| chrX_+_105822531 | 0.22 |
ENST00000243300.14
ENST00000536164.5 |
NRK
|
Nik related kinase |
| chr17_+_40062956 | 0.22 |
ENST00000450525.7
|
THRA
|
thyroid hormone receptor alpha |
| chr8_+_41578176 | 0.22 |
ENST00000396987.7
ENST00000519853.5 |
GPAT4
|
glycerol-3-phosphate acyltransferase 4 |
| chr19_+_6531018 | 0.21 |
ENST00000245817.5
|
TNFSF9
|
TNF superfamily member 9 |
| chr3_-_53046031 | 0.21 |
ENST00000482396.5
ENST00000394752.8 |
SFMBT1
|
Scm like with four mbt domains 1 |
| chr1_+_15617415 | 0.21 |
ENST00000480945.6
|
DDI2
|
DNA damage inducible 1 homolog 2 |
| chr7_+_38977904 | 0.21 |
ENST00000518318.7
ENST00000403058.6 |
POU6F2
|
POU class 6 homeobox 2 |
| chr3_-_121834983 | 0.20 |
ENST00000498104.1
ENST00000460108.5 ENST00000349820.10 ENST00000310864.11 ENST00000462442.1 |
IQCB1
|
IQ motif containing B1 |
| chr12_+_53268289 | 0.20 |
ENST00000257934.9
|
ESPL1
|
extra spindle pole bodies like 1, separase |
| chr20_-_8019744 | 0.20 |
ENST00000246024.7
|
TMX4
|
thioredoxin related transmembrane protein 4 |
| chr21_-_41508146 | 0.20 |
ENST00000679054.1
ENST00000678348.1 ENST00000332149.10 ENST00000679016.1 ENST00000678743.1 ENST00000678171.1 ENST00000458356.6 |
TMPRSS2
|
transmembrane serine protease 2 |
| chrX_+_148500610 | 0.20 |
ENST00000370460.7
|
AFF2
|
AF4/FMR2 family member 2 |
| chr3_+_184380047 | 0.20 |
ENST00000204604.5
|
CHRD
|
chordin |
| chr1_-_6235945 | 0.20 |
ENST00000343813.10
|
ICMT
|
isoprenylcysteine carboxyl methyltransferase |
| chr8_-_66667138 | 0.20 |
ENST00000310421.5
|
VCPIP1
|
valosin containing protein interacting protein 1 |
| chr2_+_167868948 | 0.20 |
ENST00000392690.3
|
B3GALT1
|
beta-1,3-galactosyltransferase 1 |
| chr19_+_38319807 | 0.20 |
ENST00000263372.5
|
KCNK6
|
potassium two pore domain channel subfamily K member 6 |
| chr1_+_230067198 | 0.20 |
ENST00000366672.5
|
GALNT2
|
polypeptide N-acetylgalactosaminyltransferase 2 |
| chr16_+_70114306 | 0.20 |
ENST00000288050.9
ENST00000398122.7 ENST00000568530.5 |
PDPR
|
pyruvate dehydrogenase phosphatase regulatory subunit |
| chr5_+_73565734 | 0.20 |
ENST00000543251.5
ENST00000509005.5 ENST00000296792.9 ENST00000508686.1 ENST00000508491.1 |
UTP15
|
UTP15 small subunit processome component |
| chr1_+_203626775 | 0.19 |
ENST00000367218.7
|
ATP2B4
|
ATPase plasma membrane Ca2+ transporting 4 |
| chr2_-_157628852 | 0.19 |
ENST00000243349.13
|
ACVR1C
|
activin A receptor type 1C |
| chr21_+_41167774 | 0.19 |
ENST00000328735.10
ENST00000347667.5 |
BACE2
|
beta-secretase 2 |
| chr1_+_100896060 | 0.19 |
ENST00000370112.8
ENST00000357650.9 |
SLC30A7
|
solute carrier family 30 member 7 |
| chrX_+_135520616 | 0.19 |
ENST00000370752.4
ENST00000639893.2 |
INTS6L
|
integrator complex subunit 6 like |
| chr18_+_35581734 | 0.19 |
ENST00000591924.5
ENST00000269195.6 |
GALNT1
|
polypeptide N-acetylgalactosaminyltransferase 1 |
| chr6_+_43427535 | 0.19 |
ENST00000372530.9
|
ABCC10
|
ATP binding cassette subfamily C member 10 |
| chr1_-_157138388 | 0.19 |
ENST00000368192.9
|
ETV3
|
ETS variant transcription factor 3 |
| chr15_+_40569290 | 0.19 |
ENST00000315616.12
ENST00000559271.1 ENST00000616318.1 |
RPUSD2
|
RNA pseudouridine synthase domain containing 2 |
| chr5_+_38846002 | 0.19 |
ENST00000274276.8
|
OSMR
|
oncostatin M receptor |
| chr2_+_203936755 | 0.19 |
ENST00000316386.11
ENST00000435193.1 |
ICOS
|
inducible T cell costimulator |
| chr6_-_85642922 | 0.18 |
ENST00000616122.5
ENST00000678618.1 ENST00000678816.1 ENST00000676630.1 ENST00000678589.1 ENST00000678878.1 ENST00000676542.1 ENST00000355238.11 ENST00000678899.1 |
SYNCRIP
|
synaptotagmin binding cytoplasmic RNA interacting protein |
| chr15_+_97960692 | 0.18 |
ENST00000268042.7
|
ARRDC4
|
arrestin domain containing 4 |
| chr1_-_156082412 | 0.18 |
ENST00000532414.3
|
MEX3A
|
mex-3 RNA binding family member A |
| chr4_+_55948871 | 0.18 |
ENST00000422247.6
ENST00000257287.5 |
CEP135
|
centrosomal protein 135 |
| chr6_+_35213948 | 0.18 |
ENST00000274938.8
|
SCUBE3
|
signal peptide, CUB domain and EGF like domain containing 3 |
| chr18_+_46334007 | 0.18 |
ENST00000269439.12
ENST00000590330.1 |
RNF165
|
ring finger protein 165 |
| chr1_+_15409858 | 0.18 |
ENST00000375980.9
|
EFHD2
|
EF-hand domain family member D2 |
| chr17_+_18315273 | 0.17 |
ENST00000406438.5
|
SMCR8
|
SMCR8-C9orf72 complex subunit |
| chr4_+_87650277 | 0.17 |
ENST00000339673.11
ENST00000282479.8 |
DMP1
|
dentin matrix acidic phosphoprotein 1 |
| chr15_-_30393540 | 0.17 |
ENST00000299847.7
ENST00000397827.7 |
CHRFAM7A
|
CHRNA7 (exons 5-10) and FAM7A (exons A-E) fusion |
| chr19_-_47471886 | 0.17 |
ENST00000236877.11
ENST00000597014.1 |
SLC8A2
|
solute carrier family 8 member A2 |
| chr1_+_231162052 | 0.17 |
ENST00000366653.6
ENST00000444294.7 |
TRIM67
|
tripartite motif containing 67 |
Network of associatons between targets according to the STRING database.

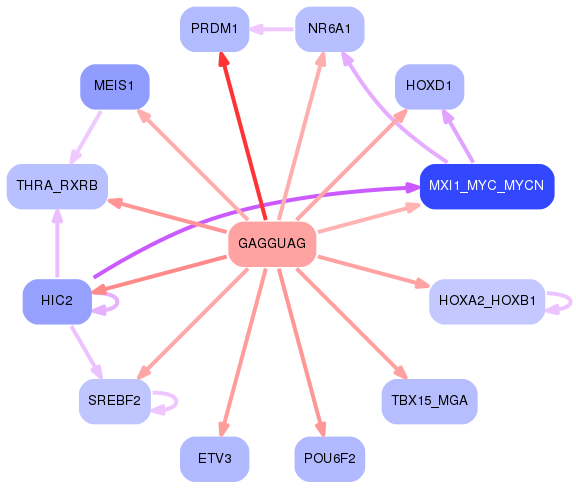
First level regulatory network of GAGGUAG
Gene Ontology Analysis
Gene overrepresentation in biological process category:
| Log-likelihood per target | Total log-likelihood | Term | Description |
|---|---|---|---|
| 0.3 | 0.8 | GO:0060128 | regulation of calcium-independent cell-cell adhesion(GO:0051040) corticotropin hormone secreting cell differentiation(GO:0060128) |
| 0.2 | 1.2 | GO:0036515 | serotonergic neuron axon guidance(GO:0036515) |
| 0.2 | 0.7 | GO:0002025 | vasodilation by norepinephrine-epinephrine involved in regulation of systemic arterial blood pressure(GO:0002025) |
| 0.2 | 0.7 | GO:0003221 | right ventricular cardiac muscle tissue morphogenesis(GO:0003221) |
| 0.2 | 1.1 | GO:1900127 | positive regulation of hyaluronan biosynthetic process(GO:1900127) |
| 0.2 | 0.7 | GO:0034148 | regulation of toll-like receptor 5 signaling pathway(GO:0034147) negative regulation of toll-like receptor 5 signaling pathway(GO:0034148) negative regulation of nucleotide-binding oligomerization domain containing 1 signaling pathway(GO:0070429) |
| 0.2 | 0.6 | GO:0030185 | nitric oxide transport(GO:0030185) |
| 0.2 | 0.6 | GO:1990654 | regulation of extrathymic T cell differentiation(GO:0033082) sebum secreting cell proliferation(GO:1990654) |
| 0.2 | 1.0 | GO:0051182 | coenzyme transport(GO:0051182) |
| 0.2 | 0.5 | GO:0033693 | neurofilament bundle assembly(GO:0033693) |
| 0.1 | 0.4 | GO:0090526 | regulation of gluconeogenesis involved in cellular glucose homeostasis(GO:0090526) |
| 0.1 | 0.7 | GO:1902943 | response to symbiont(GO:0009608) response to symbiotic bacterium(GO:0009609) regulation of voltage-gated chloride channel activity(GO:1902941) positive regulation of voltage-gated chloride channel activity(GO:1902943) positive regulation of leukocyte tethering or rolling(GO:1903238) |
| 0.1 | 0.4 | GO:0061184 | positive regulation of dermatome development(GO:0061184) |
| 0.1 | 0.9 | GO:0031133 | regulation of axon diameter(GO:0031133) |
| 0.1 | 0.4 | GO:0002581 | negative regulation of antigen processing and presentation of peptide or polysaccharide antigen via MHC class II(GO:0002581) regulation of cGMP-mediated signaling(GO:0010752) |
| 0.1 | 0.3 | GO:0003343 | proepicardium development(GO:0003342) septum transversum development(GO:0003343) |
| 0.1 | 0.4 | GO:0018242 | protein O-linked glycosylation via serine(GO:0018242) |
| 0.1 | 0.5 | GO:1904925 | positive regulation of macromitophagy(GO:1901526) positive regulation of mitophagy in response to mitochondrial depolarization(GO:1904925) |
| 0.1 | 1.6 | GO:0032119 | sequestering of zinc ion(GO:0032119) |
| 0.1 | 0.3 | GO:0036233 | glycine import(GO:0036233) |
| 0.1 | 0.8 | GO:0051541 | elastin metabolic process(GO:0051541) |
| 0.1 | 0.3 | GO:2000525 | regulation of T cell costimulation(GO:2000523) positive regulation of T cell costimulation(GO:2000525) regulation of dendritic cell dendrite assembly(GO:2000547) |
| 0.1 | 0.3 | GO:0043973 | histone H3-K4 acetylation(GO:0043973) |
| 0.1 | 0.4 | GO:0021823 | cerebral cortex tangential migration using cell-cell interactions(GO:0021823) postnatal olfactory bulb interneuron migration(GO:0021827) chemorepulsion involved in postnatal olfactory bulb interneuron migration(GO:0021836) negative regulation of negative chemotaxis(GO:0050925) |
| 0.1 | 0.5 | GO:0003431 | growth plate cartilage chondrocyte development(GO:0003431) |
| 0.1 | 0.2 | GO:0060995 | cell-cell signaling involved in kidney development(GO:0060995) Wnt signaling pathway involved in kidney development(GO:0061289) canonical Wnt signaling pathway involved in metanephric kidney development(GO:0061290) cell-cell signaling involved in metanephros development(GO:0072204) |
| 0.1 | 0.3 | GO:0016256 | N-glycan processing to lysosome(GO:0016256) |
| 0.1 | 0.5 | GO:0070973 | protein localization to endoplasmic reticulum exit site(GO:0070973) |
| 0.1 | 0.4 | GO:0043504 | DNA replication, removal of RNA primer(GO:0043137) mitochondrial DNA repair(GO:0043504) mitotic telomere maintenance via semi-conservative replication(GO:1902990) |
| 0.1 | 0.5 | GO:0032439 | endosome localization(GO:0032439) |
| 0.1 | 0.2 | GO:0048382 | mesendoderm development(GO:0048382) |
| 0.1 | 0.2 | GO:0060722 | spongiotrophoblast cell proliferation(GO:0060720) regulation of spongiotrophoblast cell proliferation(GO:0060721) cell proliferation involved in embryonic placenta development(GO:0060722) regulation of cell proliferation involved in embryonic placenta development(GO:0060723) |
| 0.1 | 0.2 | GO:0002071 | glandular epithelial cell maturation(GO:0002071) |
| 0.1 | 0.2 | GO:0048867 | stem cell fate determination(GO:0048867) |
| 0.1 | 0.2 | GO:1903249 | regulation of cellular amine catabolic process(GO:0033241) negative regulation of cellular amine catabolic process(GO:0033242) negative regulation of the force of heart contraction(GO:0098736) regulation of arginine catabolic process(GO:1900081) negative regulation of arginine catabolic process(GO:1900082) regulation of citrulline biosynthetic process(GO:1903248) negative regulation of citrulline biosynthetic process(GO:1903249) negative regulation of cellular amino acid biosynthetic process(GO:2000283) |
| 0.1 | 0.2 | GO:0097360 | chorionic trophoblast cell proliferation(GO:0097360) regulation of chorionic trophoblast cell proliferation(GO:1901382) |
| 0.1 | 0.6 | GO:0015677 | copper ion import(GO:0015677) |
| 0.1 | 0.8 | GO:0032927 | positive regulation of activin receptor signaling pathway(GO:0032927) |
| 0.1 | 0.2 | GO:0035977 | protein deglycosylation involved in glycoprotein catabolic process(GO:0035977) glycoprotein ERAD pathway(GO:0097466) mannose trimming involved in glycoprotein ERAD pathway(GO:1904382) |
| 0.1 | 0.2 | GO:0002668 | negative regulation of T cell tolerance induction(GO:0002665) negative regulation of T cell anergy(GO:0002668) negative regulation of lymphocyte anergy(GO:0002912) regulation of lymphotoxin A production(GO:0032681) positive regulation of lymphotoxin A production(GO:0032761) regulation of lymphotoxin A biosynthetic process(GO:0043016) positive regulation of lymphotoxin A biosynthetic process(GO:0043017) |
| 0.1 | 0.5 | GO:0033564 | anterior/posterior axon guidance(GO:0033564) |
| 0.1 | 0.3 | GO:0045875 | negative regulation of sister chromatid cohesion(GO:0045875) |
| 0.1 | 0.2 | GO:0097051 | establishment of protein localization to endoplasmic reticulum membrane(GO:0097051) positive regulation of protein lipidation(GO:1903061) |
| 0.1 | 0.2 | GO:0045065 | cytotoxic T cell differentiation(GO:0045065) |
| 0.1 | 0.6 | GO:0034312 | diol biosynthetic process(GO:0034312) sphingosine biosynthetic process(GO:0046512) |
| 0.1 | 0.2 | GO:0033861 | negative regulation of NAD(P)H oxidase activity(GO:0033861) |
| 0.1 | 0.5 | GO:1903912 | negative regulation of PERK-mediated unfolded protein response(GO:1903898) negative regulation of endoplasmic reticulum stress-induced eIF2 alpha phosphorylation(GO:1903912) |
| 0.1 | 0.2 | GO:0061300 | cerebellum vasculature development(GO:0061300) |
| 0.0 | 1.0 | GO:0097264 | self proteolysis(GO:0097264) |
| 0.0 | 0.0 | GO:0061153 | trachea submucosa development(GO:0061152) trachea gland development(GO:0061153) |
| 0.0 | 0.0 | GO:0071676 | negative regulation of mononuclear cell migration(GO:0071676) |
| 0.0 | 0.2 | GO:0021571 | rhombomere 5 development(GO:0021571) |
| 0.0 | 0.3 | GO:0050893 | sensory processing(GO:0050893) |
| 0.0 | 0.3 | GO:1904627 | response to phorbol 13-acetate 12-myristate(GO:1904627) cellular response to phorbol 13-acetate 12-myristate(GO:1904628) |
| 0.0 | 0.1 | GO:0014846 | esophagus smooth muscle contraction(GO:0014846) |
| 0.0 | 0.1 | GO:0051939 | gamma-aminobutyric acid import(GO:0051939) |
| 0.0 | 0.4 | GO:0007256 | activation of JNKK activity(GO:0007256) |
| 0.0 | 0.2 | GO:0048496 | maintenance of organ identity(GO:0048496) |
| 0.0 | 0.1 | GO:0009386 | translational attenuation(GO:0009386) |
| 0.0 | 0.4 | GO:0034625 | fatty acid elongation, saturated fatty acid(GO:0019367) fatty acid elongation, unsaturated fatty acid(GO:0019368) fatty acid elongation, monounsaturated fatty acid(GO:0034625) fatty acid elongation, polyunsaturated fatty acid(GO:0034626) |
| 0.0 | 0.2 | GO:0039534 | negative regulation of MDA-5 signaling pathway(GO:0039534) |
| 0.0 | 0.9 | GO:0060019 | radial glial cell differentiation(GO:0060019) |
| 0.0 | 0.2 | GO:0090370 | negative regulation of cholesterol efflux(GO:0090370) |
| 0.0 | 0.2 | GO:0033211 | adiponectin-activated signaling pathway(GO:0033211) |
| 0.0 | 0.2 | GO:0017055 | negative regulation of RNA polymerase II transcriptional preinitiation complex assembly(GO:0017055) |
| 0.0 | 0.4 | GO:0060431 | primary lung bud formation(GO:0060431) |
| 0.0 | 0.5 | GO:0022417 | protein maturation by protein folding(GO:0022417) |
| 0.0 | 0.7 | GO:0016024 | CDP-diacylglycerol biosynthetic process(GO:0016024) |
| 0.0 | 0.6 | GO:0010510 | regulation of acetyl-CoA biosynthetic process from pyruvate(GO:0010510) |
| 0.0 | 0.3 | GO:0000972 | transcription-dependent tethering of RNA polymerase II gene DNA at nuclear periphery(GO:0000972) |
| 0.0 | 0.7 | GO:0072498 | embryonic skeletal joint development(GO:0072498) |
| 0.0 | 0.2 | GO:0009098 | branched-chain amino acid biosynthetic process(GO:0009082) leucine biosynthetic process(GO:0009098) valine biosynthetic process(GO:0009099) |
| 0.0 | 0.2 | GO:0035063 | nuclear speck organization(GO:0035063) |
| 0.0 | 0.2 | GO:2000234 | positive regulation of ribosome biogenesis(GO:0090070) positive regulation of rRNA processing(GO:2000234) |
| 0.0 | 0.2 | GO:0001555 | oocyte growth(GO:0001555) |
| 0.0 | 0.2 | GO:1901098 | positive regulation of autophagosome maturation(GO:1901098) |
| 0.0 | 0.1 | GO:0035989 | tendon development(GO:0035989) |
| 0.0 | 0.2 | GO:0015811 | L-cystine transport(GO:0015811) |
| 0.0 | 0.3 | GO:0006390 | transcription from mitochondrial promoter(GO:0006390) |
| 0.0 | 0.2 | GO:0033504 | floor plate development(GO:0033504) |
| 0.0 | 0.2 | GO:0038165 | oncostatin-M-mediated signaling pathway(GO:0038165) |
| 0.0 | 0.1 | GO:2000053 | regulation of Wnt signaling pathway involved in dorsal/ventral axis specification(GO:2000053) |
| 0.0 | 0.1 | GO:0006679 | glucosylceramide biosynthetic process(GO:0006679) |
| 0.0 | 0.3 | GO:0036500 | ATF6-mediated unfolded protein response(GO:0036500) |
| 0.0 | 0.1 | GO:2000616 | negative regulation of histone H3-K9 acetylation(GO:2000616) |
| 0.0 | 0.1 | GO:0061325 | cell proliferation involved in outflow tract morphogenesis(GO:0061325) |
| 0.0 | 0.3 | GO:0015693 | magnesium ion transport(GO:0015693) |
| 0.0 | 0.5 | GO:0071481 | cellular response to X-ray(GO:0071481) |
| 0.0 | 1.1 | GO:0035774 | positive regulation of insulin secretion involved in cellular response to glucose stimulus(GO:0035774) |
| 0.0 | 0.1 | GO:1901874 | negative regulation of post-translational protein modification(GO:1901874) |
| 0.0 | 0.2 | GO:0006657 | CDP-choline pathway(GO:0006657) |
| 0.0 | 0.3 | GO:0014809 | regulation of skeletal muscle contraction by regulation of release of sequestered calcium ion(GO:0014809) |
| 0.0 | 0.2 | GO:0019375 | galactosylceramide biosynthetic process(GO:0006682) galactolipid biosynthetic process(GO:0019375) |
| 0.0 | 0.1 | GO:1990637 | response to prolactin(GO:1990637) |
| 0.0 | 0.1 | GO:1902174 | positive regulation of keratinocyte apoptotic process(GO:1902174) |
| 0.0 | 0.2 | GO:0090649 | response to oxygen-glucose deprivation(GO:0090649) cellular response to oxygen-glucose deprivation(GO:0090650) |
| 0.0 | 0.1 | GO:0030950 | establishment or maintenance of actin cytoskeleton polarity(GO:0030950) |
| 0.0 | 0.3 | GO:0018095 | protein polyglutamylation(GO:0018095) |
| 0.0 | 0.2 | GO:0006011 | UDP-glucose metabolic process(GO:0006011) |
| 0.0 | 0.9 | GO:0030206 | chondroitin sulfate biosynthetic process(GO:0030206) |
| 0.0 | 0.2 | GO:0097012 | cellular response to granulocyte macrophage colony-stimulating factor stimulus(GO:0097011) response to granulocyte macrophage colony-stimulating factor(GO:0097012) |
| 0.0 | 0.6 | GO:0090162 | establishment of epithelial cell polarity(GO:0090162) |
| 0.0 | 0.2 | GO:0009950 | dorsal/ventral axis specification(GO:0009950) |
| 0.0 | 0.2 | GO:0046598 | positive regulation of viral entry into host cell(GO:0046598) |
| 0.0 | 1.1 | GO:0045022 | early endosome to late endosome transport(GO:0045022) |
| 0.0 | 0.2 | GO:0060075 | regulation of resting membrane potential(GO:0060075) |
| 0.0 | 0.2 | GO:0097105 | presynaptic membrane assembly(GO:0097105) |
| 0.0 | 0.7 | GO:0007191 | adenylate cyclase-activating dopamine receptor signaling pathway(GO:0007191) |
| 0.0 | 0.1 | GO:0097477 | lateral motor column neuron migration(GO:0097477) |
| 0.0 | 0.4 | GO:0034656 | nucleobase-containing small molecule catabolic process(GO:0034656) |
| 0.0 | 0.3 | GO:0010826 | negative regulation of centrosome duplication(GO:0010826) |
| 0.0 | 0.1 | GO:0044725 | chromatin reprogramming in the zygote(GO:0044725) |
| 0.0 | 0.7 | GO:0006418 | tRNA aminoacylation for protein translation(GO:0006418) |
| 0.0 | 0.1 | GO:1905205 | positive regulation of connective tissue replacement(GO:1905205) |
| 0.0 | 0.2 | GO:0042985 | negative regulation of amyloid precursor protein biosynthetic process(GO:0042985) |
| 0.0 | 0.6 | GO:0016338 | calcium-independent cell-cell adhesion via plasma membrane cell-adhesion molecules(GO:0016338) |
| 0.0 | 0.1 | GO:0061304 | retinal blood vessel morphogenesis(GO:0061304) |
| 0.0 | 0.2 | GO:0031118 | rRNA pseudouridine synthesis(GO:0031118) |
| 0.0 | 0.2 | GO:0035871 | protein K11-linked deubiquitination(GO:0035871) |
| 0.0 | 0.2 | GO:1903830 | magnesium ion transmembrane transport(GO:1903830) |
| 0.0 | 0.1 | GO:0030423 | targeting of mRNA for destruction involved in RNA interference(GO:0030423) |
| 0.0 | 0.2 | GO:1902857 | positive regulation of nonmotile primary cilium assembly(GO:1902857) |
| 0.0 | 0.0 | GO:0046338 | phosphatidylethanolamine catabolic process(GO:0046338) |
| 0.0 | 0.9 | GO:0043171 | peptide catabolic process(GO:0043171) |
| 0.0 | 0.1 | GO:0035672 | oligopeptide transmembrane transport(GO:0035672) |
| 0.0 | 0.2 | GO:0090161 | Golgi ribbon formation(GO:0090161) |
| 0.0 | 0.3 | GO:0001833 | inner cell mass cell proliferation(GO:0001833) |
| 0.0 | 0.1 | GO:0010746 | regulation of plasma membrane long-chain fatty acid transport(GO:0010746) negative regulation of plasma membrane long-chain fatty acid transport(GO:0010748) |
| 0.0 | 0.2 | GO:0070166 | enamel mineralization(GO:0070166) |
| 0.0 | 0.1 | GO:0045607 | regulation of auditory receptor cell differentiation(GO:0045607) regulation of mechanoreceptor differentiation(GO:0045631) regulation of inner ear receptor cell differentiation(GO:2000980) |
| 0.0 | 0.4 | GO:0001573 | ganglioside metabolic process(GO:0001573) |
| 0.0 | 0.1 | GO:0030210 | heparin metabolic process(GO:0030202) heparin biosynthetic process(GO:0030210) |
| 0.0 | 0.1 | GO:0072553 | terminal button organization(GO:0072553) |
| 0.0 | 0.3 | GO:0036148 | phosphatidylglycerol acyl-chain remodeling(GO:0036148) |
| 0.0 | 0.1 | GO:0010533 | regulation of activation of Janus kinase activity(GO:0010533) |
| 0.0 | 0.1 | GO:0032511 | late endosome to vacuole transport via multivesicular body sorting pathway(GO:0032511) |
| 0.0 | 0.1 | GO:0016095 | polyprenol catabolic process(GO:0016095) |
| 0.0 | 0.2 | GO:0002517 | T cell tolerance induction(GO:0002517) |
| 0.0 | 0.1 | GO:1903800 | positive regulation of production of miRNAs involved in gene silencing by miRNA(GO:1903800) |
| 0.0 | 0.3 | GO:0045880 | positive regulation of smoothened signaling pathway(GO:0045880) |
| 0.0 | 0.1 | GO:0072423 | response to cell cycle checkpoint signaling(GO:0072396) response to DNA integrity checkpoint signaling(GO:0072402) response to DNA damage checkpoint signaling(GO:0072423) |
| 0.0 | 0.1 | GO:0032252 | secretory granule localization(GO:0032252) |
| 0.0 | 0.2 | GO:0051292 | nuclear pore complex assembly(GO:0051292) |
| 0.0 | 0.1 | GO:0043652 | engulfment of apoptotic cell(GO:0043652) |
| 0.0 | 0.2 | GO:0051290 | protein heterotetramerization(GO:0051290) |
| 0.0 | 0.0 | GO:1990926 | short-term synaptic potentiation(GO:1990926) |
| 0.0 | 0.0 | GO:1904636 | response to ionomycin(GO:1904636) cellular response to ionomycin(GO:1904637) |
| 0.0 | 0.0 | GO:0035498 | carnosine metabolic process(GO:0035498) |
| 0.0 | 0.0 | GO:2000863 | positive regulation of estrogen secretion(GO:2000863) positive regulation of estradiol secretion(GO:2000866) |
Gene overrepresentation in cellular component category:
| Log-likelihood per target | Total log-likelihood | Term | Description |
|---|---|---|---|
| 0.2 | 0.6 | GO:0048237 | rough endoplasmic reticulum lumen(GO:0048237) |
| 0.1 | 0.4 | GO:1990723 | cytoplasmic periphery of the nuclear pore complex(GO:1990723) |
| 0.1 | 0.9 | GO:0070695 | FHF complex(GO:0070695) |
| 0.1 | 0.4 | GO:0034686 | integrin alphav-beta8 complex(GO:0034686) |
| 0.1 | 0.4 | GO:0005760 | gamma DNA polymerase complex(GO:0005760) |
| 0.1 | 0.4 | GO:0060187 | cell pole(GO:0060187) |
| 0.1 | 0.3 | GO:0044611 | nuclear pore inner ring(GO:0044611) |
| 0.1 | 0.5 | GO:0097129 | cyclin D2-CDK4 complex(GO:0097129) |
| 0.1 | 0.2 | GO:0005900 | oncostatin-M receptor complex(GO:0005900) |
| 0.1 | 0.3 | GO:0044308 | axonal spine(GO:0044308) |
| 0.1 | 0.3 | GO:0070022 | transforming growth factor beta receptor homodimeric complex(GO:0070022) |
| 0.0 | 0.4 | GO:0071986 | Ragulator complex(GO:0071986) |
| 0.0 | 0.2 | GO:0048179 | activin receptor complex(GO:0048179) |
| 0.0 | 0.2 | GO:0005971 | ribonucleoside-diphosphate reductase complex(GO:0005971) |
| 0.0 | 0.6 | GO:0045179 | apical cortex(GO:0045179) |
| 0.0 | 0.9 | GO:0032433 | filopodium tip(GO:0032433) |
| 0.0 | 0.1 | GO:0005592 | collagen type XI trimer(GO:0005592) |
| 0.0 | 0.2 | GO:0032937 | SREBP-SCAP-Insig complex(GO:0032937) |
| 0.0 | 0.5 | GO:0097418 | neurofibrillary tangle(GO:0097418) |
| 0.0 | 0.2 | GO:0090571 | RNA polymerase II transcription repressor complex(GO:0090571) |
| 0.0 | 0.4 | GO:0005577 | fibrinogen complex(GO:0005577) |
| 0.0 | 0.5 | GO:0000164 | protein phosphatase type 1 complex(GO:0000164) |
| 0.0 | 0.1 | GO:0038039 | G-protein coupled receptor heterodimeric complex(GO:0038039) |
| 0.0 | 0.3 | GO:0046581 | intercellular canaliculus(GO:0046581) |
| 0.0 | 0.2 | GO:0030688 | preribosome, small subunit precursor(GO:0030688) |
| 0.0 | 0.3 | GO:0016013 | syntrophin complex(GO:0016013) |
| 0.0 | 0.2 | GO:0097452 | GAIT complex(GO:0097452) |
| 0.0 | 0.2 | GO:1990316 | ATG1/ULK1 kinase complex(GO:1990316) |
| 0.0 | 0.2 | GO:0032133 | chromosome passenger complex(GO:0032133) |
| 0.0 | 0.2 | GO:1990712 | HFE-transferrin receptor complex(GO:1990712) |
| 0.0 | 0.1 | GO:0033596 | TSC1-TSC2 complex(GO:0033596) |
| 0.0 | 0.2 | GO:0031080 | nuclear pore outer ring(GO:0031080) |
| 0.0 | 0.5 | GO:0044322 | endoplasmic reticulum quality control compartment(GO:0044322) |
| 0.0 | 0.3 | GO:0005639 | integral component of nuclear inner membrane(GO:0005639) intrinsic component of nuclear inner membrane(GO:0031229) |
| 0.0 | 0.8 | GO:0030173 | integral component of Golgi membrane(GO:0030173) |
| 0.0 | 0.2 | GO:0005847 | mRNA cleavage and polyadenylation specificity factor complex(GO:0005847) |
| 0.0 | 0.2 | GO:0044666 | MLL3/4 complex(GO:0044666) |
| 0.0 | 0.3 | GO:0001518 | voltage-gated sodium channel complex(GO:0001518) |
| 0.0 | 0.1 | GO:0000214 | tRNA-intron endonuclease complex(GO:0000214) |
| 0.0 | 0.2 | GO:0008278 | cohesin complex(GO:0008278) |
Gene overrepresentation in molecular function category:
| Log-likelihood per target | Total log-likelihood | Term | Description |
|---|---|---|---|
| 0.2 | 0.7 | GO:0008523 | sodium-dependent multivitamin transmembrane transporter activity(GO:0008523) |
| 0.2 | 0.7 | GO:0004939 | beta-adrenergic receptor activity(GO:0004939) |
| 0.2 | 0.5 | GO:0030158 | protein xylosyltransferase activity(GO:0030158) |
| 0.2 | 0.7 | GO:0004992 | platelet activating factor receptor activity(GO:0004992) |
| 0.2 | 0.9 | GO:0004366 | glycerol-3-phosphate O-acyltransferase activity(GO:0004366) |
| 0.2 | 0.6 | GO:0004741 | [pyruvate dehydrogenase (lipoamide)] phosphatase activity(GO:0004741) |
| 0.1 | 0.4 | GO:0050613 | delta14-sterol reductase activity(GO:0050613) |
| 0.1 | 0.9 | GO:0035662 | Toll-like receptor 4 binding(GO:0035662) |
| 0.1 | 0.4 | GO:0070052 | collagen V binding(GO:0070052) |
| 0.1 | 2.6 | GO:0016641 | oxidoreductase activity, acting on the CH-NH2 group of donors, oxygen as acceptor(GO:0016641) |
| 0.1 | 0.6 | GO:0031708 | endothelin B receptor binding(GO:0031708) |
| 0.1 | 0.5 | GO:0050501 | hyaluronan synthase activity(GO:0050501) |
| 0.1 | 0.3 | GO:0004382 | guanosine-diphosphatase activity(GO:0004382) |
| 0.1 | 0.4 | GO:1990430 | extracellular matrix protein binding(GO:1990430) |
| 0.1 | 0.6 | GO:0098821 | BMP receptor activity(GO:0098821) |
| 0.1 | 0.4 | GO:0016890 | site-specific endodeoxyribonuclease activity, specific for altered base(GO:0016890) |
| 0.1 | 0.3 | GO:0098770 | FBXO family protein binding(GO:0098770) |
| 0.1 | 0.2 | GO:0055100 | adiponectin binding(GO:0055100) |
| 0.1 | 0.3 | GO:0015375 | glycine:sodium symporter activity(GO:0015375) |
| 0.1 | 0.6 | GO:0017040 | ceramidase activity(GO:0017040) |
| 0.1 | 0.2 | GO:0036487 | nitric-oxide synthase inhibitor activity(GO:0036487) |
| 0.1 | 0.3 | GO:0003976 | UDP-N-acetylglucosamine-lysosomal-enzyme N-acetylglucosaminephosphotransferase activity(GO:0003976) |
| 0.1 | 0.8 | GO:0070700 | BMP receptor binding(GO:0070700) |
| 0.1 | 0.5 | GO:0004340 | glucokinase activity(GO:0004340) hexokinase activity(GO:0004396) fructokinase activity(GO:0008865) mannokinase activity(GO:0019158) |
| 0.1 | 0.3 | GO:0004706 | JUN kinase kinase kinase activity(GO:0004706) |
| 0.1 | 0.3 | GO:0008823 | cupric reductase activity(GO:0008823) ferric-chelate reductase (NADPH) activity(GO:0052851) |
| 0.1 | 0.3 | GO:0017002 | activin-activated receptor activity(GO:0017002) |
| 0.1 | 0.6 | GO:0016176 | superoxide-generating NADPH oxidase activator activity(GO:0016176) |
| 0.1 | 0.2 | GO:0000247 | C-8 sterol isomerase activity(GO:0000247) |
| 0.0 | 0.3 | GO:0005025 | transforming growth factor beta receptor activity, type I(GO:0005025) |
| 0.0 | 0.1 | GO:0072590 | N-acetyl-L-aspartate-L-glutamate ligase activity(GO:0072590) |
| 0.0 | 0.2 | GO:0004105 | choline-phosphate cytidylyltransferase activity(GO:0004105) |
| 0.0 | 0.2 | GO:0004748 | ribonucleoside-diphosphate reductase activity, thioredoxin disulfide as acceptor(GO:0004748) oxidoreductase activity, acting on CH or CH2 groups, disulfide as acceptor(GO:0016728) ribonucleoside-diphosphate reductase activity(GO:0061731) |
| 0.0 | 0.3 | GO:0047696 | beta-adrenergic receptor kinase activity(GO:0047696) |
| 0.0 | 0.2 | GO:0004768 | stearoyl-CoA 9-desaturase activity(GO:0004768) acyl-CoA desaturase activity(GO:0016215) |
| 0.0 | 0.2 | GO:0016262 | protein N-acetylglucosaminyltransferase activity(GO:0016262) |
| 0.0 | 0.3 | GO:0001517 | N-acetylglucosamine 6-O-sulfotransferase activity(GO:0001517) |
| 0.0 | 0.4 | GO:0102338 | fatty acid elongase activity(GO:0009922) 3-oxo-arachidoyl-CoA synthase activity(GO:0102336) 3-oxo-cerotoyl-CoA synthase activity(GO:0102337) 3-oxo-lignoceronyl-CoA synthase activity(GO:0102338) |
| 0.0 | 0.3 | GO:0050682 | AF-2 domain binding(GO:0050682) |
| 0.0 | 1.0 | GO:0042813 | Wnt-activated receptor activity(GO:0042813) |
| 0.0 | 0.1 | GO:0050510 | N-acetylgalactosaminyl-proteoglycan 3-beta-glucuronosyltransferase activity(GO:0050510) |
| 0.0 | 0.4 | GO:0008046 | axon guidance receptor activity(GO:0008046) |
| 0.0 | 0.3 | GO:0051998 | carboxyl-O-methyltransferase activity(GO:0010340) protein carboxyl O-methyltransferase activity(GO:0051998) |
| 0.0 | 0.9 | GO:0070006 | metalloaminopeptidase activity(GO:0070006) |
| 0.0 | 0.6 | GO:0061578 | Lys63-specific deubiquitinase activity(GO:0061578) |
| 0.0 | 0.1 | GO:0050119 | N-acetylglucosamine deacetylase activity(GO:0050119) |
| 0.0 | 0.1 | GO:0003974 | UDP-N-acetylglucosamine 4-epimerase activity(GO:0003974) UDP-glucose 4-epimerase activity(GO:0003978) |
| 0.0 | 0.2 | GO:0004965 | G-protein coupled GABA receptor activity(GO:0004965) |
| 0.0 | 0.2 | GO:0004084 | branched-chain-amino-acid transaminase activity(GO:0004084) L-leucine transaminase activity(GO:0052654) L-valine transaminase activity(GO:0052655) L-isoleucine transaminase activity(GO:0052656) |
| 0.0 | 0.4 | GO:0016015 | morphogen activity(GO:0016015) |
| 0.0 | 0.2 | GO:0004924 | oncostatin-M receptor activity(GO:0004924) |
| 0.0 | 0.4 | GO:0052650 | NADP-retinol dehydrogenase activity(GO:0052650) |
| 0.0 | 1.3 | GO:1990841 | promoter-specific chromatin binding(GO:1990841) |
| 0.0 | 0.2 | GO:0015184 | L-cystine transmembrane transporter activity(GO:0015184) |
| 0.0 | 0.3 | GO:0070740 | tubulin-glutamic acid ligase activity(GO:0070740) |
| 0.0 | 0.2 | GO:0061665 | SUMO ligase activity(GO:0061665) |
| 0.0 | 0.6 | GO:0008349 | MAP kinase kinase kinase kinase activity(GO:0008349) |
| 0.0 | 0.2 | GO:0035251 | UDP-glucosyltransferase activity(GO:0035251) |
| 0.0 | 0.2 | GO:0004571 | mannosyl-oligosaccharide 1,2-alpha-mannosidase activity(GO:0004571) |
| 0.0 | 0.1 | GO:0015319 | sodium:inorganic phosphate symporter activity(GO:0015319) |
| 0.0 | 0.7 | GO:0003756 | protein disulfide isomerase activity(GO:0003756) intramolecular oxidoreductase activity, transposing S-S bonds(GO:0016864) |
| 0.0 | 0.2 | GO:0035252 | UDP-xylosyltransferase activity(GO:0035252) xylosyltransferase activity(GO:0042285) |
| 0.0 | 0.1 | GO:0090541 | MIT domain binding(GO:0090541) |
| 0.0 | 0.5 | GO:0008499 | UDP-galactose:beta-N-acetylglucosamine beta-1,3-galactosyltransferase activity(GO:0008499) |
| 0.0 | 0.1 | GO:0003963 | RNA-3'-phosphate cyclase activity(GO:0003963) |
| 0.0 | 0.1 | GO:0001226 | RNA polymerase II transcription corepressor binding(GO:0001226) |
| 0.0 | 0.7 | GO:0016875 | aminoacyl-tRNA ligase activity(GO:0004812) ligase activity, forming carbon-oxygen bonds(GO:0016875) ligase activity, forming aminoacyl-tRNA and related compounds(GO:0016876) |
| 0.0 | 0.1 | GO:0035673 | oligopeptide transmembrane transporter activity(GO:0035673) |
| 0.0 | 0.3 | GO:0030274 | LIM domain binding(GO:0030274) |
| 0.0 | 0.5 | GO:0015095 | magnesium ion transmembrane transporter activity(GO:0015095) |
| 0.0 | 0.2 | GO:0045545 | syndecan binding(GO:0045545) |
| 0.0 | 0.9 | GO:0051959 | dynein light intermediate chain binding(GO:0051959) |
| 0.0 | 0.1 | GO:0008332 | low voltage-gated calcium channel activity(GO:0008332) |
| 0.0 | 0.3 | GO:0047144 | 2-acylglycerol-3-phosphate O-acyltransferase activity(GO:0047144) |
| 0.0 | 0.3 | GO:0019957 | C-C chemokine binding(GO:0019957) |
| 0.0 | 0.1 | GO:0008384 | IkappaB kinase activity(GO:0008384) |
| 0.0 | 0.2 | GO:0005375 | copper ion transmembrane transporter activity(GO:0005375) |
| 0.0 | 0.7 | GO:0005385 | zinc ion transmembrane transporter activity(GO:0005385) |
| 0.0 | 0.4 | GO:0019789 | SUMO transferase activity(GO:0019789) |
| 0.0 | 0.2 | GO:0089720 | caspase binding(GO:0089720) |
| 0.0 | 0.1 | GO:0051733 | ATP-dependent polydeoxyribonucleotide 5'-hydroxyl-kinase activity(GO:0046404) polydeoxyribonucleotide kinase activity(GO:0051733) ATP-dependent polynucleotide kinase activity(GO:0051734) |
| 0.0 | 0.3 | GO:0015643 | toxic substance binding(GO:0015643) |
| 0.0 | 0.3 | GO:0008517 | folic acid transporter activity(GO:0008517) |
| 0.0 | 0.1 | GO:0086006 | voltage-gated sodium channel activity involved in cardiac muscle cell action potential(GO:0086006) |
| 0.0 | 0.3 | GO:0004653 | polypeptide N-acetylgalactosaminyltransferase activity(GO:0004653) |
| 0.0 | 0.1 | GO:0005332 | gamma-aminobutyric acid:sodium symporter activity(GO:0005332) |
| 0.0 | 0.1 | GO:0003865 | 3-oxo-5-alpha-steroid 4-dehydrogenase activity(GO:0003865) steroid dehydrogenase activity, acting on the CH-CH group of donors(GO:0033765) cholestenone 5-alpha-reductase activity(GO:0047751) |
| 0.0 | 0.4 | GO:0005247 | voltage-gated chloride channel activity(GO:0005247) |
| 0.0 | 0.2 | GO:0070324 | thyroid hormone binding(GO:0070324) |
| 0.0 | 0.1 | GO:0008449 | N-acetylglucosamine-6-sulfatase activity(GO:0008449) |
| 0.0 | 0.1 | GO:0036033 | mediator complex binding(GO:0036033) |
| 0.0 | 0.7 | GO:0031683 | G-protein beta/gamma-subunit complex binding(GO:0031683) |
| 0.0 | 0.6 | GO:0000146 | microfilament motor activity(GO:0000146) |
| 0.0 | 0.2 | GO:0043225 | anion transmembrane-transporting ATPase activity(GO:0043225) |
| 0.0 | 0.3 | GO:0017056 | structural constituent of nuclear pore(GO:0017056) |
| 0.0 | 0.1 | GO:0036312 | phosphatidylinositol 3-kinase regulatory subunit binding(GO:0036312) |
| 0.0 | 0.1 | GO:0004972 | NMDA glutamate receptor activity(GO:0004972) |
| 0.0 | 0.3 | GO:0050998 | nitric-oxide synthase binding(GO:0050998) |
| 0.0 | 0.4 | GO:0005109 | frizzled binding(GO:0005109) |
| 0.0 | 0.1 | GO:0017176 | phosphatidylinositol N-acetylglucosaminyltransferase activity(GO:0017176) |
| 0.0 | 0.2 | GO:0002151 | G-quadruplex RNA binding(GO:0002151) |
Gene overrepresentation in curated gene sets: canonical pathways category:
| Log-likelihood per target | Total log-likelihood | Term | Description |
|---|---|---|---|
| 0.1 | 0.3 | PID P38 ALPHA BETA PATHWAY | Regulation of p38-alpha and p38-beta |
| 0.0 | 0.4 | PID FRA PATHWAY | Validated transcriptional targets of AP1 family members Fra1 and Fra2 |
| 0.0 | 0.8 | PID LPA4 PATHWAY | LPA4-mediated signaling events |
| 0.0 | 0.7 | PID INTEGRIN5 PATHWAY | Beta5 beta6 beta7 and beta8 integrin cell surface interactions |
| 0.0 | 0.9 | PID WNT SIGNALING PATHWAY | Wnt signaling network |
| 0.0 | 0.9 | PID TOLL ENDOGENOUS PATHWAY | Endogenous TLR signaling |
| 0.0 | 0.4 | PID SMAD2 3PATHWAY | Regulation of cytoplasmic and nuclear SMAD2/3 signaling |
| 0.0 | 0.8 | PID ERBB NETWORK PATHWAY | ErbB receptor signaling network |
| 0.0 | 0.4 | PID RANBP2 PATHWAY | Sumoylation by RanBP2 regulates transcriptional repression |
| 0.0 | 0.1 | PID IL2 PI3K PATHWAY | IL2 signaling events mediated by PI3K |
| 0.0 | 0.6 | PID S1P S1P1 PATHWAY | S1P1 pathway |
| 0.0 | 1.2 | PID BMP PATHWAY | BMP receptor signaling |
| 0.0 | 0.7 | PID NFKAPPAB CANONICAL PATHWAY | Canonical NF-kappaB pathway |
| 0.0 | 0.5 | PID ALK1 PATHWAY | ALK1 signaling events |
| 0.0 | 1.6 | WNT SIGNALING | Genes related to Wnt-mediated signal transduction |
| 0.0 | 0.2 | ST IL 13 PATHWAY | Interleukin 13 (IL-13) Pathway |
| 0.0 | 0.5 | PID WNT NONCANONICAL PATHWAY | Noncanonical Wnt signaling pathway |
| 0.0 | 0.5 | PID ATM PATHWAY | ATM pathway |
| 0.0 | 0.6 | ST ERK1 ERK2 MAPK PATHWAY | ERK1/ERK2 MAPK Pathway |
| 0.0 | 1.1 | PID HIF1 TFPATHWAY | HIF-1-alpha transcription factor network |
Gene overrepresentation in curated gene sets: REACTOME pathways category:
| Log-likelihood per target | Total log-likelihood | Term | Description |
|---|---|---|---|
| 0.1 | 0.8 | REACTOME ADENYLATE CYCLASE ACTIVATING PATHWAY | Genes involved in Adenylate cyclase activating pathway |
| 0.0 | 0.7 | REACTOME VITAMIN B5 PANTOTHENATE METABOLISM | Genes involved in Vitamin B5 (pantothenate) metabolism |
| 0.0 | 0.5 | REACTOME ROLE OF SECOND MESSENGERS IN NETRIN1 SIGNALING | Genes involved in Role of second messengers in netrin-1 signaling |
| 0.0 | 0.1 | REACTOME SOS MEDIATED SIGNALLING | Genes involved in SOS-mediated signalling |
| 0.0 | 0.6 | REACTOME REGULATION OF PYRUVATE DEHYDROGENASE PDH COMPLEX | Genes involved in Regulation of pyruvate dehydrogenase (PDH) complex |
| 0.0 | 1.5 | REACTOME SIGNALING BY BMP | Genes involved in Signaling by BMP |
| 0.0 | 0.7 | REACTOME MITOCHONDRIAL TRNA AMINOACYLATION | Genes involved in Mitochondrial tRNA aminoacylation |
| 0.0 | 0.6 | REACTOME ERKS ARE INACTIVATED | Genes involved in ERKs are inactivated |
| 0.0 | 0.5 | REACTOME CALNEXIN CALRETICULIN CYCLE | Genes involved in Calnexin/calreticulin cycle |
| 0.0 | 0.4 | REACTOME E2F ENABLED INHIBITION OF PRE REPLICATION COMPLEX FORMATION | Genes involved in E2F-enabled inhibition of pre-replication complex formation |
| 0.0 | 0.4 | REACTOME REMOVAL OF THE FLAP INTERMEDIATE FROM THE C STRAND | Genes involved in Removal of the Flap Intermediate from the C-strand |
| 0.0 | 1.3 | REACTOME GLUCOSE TRANSPORT | Genes involved in Glucose transport |
| 0.0 | 0.5 | REACTOME HIGHLY CALCIUM PERMEABLE POSTSYNAPTIC NICOTINIC ACETYLCHOLINE RECEPTORS | Genes involved in Highly calcium permeable postsynaptic nicotinic acetylcholine receptors |
| 0.0 | 0.7 | REACTOME METAL ION SLC TRANSPORTERS | Genes involved in Metal ion SLC transporters |
| 0.0 | 0.3 | REACTOME ACTIVATION OF CHAPERONES BY ATF6 ALPHA | Genes involved in Activation of Chaperones by ATF6-alpha |
| 0.0 | 0.8 | REACTOME TIGHT JUNCTION INTERACTIONS | Genes involved in Tight junction interactions |
| 0.0 | 0.3 | REACTOME TGF BETA RECEPTOR SIGNALING IN EMT EPITHELIAL TO MESENCHYMAL TRANSITION | Genes involved in TGF-beta receptor signaling in EMT (epithelial to mesenchymal transition) |
| 0.0 | 0.6 | REACTOME SHC1 EVENTS IN ERBB4 SIGNALING | Genes involved in SHC1 events in ERBB4 signaling |
| 0.0 | 0.4 | REACTOME ACTIVATION OF RAC | Genes involved in Activation of Rac |
| 0.0 | 0.6 | REACTOME REGULATION OF WATER BALANCE BY RENAL AQUAPORINS | Genes involved in Regulation of Water Balance by Renal Aquaporins |
| 0.0 | 0.1 | REACTOME SPRY REGULATION OF FGF SIGNALING | Genes involved in Spry regulation of FGF signaling |
| 0.0 | 0.6 | REACTOME SPHINGOLIPID DE NOVO BIOSYNTHESIS | Genes involved in Sphingolipid de novo biosynthesis |
| 0.0 | 0.4 | REACTOME INTEGRIN CELL SURFACE INTERACTIONS | Genes involved in Integrin cell surface interactions |
| 0.0 | 0.7 | REACTOME NOD1 2 SIGNALING PATHWAY | Genes involved in NOD1/2 Signaling Pathway |
| 0.0 | 0.6 | REACTOME AMINE LIGAND BINDING RECEPTORS | Genes involved in Amine ligand-binding receptors |
| 0.0 | 1.8 | REACTOME CLASS B 2 SECRETIN FAMILY RECEPTORS | Genes involved in Class B/2 (Secretin family receptors) |
| 0.0 | 0.3 | REACTOME ACYL CHAIN REMODELLING OF PG | Genes involved in Acyl chain remodelling of PG |
| 0.0 | 0.4 | REACTOME NA CL DEPENDENT NEUROTRANSMITTER TRANSPORTERS | Genes involved in Na+/Cl- dependent neurotransmitter transporters |
| 0.0 | 0.4 | REACTOME SYNTHESIS OF VERY LONG CHAIN FATTY ACYL COAS | Genes involved in Synthesis of very long-chain fatty acyl-CoAs |
| 0.0 | 0.4 | REACTOME CHONDROITIN SULFATE BIOSYNTHESIS | Genes involved in Chondroitin sulfate biosynthesis |
| 0.0 | 0.2 | REACTOME CD28 DEPENDENT VAV1 PATHWAY | Genes involved in CD28 dependent Vav1 pathway |
| 0.0 | 0.2 | REACTOME TANDEM PORE DOMAIN POTASSIUM CHANNELS | Genes involved in Tandem pore domain potassium channels |
| 0.0 | 0.4 | REACTOME TRANSFERRIN ENDOCYTOSIS AND RECYCLING | Genes involved in Transferrin endocytosis and recycling |