Project
Epithelial-Mesenchymal Transition, human (Scheel, 2011)
Navigation
Downloads
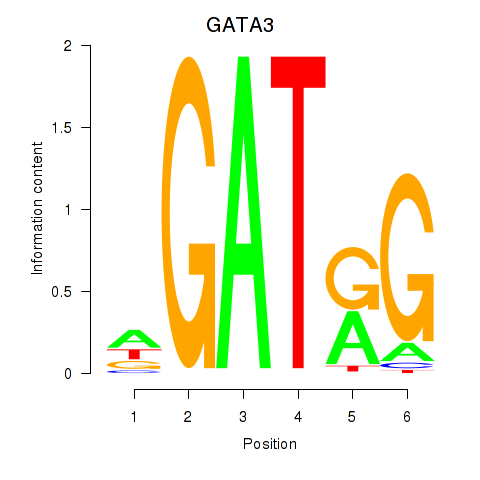
Results for GATA3
Z-value: 1.49
Motif logo
Transcription factors associated with GATA3
| Gene Symbol | Gene ID | Gene Info |
|---|---|---|
|
GATA3
|
ENSG00000107485.18 | GATA binding protein 3 |
Activity-expression correlation:
| Gene | Promoter | Pearson corr. coef. | P-value | Plot |
|---|---|---|---|---|
| GATA3 | hg38_v1_chr10_+_8054668_8054697 | 0.68 | 6.6e-02 | Click! |
Activity profile of GATA3 motif
Sorted Z-values of GATA3 motif
Network of associatons between targets according to the STRING database.

First level regulatory network of GATA3
Gene Ontology Analysis
Gene overrepresentation in biological process category:
| Log-likelihood per target | Total log-likelihood | Term | Description |
|---|---|---|---|
| 0.5 | 1.5 | GO:0044537 | regulation of circulating fibrinogen levels(GO:0044537) |
| 0.3 | 1.1 | GO:0090290 | positive regulation of osteoclast proliferation(GO:0090290) |
| 0.3 | 0.5 | GO:0048677 | axon extension involved in regeneration(GO:0048677) sprouting of injured axon(GO:0048682) |
| 0.3 | 1.0 | GO:2000314 | regulation of neural crest formation(GO:0090299) negative regulation of neural crest formation(GO:0090301) negative regulation of fibroblast growth factor receptor signaling pathway involved in neural plate anterior/posterior pattern formation(GO:2000314) |
| 0.3 | 1.5 | GO:0051585 | negative regulation of dopamine uptake involved in synaptic transmission(GO:0051585) norepinephrine uptake(GO:0051620) regulation of norepinephrine uptake(GO:0051621) negative regulation of norepinephrine uptake(GO:0051622) negative regulation of catecholamine uptake involved in synaptic transmission(GO:0051945) regulation of glutathione peroxidase activity(GO:1903282) positive regulation of glutathione peroxidase activity(GO:1903284) positive regulation of hydrogen peroxide catabolic process(GO:1903285) positive regulation of peroxidase activity(GO:2000470) |
| 0.2 | 0.8 | GO:0099558 | maintenance of synapse structure(GO:0099558) |
| 0.2 | 1.0 | GO:0035803 | egg coat formation(GO:0035803) |
| 0.2 | 0.5 | GO:0051097 | negative regulation of helicase activity(GO:0051097) |
| 0.2 | 1.0 | GO:0032487 | regulation of Rap protein signal transduction(GO:0032487) |
| 0.2 | 0.5 | GO:0014876 | response to injury involved in regulation of muscle adaptation(GO:0014876) |
| 0.2 | 0.5 | GO:0072276 | metanephric glomerulus morphogenesis(GO:0072275) metanephric glomerulus vasculature morphogenesis(GO:0072276) metanephric glomerular capillary formation(GO:0072277) |
| 0.2 | 0.6 | GO:0071418 | cellular response to amine stimulus(GO:0071418) |
| 0.2 | 0.5 | GO:0086097 | phospholipase C-activating angiotensin-activated signaling pathway(GO:0086097) |
| 0.2 | 1.6 | GO:0032020 | ISG15-protein conjugation(GO:0032020) |
| 0.2 | 0.5 | GO:0032304 | negative regulation of icosanoid secretion(GO:0032304) |
| 0.2 | 0.6 | GO:0036060 | filtration diaphragm assembly(GO:0036058) slit diaphragm assembly(GO:0036060) |
| 0.1 | 2.5 | GO:1900747 | negative regulation of vascular endothelial growth factor signaling pathway(GO:1900747) |
| 0.1 | 0.9 | GO:0021966 | corticospinal neuron axon guidance(GO:0021966) |
| 0.1 | 0.3 | GO:0003330 | regulation of extracellular matrix constituent secretion(GO:0003330) positive regulation of extracellular matrix constituent secretion(GO:0003331) |
| 0.1 | 0.4 | GO:0051695 | actin filament uncapping(GO:0051695) |
| 0.1 | 0.4 | GO:2000642 | negative regulation of early endosome to late endosome transport(GO:2000642) |
| 0.1 | 0.4 | GO:2000661 | positive regulation of interleukin-1-mediated signaling pathway(GO:2000661) |
| 0.1 | 1.2 | GO:0089700 | protein kinase D signaling(GO:0089700) |
| 0.1 | 0.7 | GO:0097211 | response to gonadotropin-releasing hormone(GO:0097210) cellular response to gonadotropin-releasing hormone(GO:0097211) |
| 0.1 | 0.5 | GO:0045658 | regulation of neutrophil differentiation(GO:0045658) negative regulation of neutrophil differentiation(GO:0045659) |
| 0.1 | 0.4 | GO:0021524 | visceral motor neuron differentiation(GO:0021524) |
| 0.1 | 0.4 | GO:0016185 | synaptic vesicle budding from presynaptic endocytic zone membrane(GO:0016185) |
| 0.1 | 0.4 | GO:0060392 | negative regulation of SMAD protein import into nucleus(GO:0060392) |
| 0.1 | 0.4 | GO:0042412 | taurine biosynthetic process(GO:0042412) |
| 0.1 | 1.2 | GO:0048680 | positive regulation of axon regeneration(GO:0048680) |
| 0.1 | 0.7 | GO:1903464 | negative regulation of mitotic cell cycle DNA replication(GO:1903464) |
| 0.1 | 0.7 | GO:0070171 | negative regulation of tooth mineralization(GO:0070171) |
| 0.1 | 0.4 | GO:0015847 | putrescine transport(GO:0015847) |
| 0.1 | 0.5 | GO:0060940 | epithelial to mesenchymal transition involved in cardiac fibroblast development(GO:0060940) |
| 0.1 | 0.7 | GO:2000405 | negative regulation of T cell migration(GO:2000405) |
| 0.1 | 0.2 | GO:0046110 | xanthine metabolic process(GO:0046110) |
| 0.1 | 0.3 | GO:0002906 | mature B cell apoptotic process(GO:0002901) regulation of mature B cell apoptotic process(GO:0002905) negative regulation of mature B cell apoptotic process(GO:0002906) |
| 0.1 | 1.8 | GO:0007021 | tubulin complex assembly(GO:0007021) |
| 0.1 | 0.4 | GO:0051410 | detoxification of nitrogen compound(GO:0051410) cellular detoxification of nitrogen compound(GO:0070458) |
| 0.1 | 0.6 | GO:1901906 | diadenosine polyphosphate catabolic process(GO:0015961) diphosphoinositol polyphosphate metabolic process(GO:0071543) diadenosine pentaphosphate metabolic process(GO:1901906) diadenosine pentaphosphate catabolic process(GO:1901907) diadenosine hexaphosphate metabolic process(GO:1901908) diadenosine hexaphosphate catabolic process(GO:1901909) adenosine 5'-(hexahydrogen pentaphosphate) metabolic process(GO:1901910) adenosine 5'-(hexahydrogen pentaphosphate) catabolic process(GO:1901911) |
| 0.1 | 0.3 | GO:0042418 | epinephrine biosynthetic process(GO:0042418) |
| 0.1 | 0.7 | GO:0030309 | poly-N-acetyllactosamine metabolic process(GO:0030309) |
| 0.1 | 0.1 | GO:0044335 | canonical Wnt signaling pathway involved in neural crest cell differentiation(GO:0044335) |
| 0.1 | 0.6 | GO:0015680 | intracellular copper ion transport(GO:0015680) |
| 0.1 | 0.5 | GO:0003219 | cardiac right ventricle formation(GO:0003219) |
| 0.1 | 0.3 | GO:0072709 | cellular response to sorbitol(GO:0072709) |
| 0.1 | 0.4 | GO:0010900 | negative regulation of phosphatidylcholine catabolic process(GO:0010900) |
| 0.1 | 1.7 | GO:1901748 | leukotriene D4 metabolic process(GO:1901748) leukotriene D4 biosynthetic process(GO:1901750) |
| 0.1 | 0.4 | GO:0018106 | peptidyl-histidine phosphorylation(GO:0018106) |
| 0.1 | 0.5 | GO:0008626 | granzyme-mediated apoptotic signaling pathway(GO:0008626) |
| 0.1 | 0.5 | GO:0051414 | response to cortisol(GO:0051414) |
| 0.1 | 0.4 | GO:0010701 | positive regulation of norepinephrine secretion(GO:0010701) |
| 0.1 | 0.3 | GO:0050760 | negative regulation of thymidylate synthase biosynthetic process(GO:0050760) |
| 0.1 | 0.4 | GO:1902998 | macrophage proliferation(GO:0061517) microglial cell proliferation(GO:0061518) regulation of neuronal signal transduction(GO:1902847) positive regulation of neurofibrillary tangle assembly(GO:1902998) |
| 0.1 | 0.5 | GO:0018343 | protein farnesylation(GO:0018343) |
| 0.1 | 0.3 | GO:1904383 | response to sodium phosphate(GO:1904383) |
| 0.1 | 0.3 | GO:2000439 | positive regulation of monocyte extravasation(GO:2000439) |
| 0.1 | 0.3 | GO:0019520 | aldonic acid metabolic process(GO:0019520) D-gluconate metabolic process(GO:0019521) |
| 0.1 | 0.1 | GO:1903006 | regulation of protein K63-linked deubiquitination(GO:1903004) positive regulation of protein K63-linked deubiquitination(GO:1903006) |
| 0.1 | 0.3 | GO:0072299 | visceral serous pericardium development(GO:0061032) negative regulation of metanephric glomerulus development(GO:0072299) negative regulation of metanephric glomerular mesangial cell proliferation(GO:0072302) |
| 0.1 | 0.3 | GO:0002018 | renin-angiotensin regulation of aldosterone production(GO:0002018) |
| 0.1 | 0.1 | GO:0061438 | renal system vasculature morphogenesis(GO:0061438) kidney vasculature morphogenesis(GO:0061439) |
| 0.1 | 0.2 | GO:1903722 | regulation of centriole elongation(GO:1903722) |
| 0.1 | 0.2 | GO:0014846 | esophagus smooth muscle contraction(GO:0014846) |
| 0.1 | 0.7 | GO:0006526 | arginine biosynthetic process(GO:0006526) |
| 0.1 | 0.8 | GO:0010756 | positive regulation of plasminogen activation(GO:0010756) |
| 0.1 | 0.7 | GO:0070236 | negative regulation of activation-induced cell death of T cells(GO:0070236) |
| 0.1 | 1.1 | GO:0030854 | positive regulation of granulocyte differentiation(GO:0030854) |
| 0.1 | 0.3 | GO:0005986 | sucrose biosynthetic process(GO:0005986) |
| 0.1 | 0.9 | GO:0048251 | elastic fiber assembly(GO:0048251) |
| 0.1 | 0.5 | GO:0071896 | protein localization to adherens junction(GO:0071896) |
| 0.1 | 0.2 | GO:1905053 | regulation of base-excision repair(GO:1905051) positive regulation of base-excision repair(GO:1905053) |
| 0.1 | 0.4 | GO:0010040 | response to iron(II) ion(GO:0010040) |
| 0.1 | 0.4 | GO:0060748 | tertiary branching involved in mammary gland duct morphogenesis(GO:0060748) |
| 0.1 | 1.7 | GO:0097151 | positive regulation of inhibitory postsynaptic potential(GO:0097151) modulation of inhibitory postsynaptic potential(GO:0098828) |
| 0.1 | 0.2 | GO:0002588 | positive regulation of antigen processing and presentation of peptide or polysaccharide antigen via MHC class II(GO:0002582) positive regulation of antigen processing and presentation of peptide antigen(GO:0002585) positive regulation of antigen processing and presentation of peptide antigen via MHC class II(GO:0002588) |
| 0.1 | 0.2 | GO:0003064 | regulation of heart rate by hormone(GO:0003064) |
| 0.1 | 0.1 | GO:0032764 | negative regulation of mast cell cytokine production(GO:0032764) |
| 0.1 | 0.2 | GO:0016488 | sesquiterpenoid metabolic process(GO:0006714) sesquiterpenoid catabolic process(GO:0016107) farnesol metabolic process(GO:0016487) farnesol catabolic process(GO:0016488) |
| 0.1 | 0.6 | GO:0001661 | conditioned taste aversion(GO:0001661) |
| 0.1 | 0.7 | GO:0097647 | calcitonin family receptor signaling pathway(GO:0097646) amylin receptor signaling pathway(GO:0097647) |
| 0.1 | 0.2 | GO:0001868 | regulation of complement activation, lectin pathway(GO:0001868) negative regulation of complement activation, lectin pathway(GO:0001869) |
| 0.1 | 0.3 | GO:0034085 | establishment of sister chromatid cohesion(GO:0034085) cohesin loading(GO:0071921) regulation of cohesin loading(GO:0071922) |
| 0.1 | 0.2 | GO:1902109 | negative regulation of mitochondrial membrane permeability involved in apoptotic process(GO:1902109) |
| 0.1 | 0.4 | GO:0071279 | cellular response to cobalt ion(GO:0071279) |
| 0.1 | 0.2 | GO:0031959 | mineralocorticoid receptor signaling pathway(GO:0031959) |
| 0.1 | 0.2 | GO:1903031 | regulation of microtubule plus-end binding(GO:1903031) positive regulation of microtubule plus-end binding(GO:1903033) |
| 0.1 | 0.2 | GO:0060266 | negative regulation of respiratory burst involved in inflammatory response(GO:0060266) |
| 0.1 | 0.4 | GO:0070086 | ubiquitin-dependent endocytosis(GO:0070086) |
| 0.1 | 0.2 | GO:0033385 | geranylgeranyl diphosphate metabolic process(GO:0033385) geranylgeranyl diphosphate biosynthetic process(GO:0033386) |
| 0.1 | 0.3 | GO:0006210 | pyrimidine nucleobase catabolic process(GO:0006208) thymine catabolic process(GO:0006210) thymine metabolic process(GO:0019859) |
| 0.1 | 0.4 | GO:2000490 | negative regulation of hepatic stellate cell activation(GO:2000490) |
| 0.1 | 0.2 | GO:0008628 | hormone-mediated apoptotic signaling pathway(GO:0008628) |
| 0.1 | 0.2 | GO:0045553 | TRAIL biosynthetic process(GO:0045553) regulation of TRAIL biosynthetic process(GO:0045554) positive regulation of TRAIL biosynthetic process(GO:0045556) |
| 0.1 | 0.7 | GO:0090204 | protein localization to nuclear pore(GO:0090204) |
| 0.1 | 0.2 | GO:0072308 | negative regulation by virus of viral protein levels in host cell(GO:0046725) negative regulation of metanephric nephron tubule epithelial cell differentiation(GO:0072308) |
| 0.1 | 0.4 | GO:0043932 | ossification involved in bone remodeling(GO:0043932) |
| 0.1 | 0.4 | GO:0035694 | mitochondrial protein catabolic process(GO:0035694) |
| 0.1 | 0.3 | GO:0019075 | virus maturation(GO:0019075) |
| 0.1 | 0.4 | GO:0010966 | regulation of phosphate transport(GO:0010966) |
| 0.1 | 0.3 | GO:0046013 | regulation of T cell homeostatic proliferation(GO:0046013) |
| 0.1 | 1.2 | GO:0048681 | negative regulation of axon regeneration(GO:0048681) |
| 0.1 | 0.2 | GO:0002728 | negative regulation of natural killer cell cytokine production(GO:0002728) |
| 0.1 | 0.2 | GO:2000502 | negative regulation of natural killer cell chemotaxis(GO:2000502) |
| 0.1 | 0.7 | GO:1903943 | regulation of hepatocyte apoptotic process(GO:1903943) negative regulation of hepatocyte apoptotic process(GO:1903944) |
| 0.1 | 0.2 | GO:0002879 | positive regulation of acute inflammatory response to non-antigenic stimulus(GO:0002879) |
| 0.1 | 0.2 | GO:0002032 | desensitization of G-protein coupled receptor protein signaling pathway by arrestin(GO:0002032) |
| 0.1 | 0.2 | GO:1903225 | negative regulation of endodermal cell differentiation(GO:1903225) |
| 0.1 | 0.2 | GO:0097156 | fasciculation of motor neuron axon(GO:0097156) |
| 0.1 | 0.1 | GO:0019364 | NADP catabolic process(GO:0006742) pyridine nucleotide catabolic process(GO:0019364) |
| 0.1 | 1.0 | GO:2000480 | negative regulation of cAMP-dependent protein kinase activity(GO:2000480) |
| 0.1 | 0.4 | GO:0035934 | corticosterone secretion(GO:0035934) |
| 0.1 | 2.0 | GO:0042994 | cytoplasmic sequestering of transcription factor(GO:0042994) |
| 0.1 | 0.7 | GO:0070050 | neuron cellular homeostasis(GO:0070050) |
| 0.1 | 0.5 | GO:0097577 | intracellular sequestering of iron ion(GO:0006880) sequestering of iron ion(GO:0097577) |
| 0.1 | 0.1 | GO:0044333 | Wnt signaling pathway involved in digestive tract morphogenesis(GO:0044333) |
| 0.1 | 0.2 | GO:1904428 | negative regulation of tubulin deacetylation(GO:1904428) |
| 0.1 | 0.1 | GO:0070885 | negative regulation of calcineurin-NFAT signaling cascade(GO:0070885) |
| 0.1 | 0.2 | GO:0042819 | pyridoxine metabolic process(GO:0008614) pyridoxine biosynthetic process(GO:0008615) vitamin B6 biosynthetic process(GO:0042819) |
| 0.1 | 0.1 | GO:1903378 | positive regulation of oxidative stress-induced neuron intrinsic apoptotic signaling pathway(GO:1903378) |
| 0.1 | 0.2 | GO:0036111 | very long-chain fatty-acyl-CoA metabolic process(GO:0036111) |
| 0.1 | 0.8 | GO:0060155 | platelet dense granule organization(GO:0060155) |
| 0.1 | 0.6 | GO:0032510 | endosome to lysosome transport via multivesicular body sorting pathway(GO:0032510) |
| 0.1 | 0.2 | GO:1903778 | protein localization to vacuolar membrane(GO:1903778) |
| 0.1 | 0.2 | GO:0071931 | positive regulation of transcription involved in G1/S transition of mitotic cell cycle(GO:0071931) |
| 0.1 | 0.2 | GO:0090675 | intermicrovillar adhesion(GO:0090675) |
| 0.1 | 0.7 | GO:0035845 | photoreceptor cell outer segment organization(GO:0035845) |
| 0.1 | 0.3 | GO:0007406 | negative regulation of neuroblast proliferation(GO:0007406) |
| 0.1 | 0.2 | GO:0071603 | endothelial cell-cell adhesion(GO:0071603) |
| 0.1 | 0.1 | GO:0018916 | nitrobenzene metabolic process(GO:0018916) |
| 0.1 | 0.1 | GO:2000619 | negative regulation of histone H4-K16 acetylation(GO:2000619) |
| 0.1 | 0.1 | GO:0070235 | regulation of activation-induced cell death of T cells(GO:0070235) |
| 0.1 | 0.3 | GO:0001554 | luteolysis(GO:0001554) |
| 0.1 | 0.3 | GO:2000601 | positive regulation of Arp2/3 complex-mediated actin nucleation(GO:2000601) |
| 0.1 | 0.1 | GO:1902617 | response to fluoride(GO:1902617) |
| 0.1 | 0.6 | GO:0034058 | endosomal vesicle fusion(GO:0034058) |
| 0.1 | 0.3 | GO:0002318 | myeloid progenitor cell differentiation(GO:0002318) |
| 0.1 | 0.3 | GO:0043652 | engulfment of apoptotic cell(GO:0043652) |
| 0.1 | 0.3 | GO:0051643 | endoplasmic reticulum localization(GO:0051643) |
| 0.1 | 0.3 | GO:0052564 | response to immune response of other organism involved in symbiotic interaction(GO:0052564) response to host immune response(GO:0052572) |
| 0.1 | 0.4 | GO:0002118 | aggressive behavior(GO:0002118) |
| 0.1 | 0.1 | GO:0050757 | thymidylate synthase biosynthetic process(GO:0050757) regulation of thymidylate synthase biosynthetic process(GO:0050758) |
| 0.1 | 0.3 | GO:0016480 | negative regulation of transcription from RNA polymerase III promoter(GO:0016480) |
| 0.1 | 0.3 | GO:0000720 | pyrimidine dimer repair by nucleotide-excision repair(GO:0000720) |
| 0.1 | 0.2 | GO:0045082 | positive regulation of interleukin-10 biosynthetic process(GO:0045082) |
| 0.1 | 0.6 | GO:0051344 | negative regulation of cyclic-nucleotide phosphodiesterase activity(GO:0051344) |
| 0.1 | 0.3 | GO:0042853 | L-alanine metabolic process(GO:0042851) L-alanine catabolic process(GO:0042853) |
| 0.0 | 1.3 | GO:0071447 | cellular response to hydroperoxide(GO:0071447) |
| 0.0 | 0.5 | GO:0006995 | cellular response to nitrogen starvation(GO:0006995) cellular response to nitrogen levels(GO:0043562) |
| 0.0 | 0.1 | GO:0098881 | exocytic insertion of neurotransmitter receptor to plasma membrane(GO:0098881) exocytic insertion of neurotransmitter receptor to postsynaptic membrane(GO:0098967) |
| 0.0 | 0.1 | GO:0061182 | negative regulation of chondrocyte development(GO:0061182) |
| 0.0 | 0.1 | GO:1901253 | negative regulation of intracellular transport of viral material(GO:1901253) |
| 0.0 | 0.4 | GO:0010459 | negative regulation of heart rate(GO:0010459) |
| 0.0 | 0.1 | GO:0003363 | lamellipodium assembly involved in ameboidal cell migration(GO:0003363) |
| 0.0 | 0.3 | GO:0072180 | mesonephric duct morphogenesis(GO:0072180) |
| 0.0 | 0.1 | GO:1903348 | positive regulation of bicellular tight junction assembly(GO:1903348) |
| 0.0 | 0.2 | GO:0007412 | axon target recognition(GO:0007412) |
| 0.0 | 0.1 | GO:0051232 | meiotic spindle elongation(GO:0051232) meiotic cell cycle process involved in oocyte maturation(GO:1903537) regulation of meiotic cell cycle process involved in oocyte maturation(GO:1903538) |
| 0.0 | 0.1 | GO:0042631 | cellular response to water deprivation(GO:0042631) |
| 0.0 | 0.8 | GO:0006069 | ethanol oxidation(GO:0006069) |
| 0.0 | 0.3 | GO:0071460 | cellular response to cell-matrix adhesion(GO:0071460) |
| 0.0 | 0.5 | GO:0071492 | cellular response to UV-A(GO:0071492) |
| 0.0 | 0.1 | GO:0036515 | serotonergic neuron axon guidance(GO:0036515) |
| 0.0 | 0.7 | GO:0046951 | ketone body biosynthetic process(GO:0046951) |
| 0.0 | 0.6 | GO:0044351 | macropinocytosis(GO:0044351) |
| 0.0 | 0.2 | GO:0051970 | negative regulation of transmission of nerve impulse(GO:0051970) |
| 0.0 | 1.1 | GO:0033141 | positive regulation of peptidyl-serine phosphorylation of STAT protein(GO:0033141) |
| 0.0 | 0.2 | GO:0033058 | directional locomotion(GO:0033058) |
| 0.0 | 0.3 | GO:0044034 | negative stranded viral RNA replication(GO:0039689) multi-organism biosynthetic process(GO:0044034) |
| 0.0 | 0.4 | GO:0035865 | cellular response to potassium ion(GO:0035865) |
| 0.0 | 0.5 | GO:0016081 | synaptic vesicle docking(GO:0016081) |
| 0.0 | 0.2 | GO:0007468 | regulation of rhodopsin gene expression(GO:0007468) positive regulation of rhodopsin gene expression(GO:0045872) |
| 0.0 | 0.6 | GO:0032782 | bile acid secretion(GO:0032782) |
| 0.0 | 0.2 | GO:0035106 | operant conditioning(GO:0035106) |
| 0.0 | 0.3 | GO:0019049 | evasion or tolerance of host defenses by virus(GO:0019049) avoidance of host defenses(GO:0044413) evasion or tolerance of host defenses(GO:0044415) avoidance of defenses of other organism involved in symbiotic interaction(GO:0051832) evasion or tolerance of defenses of other organism involved in symbiotic interaction(GO:0051834) negative regulation of lung blood pressure(GO:0061767) |
| 0.0 | 0.5 | GO:0010724 | regulation of definitive erythrocyte differentiation(GO:0010724) |
| 0.0 | 0.6 | GO:0001867 | complement activation, lectin pathway(GO:0001867) |
| 0.0 | 0.3 | GO:0019323 | pentose catabolic process(GO:0019323) |
| 0.0 | 0.1 | GO:0086047 | membrane depolarization during Purkinje myocyte cell action potential(GO:0086047) |
| 0.0 | 0.3 | GO:0002278 | eosinophil activation involved in immune response(GO:0002278) eosinophil mediated immunity(GO:0002447) eosinophil degranulation(GO:0043308) |
| 0.0 | 0.1 | GO:0044691 | tooth eruption(GO:0044691) |
| 0.0 | 0.6 | GO:0048227 | plasma membrane to endosome transport(GO:0048227) |
| 0.0 | 0.2 | GO:0090131 | mesenchyme migration(GO:0090131) |
| 0.0 | 0.1 | GO:1903984 | regulation of transcription from RNA polymerase II promoter in response to arsenic-containing substance(GO:0061394) positive regulation of TRAIL-activated apoptotic signaling pathway(GO:1903984) |
| 0.0 | 0.4 | GO:1903237 | negative regulation of leukocyte tethering or rolling(GO:1903237) |
| 0.0 | 0.2 | GO:0007206 | phospholipase C-activating G-protein coupled glutamate receptor signaling pathway(GO:0007206) |
| 0.0 | 0.1 | GO:0006566 | threonine metabolic process(GO:0006566) |
| 0.0 | 0.0 | GO:1903526 | negative regulation of membrane tubulation(GO:1903526) |
| 0.0 | 0.1 | GO:0034402 | recruitment of 3'-end processing factors to RNA polymerase II holoenzyme complex(GO:0034402) |
| 0.0 | 0.4 | GO:2001300 | lipoxin metabolic process(GO:2001300) |
| 0.0 | 0.4 | GO:0014826 | vein smooth muscle contraction(GO:0014826) |
| 0.0 | 0.1 | GO:0006174 | dADP phosphorylation(GO:0006174) dGDP phosphorylation(GO:0006186) AMP phosphorylation(GO:0006756) CDP phosphorylation(GO:0061508) dAMP phosphorylation(GO:0061565) CMP phosphorylation(GO:0061566) dCMP phosphorylation(GO:0061567) GDP phosphorylation(GO:0061568) UDP phosphorylation(GO:0061569) dCDP phosphorylation(GO:0061570) TDP phosphorylation(GO:0061571) |
| 0.0 | 0.2 | GO:0018094 | protein polyglycylation(GO:0018094) |
| 0.0 | 0.3 | GO:0045054 | constitutive secretory pathway(GO:0045054) |
| 0.0 | 0.0 | GO:0018879 | biphenyl metabolic process(GO:0018879) |
| 0.0 | 0.8 | GO:0042759 | long-chain fatty acid biosynthetic process(GO:0042759) |
| 0.0 | 0.9 | GO:2001275 | positive regulation of glucose import in response to insulin stimulus(GO:2001275) |
| 0.0 | 0.3 | GO:0048739 | cardiac muscle fiber development(GO:0048739) |
| 0.0 | 0.3 | GO:0006290 | pyrimidine dimer repair(GO:0006290) |
| 0.0 | 0.3 | GO:0007506 | gonadal mesoderm development(GO:0007506) |
| 0.0 | 0.1 | GO:0019853 | L-ascorbic acid biosynthetic process(GO:0019853) |
| 0.0 | 0.2 | GO:2000002 | negative regulation of DNA damage checkpoint(GO:2000002) |
| 0.0 | 0.7 | GO:0001574 | ganglioside biosynthetic process(GO:0001574) |
| 0.0 | 0.2 | GO:0006933 | negative regulation of cell adhesion involved in substrate-bound cell migration(GO:0006933) |
| 0.0 | 0.2 | GO:0033594 | response to hydroxyisoflavone(GO:0033594) |
| 0.0 | 0.2 | GO:0060316 | positive regulation of ryanodine-sensitive calcium-release channel activity(GO:0060316) |
| 0.0 | 0.4 | GO:0003096 | renal sodium ion transport(GO:0003096) renal sodium ion absorption(GO:0070294) |
| 0.0 | 0.0 | GO:1902957 | negative regulation of mitochondrial electron transport, NADH to ubiquinone(GO:1902957) |
| 0.0 | 0.2 | GO:0045204 | MAPK export from nucleus(GO:0045204) |
| 0.0 | 0.1 | GO:1904582 | regulation of intracellular mRNA localization(GO:1904580) positive regulation of intracellular mRNA localization(GO:1904582) |
| 0.0 | 0.2 | GO:0010734 | protein glutathionylation(GO:0010731) regulation of protein glutathionylation(GO:0010732) negative regulation of protein glutathionylation(GO:0010734) |
| 0.0 | 0.6 | GO:0021694 | cerebellar Purkinje cell layer formation(GO:0021694) cerebellar Purkinje cell differentiation(GO:0021702) |
| 0.0 | 0.2 | GO:1902445 | regulation of mitochondrial membrane permeability involved in programmed necrotic cell death(GO:1902445) |
| 0.0 | 0.2 | GO:0016240 | autophagosome docking(GO:0016240) |
| 0.0 | 0.1 | GO:0071657 | mesangial cell-matrix adhesion(GO:0035759) positive regulation of granulocyte colony-stimulating factor production(GO:0071657) positive regulation of macrophage colony-stimulating factor production(GO:1901258) |
| 0.0 | 0.2 | GO:0046882 | negative regulation of follicle-stimulating hormone secretion(GO:0046882) |
| 0.0 | 0.1 | GO:0099590 | neurotransmitter receptor internalization(GO:0099590) |
| 0.0 | 0.2 | GO:0000454 | snoRNA guided rRNA pseudouridine synthesis(GO:0000454) |
| 0.0 | 0.2 | GO:0032962 | positive regulation of inositol trisphosphate biosynthetic process(GO:0032962) |
| 0.0 | 0.8 | GO:0033617 | mitochondrial respiratory chain complex IV assembly(GO:0033617) |
| 0.0 | 0.8 | GO:1901687 | glutathione derivative metabolic process(GO:1901685) glutathione derivative biosynthetic process(GO:1901687) |
| 0.0 | 0.1 | GO:1901491 | negative regulation of lymphangiogenesis(GO:1901491) |
| 0.0 | 0.1 | GO:0042357 | thiamine diphosphate metabolic process(GO:0042357) |
| 0.0 | 1.4 | GO:0061049 | physiological muscle hypertrophy(GO:0003298) physiological cardiac muscle hypertrophy(GO:0003301) cell growth involved in cardiac muscle cell development(GO:0061049) |
| 0.0 | 0.0 | GO:0035483 | gastric motility(GO:0035482) gastric emptying(GO:0035483) |
| 0.0 | 0.2 | GO:0007571 | age-dependent response to oxidative stress(GO:0001306) age-dependent response to reactive oxygen species(GO:0001315) regulation of systemic arterial blood pressure by acetylcholine(GO:0003068) vasodilation by acetylcholine involved in regulation of systemic arterial blood pressure(GO:0003069) regulation of systemic arterial blood pressure by neurotransmitter(GO:0003070) age-dependent general metabolic decline(GO:0007571) |
| 0.0 | 0.0 | GO:0072262 | metanephric glomerular mesangial cell proliferation involved in metanephros development(GO:0072262) regulation of metanephric glomerular mesangial cell proliferation(GO:0072301) |
| 0.0 | 0.2 | GO:1904970 | brush border assembly(GO:1904970) |
| 0.0 | 0.2 | GO:0033306 | phytol metabolic process(GO:0033306) fatty alcohol metabolic process(GO:1903173) |
| 0.0 | 2.2 | GO:0000413 | protein peptidyl-prolyl isomerization(GO:0000413) |
| 0.0 | 1.2 | GO:0022400 | regulation of rhodopsin mediated signaling pathway(GO:0022400) |
| 0.0 | 0.1 | GO:0035928 | rRNA import into mitochondrion(GO:0035928) |
| 0.0 | 0.2 | GO:0097498 | endothelial tube lumen extension(GO:0097498) |
| 0.0 | 0.1 | GO:0010621 | negative regulation of transcription by transcription factor localization(GO:0010621) |
| 0.0 | 0.1 | GO:1903568 | negative regulation of protein localization to cilium(GO:1903565) regulation of protein localization to ciliary membrane(GO:1903567) negative regulation of protein localization to ciliary membrane(GO:1903568) |
| 0.0 | 0.3 | GO:0034393 | positive regulation of smooth muscle cell apoptotic process(GO:0034393) |
| 0.0 | 0.2 | GO:0060335 | positive regulation of response to interferon-gamma(GO:0060332) positive regulation of interferon-gamma-mediated signaling pathway(GO:0060335) |
| 0.0 | 0.0 | GO:0036023 | limb joint morphogenesis(GO:0036022) embryonic skeletal limb joint morphogenesis(GO:0036023) |
| 0.0 | 0.3 | GO:0006651 | diacylglycerol biosynthetic process(GO:0006651) |
| 0.0 | 0.1 | GO:0000961 | negative regulation of mitochondrial RNA catabolic process(GO:0000961) |
| 0.0 | 0.2 | GO:0061370 | testosterone biosynthetic process(GO:0061370) |
| 0.0 | 0.1 | GO:0006982 | response to lipid hydroperoxide(GO:0006982) |
| 0.0 | 0.1 | GO:0042732 | D-xylose metabolic process(GO:0042732) |
| 0.0 | 0.3 | GO:0072513 | positive regulation of secondary heart field cardioblast proliferation(GO:0072513) |
| 0.0 | 0.0 | GO:0003150 | muscular septum morphogenesis(GO:0003150) |
| 0.0 | 0.2 | GO:0033353 | S-adenosylmethionine cycle(GO:0033353) |
| 0.0 | 0.2 | GO:0043418 | homocysteine catabolic process(GO:0043418) |
| 0.0 | 0.1 | GO:2001287 | negative regulation of caveolin-mediated endocytosis(GO:2001287) |
| 0.0 | 0.2 | GO:0044339 | canonical Wnt signaling pathway involved in osteoblast differentiation(GO:0044339) |
| 0.0 | 0.4 | GO:2001214 | positive regulation of vasculogenesis(GO:2001214) |
| 0.0 | 0.1 | GO:0042427 | serotonin biosynthetic process(GO:0042427) |
| 0.0 | 0.1 | GO:0038033 | positive regulation of endothelial cell chemotaxis by VEGF-activated vascular endothelial growth factor receptor signaling pathway(GO:0038033) |
| 0.0 | 0.5 | GO:0043983 | histone H4-K12 acetylation(GO:0043983) |
| 0.0 | 0.5 | GO:0045919 | positive regulation of cytolysis(GO:0045919) |
| 0.0 | 0.6 | GO:0045116 | protein neddylation(GO:0045116) |
| 0.0 | 0.2 | GO:1901857 | positive regulation of cellular respiration(GO:1901857) |
| 0.0 | 0.1 | GO:1990166 | protein localization to site of double-strand break(GO:1990166) |
| 0.0 | 0.1 | GO:0080184 | response to phenylpropanoid(GO:0080184) |
| 0.0 | 0.1 | GO:0002326 | B cell lineage commitment(GO:0002326) |
| 0.0 | 0.1 | GO:1902268 | negative regulation of polyamine transmembrane transport(GO:1902268) |
| 0.0 | 0.1 | GO:0097089 | methyl-branched fatty acid metabolic process(GO:0097089) |
| 0.0 | 0.3 | GO:0051388 | positive regulation of neurotrophin TRK receptor signaling pathway(GO:0051388) |
| 0.0 | 0.1 | GO:0003342 | atrioventricular node development(GO:0003162) right ventricular cardiac muscle tissue morphogenesis(GO:0003221) proepicardium development(GO:0003342) septum transversum development(GO:0003343) |
| 0.0 | 0.3 | GO:0071798 | response to prostaglandin D(GO:0071798) cellular response to prostaglandin D stimulus(GO:0071799) |
| 0.0 | 1.0 | GO:0006700 | C21-steroid hormone biosynthetic process(GO:0006700) |
| 0.0 | 0.2 | GO:0090118 | receptor-mediated endocytosis of low-density lipoprotein particle involved in cholesterol transport(GO:0090118) |
| 0.0 | 0.1 | GO:0035552 | oxidative single-stranded DNA demethylation(GO:0035552) |
| 0.0 | 0.3 | GO:0046078 | dUMP metabolic process(GO:0046078) |
| 0.0 | 0.2 | GO:0006543 | glutamine catabolic process(GO:0006543) |
| 0.0 | 0.2 | GO:0051612 | negative regulation of neurotransmitter uptake(GO:0051581) regulation of serotonin uptake(GO:0051611) negative regulation of serotonin uptake(GO:0051612) |
| 0.0 | 0.2 | GO:0008218 | bioluminescence(GO:0008218) |
| 0.0 | 0.4 | GO:0048672 | positive regulation of collateral sprouting(GO:0048672) |
| 0.0 | 0.1 | GO:0007525 | somatic muscle development(GO:0007525) |
| 0.0 | 0.2 | GO:0060988 | lipid tube assembly(GO:0060988) |
| 0.0 | 0.6 | GO:0035090 | maintenance of apical/basal cell polarity(GO:0035090) maintenance of epithelial cell apical/basal polarity(GO:0045199) |
| 0.0 | 5.1 | GO:0006614 | SRP-dependent cotranslational protein targeting to membrane(GO:0006614) |
| 0.0 | 0.3 | GO:0017062 | respiratory chain complex III assembly(GO:0017062) mitochondrial respiratory chain complex III assembly(GO:0034551) |
| 0.0 | 0.7 | GO:1900271 | regulation of long-term synaptic potentiation(GO:1900271) |
| 0.0 | 0.3 | GO:0033227 | dsRNA transport(GO:0033227) |
| 0.0 | 0.1 | GO:0002071 | glandular epithelial cell maturation(GO:0002071) positive regulation of type B pancreatic cell development(GO:2000078) |
| 0.0 | 0.2 | GO:2000346 | negative regulation of hepatocyte proliferation(GO:2000346) |
| 0.0 | 0.1 | GO:0021793 | chemorepulsion of branchiomotor axon(GO:0021793) |
| 0.0 | 0.2 | GO:0046449 | creatinine metabolic process(GO:0046449) |
| 0.0 | 0.0 | GO:0005985 | sucrose metabolic process(GO:0005985) |
| 0.0 | 0.2 | GO:0001880 | Mullerian duct regression(GO:0001880) |
| 0.0 | 0.6 | GO:0040015 | negative regulation of multicellular organism growth(GO:0040015) |
| 0.0 | 0.3 | GO:2000427 | positive regulation of apoptotic cell clearance(GO:2000427) |
| 0.0 | 0.2 | GO:1904424 | regulation of GTP binding(GO:1904424) |
| 0.0 | 0.1 | GO:0003430 | growth plate cartilage chondrocyte growth(GO:0003430) |
| 0.0 | 0.1 | GO:0006659 | phosphatidylserine biosynthetic process(GO:0006659) |
| 0.0 | 0.2 | GO:0002069 | columnar/cuboidal epithelial cell maturation(GO:0002069) intestinal epithelial cell maturation(GO:0060574) |
| 0.0 | 0.1 | GO:0001544 | initiation of primordial ovarian follicle growth(GO:0001544) |
| 0.0 | 0.1 | GO:1904327 | protein localization to cytosolic proteasome complex(GO:1904327) protein localization to cytosolic proteasome complex involved in ERAD pathway(GO:1904379) |
| 0.0 | 0.1 | GO:0032071 | regulation of endodeoxyribonuclease activity(GO:0032071) |
| 0.0 | 0.1 | GO:0035494 | SNARE complex disassembly(GO:0035494) |
| 0.0 | 0.1 | GO:0071409 | cellular response to cycloheximide(GO:0071409) |
| 0.0 | 0.1 | GO:0046898 | response to cycloheximide(GO:0046898) |
| 0.0 | 1.0 | GO:0009083 | branched-chain amino acid catabolic process(GO:0009083) |
| 0.0 | 0.1 | GO:0097032 | respiratory chain complex II assembly(GO:0034552) mitochondrial respiratory chain complex II assembly(GO:0034553) mitochondrial respiratory chain complex II biogenesis(GO:0097032) |
| 0.0 | 0.0 | GO:0003072 | regulation of blood vessel size by renin-angiotensin(GO:0002034) renal control of peripheral vascular resistance involved in regulation of systemic arterial blood pressure(GO:0003072) |
| 0.0 | 0.2 | GO:1904180 | negative regulation of mitochondrial depolarization(GO:0051902) negative regulation of membrane depolarization(GO:1904180) |
| 0.0 | 0.1 | GO:0010593 | negative regulation of lamellipodium assembly(GO:0010593) |
| 0.0 | 0.1 | GO:2000984 | regulation of ATP citrate synthase activity(GO:2000983) negative regulation of ATP citrate synthase activity(GO:2000984) |
| 0.0 | 0.1 | GO:0046416 | D-amino acid metabolic process(GO:0046416) |
| 0.0 | 0.3 | GO:0070257 | positive regulation of mucus secretion(GO:0070257) |
| 0.0 | 0.1 | GO:0072106 | regulation of ureteric bud formation(GO:0072106) positive regulation of ureteric bud formation(GO:0072107) |
| 0.0 | 0.1 | GO:0019836 | hemolysis by symbiont of host erythrocytes(GO:0019836) hemolysis in other organism(GO:0044179) hemolysis in other organism involved in symbiotic interaction(GO:0052331) |
| 0.0 | 0.1 | GO:0097167 | circadian regulation of translation(GO:0097167) |
| 0.0 | 0.3 | GO:0071963 | establishment or maintenance of cell polarity regulating cell shape(GO:0071963) |
| 0.0 | 0.5 | GO:0048172 | regulation of short-term neuronal synaptic plasticity(GO:0048172) |
| 0.0 | 0.1 | GO:0098746 | fast, calcium ion-dependent exocytosis of neurotransmitter(GO:0098746) |
| 0.0 | 0.4 | GO:0045059 | positive thymic T cell selection(GO:0045059) |
| 0.0 | 0.2 | GO:0001957 | intramembranous ossification(GO:0001957) direct ossification(GO:0036072) |
| 0.0 | 0.1 | GO:1903487 | regulation of lactation(GO:1903487) |
| 0.0 | 0.2 | GO:2000645 | negative regulation of receptor catabolic process(GO:2000645) |
| 0.0 | 0.1 | GO:0035498 | carnosine metabolic process(GO:0035498) |
| 0.0 | 0.1 | GO:0019065 | receptor-mediated endocytosis of virus by host cell(GO:0019065) endocytosis involved in viral entry into host cell(GO:0075509) |
| 0.0 | 0.3 | GO:2000615 | regulation of histone H3-K9 acetylation(GO:2000615) |
| 0.0 | 0.1 | GO:0002322 | B cell proliferation involved in immune response(GO:0002322) |
| 0.0 | 0.3 | GO:0048743 | positive regulation of skeletal muscle fiber development(GO:0048743) |
| 0.0 | 1.1 | GO:0035456 | response to interferon-beta(GO:0035456) |
| 0.0 | 0.2 | GO:0035583 | sequestering of TGFbeta in extracellular matrix(GO:0035583) |
| 0.0 | 0.3 | GO:0006787 | porphyrin-containing compound catabolic process(GO:0006787) tetrapyrrole catabolic process(GO:0033015) heme catabolic process(GO:0042167) pigment catabolic process(GO:0046149) |
| 0.0 | 0.1 | GO:0060011 | Sertoli cell proliferation(GO:0060011) |
| 0.0 | 0.2 | GO:0044375 | regulation of peroxisome size(GO:0044375) |
| 0.0 | 0.1 | GO:1902361 | mitochondrial pyruvate transport(GO:0006850) mitochondrial pyruvate transmembrane transport(GO:1902361) |
| 0.0 | 0.4 | GO:0061635 | regulation of protein complex stability(GO:0061635) |
| 0.0 | 0.1 | GO:2000437 | regulation of monocyte extravasation(GO:2000437) |
| 0.0 | 0.4 | GO:1900028 | negative regulation of ruffle assembly(GO:1900028) |
| 0.0 | 0.1 | GO:0018874 | benzoate metabolic process(GO:0018874) |
| 0.0 | 0.7 | GO:0007213 | G-protein coupled acetylcholine receptor signaling pathway(GO:0007213) |
| 0.0 | 0.1 | GO:0001983 | regulation of systemic arterial blood pressure by carotid sinus baroreceptor feedback(GO:0001978) baroreceptor response to increased systemic arterial blood pressure(GO:0001983) |
| 0.0 | 0.1 | GO:0002774 | Fc receptor mediated inhibitory signaling pathway(GO:0002774) |
| 0.0 | 0.1 | GO:0019626 | short-chain fatty acid catabolic process(GO:0019626) |
| 0.0 | 0.1 | GO:0045062 | extrathymic T cell selection(GO:0045062) |
| 0.0 | 0.1 | GO:2001183 | negative regulation of interleukin-12 secretion(GO:2001183) |
| 0.0 | 0.1 | GO:0021564 | vagus nerve development(GO:0021564) |
| 0.0 | 0.4 | GO:0035162 | embryonic hemopoiesis(GO:0035162) |
| 0.0 | 0.1 | GO:1902626 | assembly of large subunit precursor of preribosome(GO:1902626) |
| 0.0 | 0.2 | GO:1900063 | regulation of peroxisome organization(GO:1900063) |
| 0.0 | 0.1 | GO:0034141 | positive regulation of toll-like receptor 3 signaling pathway(GO:0034141) |
| 0.0 | 0.3 | GO:0006975 | DNA damage induced protein phosphorylation(GO:0006975) |
| 0.0 | 0.1 | GO:1901069 | guanosine-containing compound catabolic process(GO:1901069) |
| 0.0 | 0.2 | GO:0021767 | mammillary body development(GO:0021767) mammillary axonal complex development(GO:0061373) |
| 0.0 | 0.2 | GO:0070995 | NADPH oxidation(GO:0070995) |
| 0.0 | 0.2 | GO:0051012 | microtubule sliding(GO:0051012) |
| 0.0 | 0.1 | GO:0018364 | peptidyl-glutamine methylation(GO:0018364) |
| 0.0 | 0.1 | GO:0048058 | compound eye corneal lens development(GO:0048058) |
| 0.0 | 0.0 | GO:0010726 | positive regulation of hydrogen peroxide metabolic process(GO:0010726) |
| 0.0 | 0.3 | GO:0006627 | protein processing involved in protein targeting to mitochondrion(GO:0006627) |
| 0.0 | 0.2 | GO:0010936 | negative regulation of macrophage cytokine production(GO:0010936) |
| 0.0 | 0.1 | GO:0061056 | sclerotome development(GO:0061056) |
| 0.0 | 0.1 | GO:0019230 | proprioception(GO:0019230) |
| 0.0 | 0.3 | GO:0090292 | nuclear matrix anchoring at nuclear membrane(GO:0090292) |
| 0.0 | 0.2 | GO:0051697 | protein delipidation(GO:0051697) |
| 0.0 | 0.1 | GO:0036324 | vascular endothelial growth factor receptor-2 signaling pathway(GO:0036324) |
| 0.0 | 0.1 | GO:0046208 | spermine catabolic process(GO:0046208) |
| 0.0 | 0.2 | GO:0035376 | sterol import(GO:0035376) cholesterol import(GO:0070508) |
| 0.0 | 0.1 | GO:1903015 | regulation of exo-alpha-sialidase activity(GO:1903015) |
| 0.0 | 0.1 | GO:0046874 | quinolinate metabolic process(GO:0046874) |
| 0.0 | 0.0 | GO:2000974 | negative regulation of pro-B cell differentiation(GO:2000974) |
| 0.0 | 0.2 | GO:0033210 | leptin-mediated signaling pathway(GO:0033210) |
| 0.0 | 0.4 | GO:0045838 | positive regulation of membrane potential(GO:0045838) |
| 0.0 | 0.7 | GO:0051131 | chaperone-mediated protein complex assembly(GO:0051131) |
| 0.0 | 0.0 | GO:1902683 | regulation of receptor localization to synapse(GO:1902683) |
| 0.0 | 0.0 | GO:0035696 | monocyte extravasation(GO:0035696) |
| 0.0 | 0.2 | GO:0046146 | tetrahydrobiopterin biosynthetic process(GO:0006729) tetrahydrobiopterin metabolic process(GO:0046146) |
| 0.0 | 0.1 | GO:0072579 | molybdenum incorporation into molybdenum-molybdopterin complex(GO:0018315) metal incorporation into metallo-molybdopterin complex(GO:0042040) glycine receptor clustering(GO:0072579) |
| 0.0 | 0.1 | GO:0090133 | mesendoderm migration(GO:0090133) cell migration involved in mesendoderm migration(GO:0090134) |
| 0.0 | 1.3 | GO:0032728 | positive regulation of interferon-beta production(GO:0032728) |
| 0.0 | 0.1 | GO:1902463 | protein localization to cell leading edge(GO:1902463) |
| 0.0 | 0.0 | GO:0002331 | pre-B cell allelic exclusion(GO:0002331) |
| 0.0 | 0.1 | GO:0060974 | neural crest cell migration involved in heart formation(GO:0003147) cell migration involved in heart formation(GO:0060974) anterior neural tube closure(GO:0061713) cellular response to folic acid(GO:0071231) |
| 0.0 | 0.1 | GO:0006500 | N-terminal protein palmitoylation(GO:0006500) |
| 0.0 | 0.2 | GO:0090043 | regulation of tubulin deacetylation(GO:0090043) |
| 0.0 | 0.2 | GO:0061009 | common bile duct development(GO:0061009) |
| 0.0 | 0.1 | GO:0071894 | histone H2B conserved C-terminal lysine ubiquitination(GO:0071894) |
| 0.0 | 0.2 | GO:0046618 | drug export(GO:0046618) |
| 0.0 | 0.0 | GO:0036292 | DNA rewinding(GO:0036292) |
| 0.0 | 0.1 | GO:0019376 | galactolipid catabolic process(GO:0019376) |
| 0.0 | 0.1 | GO:0003095 | pressure natriuresis(GO:0003095) |
| 0.0 | 0.3 | GO:0048007 | antigen processing and presentation of lipid antigen via MHC class Ib(GO:0048003) antigen processing and presentation, exogenous lipid antigen via MHC class Ib(GO:0048007) |
| 0.0 | 0.0 | GO:0002439 | chronic inflammatory response to antigenic stimulus(GO:0002439) regulation of chronic inflammatory response to antigenic stimulus(GO:0002874) positive regulation of chronic inflammatory response to antigenic stimulus(GO:0002876) |
| 0.0 | 0.1 | GO:0051941 | regulation of amino acid uptake involved in synaptic transmission(GO:0051941) regulation of glutamate uptake involved in transmission of nerve impulse(GO:0051946) regulation of L-glutamate import(GO:1900920) |
| 0.0 | 0.2 | GO:0046600 | negative regulation of centriole replication(GO:0046600) |
| 0.0 | 0.1 | GO:0001808 | negative regulation of type IV hypersensitivity(GO:0001808) |
| 0.0 | 0.4 | GO:0006782 | protoporphyrinogen IX biosynthetic process(GO:0006782) |
| 0.0 | 0.0 | GO:0060352 | cell adhesion molecule production(GO:0060352) |
| 0.0 | 0.3 | GO:0007288 | sperm axoneme assembly(GO:0007288) |
| 0.0 | 0.1 | GO:0071461 | cellular response to redox state(GO:0071461) |
| 0.0 | 0.2 | GO:0036089 | cleavage furrow formation(GO:0036089) |
| 0.0 | 0.4 | GO:0052695 | cellular glucuronidation(GO:0052695) |
| 0.0 | 0.2 | GO:0090336 | positive regulation of brown fat cell differentiation(GO:0090336) |
| 0.0 | 0.1 | GO:0021692 | cerebellar Purkinje cell layer morphogenesis(GO:0021692) |
| 0.0 | 0.4 | GO:0007379 | segment specification(GO:0007379) |
| 0.0 | 0.3 | GO:0033540 | fatty acid beta-oxidation using acyl-CoA oxidase(GO:0033540) |
| 0.0 | 0.1 | GO:0043314 | negative regulation of neutrophil degranulation(GO:0043314) |
| 0.0 | 0.1 | GO:0060741 | prostate gland stromal morphogenesis(GO:0060741) |
| 0.0 | 0.1 | GO:1904692 | positive regulation of type B pancreatic cell proliferation(GO:1904692) |
| 0.0 | 0.1 | GO:0070781 | protein biotinylation(GO:0009305) response to biotin(GO:0070781) histone biotinylation(GO:0071110) |
| 0.0 | 0.0 | GO:0019321 | pentose metabolic process(GO:0019321) |
| 0.0 | 0.1 | GO:0030505 | inorganic diphosphate transport(GO:0030505) |
| 0.0 | 0.0 | GO:0038162 | erythropoietin-mediated signaling pathway(GO:0038162) |
| 0.0 | 0.5 | GO:0034356 | NAD biosynthesis via nicotinamide riboside salvage pathway(GO:0034356) |
| 0.0 | 0.4 | GO:0045008 | depyrimidination(GO:0045008) |
| 0.0 | 0.3 | GO:0006228 | UTP biosynthetic process(GO:0006228) |
| 0.0 | 0.1 | GO:0097500 | receptor localization to nonmotile primary cilium(GO:0097500) |
| 0.0 | 0.4 | GO:0051044 | positive regulation of membrane protein ectodomain proteolysis(GO:0051044) |
| 0.0 | 0.2 | GO:0014859 | negative regulation of skeletal muscle cell proliferation(GO:0014859) negative regulation of skeletal muscle satellite cell proliferation(GO:1902723) |
| 0.0 | 0.2 | GO:1902525 | regulation of protein monoubiquitination(GO:1902525) |
| 0.0 | 2.8 | GO:0010972 | negative regulation of G2/M transition of mitotic cell cycle(GO:0010972) |
| 0.0 | 0.2 | GO:0060005 | vestibular reflex(GO:0060005) |
| 0.0 | 0.1 | GO:0035973 | aggrephagy(GO:0035973) |
| 0.0 | 0.0 | GO:0002581 | negative regulation of antigen processing and presentation of peptide or polysaccharide antigen via MHC class II(GO:0002581) |
| 0.0 | 2.4 | GO:0070125 | mitochondrial translational elongation(GO:0070125) |
| 0.0 | 0.1 | GO:0098707 | ferrous iron import into cell(GO:0097460) ferrous iron import across plasma membrane(GO:0098707) |
| 0.0 | 0.5 | GO:0060213 | regulation of nuclear-transcribed mRNA poly(A) tail shortening(GO:0060211) positive regulation of nuclear-transcribed mRNA poly(A) tail shortening(GO:0060213) |
| 0.0 | 0.2 | GO:0009157 | deoxyribonucleoside monophosphate biosynthetic process(GO:0009157) |
| 0.0 | 0.0 | GO:2000196 | positive regulation of female gonad development(GO:2000196) |
| 0.0 | 0.1 | GO:2000672 | negative regulation of motor neuron apoptotic process(GO:2000672) |
| 0.0 | 0.1 | GO:0072734 | response to staurosporine(GO:0072733) cellular response to staurosporine(GO:0072734) |
| 0.0 | 0.9 | GO:0032008 | positive regulation of TOR signaling(GO:0032008) |
| 0.0 | 0.1 | GO:0071422 | succinate transport(GO:0015744) succinate transmembrane transport(GO:0071422) |
| 0.0 | 0.1 | GO:0097698 | base-excision repair, base-free sugar-phosphate removal(GO:0006286) telomere maintenance via base-excision repair(GO:0097698) |
| 0.0 | 0.4 | GO:0048012 | hepatocyte growth factor receptor signaling pathway(GO:0048012) |
| 0.0 | 0.1 | GO:0098957 | anterograde axonal transport of mitochondrion(GO:0098957) |
| 0.0 | 0.2 | GO:0008627 | intrinsic apoptotic signaling pathway in response to osmotic stress(GO:0008627) |
| 0.0 | 0.1 | GO:0090258 | negative regulation of mitochondrial fission(GO:0090258) |
| 0.0 | 0.1 | GO:0002215 | defense response to nematode(GO:0002215) |
| 0.0 | 0.0 | GO:2000360 | negative regulation of binding of sperm to zona pellucida(GO:2000360) |
| 0.0 | 0.0 | GO:0014740 | regulation of muscle hyperplasia(GO:0014738) negative regulation of muscle hyperplasia(GO:0014740) |
| 0.0 | 0.1 | GO:0033499 | galactose catabolic process via UDP-galactose(GO:0033499) |
| 0.0 | 0.2 | GO:0031119 | tRNA pseudouridine synthesis(GO:0031119) |
| 0.0 | 1.5 | GO:0030049 | muscle filament sliding(GO:0030049) actin-myosin filament sliding(GO:0033275) |
| 0.0 | 0.1 | GO:0033029 | regulation of neutrophil apoptotic process(GO:0033029) positive regulation of neutrophil apoptotic process(GO:0033031) |
| 0.0 | 0.0 | GO:0021816 | extension of a leading process involved in cell motility in cerebral cortex radial glia guided migration(GO:0021816) |
| 0.0 | 0.1 | GO:0016559 | peroxisome fission(GO:0016559) |
| 0.0 | 0.2 | GO:0038203 | TORC2 signaling(GO:0038203) |
| 0.0 | 0.0 | GO:1900227 | positive regulation of NLRP3 inflammasome complex assembly(GO:1900227) |
| 0.0 | 0.2 | GO:0035331 | negative regulation of hippo signaling(GO:0035331) |
| 0.0 | 1.2 | GO:0006120 | mitochondrial electron transport, NADH to ubiquinone(GO:0006120) |
| 0.0 | 0.2 | GO:0070493 | thrombin receptor signaling pathway(GO:0070493) |
| 0.0 | 0.2 | GO:0021633 | optic nerve structural organization(GO:0021633) |
| 0.0 | 0.1 | GO:2000124 | regulation of endocannabinoid signaling pathway(GO:2000124) |
| 0.0 | 0.1 | GO:0034334 | adherens junction maintenance(GO:0034334) |
| 0.0 | 0.3 | GO:0003322 | pancreatic A cell development(GO:0003322) |
| 0.0 | 0.0 | GO:1904529 | regulation of actin filament binding(GO:1904529) regulation of actin binding(GO:1904616) |
| 0.0 | 0.1 | GO:0015811 | L-cystine transport(GO:0015811) |
| 0.0 | 1.1 | GO:0006910 | phagocytosis, recognition(GO:0006910) |
| 0.0 | 0.0 | GO:0009441 | glycolate metabolic process(GO:0009441) |
| 0.0 | 0.1 | GO:1901377 | toxin catabolic process(GO:0009407) mycotoxin catabolic process(GO:0043387) aflatoxin catabolic process(GO:0046223) secondary metabolite catabolic process(GO:0090487) organic heteropentacyclic compound catabolic process(GO:1901377) regulation of glutathione biosynthetic process(GO:1903786) positive regulation of glutathione biosynthetic process(GO:1903788) |
| 0.0 | 0.1 | GO:0038169 | somatostatin receptor signaling pathway(GO:0038169) somatostatin signaling pathway(GO:0038170) |
| 0.0 | 0.1 | GO:0070164 | negative regulation of adiponectin secretion(GO:0070164) |
| 0.0 | 0.1 | GO:0072592 | oxygen metabolic process(GO:0072592) |
| 0.0 | 0.1 | GO:0019418 | sulfide oxidation(GO:0019418) sulfide oxidation, using sulfide:quinone oxidoreductase(GO:0070221) |
| 0.0 | 0.1 | GO:0051127 | positive regulation of actin nucleation(GO:0051127) |
| 0.0 | 0.1 | GO:0006581 | acetylcholine catabolic process in synaptic cleft(GO:0001507) acetylcholine catabolic process(GO:0006581) |
| 0.0 | 0.2 | GO:0002084 | protein depalmitoylation(GO:0002084) |
| 0.0 | 0.0 | GO:0001828 | inner cell mass cellular morphogenesis(GO:0001828) |
| 0.0 | 0.1 | GO:0032486 | Rap protein signal transduction(GO:0032486) |
| 0.0 | 0.4 | GO:0033539 | fatty acid beta-oxidation using acyl-CoA dehydrogenase(GO:0033539) |
| 0.0 | 0.1 | GO:0035610 | protein side chain deglutamylation(GO:0035610) |
| 0.0 | 0.1 | GO:0061113 | pancreas morphogenesis(GO:0061113) |
| 0.0 | 0.1 | GO:0060613 | fat pad development(GO:0060613) |
| 0.0 | 0.4 | GO:0006853 | carnitine shuttle(GO:0006853) |
| 0.0 | 0.1 | GO:0070829 | response to vitamin B2(GO:0033274) heterochromatin maintenance(GO:0070829) |
| 0.0 | 0.2 | GO:0019934 | cGMP-mediated signaling(GO:0019934) |
| 0.0 | 0.1 | GO:0002371 | dendritic cell cytokine production(GO:0002371) |
| 0.0 | 0.1 | GO:0006565 | L-serine catabolic process(GO:0006565) |
| 0.0 | 0.1 | GO:0048050 | post-embryonic eye morphogenesis(GO:0048050) |
| 0.0 | 0.0 | GO:0019249 | lactate biosynthetic process(GO:0019249) |
| 0.0 | 0.7 | GO:0060292 | long term synaptic depression(GO:0060292) |
| 0.0 | 0.3 | GO:0032695 | negative regulation of interleukin-12 production(GO:0032695) |
| 0.0 | 0.1 | GO:0048280 | vesicle fusion with Golgi apparatus(GO:0048280) |
| 0.0 | 0.1 | GO:1902715 | positive regulation of interferon-gamma secretion(GO:1902715) |
| 0.0 | 0.1 | GO:0098976 | excitatory chemical synaptic transmission(GO:0098976) regulation of AMPA glutamate receptor clustering(GO:1904717) positive regulation of AMPA glutamate receptor clustering(GO:1904719) |
| 0.0 | 0.2 | GO:1902902 | negative regulation of autophagosome assembly(GO:1902902) |
| 0.0 | 0.3 | GO:0033235 | positive regulation of protein sumoylation(GO:0033235) |
| 0.0 | 0.0 | GO:0006014 | D-ribose metabolic process(GO:0006014) |
| 0.0 | 0.2 | GO:1904936 | cerebral cortex GABAergic interneuron migration(GO:0021853) interneuron migration(GO:1904936) |
| 0.0 | 0.3 | GO:0036158 | outer dynein arm assembly(GO:0036158) |
| 0.0 | 0.0 | GO:0042699 | follicle-stimulating hormone signaling pathway(GO:0042699) |
| 0.0 | 0.4 | GO:0000305 | response to oxygen radical(GO:0000305) |
| 0.0 | 0.5 | GO:0051016 | barbed-end actin filament capping(GO:0051016) |
| 0.0 | 0.1 | GO:0032916 | positive regulation of transforming growth factor beta3 production(GO:0032916) |
| 0.0 | 0.1 | GO:0048104 | establishment of body hair or bristle planar orientation(GO:0048104) establishment of body hair planar orientation(GO:0048105) |
| 0.0 | 0.1 | GO:0055011 | atrial cardiac muscle cell differentiation(GO:0055011) atrial cardiac muscle cell development(GO:0055014) |
| 0.0 | 0.1 | GO:0032290 | peripheral nervous system myelin formation(GO:0032290) |
| 0.0 | 0.0 | GO:0070126 | mitochondrial translational termination(GO:0070126) |
| 0.0 | 0.2 | GO:0071847 | TNFSF11-mediated signaling pathway(GO:0071847) |
| 0.0 | 0.3 | GO:0034498 | early endosome to Golgi transport(GO:0034498) |
| 0.0 | 0.5 | GO:0071526 | semaphorin-plexin signaling pathway(GO:0071526) |
| 0.0 | 0.1 | GO:0035754 | B cell chemotaxis(GO:0035754) |
| 0.0 | 0.1 | GO:0071394 | cellular response to testosterone stimulus(GO:0071394) |
| 0.0 | 0.1 | GO:0042416 | dopamine biosynthetic process(GO:0042416) |
| 0.0 | 0.4 | GO:2000785 | regulation of autophagosome assembly(GO:2000785) |
| 0.0 | 0.3 | GO:0030150 | protein import into mitochondrial matrix(GO:0030150) |
| 0.0 | 0.1 | GO:0070560 | protein secretion by platelet(GO:0070560) |
| 0.0 | 0.1 | GO:1902083 | negative regulation of peptidyl-cysteine S-nitrosylation(GO:1902083) |
| 0.0 | 0.1 | GO:2001106 | regulation of Rho guanyl-nucleotide exchange factor activity(GO:2001106) |
| 0.0 | 0.2 | GO:0032790 | ribosome disassembly(GO:0032790) |
| 0.0 | 0.2 | GO:0000052 | citrulline metabolic process(GO:0000052) |
| 0.0 | 0.1 | GO:0015879 | carnitine transport(GO:0015879) |
| 0.0 | 0.1 | GO:0072137 | condensed mesenchymal cell proliferation(GO:0072137) |
| 0.0 | 0.1 | GO:0006669 | sphinganine-1-phosphate biosynthetic process(GO:0006669) |
| 0.0 | 0.2 | GO:0048296 | regulation of isotype switching to IgA isotypes(GO:0048296) positive regulation of isotype switching to IgA isotypes(GO:0048298) |
| 0.0 | 0.3 | GO:0030205 | dermatan sulfate metabolic process(GO:0030205) |
| 0.0 | 0.1 | GO:0006420 | arginyl-tRNA aminoacylation(GO:0006420) |
| 0.0 | 0.4 | GO:0010257 | NADH dehydrogenase complex assembly(GO:0010257) mitochondrial respiratory chain complex I assembly(GO:0032981) mitochondrial respiratory chain complex I biogenesis(GO:0097031) |
| 0.0 | 0.1 | GO:0003402 | planar cell polarity pathway involved in axis elongation(GO:0003402) |
| 0.0 | 0.2 | GO:0031987 | locomotion involved in locomotory behavior(GO:0031987) |
| 0.0 | 0.1 | GO:0046498 | S-adenosylhomocysteine metabolic process(GO:0046498) |
| 0.0 | 0.0 | GO:1903377 | negative regulation of oxidative stress-induced neuron intrinsic apoptotic signaling pathway(GO:1903377) |
| 0.0 | 0.0 | GO:0002679 | respiratory burst involved in defense response(GO:0002679) |
| 0.0 | 0.2 | GO:0008535 | respiratory chain complex IV assembly(GO:0008535) |
| 0.0 | 0.1 | GO:0042415 | norepinephrine metabolic process(GO:0042415) |
| 0.0 | 0.0 | GO:0052151 | positive regulation by symbiont of host apoptotic process(GO:0052151) positive regulation of apoptotic process by virus(GO:0060139) apoptotic process involved in embryonic digit morphogenesis(GO:1902263) |
| 0.0 | 0.4 | GO:0060972 | left/right pattern formation(GO:0060972) |
| 0.0 | 0.1 | GO:0042448 | progesterone metabolic process(GO:0042448) |
| 0.0 | 0.0 | GO:0061428 | negative regulation of transcription from RNA polymerase II promoter in response to hypoxia(GO:0061428) |
| 0.0 | 0.1 | GO:0009438 | methylglyoxal metabolic process(GO:0009438) |
| 0.0 | 0.0 | GO:0034164 | negative regulation of toll-like receptor 9 signaling pathway(GO:0034164) |
| 0.0 | 0.1 | GO:2000001 | regulation of DNA damage checkpoint(GO:2000001) |
| 0.0 | 0.0 | GO:0060979 | vasculogenesis involved in coronary vascular morphogenesis(GO:0060979) |
| 0.0 | 0.2 | GO:1901550 | regulation of endothelial cell development(GO:1901550) regulation of establishment of endothelial barrier(GO:1903140) |
| 0.0 | 0.3 | GO:0010818 | T cell chemotaxis(GO:0010818) |
| 0.0 | 0.0 | GO:0003408 | optic cup formation involved in camera-type eye development(GO:0003408) |
| 0.0 | 0.2 | GO:0048387 | negative regulation of retinoic acid receptor signaling pathway(GO:0048387) |
| 0.0 | 0.2 | GO:1902043 | positive regulation of extrinsic apoptotic signaling pathway via death domain receptors(GO:1902043) |
| 0.0 | 0.5 | GO:0045662 | negative regulation of myoblast differentiation(GO:0045662) |
| 0.0 | 0.2 | GO:0051457 | maintenance of protein location in nucleus(GO:0051457) |
| 0.0 | 0.1 | GO:0032792 | negative regulation of CREB transcription factor activity(GO:0032792) |
| 0.0 | 0.0 | GO:0015846 | polyamine transport(GO:0015846) |
| 0.0 | 0.2 | GO:0006451 | selenocysteine incorporation(GO:0001514) translational readthrough(GO:0006451) |
| 0.0 | 0.3 | GO:0032802 | low-density lipoprotein particle receptor catabolic process(GO:0032802) |
| 0.0 | 0.0 | GO:0090209 | negative regulation of triglyceride metabolic process(GO:0090209) |
| 0.0 | 0.8 | GO:0006301 | postreplication repair(GO:0006301) |
| 0.0 | 0.1 | GO:0032687 | negative regulation of interferon-alpha production(GO:0032687) |
| 0.0 | 0.4 | GO:0000715 | nucleotide-excision repair, DNA damage recognition(GO:0000715) |
| 0.0 | 0.0 | GO:0001927 | exocyst assembly(GO:0001927) |
| 0.0 | 0.1 | GO:0019856 | 'de novo' pyrimidine nucleobase biosynthetic process(GO:0006207) pyrimidine nucleobase biosynthetic process(GO:0019856) |
| 0.0 | 0.0 | GO:0034444 | regulation of plasma lipoprotein particle oxidation(GO:0034444) negative regulation of plasma lipoprotein particle oxidation(GO:0034445) |
| 0.0 | 0.1 | GO:1904637 | response to ionomycin(GO:1904636) cellular response to ionomycin(GO:1904637) |
| 0.0 | 0.0 | GO:2000048 | negative regulation of cell-cell adhesion mediated by cadherin(GO:2000048) |
| 0.0 | 0.0 | GO:0032930 | positive regulation of superoxide anion generation(GO:0032930) |
| 0.0 | 0.9 | GO:0006081 | cellular aldehyde metabolic process(GO:0006081) |
| 0.0 | 0.1 | GO:0001920 | negative regulation of receptor recycling(GO:0001920) |
| 0.0 | 0.1 | GO:0045176 | apical protein localization(GO:0045176) |
| 0.0 | 0.1 | GO:0006750 | glutathione biosynthetic process(GO:0006750) |
| 0.0 | 0.5 | GO:0042461 | photoreceptor cell development(GO:0042461) |
| 0.0 | 0.3 | GO:0030575 | nuclear body organization(GO:0030575) |
| 0.0 | 0.1 | GO:0008343 | adult feeding behavior(GO:0008343) |
| 0.0 | 0.0 | GO:0098583 | mastication(GO:0071626) learned vocalization behavior(GO:0098583) |
| 0.0 | 0.1 | GO:0060681 | branch elongation involved in ureteric bud branching(GO:0060681) |
| 0.0 | 0.0 | GO:0018125 | peptidyl-cysteine methylation(GO:0018125) |
| 0.0 | 0.0 | GO:0072365 | regulation of cellular ketone metabolic process by negative regulation of transcription from RNA polymerase II promoter(GO:0072365) |
| 0.0 | 0.0 | GO:0051795 | positive regulation of catagen(GO:0051795) |
| 0.0 | 0.0 | GO:0015855 | pyrimidine nucleobase transport(GO:0015855) purine nucleobase transmembrane transport(GO:1904823) |
| 0.0 | 0.2 | GO:0043508 | negative regulation of JUN kinase activity(GO:0043508) |
| 0.0 | 0.1 | GO:0006702 | androgen biosynthetic process(GO:0006702) |
| 0.0 | 0.1 | GO:0035728 | response to hepatocyte growth factor(GO:0035728) |
| 0.0 | 0.1 | GO:0051694 | pointed-end actin filament capping(GO:0051694) |
| 0.0 | 0.1 | GO:0000738 | DNA catabolic process, exonucleolytic(GO:0000738) |
| 0.0 | 0.0 | GO:0014060 | regulation of epinephrine secretion(GO:0014060) negative regulation of epinephrine secretion(GO:0032811) epidermal growth factor-activated receptor transactivation by G-protein coupled receptor signaling pathway(GO:0035625) epinephrine secretion(GO:0048242) |
| 0.0 | 0.1 | GO:0061484 | hematopoietic stem cell homeostasis(GO:0061484) |
| 0.0 | 0.2 | GO:0070307 | lens fiber cell development(GO:0070307) |
| 0.0 | 0.1 | GO:0032000 | positive regulation of fatty acid beta-oxidation(GO:0032000) |
| 0.0 | 0.1 | GO:0032495 | response to muramyl dipeptide(GO:0032495) |
| 0.0 | 0.7 | GO:0032784 | regulation of DNA-templated transcription, elongation(GO:0032784) |
| 0.0 | 0.4 | GO:0007191 | adenylate cyclase-activating dopamine receptor signaling pathway(GO:0007191) |
| 0.0 | 0.1 | GO:0000098 | sulfur amino acid catabolic process(GO:0000098) |
| 0.0 | 0.0 | GO:0009216 | purine deoxyribonucleoside triphosphate biosynthetic process(GO:0009216) |
| 0.0 | 0.1 | GO:0045198 | establishment of epithelial cell apical/basal polarity(GO:0045198) |
| 0.0 | 0.1 | GO:2000138 | positive regulation of cell proliferation involved in heart morphogenesis(GO:2000138) |
| 0.0 | 0.1 | GO:0046784 | viral mRNA export from host cell nucleus(GO:0046784) |
| 0.0 | 0.3 | GO:0030834 | regulation of actin filament depolymerization(GO:0030834) |
| 0.0 | 0.5 | GO:0090383 | phagosome acidification(GO:0090383) |
| 0.0 | 0.2 | GO:0051823 | regulation of synapse structural plasticity(GO:0051823) |
| 0.0 | 0.0 | GO:0070966 | nuclear-transcribed mRNA catabolic process, no-go decay(GO:0070966) |
| 0.0 | 0.0 | GO:0001992 | regulation of systemic arterial blood pressure by vasopressin(GO:0001992) |
| 0.0 | 0.1 | GO:0060397 | JAK-STAT cascade involved in growth hormone signaling pathway(GO:0060397) |
| 0.0 | 0.1 | GO:1904798 | positive regulation of core promoter binding(GO:1904798) |
| 0.0 | 0.1 | GO:0036444 | calcium ion transmembrane import into mitochondrion(GO:0036444) |
| 0.0 | 0.1 | GO:0044334 | canonical Wnt signaling pathway involved in positive regulation of epithelial to mesenchymal transition(GO:0044334) |
| 0.0 | 0.0 | GO:0097272 | ammonia homeostasis(GO:0097272) urea homeostasis(GO:0097274) |
| 0.0 | 0.4 | GO:0000188 | inactivation of MAPK activity(GO:0000188) |
| 0.0 | 0.1 | GO:1904491 | protein localization to ciliary transition zone(GO:1904491) |
| 0.0 | 0.1 | GO:1902951 | negative regulation of dendritic spine maintenance(GO:1902951) |
| 0.0 | 0.0 | GO:0055095 | lipoprotein particle mediated signaling(GO:0055095) low-density lipoprotein particle mediated signaling(GO:0055096) |
| 0.0 | 0.2 | GO:0071294 | cellular response to zinc ion(GO:0071294) |
| 0.0 | 0.0 | GO:0045085 | negative regulation of interleukin-2 biosynthetic process(GO:0045085) |
| 0.0 | 0.0 | GO:1903676 | regulation of cap-dependent translational initiation(GO:1903674) positive regulation of cap-dependent translational initiation(GO:1903676) |
| 0.0 | 0.1 | GO:0002386 | immune response in mucosal-associated lymphoid tissue(GO:0002386) |
| 0.0 | 0.3 | GO:0030252 | growth hormone secretion(GO:0030252) |
| 0.0 | 0.1 | GO:0061469 | regulation of type B pancreatic cell proliferation(GO:0061469) |
| 0.0 | 0.3 | GO:0048665 | neuron fate specification(GO:0048665) |
| 0.0 | 0.0 | GO:0097499 | protein localization to nonmotile primary cilium(GO:0097499) |
| 0.0 | 0.2 | GO:0071549 | cellular response to dexamethasone stimulus(GO:0071549) |
| 0.0 | 0.1 | GO:0038030 | non-canonical Wnt signaling pathway via MAPK cascade(GO:0038030) non-canonical Wnt signaling pathway via JNK cascade(GO:0038031) |
| 0.0 | 0.2 | GO:0018026 | peptidyl-lysine monomethylation(GO:0018026) |
| 0.0 | 0.0 | GO:0033277 | abortive mitotic cell cycle(GO:0033277) |
| 0.0 | 0.0 | GO:0002296 | T-helper 1 cell lineage commitment(GO:0002296) |
| 0.0 | 0.2 | GO:0071378 | growth hormone receptor signaling pathway(GO:0060396) cellular response to growth hormone stimulus(GO:0071378) |
| 0.0 | 0.1 | GO:1902074 | response to salt(GO:1902074) |
| 0.0 | 0.1 | GO:0048304 | positive regulation of isotype switching to IgG isotypes(GO:0048304) |
| 0.0 | 1.2 | GO:0006354 | DNA-templated transcription, elongation(GO:0006354) |
| 0.0 | 0.0 | GO:0060010 | Sertoli cell fate commitment(GO:0060010) |
| 0.0 | 0.1 | GO:0090315 | negative regulation of protein targeting to membrane(GO:0090315) |
| 0.0 | 0.1 | GO:0016322 | neuron remodeling(GO:0016322) |
| 0.0 | 0.1 | GO:2000504 | endocardial cushion to mesenchymal transition involved in heart valve formation(GO:0003199) positive regulation of blood vessel remodeling(GO:2000504) |
| 0.0 | 0.1 | GO:0060080 | inhibitory postsynaptic potential(GO:0060080) |
| 0.0 | 0.2 | GO:0021522 | spinal cord motor neuron differentiation(GO:0021522) |
| 0.0 | 0.1 | GO:2000774 | positive regulation of cellular senescence(GO:2000774) |
| 0.0 | 0.1 | GO:0030091 | protein repair(GO:0030091) |
| 0.0 | 0.0 | GO:0035377 | transepithelial water transport(GO:0035377) positive regulation of cyclic nucleotide-gated ion channel activity(GO:1902161) |
Gene overrepresentation in cellular component category:
| Log-likelihood per target | Total log-likelihood | Term | Description |
|---|---|---|---|
| 0.2 | 2.9 | GO:0098647 | collagen type VI trimer(GO:0005589) collagen beaded filament(GO:0098647) |
| 0.2 | 0.5 | GO:0043260 | laminin-11 complex(GO:0043260) |
| 0.2 | 0.9 | GO:0001652 | granular component(GO:0001652) |
| 0.1 | 1.3 | GO:0071953 | elastic fiber(GO:0071953) |
| 0.1 | 0.4 | GO:1902636 | kinociliary basal body(GO:1902636) |
| 0.1 | 0.4 | GO:0005953 | CAAX-protein geranylgeranyltransferase complex(GO:0005953) |
| 0.1 | 1.9 | GO:0097512 | cardiac myofibril(GO:0097512) |
| 0.1 | 0.6 | GO:0043625 | delta DNA polymerase complex(GO:0043625) |
| 0.1 | 0.4 | GO:0008043 | intracellular ferritin complex(GO:0008043) ferritin complex(GO:0070288) |
| 0.1 | 0.8 | GO:1990111 | spermatoproteasome complex(GO:1990111) |
| 0.1 | 0.8 | GO:0071986 | Ragulator complex(GO:0071986) |
| 0.1 | 0.7 | GO:0035976 | AP1 complex(GO:0035976) |
| 0.1 | 0.6 | GO:0005947 | mitochondrial alpha-ketoglutarate dehydrogenase complex(GO:0005947) |
| 0.1 | 0.4 | GO:0005927 | muscle tendon junction(GO:0005927) |
| 0.1 | 0.5 | GO:0005594 | collagen type IX trimer(GO:0005594) |
| 0.1 | 0.6 | GO:1903440 | calcitonin family receptor complex(GO:1903439) amylin receptor complex(GO:1903440) |
| 0.1 | 0.6 | GO:0034751 | aryl hydrocarbon receptor complex(GO:0034751) |
| 0.1 | 1.0 | GO:0043083 | synaptic cleft(GO:0043083) |
| 0.1 | 0.1 | GO:1990769 | proximal neuron projection(GO:1990769) |
| 0.1 | 0.8 | GO:0042105 | alpha-beta T cell receptor complex(GO:0042105) |
| 0.1 | 0.3 | GO:1990879 | CST complex(GO:1990879) |
| 0.1 | 0.3 | GO:0072558 | NLRP1 inflammasome complex(GO:0072558) |
| 0.1 | 0.1 | GO:1990622 | CHOP-ATF3 complex(GO:1990622) |
| 0.1 | 0.3 | GO:0031510 | SUMO activating enzyme complex(GO:0031510) |
| 0.1 | 0.2 | GO:0060987 | lipid tube(GO:0060987) |
| 0.1 | 0.1 | GO:0030062 | mitochondrial tricarboxylic acid cycle enzyme complex(GO:0030062) |
| 0.1 | 0.2 | GO:0070044 | synaptobrevin 2-SNAP-25-syntaxin-1a complex(GO:0070044) |
| 0.1 | 0.5 | GO:0017059 | serine C-palmitoyltransferase complex(GO:0017059) endoplasmic reticulum palmitoyltransferase complex(GO:0031211) |
| 0.1 | 1.6 | GO:0031083 | BLOC-1 complex(GO:0031083) |
| 0.1 | 0.2 | GO:0005588 | collagen type V trimer(GO:0005588) |
| 0.1 | 0.1 | GO:0005965 | protein farnesyltransferase complex(GO:0005965) |
| 0.1 | 0.2 | GO:0042720 | mitochondrial inner membrane peptidase complex(GO:0042720) |
| 0.1 | 0.2 | GO:1990578 | perinuclear endoplasmic reticulum membrane(GO:1990578) |
| 0.1 | 0.8 | GO:0030478 | actin cap(GO:0030478) |
| 0.1 | 0.2 | GO:1990716 | axonemal central apparatus(GO:1990716) |
| 0.1 | 0.6 | GO:0005786 | signal recognition particle, endoplasmic reticulum targeting(GO:0005786) |
| 0.1 | 0.2 | GO:0045323 | interleukin-1 receptor complex(GO:0045323) |
| 0.1 | 0.4 | GO:0098559 | cytoplasmic side of early endosome membrane(GO:0098559) |
| 0.1 | 2.2 | GO:0000421 | autophagosome membrane(GO:0000421) |
| 0.0 | 0.3 | GO:0097442 | CA3 pyramidal cell dendrite(GO:0097442) |
| 0.0 | 0.2 | GO:0032044 | DSIF complex(GO:0032044) |
| 0.0 | 0.4 | GO:0016272 | prefoldin complex(GO:0016272) |
| 0.0 | 0.0 | GO:0005712 | chiasma(GO:0005712) |
| 0.0 | 0.4 | GO:0019774 | proteasome core complex, beta-subunit complex(GO:0019774) |
| 0.0 | 0.2 | GO:0008537 | proteasome activator complex(GO:0008537) |
| 0.0 | 0.1 | GO:0031084 | BLOC-2 complex(GO:0031084) |
| 0.0 | 0.1 | GO:0071754 | IgM immunoglobulin complex(GO:0071753) IgM immunoglobulin complex, circulating(GO:0071754) pentameric IgM immunoglobulin complex(GO:0071756) |
| 0.0 | 0.2 | GO:0070435 | Shc-EGFR complex(GO:0070435) |
| 0.0 | 0.3 | GO:0002081 | outer acrosomal membrane(GO:0002081) |
| 0.0 | 0.6 | GO:0044292 | dendrite terminus(GO:0044292) |
| 0.0 | 0.7 | GO:0000124 | SAGA complex(GO:0000124) |
| 0.0 | 0.1 | GO:0031466 | Cul5-RING ubiquitin ligase complex(GO:0031466) |
| 0.0 | 0.3 | GO:0031417 | NatC complex(GO:0031417) |
| 0.0 | 0.5 | GO:0097418 | neurofibrillary tangle(GO:0097418) |
| 0.0 | 0.2 | GO:0005602 | complement component C1 complex(GO:0005602) |
| 0.0 | 0.4 | GO:0044327 | dendritic spine head(GO:0044327) |
| 0.0 | 0.1 | GO:0043512 | inhibin complex(GO:0043511) inhibin A complex(GO:0043512) |
| 0.0 | 1.3 | GO:0097381 | photoreceptor disc membrane(GO:0097381) |
| 0.0 | 2.9 | GO:0045271 | mitochondrial respiratory chain complex I(GO:0005747) NADH dehydrogenase complex(GO:0030964) respiratory chain complex I(GO:0045271) |
| 0.0 | 0.6 | GO:0005883 | neurofilament(GO:0005883) |
| 0.0 | 0.6 | GO:0034464 | BBSome(GO:0034464) |
| 0.0 | 0.2 | GO:0031467 | Cul7-RING ubiquitin ligase complex(GO:0031467) |
| 0.0 | 1.7 | GO:0005859 | muscle myosin complex(GO:0005859) |
| 0.0 | 0.1 | GO:0035370 | UBC13-UEV1A complex(GO:0035370) |
| 0.0 | 0.3 | GO:0000110 | nucleotide-excision repair factor 1 complex(GO:0000110) |
| 0.0 | 0.2 | GO:1990031 | pinceau fiber(GO:1990031) |
| 0.0 | 0.1 | GO:0097058 | CRLF-CLCF1 complex(GO:0097058) |
| 0.0 | 0.2 | GO:0033257 | Bcl3/NF-kappaB2 complex(GO:0033257) |
| 0.0 | 0.2 | GO:1990393 | 3M complex(GO:1990393) |
| 0.0 | 0.5 | GO:0008290 | F-actin capping protein complex(GO:0008290) |
| 0.0 | 0.2 | GO:0060199 | clathrin-sculpted glutamate transport vesicle(GO:0060199) clathrin-sculpted glutamate transport vesicle membrane(GO:0060203) |
| 0.0 | 0.3 | GO:0030905 | retromer, tubulation complex(GO:0030905) |
| 0.0 | 0.4 | GO:0031465 | Cul4B-RING E3 ubiquitin ligase complex(GO:0031465) |
| 0.0 | 0.2 | GO:0030485 | smooth muscle contractile fiber(GO:0030485) |
| 0.0 | 0.7 | GO:0097025 | MPP7-DLG1-LIN7 complex(GO:0097025) |
| 0.0 | 0.1 | GO:0060187 | cell pole(GO:0060187) |
| 0.0 | 0.7 | GO:0005689 | U12-type spliceosomal complex(GO:0005689) |
| 0.0 | 0.1 | GO:0090498 | extrinsic component of Golgi membrane(GO:0090498) |
| 0.0 | 0.4 | GO:0097136 | Bcl-2 family protein complex(GO:0097136) |
| 0.0 | 0.2 | GO:1990796 | photoreceptor cell terminal bouton(GO:1990796) |
| 0.0 | 0.7 | GO:0031045 | dense core granule(GO:0031045) |
| 0.0 | 3.6 | GO:0022625 | cytosolic large ribosomal subunit(GO:0022625) |
| 0.0 | 0.3 | GO:0032777 | Piccolo NuA4 histone acetyltransferase complex(GO:0032777) |
| 0.0 | 0.2 | GO:0032299 | ribonuclease H2 complex(GO:0032299) |
| 0.0 | 0.2 | GO:0002177 | manchette(GO:0002177) |
| 0.0 | 0.3 | GO:1990761 | growth cone lamellipodium(GO:1990761) |
| 0.0 | 0.4 | GO:0098651 | basement membrane collagen trimer(GO:0098651) |
| 0.0 | 0.7 | GO:0005942 | phosphatidylinositol 3-kinase complex(GO:0005942) |
| 0.0 | 0.1 | GO:0032798 | Swi5-Sfr1 complex(GO:0032798) |
| 0.0 | 0.1 | GO:0097057 | TRAF2-GSTP1 complex(GO:0097057) |
| 0.0 | 0.1 | GO:0097196 | Shu complex(GO:0097196) |
| 0.0 | 0.2 | GO:0005854 | nascent polypeptide-associated complex(GO:0005854) |
| 0.0 | 0.2 | GO:0001405 | presequence translocase-associated import motor(GO:0001405) |
| 0.0 | 0.7 | GO:0030128 | clathrin coat of endocytic vesicle(GO:0030128) |
| 0.0 | 0.1 | GO:0070195 | growth hormone receptor complex(GO:0070195) |
| 0.0 | 0.3 | GO:0071144 | SMAD2-SMAD3 protein complex(GO:0071144) |
| 0.0 | 1.0 | GO:0033268 | node of Ranvier(GO:0033268) |
| 0.0 | 0.1 | GO:0034680 | integrin alpha10-beta1 complex(GO:0034680) |
| 0.0 | 0.2 | GO:1990130 | Iml1 complex(GO:1990130) |
| 0.0 | 0.1 | GO:0035189 | Rb-E2F complex(GO:0035189) |
| 0.0 | 0.3 | GO:0060171 | stereocilium membrane(GO:0060171) |
| 0.0 | 0.9 | GO:0080008 | Cul4-RING E3 ubiquitin ligase complex(GO:0080008) |
| 0.0 | 0.3 | GO:0031462 | Cul2-RING ubiquitin ligase complex(GO:0031462) |
| 0.0 | 0.3 | GO:0043203 | axon hillock(GO:0043203) |
| 0.0 | 0.1 | GO:0034365 | discoidal high-density lipoprotein particle(GO:0034365) |
| 0.0 | 0.1 | GO:0071149 | TEAD-2-YAP complex(GO:0071149) |
| 0.0 | 0.2 | GO:0005967 | mitochondrial pyruvate dehydrogenase complex(GO:0005967) |
| 0.0 | 0.6 | GO:0097342 | ripoptosome(GO:0097342) |
| 0.0 | 0.4 | GO:0046581 | intercellular canaliculus(GO:0046581) |
| 0.0 | 0.2 | GO:0005683 | U7 snRNP(GO:0005683) |
| 0.0 | 0.3 | GO:0033588 | Elongator holoenzyme complex(GO:0033588) |
| 0.0 | 1.3 | GO:0042571 | immunoglobulin complex, circulating(GO:0042571) |
| 0.0 | 0.5 | GO:0000815 | ESCRT III complex(GO:0000815) |
| 0.0 | 0.1 | GO:0005742 | mitochondrial outer membrane translocase complex(GO:0005742) |
| 0.0 | 1.8 | GO:0000315 | organellar large ribosomal subunit(GO:0000315) mitochondrial large ribosomal subunit(GO:0005762) |
| 0.0 | 0.1 | GO:0005606 | laminin-1 complex(GO:0005606) |
| 0.0 | 0.1 | GO:0033150 | cytoskeletal calyx(GO:0033150) |
| 0.0 | 0.1 | GO:0000814 | ESCRT II complex(GO:0000814) |
| 0.0 | 1.3 | GO:0048786 | presynaptic active zone(GO:0048786) |
| 0.0 | 0.7 | GO:0031307 | integral component of mitochondrial outer membrane(GO:0031307) |
| 0.0 | 0.8 | GO:0005763 | organellar small ribosomal subunit(GO:0000314) mitochondrial small ribosomal subunit(GO:0005763) |
| 0.0 | 0.3 | GO:0098643 | fibrillar collagen trimer(GO:0005583) banded collagen fibril(GO:0098643) |
| 0.0 | 0.1 | GO:0070876 | SOSS complex(GO:0070876) |
| 0.0 | 0.3 | GO:0005862 | muscle thin filament tropomyosin(GO:0005862) |
| 0.0 | 0.4 | GO:0000813 | ESCRT I complex(GO:0000813) |
| 0.0 | 0.2 | GO:0032280 | symmetric synapse(GO:0032280) |
| 0.0 | 1.7 | GO:0022626 | cytosolic ribosome(GO:0022626) |
| 0.0 | 0.4 | GO:0005665 | DNA-directed RNA polymerase II, core complex(GO:0005665) |
| 0.0 | 0.3 | GO:0044352 | pinosome(GO:0044352) macropinosome(GO:0044354) |
| 0.0 | 0.1 | GO:0009368 | endopeptidase Clp complex(GO:0009368) |
| 0.0 | 0.4 | GO:0005736 | DNA-directed RNA polymerase I complex(GO:0005736) |
| 0.0 | 0.3 | GO:0016593 | Cdc73/Paf1 complex(GO:0016593) |
| 0.0 | 0.3 | GO:0000445 | THO complex(GO:0000347) THO complex part of transcription export complex(GO:0000445) |
| 0.0 | 0.1 | GO:1902937 | inward rectifier potassium channel complex(GO:1902937) |
| 0.0 | 0.1 | GO:0070931 | Golgi-associated vesicle lumen(GO:0070931) |
| 0.0 | 0.3 | GO:0043240 | Fanconi anaemia nuclear complex(GO:0043240) |
| 0.0 | 0.1 | GO:0070557 | PCNA-p21 complex(GO:0070557) |
| 0.0 | 0.1 | GO:0032311 | angiogenin-PRI complex(GO:0032311) |
| 0.0 | 0.1 | GO:0005873 | plus-end kinesin complex(GO:0005873) |
| 0.0 | 0.1 | GO:1990246 | uniplex complex(GO:1990246) |
| 0.0 | 0.2 | GO:0000346 | transcription export complex(GO:0000346) |
| 0.0 | 0.3 | GO:0045009 | melanosome membrane(GO:0033162) chitosome(GO:0045009) |
| 0.0 | 0.4 | GO:0035102 | PRC1 complex(GO:0035102) |
| 0.0 | 0.1 | GO:0000444 | MIS12/MIND type complex(GO:0000444) |
| 0.0 | 0.4 | GO:0031588 | nucleotide-activated protein kinase complex(GO:0031588) |
| 0.0 | 0.3 | GO:0017146 | NMDA selective glutamate receptor complex(GO:0017146) |
| 0.0 | 0.2 | GO:0036157 | outer dynein arm(GO:0036157) |
| 0.0 | 0.1 | GO:0032144 | 4-aminobutyrate transaminase complex(GO:0032144) |
| 0.0 | 0.1 | GO:0032133 | chromosome passenger complex(GO:0032133) |
| 0.0 | 0.1 | GO:0070552 | BRISC complex(GO:0070552) |
| 0.0 | 0.1 | GO:0000408 | EKC/KEOPS complex(GO:0000408) |
| 0.0 | 0.7 | GO:0005669 | transcription factor TFIID complex(GO:0005669) |
| 0.0 | 0.4 | GO:0031235 | intrinsic component of the cytoplasmic side of the plasma membrane(GO:0031235) |
| 0.0 | 0.1 | GO:0034274 | Atg12-Atg5-Atg16 complex(GO:0034274) |
| 0.0 | 0.3 | GO:0005839 | proteasome core complex(GO:0005839) |
| 0.0 | 0.2 | GO:0031209 | SCAR complex(GO:0031209) |
| 0.0 | 0.5 | GO:0016591 | DNA-directed RNA polymerase II, holoenzyme(GO:0016591) |
| 0.0 | 0.2 | GO:0005750 | mitochondrial respiratory chain complex III(GO:0005750) respiratory chain complex III(GO:0045275) |
| 0.0 | 0.4 | GO:0043186 | P granule(GO:0043186) pole plasm(GO:0045495) germ plasm(GO:0060293) |
| 0.0 | 0.2 | GO:0016600 | flotillin complex(GO:0016600) |
| 0.0 | 0.0 | GO:0030891 | VCB complex(GO:0030891) |
| 0.0 | 0.3 | GO:1990907 | beta-catenin-TCF complex(GO:1990907) |
| 0.0 | 1.0 | GO:0031907 | peroxisomal matrix(GO:0005782) microbody lumen(GO:0031907) |
| 0.0 | 0.7 | GO:0044298 | neuronal cell body membrane(GO:0032809) cell body membrane(GO:0044298) |
| 0.0 | 0.8 | GO:0008023 | transcription elongation factor complex(GO:0008023) |
| 0.0 | 0.2 | GO:0016602 | CCAAT-binding factor complex(GO:0016602) |
| 0.0 | 0.6 | GO:0032592 | integral component of mitochondrial membrane(GO:0032592) |
| 0.0 | 0.1 | GO:0017101 | aminoacyl-tRNA synthetase multienzyme complex(GO:0017101) |
| 0.0 | 0.1 | GO:1990589 | ATF4-CREB1 transcription factor complex(GO:1990589) |
| 0.0 | 0.1 | GO:0000243 | commitment complex(GO:0000243) |
| 0.0 | 0.5 | GO:0071564 | npBAF complex(GO:0071564) |
| 0.0 | 0.1 | GO:0008275 | gamma-tubulin small complex(GO:0008275) |
| 0.0 | 0.8 | GO:0045171 | intercellular bridge(GO:0045171) |
| 0.0 | 0.0 | GO:0044326 | dendritic spine neck(GO:0044326) |
| 0.0 | 0.1 | GO:0000835 | ER ubiquitin ligase complex(GO:0000835) Hrd1p ubiquitin ligase complex(GO:0000836) |
| 0.0 | 0.1 | GO:0035985 | senescence-associated heterochromatin focus(GO:0035985) |
| 0.0 | 0.2 | GO:0031932 | TORC2 complex(GO:0031932) |
| 0.0 | 0.2 | GO:0005890 | sodium:potassium-exchanging ATPase complex(GO:0005890) |
| 0.0 | 0.0 | GO:0002945 | cyclin K-CDK13 complex(GO:0002945) |
| 0.0 | 0.1 | GO:0036128 | CatSper complex(GO:0036128) |
| 0.0 | 1.2 | GO:0005758 | mitochondrial intermembrane space(GO:0005758) |
| 0.0 | 0.5 | GO:0000159 | protein phosphatase type 2A complex(GO:0000159) |
| 0.0 | 0.0 | GO:0015934 | large ribosomal subunit(GO:0015934) |
| 0.0 | 0.1 | GO:0005713 | recombination nodule(GO:0005713) |
| 0.0 | 0.1 | GO:0000015 | phosphopyruvate hydratase complex(GO:0000015) |
| 0.0 | 1.4 | GO:0090575 | RNA polymerase II transcription factor complex(GO:0090575) |
| 0.0 | 0.1 | GO:0071141 | SMAD protein complex(GO:0071141) |
| 0.0 | 0.1 | GO:0005688 | U6 snRNP(GO:0005688) |
| 0.0 | 0.1 | GO:0033178 | proton-transporting two-sector ATPase complex, catalytic domain(GO:0033178) |
| 0.0 | 0.0 | GO:0097182 | protein C inhibitor-TMPRSS7 complex(GO:0036024) protein C inhibitor-TMPRSS11E complex(GO:0036025) protein C inhibitor-PLAT complex(GO:0036026) protein C inhibitor-PLAU complex(GO:0036027) protein C inhibitor-thrombin complex(GO:0036028) protein C inhibitor-KLK3 complex(GO:0036029) protein C inhibitor-plasma kallikrein complex(GO:0036030) protease inhibitor complex(GO:0097179) serine protease inhibitor complex(GO:0097180) protein C inhibitor-coagulation factor V complex(GO:0097181) protein C inhibitor-coagulation factor Xa complex(GO:0097182) protein C inhibitor-coagulation factor XI complex(GO:0097183) |
| 0.0 | 0.1 | GO:0098837 | postsynaptic recycling endosome(GO:0098837) |
| 0.0 | 0.3 | GO:0016471 | vacuolar proton-transporting V-type ATPase complex(GO:0016471) |
| 0.0 | 0.2 | GO:0030123 | AP-3 adaptor complex(GO:0030123) |
| 0.0 | 0.0 | GO:0005744 | mitochondrial inner membrane presequence translocase complex(GO:0005744) |
| 0.0 | 0.2 | GO:0014731 | spectrin-associated cytoskeleton(GO:0014731) |
| 0.0 | 0.2 | GO:0005845 | mRNA cap binding complex(GO:0005845) |
| 0.0 | 0.1 | GO:0002169 | 3-methylcrotonyl-CoA carboxylase complex, mitochondrial(GO:0002169) methylcrotonoyl-CoA carboxylase complex(GO:1905202) |
| 0.0 | 0.0 | GO:0036284 | tubulobulbar complex(GO:0036284) |
Gene overrepresentation in molecular function category:
| Log-likelihood per target | Total log-likelihood | Term | Description |
|---|---|---|---|
| 0.3 | 1.5 | GO:0060961 | phospholipase D inhibitor activity(GO:0060961) |
| 0.2 | 0.7 | GO:0050698 | proteoglycan sulfotransferase activity(GO:0050698) |
| 0.2 | 0.2 | GO:0004031 | aldehyde oxidase activity(GO:0004031) |
| 0.2 | 0.7 | GO:0005017 | platelet-derived growth factor-activated receptor activity(GO:0005017) |
| 0.2 | 1.0 | GO:0086062 | voltage-gated sodium channel activity involved in Purkinje myocyte action potential(GO:0086062) |
| 0.2 | 0.6 | GO:0004958 | prostaglandin F receptor activity(GO:0004958) |
| 0.2 | 1.1 | GO:0018479 | benzaldehyde dehydrogenase (NAD+) activity(GO:0018479) |
| 0.2 | 0.5 | GO:0019150 | D-ribulokinase activity(GO:0019150) |
| 0.2 | 0.5 | GO:0003826 | alpha-ketoacid dehydrogenase activity(GO:0003826) 3-methyl-2-oxobutanoate dehydrogenase (2-methylpropanoyl-transferring) activity(GO:0003863) |
| 0.2 | 0.6 | GO:0004852 | uroporphyrinogen-III synthase activity(GO:0004852) |
| 0.2 | 0.5 | GO:0001596 | angiotensin type I receptor activity(GO:0001596) |
| 0.2 | 1.1 | GO:0004499 | N,N-dimethylaniline monooxygenase activity(GO:0004499) |
| 0.2 | 0.8 | GO:0005219 | ryanodine-sensitive calcium-release channel activity(GO:0005219) |
| 0.1 | 0.6 | GO:0002046 | opsin binding(GO:0002046) |
| 0.1 | 0.7 | GO:0016454 | serine C-palmitoyltransferase activity(GO:0004758) C-palmitoyltransferase activity(GO:0016454) |
| 0.1 | 0.4 | GO:0004662 | CAAX-protein geranylgeranyltransferase activity(GO:0004662) |
| 0.1 | 0.8 | GO:0016314 | phosphatidylinositol-3,4,5-trisphosphate 3-phosphatase activity(GO:0016314) |
| 0.1 | 0.9 | GO:0042296 | ISG15 transferase activity(GO:0042296) |
| 0.1 | 0.5 | GO:0004853 | uroporphyrinogen decarboxylase activity(GO:0004853) |
| 0.1 | 0.5 | GO:0004667 | prostaglandin-D synthase activity(GO:0004667) |
| 0.1 | 0.4 | GO:0015203 | polyamine transmembrane transporter activity(GO:0015203) putrescine transmembrane transporter activity(GO:0015489) |
| 0.1 | 0.1 | GO:0008269 | JAK pathway signal transduction adaptor activity(GO:0008269) |
| 0.1 | 0.4 | GO:0031716 | calcitonin receptor binding(GO:0031716) |
| 0.1 | 0.4 | GO:0047888 | fatty acid peroxidase activity(GO:0047888) |
| 0.1 | 0.6 | GO:0052847 | endopolyphosphatase activity(GO:0000298) diphosphoinositol-polyphosphate diphosphatase activity(GO:0008486) bis(5'-adenosyl)-hexaphosphatase activity(GO:0034431) bis(5'-adenosyl)-pentaphosphatase activity(GO:0034432) inositol diphosphate tetrakisphosphate diphosphatase activity(GO:0052840) inositol bisdiphosphate tetrakisphosphate diphosphatase activity(GO:0052841) inositol diphosphate pentakisphosphate diphosphatase activity(GO:0052842) inositol-1-diphosphate-2,3,4,5,6-pentakisphosphate diphosphatase activity(GO:0052843) inositol-3-diphosphate-1,2,4,5,6-pentakisphosphate diphosphatase activity(GO:0052844) inositol-5-diphosphate-1,2,3,4,6-pentakisphosphate diphosphatase activity(GO:0052845) inositol-1,5-bisdiphosphate-2,3,4,6-tetrakisphosphate 1-diphosphatase activity(GO:0052846) inositol-1,5-bisdiphosphate-2,3,4,6-tetrakisphosphate 5-diphosphatase activity(GO:0052847) inositol-3,5-bisdiphosphate-2,3,4,6-tetrakisphosphate 5-diphosphatase activity(GO:0052848) |
| 0.1 | 1.0 | GO:0032190 | acrosin binding(GO:0032190) |
| 0.1 | 0.4 | GO:0004909 | interleukin-1, Type I, activating receptor activity(GO:0004909) |
| 0.1 | 1.5 | GO:1990459 | transferrin receptor binding(GO:1990459) |
| 0.1 | 0.9 | GO:0030160 | GKAP/Homer scaffold activity(GO:0030160) |
| 0.1 | 0.3 | GO:0060422 | peptidyl-dipeptidase inhibitor activity(GO:0060422) |
| 0.1 | 0.4 | GO:0004074 | biliverdin reductase activity(GO:0004074) |
| 0.1 | 0.4 | GO:0052839 | inositol 5-diphosphate pentakisphosphate 5-kinase activity(GO:0052836) inositol diphosphate tetrakisphosphate kinase activity(GO:0052839) |
| 0.1 | 1.7 | GO:0036374 | glutathione hydrolase activity(GO:0036374) |
| 0.1 | 0.5 | GO:0004167 | dopachrome isomerase activity(GO:0004167) |
| 0.1 | 0.4 | GO:0004419 | hydroxymethylglutaryl-CoA lyase activity(GO:0004419) |
| 0.1 | 0.4 | GO:0001069 | regulatory region RNA binding(GO:0001069) |
| 0.1 | 0.3 | GO:0030305 | heparanase activity(GO:0030305) |
| 0.1 | 0.8 | GO:0043426 | MRF binding(GO:0043426) |
| 0.1 | 0.3 | GO:0015140 | malate transmembrane transporter activity(GO:0015140) |
| 0.1 | 0.4 | GO:0032767 | copper-dependent protein binding(GO:0032767) |
| 0.1 | 0.3 | GO:0052870 | tocopherol omega-hydroxylase activity(GO:0052870) alpha-tocopherol omega-hydroxylase activity(GO:0052871) 20-hydroxy-leukotriene B4 omega oxidase activity(GO:0097258) 20-aldehyde-leukotriene B4 20-monooxygenase activity(GO:0097259) |
| 0.1 | 0.3 | GO:0000702 | oxidized base lesion DNA N-glycosylase activity(GO:0000702) |
| 0.1 | 0.2 | GO:0047783 | steroid 11-beta-monooxygenase activity(GO:0004507) corticosterone 18-monooxygenase activity(GO:0047783) |
| 0.1 | 2.1 | GO:0005528 | macrolide binding(GO:0005527) FK506 binding(GO:0005528) |
| 0.1 | 0.8 | GO:0046935 | 1-phosphatidylinositol-3-kinase regulator activity(GO:0046935) |
| 0.1 | 0.2 | GO:0004750 | ribulose-phosphate 3-epimerase activity(GO:0004750) |
| 0.1 | 0.2 | GO:0005150 | interleukin-1, Type I receptor binding(GO:0005150) |
| 0.1 | 0.3 | GO:0042132 | fructose 1,6-bisphosphate 1-phosphatase activity(GO:0042132) |
| 0.1 | 0.2 | GO:0004096 | catalase activity(GO:0004096) |
| 0.1 | 0.2 | GO:0032090 | Pyrin domain binding(GO:0032090) |
| 0.1 | 0.6 | GO:0001665 | alpha-N-acetylgalactosaminide alpha-2,6-sialyltransferase activity(GO:0001665) |
| 0.1 | 0.6 | GO:0004024 | alcohol dehydrogenase activity, zinc-dependent(GO:0004024) |
| 0.1 | 0.2 | GO:0045550 | geranylgeranyl reductase activity(GO:0045550) |
| 0.1 | 0.6 | GO:0030942 | endoplasmic reticulum signal peptide binding(GO:0030942) |
| 0.1 | 0.7 | GO:0008420 | CTD phosphatase activity(GO:0008420) |
| 0.1 | 0.2 | GO:0071209 | U7 snRNA binding(GO:0071209) |
| 0.1 | 0.7 | GO:0016721 | superoxide dismutase activity(GO:0004784) oxidoreductase activity, acting on superoxide radicals as acceptor(GO:0016721) |
| 0.1 | 0.3 | GO:0004647 | phosphoserine phosphatase activity(GO:0004647) |
| 0.1 | 0.5 | GO:0051373 | FATZ binding(GO:0051373) |
| 0.1 | 0.4 | GO:0044729 | hemi-methylated DNA-binding(GO:0044729) |
| 0.1 | 0.2 | GO:0030156 | benzodiazepine receptor binding(GO:0030156) |
| 0.1 | 0.3 | GO:0015057 | thrombin receptor activity(GO:0015057) |
| 0.1 | 1.1 | GO:0005132 | type I interferon receptor binding(GO:0005132) |
| 0.1 | 1.9 | GO:0005212 | structural constituent of eye lens(GO:0005212) |
| 0.1 | 0.5 | GO:0015277 | kainate selective glutamate receptor activity(GO:0015277) |
| 0.1 | 0.2 | GO:0016497 | substance K receptor activity(GO:0016497) |
| 0.1 | 0.5 | GO:0008048 | calcium sensitive guanylate cyclase activator activity(GO:0008048) |
| 0.1 | 0.2 | GO:0070538 | oleic acid binding(GO:0070538) |
| 0.1 | 0.3 | GO:0032038 | myosin II heavy chain binding(GO:0032038) |
| 0.1 | 0.1 | GO:0004660 | protein farnesyltransferase activity(GO:0004660) |
| 0.1 | 0.2 | GO:0004165 | dodecenoyl-CoA delta-isomerase activity(GO:0004165) |
| 0.1 | 0.2 | GO:0044594 | 3alpha,7alpha,12alpha-trihydroxy-5beta-cholest-24-enoyl-CoA hydratase activity(GO:0033989) 17-beta-hydroxysteroid dehydrogenase (NAD+) activity(GO:0044594) |
| 0.1 | 0.7 | GO:0008607 | phosphorylase kinase regulator activity(GO:0008607) |
| 0.1 | 0.2 | GO:0016639 | oxidoreductase activity, acting on the CH-NH2 group of donors, NAD or NADP as acceptor(GO:0016639) |
| 0.1 | 0.3 | GO:0004530 | deoxyribonuclease I activity(GO:0004530) |
| 0.1 | 0.3 | GO:0031691 | alpha-1A adrenergic receptor binding(GO:0031691) follicle-stimulating hormone receptor binding(GO:0031762) |
| 0.1 | 0.3 | GO:0003998 | acylphosphatase activity(GO:0003998) |
| 0.1 | 0.2 | GO:0004911 | interleukin-2 receptor activity(GO:0004911) interleukin-2 binding(GO:0019976) |
| 0.1 | 0.3 | GO:0042610 | CD8 receptor binding(GO:0042610) |
| 0.1 | 1.1 | GO:0004862 | cAMP-dependent protein kinase inhibitor activity(GO:0004862) |
| 0.1 | 0.3 | GO:0031708 | endothelin B receptor binding(GO:0031708) |
| 0.1 | 0.3 | GO:0004090 | carbonyl reductase (NADPH) activity(GO:0004090) |
| 0.1 | 0.7 | GO:0031386 | protein tag(GO:0031386) |
| 0.1 | 0.1 | GO:0070404 | NADH binding(GO:0070404) |
| 0.1 | 0.3 | GO:0001515 | opioid peptide activity(GO:0001515) |
| 0.0 | 0.4 | GO:0048495 | Roundabout binding(GO:0048495) |
| 0.0 | 0.1 | GO:0050613 | delta14-sterol reductase activity(GO:0050613) |
| 0.0 | 0.2 | GO:0019912 | cyclin-dependent protein kinase activating kinase activity(GO:0019912) |
| 0.0 | 0.1 | GO:0010861 | thyroid hormone receptor activator activity(GO:0010861) thyroid hormone receptor coactivator activity(GO:0030375) |
| 0.0 | 0.2 | GO:0047045 | testosterone 17-beta-dehydrogenase (NADP+) activity(GO:0047045) |
| 0.0 | 1.4 | GO:0008093 | cytoskeletal adaptor activity(GO:0008093) |
| 0.0 | 0.3 | GO:0031735 | CCR10 chemokine receptor binding(GO:0031735) |
| 0.0 | 0.2 | GO:0023024 | MHC class I protein complex binding(GO:0023024) |
| 0.0 | 0.2 | GO:0005330 | dopamine:sodium symporter activity(GO:0005330) |
| 0.0 | 0.3 | GO:0031962 | mineralocorticoid receptor binding(GO:0031962) |
| 0.0 | 0.4 | GO:0042608 | T cell receptor binding(GO:0042608) |
| 0.0 | 0.2 | GO:0043891 | glyceraldehyde-3-phosphate dehydrogenase (NAD+) (phosphorylating) activity(GO:0004365) glyceraldehyde-3-phosphate dehydrogenase (NAD(P)+) (phosphorylating) activity(GO:0043891) |
| 0.0 | 0.4 | GO:0089720 | caspase binding(GO:0089720) |
| 0.0 | 0.0 | GO:0005128 | erythropoietin receptor binding(GO:0005128) |
| 0.0 | 0.6 | GO:0030215 | semaphorin receptor binding(GO:0030215) |
| 0.0 | 0.4 | GO:0001162 | RNA polymerase II intronic transcription regulatory region sequence-specific DNA binding(GO:0001162) |
| 0.0 | 0.1 | GO:0033842 | N-acetyl-beta-glucosaminyl-glycoprotein 4-beta-N-acetylgalactosaminyltransferase activity(GO:0033842) |
| 0.0 | 0.2 | GO:0070735 | protein-glycine ligase activity(GO:0070735) |
| 0.0 | 0.2 | GO:0008453 | alanine-glyoxylate transaminase activity(GO:0008453) |
| 0.0 | 0.3 | GO:0016681 | ubiquinol-cytochrome-c reductase activity(GO:0008121) oxidoreductase activity, acting on diphenols and related substances as donors, cytochrome as acceptor(GO:0016681) |
| 0.0 | 0.6 | GO:0017162 | aryl hydrocarbon receptor binding(GO:0017162) |
| 0.0 | 0.1 | GO:0035731 | S-nitrosoglutathione binding(GO:0035730) dinitrosyl-iron complex binding(GO:0035731) |
| 0.0 | 0.0 | GO:0004874 | aryl hydrocarbon receptor activity(GO:0004874) |
| 0.0 | 1.0 | GO:0008191 | metalloendopeptidase inhibitor activity(GO:0008191) |
| 0.0 | 0.4 | GO:0004969 | histamine receptor activity(GO:0004969) |
| 0.0 | 0.0 | GO:0031753 | endothelial differentiation G-protein coupled receptor binding(GO:0031753) Edg-2 lysophosphatidic acid receptor binding(GO:0031755) |
| 0.0 | 1.2 | GO:0070003 | threonine-type endopeptidase activity(GO:0004298) threonine-type peptidase activity(GO:0070003) |
| 0.0 | 0.2 | GO:1904408 | dihydronicotinamide riboside quinone reductase activity(GO:0001512) melatonin binding(GO:1904408) |
| 0.0 | 0.3 | GO:0016403 | dimethylargininase activity(GO:0016403) |
| 0.0 | 0.2 | GO:0070051 | fibrinogen binding(GO:0070051) |
| 0.0 | 0.2 | GO:0008449 | N-acetylglucosamine-6-sulfatase activity(GO:0008449) |
| 0.0 | 0.4 | GO:0015038 | glutathione disulfide oxidoreductase activity(GO:0015038) |
| 0.0 | 0.3 | GO:0001025 | RNA polymerase III transcription factor binding(GO:0001025) |
| 0.0 | 0.2 | GO:0004359 | glutaminase activity(GO:0004359) |
| 0.0 | 0.2 | GO:0004022 | alcohol dehydrogenase (NAD) activity(GO:0004022) |
| 0.0 | 0.3 | GO:0001161 | intronic transcription regulatory region sequence-specific DNA binding(GO:0001161) intronic transcription regulatory region DNA binding(GO:0044213) |
| 0.0 | 0.2 | GO:0004337 | dimethylallyltranstransferase activity(GO:0004161) geranyltranstransferase activity(GO:0004337) |
| 0.0 | 0.5 | GO:0030020 | extracellular matrix structural constituent conferring tensile strength(GO:0030020) |
| 0.0 | 0.3 | GO:1990599 | 3' overhang single-stranded DNA endodeoxyribonuclease activity(GO:1990599) |
| 0.0 | 0.2 | GO:0004487 | methylenetetrahydrofolate dehydrogenase (NAD+) activity(GO:0004487) |
| 0.0 | 0.1 | GO:0004339 | glucan 1,4-alpha-glucosidase activity(GO:0004339) |
| 0.0 | 0.2 | GO:0034353 | RNA pyrophosphohydrolase activity(GO:0034353) |
| 0.0 | 0.3 | GO:0001849 | complement component C1q binding(GO:0001849) |
| 0.0 | 0.2 | GO:0097643 | amylin receptor activity(GO:0097643) |
| 0.0 | 0.1 | GO:0070259 | tyrosyl-DNA phosphodiesterase activity(GO:0070259) |
| 0.0 | 0.1 | GO:0004464 | leukotriene-C4 synthase activity(GO:0004464) |
| 0.0 | 0.7 | GO:0017154 | semaphorin receptor activity(GO:0017154) |
| 0.0 | 0.1 | GO:0004618 | phosphoglycerate kinase activity(GO:0004618) |
| 0.0 | 0.1 | GO:0005148 | prolactin receptor binding(GO:0005148) |
| 0.0 | 0.2 | GO:0004839 | ubiquitin activating enzyme activity(GO:0004839) |
| 0.0 | 1.4 | GO:0017075 | syntaxin-1 binding(GO:0017075) |
| 0.0 | 0.1 | GO:0004556 | alpha-amylase activity(GO:0004556) amylase activity(GO:0016160) |
| 0.0 | 0.2 | GO:0004013 | adenosylhomocysteinase activity(GO:0004013) trialkylsulfonium hydrolase activity(GO:0016802) |
| 0.0 | 0.1 | GO:0016649 | electron-transferring-flavoprotein dehydrogenase activity(GO:0004174) oxidoreductase activity, acting on the CH-NH group of donors, quinone or similar compound as acceptor(GO:0016649) |
| 0.0 | 0.3 | GO:0019788 | NEDD8 transferase activity(GO:0019788) |
| 0.0 | 0.2 | GO:1990050 | phosphatidic acid transporter activity(GO:1990050) |
| 0.0 | 0.1 | GO:0005173 | stem cell factor receptor binding(GO:0005173) |
| 0.0 | 0.9 | GO:0004697 | protein kinase C activity(GO:0004697) |
| 0.0 | 0.7 | GO:0070513 | death domain binding(GO:0070513) |
| 0.0 | 0.1 | GO:0008073 | ornithine decarboxylase inhibitor activity(GO:0008073) |
| 0.0 | 0.4 | GO:0097322 | 7SK snRNA binding(GO:0097322) |
| 0.0 | 0.1 | GO:0052794 | exo-alpha-(2->3)-sialidase activity(GO:0052794) exo-alpha-(2->6)-sialidase activity(GO:0052795) exo-alpha-(2->8)-sialidase activity(GO:0052796) |
| 0.0 | 0.2 | GO:0008273 | calcium, potassium:sodium antiporter activity(GO:0008273) |
| 0.0 | 0.7 | GO:0035615 | clathrin adaptor activity(GO:0035615) endocytic adaptor activity(GO:0098748) |
| 0.0 | 0.2 | GO:0004800 | thyroxine 5'-deiodinase activity(GO:0004800) |
| 0.0 | 0.1 | GO:0030172 | troponin C binding(GO:0030172) |
| 0.0 | 0.1 | GO:0035514 | DNA demethylase activity(GO:0035514) |
| 0.0 | 0.1 | GO:0004345 | glucose-6-phosphate dehydrogenase activity(GO:0004345) |
| 0.0 | 0.9 | GO:0005523 | tropomyosin binding(GO:0005523) |
| 0.0 | 0.2 | GO:0030060 | L-malate dehydrogenase activity(GO:0030060) |
| 0.0 | 0.5 | GO:0042609 | CD4 receptor binding(GO:0042609) |
| 0.0 | 0.1 | GO:0046577 | long-chain-alcohol oxidase activity(GO:0046577) |
| 0.0 | 0.5 | GO:0047429 | nucleoside-triphosphate diphosphatase activity(GO:0047429) |
| 0.0 | 0.2 | GO:0004392 | heme oxygenase (decyclizing) activity(GO:0004392) |
| 0.0 | 1.2 | GO:0004364 | glutathione transferase activity(GO:0004364) |
| 0.0 | 7.8 | GO:0003735 | structural constituent of ribosome(GO:0003735) |
| 0.0 | 0.2 | GO:0016714 | oxidoreductase activity, acting on paired donors, with incorporation or reduction of molecular oxygen, reduced pteridine as one donor, and incorporation of one atom of oxygen(GO:0016714) |
| 0.0 | 0.1 | GO:0046592 | polyamine oxidase activity(GO:0046592) spermine:oxygen oxidoreductase (spermidine-forming) activity(GO:0052901) |
| 0.0 | 0.1 | GO:0047391 | alkylglycerophosphoethanolamine phosphodiesterase activity(GO:0047391) |
| 0.0 | 0.1 | GO:0004056 | argininosuccinate lyase activity(GO:0004056) |
| 0.0 | 0.1 | GO:0004047 | aminomethyltransferase activity(GO:0004047) |
| 0.0 | 0.1 | GO:0003829 | beta-1,3-galactosyl-O-glycosyl-glycoprotein beta-1,6-N-acetylglucosaminyltransferase activity(GO:0003829) |
| 0.0 | 0.1 | GO:0004711 | ribosomal protein S6 kinase activity(GO:0004711) |
| 0.0 | 0.2 | GO:0004882 | androgen receptor activity(GO:0004882) |
| 0.0 | 0.1 | GO:0061714 | folic acid receptor activity(GO:0061714) |
| 0.0 | 0.1 | GO:0008893 | guanosine-3',5'-bis(diphosphate) 3'-diphosphatase activity(GO:0008893) diphosphoric monoester hydrolase activity(GO:0016794) |
| 0.0 | 0.5 | GO:0019911 | structural constituent of myelin sheath(GO:0019911) |
| 0.0 | 0.1 | GO:0005124 | scavenger receptor binding(GO:0005124) |
| 0.0 | 0.0 | GO:0047115 | trans-1,2-dihydrobenzene-1,2-diol dehydrogenase activity(GO:0047115) |
| 0.0 | 0.1 | GO:0003987 | acetate-CoA ligase activity(GO:0003987) |
| 0.0 | 0.2 | GO:0003960 | NADPH:quinone reductase activity(GO:0003960) |
| 0.0 | 0.1 | GO:0003858 | 3-hydroxybutyrate dehydrogenase activity(GO:0003858) |
| 0.0 | 0.2 | GO:1904929 | coreceptor activity involved in Wnt signaling pathway, planar cell polarity pathway(GO:1904929) |
| 0.0 | 0.8 | GO:0051537 | 2 iron, 2 sulfur cluster binding(GO:0051537) |
| 0.0 | 0.5 | GO:0043522 | leucine zipper domain binding(GO:0043522) |
| 0.0 | 0.3 | GO:0030882 | lipid antigen binding(GO:0030882) endogenous lipid antigen binding(GO:0030883) exogenous lipid antigen binding(GO:0030884) |
| 0.0 | 1.0 | GO:0070742 | C2H2 zinc finger domain binding(GO:0070742) |
| 0.0 | 0.5 | GO:0008198 | ferrous iron binding(GO:0008198) |
| 0.0 | 0.1 | GO:0016404 | 15-hydroxyprostaglandin dehydrogenase (NAD+) activity(GO:0016404) |
| 0.0 | 0.1 | GO:0004792 | thiosulfate sulfurtransferase activity(GO:0004792) |
| 0.0 | 0.2 | GO:0015307 | drug:proton antiporter activity(GO:0015307) |
| 0.0 | 0.2 | GO:0004740 | pyruvate dehydrogenase (acetyl-transferring) kinase activity(GO:0004740) |
| 0.0 | 0.1 | GO:0004528 | phosphodiesterase I activity(GO:0004528) |
| 0.0 | 0.2 | GO:0031013 | troponin I binding(GO:0031013) |
| 0.0 | 1.0 | GO:0004550 | nucleoside diphosphate kinase activity(GO:0004550) |
| 0.0 | 0.1 | GO:0047288 | monosialoganglioside sialyltransferase activity(GO:0047288) |
| 0.0 | 0.1 | GO:0061676 | importin-alpha family protein binding(GO:0061676) |
| 0.0 | 0.1 | GO:0015141 | succinate transmembrane transporter activity(GO:0015141) |
| 0.0 | 0.1 | GO:0031780 | corticotropin hormone receptor binding(GO:0031780) type 5 melanocortin receptor binding(GO:0031783) |
| 0.0 | 0.2 | GO:0005143 | interleukin-12 receptor binding(GO:0005143) |
| 0.0 | 0.1 | GO:0098519 | nucleotide phosphatase activity, acting on free nucleotides(GO:0098519) |
| 0.0 | 0.1 | GO:0008426 | protein kinase C inhibitor activity(GO:0008426) |
| 0.0 | 0.8 | GO:0097200 | cysteine-type endopeptidase activity involved in execution phase of apoptosis(GO:0097200) |
| 0.0 | 0.1 | GO:0031728 | CCR3 chemokine receptor binding(GO:0031728) |
| 0.0 | 0.2 | GO:0048101 | calcium- and calmodulin-regulated 3',5'-cyclic-GMP phosphodiesterase activity(GO:0048101) |
| 0.0 | 0.6 | GO:0017160 | Ral GTPase binding(GO:0017160) |
| 0.0 | 0.1 | GO:0008160 | protein tyrosine phosphatase activator activity(GO:0008160) |
| 0.0 | 0.1 | GO:0004087 | carbamoyl-phosphate synthase (ammonia) activity(GO:0004087) carbamoyl-phosphate synthase (glutamine-hydrolyzing) activity(GO:0004088) |
| 0.0 | 0.1 | GO:0052739 | phosphatidylserine 1-acylhydrolase activity(GO:0052739) |
| 0.0 | 0.6 | GO:0047617 | acyl-CoA hydrolase activity(GO:0047617) |
| 0.0 | 0.3 | GO:0097493 | structural molecule activity conferring elasticity(GO:0097493) |
| 0.0 | 0.3 | GO:0060228 | phosphatidylcholine-sterol O-acyltransferase activator activity(GO:0060228) |
| 0.0 | 0.4 | GO:0031681 | G-protein beta-subunit binding(GO:0031681) |
| 0.0 | 0.1 | GO:0004531 | deoxyribonuclease II activity(GO:0004531) |
| 0.0 | 3.0 | GO:0004860 | protein kinase inhibitor activity(GO:0004860) |
| 0.0 | 0.1 | GO:0015319 | sodium:inorganic phosphate symporter activity(GO:0015319) |
| 0.0 | 0.2 | GO:0008553 | hydrogen-exporting ATPase activity, phosphorylative mechanism(GO:0008553) |
| 0.0 | 1.4 | GO:0034987 | immunoglobulin receptor binding(GO:0034987) |
| 0.0 | 0.1 | GO:0008940 | nitrate reductase activity(GO:0008940) molybdopterin adenylyltransferase activity(GO:0061598) molybdopterin molybdotransferase activity(GO:0061599) |
| 0.0 | 0.2 | GO:0004322 | ferroxidase activity(GO:0004322) oxidoreductase activity, oxidizing metal ions, oxygen as acceptor(GO:0016724) |
| 0.0 | 0.2 | GO:0004045 | aminoacyl-tRNA hydrolase activity(GO:0004045) |
| 0.0 | 0.1 | GO:0003860 | 3-hydroxyisobutyryl-CoA hydrolase activity(GO:0003860) |
| 0.0 | 0.2 | GO:0003988 | acetyl-CoA C-acyltransferase activity(GO:0003988) |
| 0.0 | 0.1 | GO:0097001 | ceramide binding(GO:0097001) |
| 0.0 | 0.1 | GO:0004994 | somatostatin receptor activity(GO:0004994) |
| 0.0 | 0.1 | GO:0004471 | malate dehydrogenase (decarboxylating) (NAD+) activity(GO:0004471) malate dehydrogenase (decarboxylating) (NADP+) activity(GO:0004473) |
| 0.0 | 0.1 | GO:0050051 | leukotriene-B4 20-monooxygenase activity(GO:0050051) |
| 0.0 | 0.2 | GO:0005168 | neurotrophin TRKA receptor binding(GO:0005168) |
| 0.0 | 0.2 | GO:0061133 | endopeptidase activator activity(GO:0061133) |
| 0.0 | 0.1 | GO:0051120 | hepoxilin A3 synthase activity(GO:0051120) |
| 0.0 | 0.0 | GO:0017129 | triglyceride binding(GO:0017129) |
| 0.0 | 0.3 | GO:0046870 | cadmium ion binding(GO:0046870) |
| 0.0 | 0.4 | GO:0048156 | tau protein binding(GO:0048156) |
| 0.0 | 0.1 | GO:0004634 | phosphopyruvate hydratase activity(GO:0004634) |
| 0.0 | 0.7 | GO:0005521 | lamin binding(GO:0005521) |
| 0.0 | 0.1 | GO:0070004 | cysteine-type carboxypeptidase activity(GO:0016807) cysteine-type exopeptidase activity(GO:0070004) |
| 0.0 | 0.4 | GO:0031005 | filamin binding(GO:0031005) |
| 0.0 | 0.1 | GO:0004079 | biotin-[acetyl-CoA-carboxylase] ligase activity(GO:0004077) biotin-[methylcrotonoyl-CoA-carboxylase] ligase activity(GO:0004078) biotin-[methylmalonyl-CoA-carboxytransferase] ligase activity(GO:0004079) biotin-[propionyl-CoA-carboxylase (ATP-hydrolyzing)] ligase activity(GO:0004080) biotin-protein ligase activity(GO:0018271) |
| 0.0 | 0.4 | GO:0001054 | RNA polymerase I activity(GO:0001054) |
| 0.0 | 0.2 | GO:0016634 | oxidoreductase activity, acting on the CH-CH group of donors, oxygen as acceptor(GO:0016634) |
| 0.0 | 0.5 | GO:0031210 | phosphatidylcholine binding(GO:0031210) |
| 0.0 | 0.1 | GO:0102008 | cytosolic dipeptidase activity(GO:0102008) |
| 0.0 | 0.1 | GO:0008745 | N-acetylmuramoyl-L-alanine amidase activity(GO:0008745) |
| 0.0 | 0.1 | GO:0005006 | epidermal growth factor-activated receptor activity(GO:0005006) |
| 0.0 | 0.4 | GO:0000062 | fatty-acyl-CoA binding(GO:0000062) |
| 0.0 | 0.2 | GO:0004972 | NMDA glutamate receptor activity(GO:0004972) |
| 0.0 | 0.2 | GO:0004523 | RNA-DNA hybrid ribonuclease activity(GO:0004523) |
| 0.0 | 1.0 | GO:0005484 | SNAP receptor activity(GO:0005484) |
| 0.0 | 0.1 | GO:0030618 | transforming growth factor beta receptor, pathway-specific cytoplasmic mediator activity(GO:0030618) |
| 0.0 | 0.1 | GO:0003857 | 3-hydroxyacyl-CoA dehydrogenase activity(GO:0003857) |
| 0.0 | 0.0 | GO:0061628 | H3K27me3 modified histone binding(GO:0061628) |
| 0.0 | 0.3 | GO:0000774 | adenyl-nucleotide exchange factor activity(GO:0000774) |
| 0.0 | 0.2 | GO:0019136 | deoxynucleoside kinase activity(GO:0019136) |
| 0.0 | 0.1 | GO:0046848 | hydroxyapatite binding(GO:0046848) |
| 0.0 | 0.2 | GO:0019784 | NEDD8-specific protease activity(GO:0019784) |
| 0.0 | 0.3 | GO:0016846 | carbon-sulfur lyase activity(GO:0016846) |
| 0.0 | 0.6 | GO:0070300 | phosphatidic acid binding(GO:0070300) |
| 0.0 | 1.4 | GO:0070412 | R-SMAD binding(GO:0070412) |
| 0.0 | 0.1 | GO:0047635 | L-alanine:2-oxoglutarate aminotransferase activity(GO:0004021) alanine-oxo-acid transaminase activity(GO:0047635) |
| 0.0 | 0.4 | GO:0005522 | profilin binding(GO:0005522) |
| 0.0 | 0.1 | GO:0016503 | pheromone receptor activity(GO:0016503) |
| 0.0 | 0.1 | GO:0004609 | phosphatidylserine decarboxylase activity(GO:0004609) |
| 0.0 | 0.4 | GO:0001223 | transcription coactivator binding(GO:0001223) |
| 0.0 | 0.2 | GO:0044323 | retinoic acid-responsive element binding(GO:0044323) |
| 0.0 | 0.5 | GO:0005024 | transforming growth factor beta-activated receptor activity(GO:0005024) |
| 0.0 | 0.1 | GO:0043515 | kinetochore binding(GO:0043515) |
| 0.0 | 0.0 | GO:0008948 | oxaloacetate decarboxylase activity(GO:0008948) |
| 0.0 | 0.1 | GO:0042289 | MHC class II protein binding(GO:0042289) |
| 0.0 | 0.7 | GO:0003899 | DNA-directed RNA polymerase activity(GO:0003899) |
| 0.0 | 0.2 | GO:0001075 | transcription factor activity, RNA polymerase II core promoter sequence-specific binding involved in preinitiation complex assembly(GO:0001075) |
| 0.0 | 0.1 | GO:0051500 | D-aminoacyl-tRNA deacylase activity(GO:0051499) D-tyrosyl-tRNA(Tyr) deacylase activity(GO:0051500) |
| 0.0 | 0.3 | GO:0045504 | dynein heavy chain binding(GO:0045504) |
| 0.0 | 0.1 | GO:0030628 | pre-mRNA 3'-splice site binding(GO:0030628) |
| 0.0 | 0.1 | GO:0004769 | steroid delta-isomerase activity(GO:0004769) |
| 0.0 | 0.0 | GO:0004052 | arachidonate 12-lipoxygenase activity(GO:0004052) |
| 0.0 | 0.4 | GO:0004993 | G-protein coupled serotonin receptor activity(GO:0004993) |
| 0.0 | 0.2 | GO:0005000 | vasopressin receptor activity(GO:0005000) |
| 0.0 | 0.1 | GO:0003909 | DNA ligase activity(GO:0003909) DNA ligase (ATP) activity(GO:0003910) |
| 0.0 | 0.5 | GO:0051371 | muscle alpha-actinin binding(GO:0051371) |
| 0.0 | 0.6 | GO:0000983 | transcription factor activity, RNA polymerase II core promoter sequence-specific(GO:0000983) |
| 0.0 | 0.1 | GO:0015184 | L-cystine transmembrane transporter activity(GO:0015184) |
| 0.0 | 0.5 | GO:0050811 | GABA receptor binding(GO:0050811) |
| 0.0 | 0.0 | GO:0016623 | oxidoreductase activity, acting on the aldehyde or oxo group of donors, oxygen as acceptor(GO:0016623) |
| 0.0 | 0.1 | GO:0004140 | dephospho-CoA kinase activity(GO:0004140) |
| 0.0 | 0.1 | GO:0031727 | CCR2 chemokine receptor binding(GO:0031727) |
| 0.0 | 0.1 | GO:0008853 | exodeoxyribonuclease III activity(GO:0008853) |
| 0.0 | 0.1 | GO:0019166 | 2,4-dienoyl-CoA reductase (NADPH) activity(GO:0008670) trans-2-enoyl-CoA reductase (NADPH) activity(GO:0019166) |
| 0.0 | 0.1 | GO:0047298 | 4-aminobutyrate transaminase activity(GO:0003867) succinate-semialdehyde dehydrogenase binding(GO:0032145) (S)-3-amino-2-methylpropionate transaminase activity(GO:0047298) |
| 0.0 | 0.3 | GO:0050750 | low-density lipoprotein particle receptor binding(GO:0050750) |
| 0.0 | 0.1 | GO:0005350 | pyrimidine nucleobase transmembrane transporter activity(GO:0005350) |
| 0.0 | 1.3 | GO:0030971 | receptor tyrosine kinase binding(GO:0030971) |
| 0.0 | 0.1 | GO:0005119 | smoothened binding(GO:0005119) |
| 0.0 | 0.4 | GO:0019992 | diacylglycerol binding(GO:0019992) |
| 0.0 | 0.2 | GO:0008381 | mechanically-gated ion channel activity(GO:0008381) mechanically gated channel activity(GO:0022833) |
| 0.0 | 0.1 | GO:0004489 | methylenetetrahydrofolate reductase (NAD(P)H) activity(GO:0004489) |
| 0.0 | 0.1 | GO:0035248 | alpha-1,4-N-acetylgalactosaminyltransferase activity(GO:0035248) |
| 0.0 | 0.1 | GO:0003941 | L-serine ammonia-lyase activity(GO:0003941) |
| 0.0 | 0.1 | GO:0004803 | transposase activity(GO:0004803) |
| 0.0 | 0.1 | GO:0086006 | voltage-gated sodium channel activity involved in cardiac muscle cell action potential(GO:0086006) |
| 0.0 | 0.1 | GO:0031752 | D5 dopamine receptor binding(GO:0031752) |
| 0.0 | 0.3 | GO:0001965 | G-protein alpha-subunit binding(GO:0001965) |
| 0.0 | 0.3 | GO:0030306 | ADP-ribosylation factor binding(GO:0030306) |
| 0.0 | 0.1 | GO:0015199 | amino-acid betaine transmembrane transporter activity(GO:0015199) carnitine transmembrane transporter activity(GO:0015226) |
| 0.0 | 0.3 | GO:0004707 | MAP kinase activity(GO:0004707) |
| 0.0 | 0.1 | GO:0008859 | exoribonuclease II activity(GO:0008859) |
| 0.0 | 1.5 | GO:0019003 | GDP binding(GO:0019003) |
| 0.0 | 0.3 | GO:0004383 | guanylate cyclase activity(GO:0004383) |
| 0.0 | 0.5 | GO:0005184 | neuropeptide hormone activity(GO:0005184) |
| 0.0 | 0.2 | GO:0004887 | thyroid hormone receptor activity(GO:0004887) |
| 0.0 | 0.0 | GO:0002094 | polyprenyltransferase activity(GO:0002094) |
| 0.0 | 0.5 | GO:0000993 | RNA polymerase II core binding(GO:0000993) |
| 0.0 | 0.1 | GO:0000213 | tRNA-intron endonuclease activity(GO:0000213) |
| 0.0 | 0.1 | GO:0051032 | nucleic acid transmembrane transporter activity(GO:0051032) RNA transmembrane transporter activity(GO:0051033) |
| 0.0 | 0.2 | GO:0017127 | cholesterol transporter activity(GO:0017127) |
| 0.0 | 0.1 | GO:0043560 | insulin receptor substrate binding(GO:0043560) |
| 0.0 | 0.5 | GO:0004709 | MAP kinase kinase kinase activity(GO:0004709) |
| 0.0 | 0.1 | GO:0008798 | beta-aspartyl-peptidase activity(GO:0008798) |
| 0.0 | 0.6 | GO:0017147 | Wnt-protein binding(GO:0017147) |
| 0.0 | 0.1 | GO:0004814 | arginine-tRNA ligase activity(GO:0004814) |
| 0.0 | 0.1 | GO:0003846 | 2-acylglycerol O-acyltransferase activity(GO:0003846) |
| 0.0 | 0.1 | GO:0070699 | type II activin receptor binding(GO:0070699) |
| 0.0 | 0.1 | GO:0033857 | inositol-1,3,4,5,6-pentakisphosphate kinase activity(GO:0000827) inositol hexakisphosphate kinase activity(GO:0000828) inositol heptakisphosphate kinase activity(GO:0000829) inositol hexakisphosphate 5-kinase activity(GO:0000832) diphosphoinositol-pentakisphosphate kinase activity(GO:0033857) inositol hexakisphosphate 1-kinase activity(GO:0052723) inositol hexakisphosphate 3-kinase activity(GO:0052724) |
| 0.0 | 0.1 | GO:0004301 | epoxide hydrolase activity(GO:0004301) |
| 0.0 | 0.2 | GO:1990380 | Lys48-specific deubiquitinase activity(GO:1990380) |
| 0.0 | 0.1 | GO:0001165 | RNA polymerase I upstream control element sequence-specific DNA binding(GO:0001165) |
| 0.0 | 0.1 | GO:0031531 | thyrotropin-releasing hormone receptor binding(GO:0031531) |
| 0.0 | 0.0 | GO:0004980 | melanocyte-stimulating hormone receptor activity(GO:0004980) |
| 0.0 | 0.1 | GO:0016524 | latrotoxin receptor activity(GO:0016524) |
| 0.0 | 0.1 | GO:0031694 | alpha-2A adrenergic receptor binding(GO:0031694) |
| 0.0 | 0.5 | GO:0004708 | MAP kinase kinase activity(GO:0004708) |
| 0.0 | 0.1 | GO:0036435 | K48-linked polyubiquitin binding(GO:0036435) |
| 0.0 | 0.1 | GO:0016907 | G-protein coupled acetylcholine receptor activity(GO:0016907) |
| 0.0 | 0.0 | GO:0004939 | beta-adrenergic receptor activity(GO:0004939) |
| 0.0 | 0.1 | GO:0017159 | pantetheine hydrolase activity(GO:0017159) |
| 0.0 | 0.0 | GO:0070546 | L-phenylalanine aminotransferase activity(GO:0070546) L-phenylalanine:2-oxoglutarate aminotransferase activity(GO:0080130) |
| 0.0 | 0.9 | GO:0046332 | SMAD binding(GO:0046332) |
| 0.0 | 0.1 | GO:0034711 | inhibin binding(GO:0034711) |
| 0.0 | 0.1 | GO:0008568 | microtubule-severing ATPase activity(GO:0008568) |
| 0.0 | 0.1 | GO:0004128 | cytochrome-b5 reductase activity, acting on NAD(P)H(GO:0004128) |
| 0.0 | 0.8 | GO:0016655 | oxidoreductase activity, acting on NAD(P)H, quinone or similar compound as acceptor(GO:0016655) |
| 0.0 | 0.5 | GO:0005092 | GDP-dissociation inhibitor activity(GO:0005092) |
| 0.0 | 0.1 | GO:0016778 | diphosphotransferase activity(GO:0016778) |
| 0.0 | 0.1 | GO:0004032 | alditol:NADP+ 1-oxidoreductase activity(GO:0004032) |
| 0.0 | 0.3 | GO:0070016 | armadillo repeat domain binding(GO:0070016) |
| 0.0 | 0.3 | GO:0016922 | ligand-dependent nuclear receptor binding(GO:0016922) |
| 0.0 | 0.1 | GO:0003680 | AT DNA binding(GO:0003680) |
| 0.0 | 0.1 | GO:0033743 | peptide-methionine (R)-S-oxide reductase activity(GO:0033743) |
| 0.0 | 0.0 | GO:0005137 | interleukin-5 receptor binding(GO:0005137) |
| 0.0 | 0.1 | GO:0042731 | PH domain binding(GO:0042731) |
| 0.0 | 0.1 | GO:0019776 | Atg8 ligase activity(GO:0019776) |
| 0.0 | 0.2 | GO:0008140 | cAMP response element binding protein binding(GO:0008140) |
| 0.0 | 2.7 | GO:0001078 | transcriptional repressor activity, RNA polymerase II core promoter proximal region sequence-specific binding(GO:0001078) |
| 0.0 | 0.1 | GO:0051765 | inositol tetrakisphosphate kinase activity(GO:0051765) |
| 0.0 | 0.1 | GO:0099583 | neurotransmitter receptor activity involved in regulation of postsynaptic cytosolic calcium ion concentration(GO:0099583) |
| 0.0 | 0.0 | GO:0004492 | methylmalonyl-CoA decarboxylase activity(GO:0004492) |
| 0.0 | 0.4 | GO:0047555 | 3',5'-cyclic-GMP phosphodiesterase activity(GO:0047555) |
| 0.0 | 0.0 | GO:0004886 | 9-cis retinoic acid receptor activity(GO:0004886) |
| 0.0 | 0.0 | GO:0016838 | carbon-oxygen lyase activity, acting on phosphates(GO:0016838) |
| 0.0 | 0.2 | GO:0043225 | anion transmembrane-transporting ATPase activity(GO:0043225) |
| 0.0 | 1.1 | GO:0008307 | structural constituent of muscle(GO:0008307) |
| 0.0 | 0.1 | GO:0043274 | phospholipase binding(GO:0043274) |
| 0.0 | 0.2 | GO:0015266 | protein channel activity(GO:0015266) |
| 0.0 | 0.2 | GO:0003996 | acyl-CoA ligase activity(GO:0003996) |
| 0.0 | 0.0 | GO:0004001 | adenosine kinase activity(GO:0004001) |
| 0.0 | 0.3 | GO:0001871 | pattern binding(GO:0001871) polysaccharide binding(GO:0030247) |
| 0.0 | 0.0 | GO:0070984 | SET domain binding(GO:0070984) |
| 0.0 | 0.0 | GO:0003696 | satellite DNA binding(GO:0003696) |
| 0.0 | 0.0 | GO:0004416 | hydroxyacylglutathione hydrolase activity(GO:0004416) |
| 0.0 | 0.1 | GO:0016861 | intramolecular oxidoreductase activity, interconverting aldoses and ketoses(GO:0016861) |
| 0.0 | 0.2 | GO:0043047 | single-stranded telomeric DNA binding(GO:0043047) |
| 0.0 | 0.5 | GO:0001102 | RNA polymerase II activating transcription factor binding(GO:0001102) |
| 0.0 | 0.1 | GO:0005138 | interleukin-6 receptor binding(GO:0005138) |
| 0.0 | 0.4 | GO:0005159 | insulin-like growth factor receptor binding(GO:0005159) |
| 0.0 | 0.0 | GO:0044715 | 8-oxo-dGDP phosphatase activity(GO:0044715) |
| 0.0 | 0.7 | GO:0004693 | cyclin-dependent protein serine/threonine kinase activity(GO:0004693) |
| 0.0 | 0.0 | GO:0033878 | hormone-sensitive lipase activity(GO:0033878) |
| 0.0 | 0.1 | GO:0004630 | phospholipase D activity(GO:0004630) |
| 0.0 | 0.1 | GO:0061665 | SUMO ligase activity(GO:0061665) |
| 0.0 | 0.1 | GO:0009374 | biotin binding(GO:0009374) |
| 0.0 | 0.5 | GO:0061631 | ubiquitin conjugating enzyme activity(GO:0061631) |
| 0.0 | 0.1 | GO:0008321 | Ral guanyl-nucleotide exchange factor activity(GO:0008321) |
| 0.0 | 0.1 | GO:0015562 | efflux transmembrane transporter activity(GO:0015562) |
| 0.0 | 0.4 | GO:0071889 | 14-3-3 protein binding(GO:0071889) |
| 0.0 | 0.1 | GO:0004971 | AMPA glutamate receptor activity(GO:0004971) |
| 0.0 | 0.2 | GO:0097602 | cullin family protein binding(GO:0097602) |
| 0.0 | 0.1 | GO:0050815 | phosphoserine binding(GO:0050815) |
| 0.0 | 0.0 | GO:0005111 | type 2 fibroblast growth factor receptor binding(GO:0005111) |
| 0.0 | 0.2 | GO:0005123 | death receptor binding(GO:0005123) |
| 0.0 | 0.2 | GO:0070628 | proteasome binding(GO:0070628) |
| 0.0 | 0.1 | GO:0031697 | beta-1 adrenergic receptor binding(GO:0031697) |
| 0.0 | 0.2 | GO:0034452 | dynactin binding(GO:0034452) |
| 0.0 | 0.3 | GO:0042043 | neurexin family protein binding(GO:0042043) |
| 0.0 | 0.1 | GO:0046538 | bisphosphoglycerate mutase activity(GO:0004082) phosphoglycerate mutase activity(GO:0004619) 2,3-bisphosphoglycerate-dependent phosphoglycerate mutase activity(GO:0046538) |
| 0.0 | 0.2 | GO:0097016 | L27 domain binding(GO:0097016) |
| 0.0 | 0.4 | GO:0042165 | neurotransmitter binding(GO:0042165) |
| 0.0 | 0.1 | GO:0015643 | toxic substance binding(GO:0015643) |
| 0.0 | 0.2 | GO:0004791 | thioredoxin-disulfide reductase activity(GO:0004791) |
| 0.0 | 0.1 | GO:0008429 | phosphatidylethanolamine binding(GO:0008429) |
Gene overrepresentation in curated gene sets: canonical pathways category:
| Log-likelihood per target | Total log-likelihood | Term | Description |
|---|---|---|---|
| 0.1 | 0.2 | PID S1P S1P3 PATHWAY | S1P3 pathway |
| 0.1 | 4.0 | NABA PROTEOGLYCANS | Genes encoding proteoglycans |
| 0.0 | 1.5 | PID RHODOPSIN PATHWAY | Visual signal transduction: Rods |
| 0.0 | 0.9 | PID TCR RAS PATHWAY | Ras signaling in the CD4+ TCR pathway |
| 0.0 | 0.5 | PID THROMBIN PAR4 PATHWAY | PAR4-mediated thrombin signaling events |
| 0.0 | 1.1 | SA G1 AND S PHASES | Cdk2, 4, and 6 bind cyclin D in G1, while cdk2/cyclin E promotes the G1/S transition. |
| 0.0 | 0.2 | PID PDGFRA PATHWAY | PDGFR-alpha signaling pathway |
| 0.0 | 0.6 | PID P38 GAMMA DELTA PATHWAY | Signaling mediated by p38-gamma and p38-delta |
| 0.0 | 0.6 | ST INTERFERON GAMMA PATHWAY | Interferon gamma pathway. |
| 0.0 | 2.5 | ST GA13 PATHWAY | G alpha 13 Pathway |
| 0.0 | 1.2 | PID P38 MK2 PATHWAY | p38 signaling mediated by MAPKAP kinases |
| 0.0 | 1.1 | PID IFNG PATHWAY | IFN-gamma pathway |
| 0.0 | 0.7 | PID IL8 CXCR1 PATHWAY | IL8- and CXCR1-mediated signaling events |
| 0.0 | 1.5 | PID EPO PATHWAY | EPO signaling pathway |
| 0.0 | 0.7 | PID SMAD2 3PATHWAY | Regulation of cytoplasmic and nuclear SMAD2/3 signaling |
| 0.0 | 0.3 | PID FAS PATHWAY | FAS (CD95) signaling pathway |
| 0.0 | 0.2 | ST TYPE I INTERFERON PATHWAY | Type I Interferon (alpha/beta IFN) Pathway |
| 0.0 | 1.1 | PID ALPHA SYNUCLEIN PATHWAY | Alpha-synuclein signaling |
| 0.0 | 1.8 | PID CD8 TCR DOWNSTREAM PATHWAY | Downstream signaling in naïve CD8+ T cells |
| 0.0 | 0.9 | PID TRAIL PATHWAY | TRAIL signaling pathway |
| 0.0 | 0.8 | PID PI3K PLC TRK PATHWAY | Trk receptor signaling mediated by PI3K and PLC-gamma |
| 0.0 | 0.0 | PID ALK2 PATHWAY | ALK2 signaling events |
| 0.0 | 1.5 | NABA COLLAGENS | Genes encoding collagen proteins |
| 0.0 | 0.2 | PID NFKAPPAB ATYPICAL PATHWAY | Atypical NF-kappaB pathway |
| 0.0 | 0.2 | PID TCR CALCIUM PATHWAY | Calcium signaling in the CD4+ TCR pathway |
| 0.0 | 0.3 | PID RAC1 REG PATHWAY | Regulation of RAC1 activity |
| 0.0 | 0.7 | PID NFAT 3PATHWAY | Role of Calcineurin-dependent NFAT signaling in lymphocytes |
| 0.0 | 0.8 | PID MYC PATHWAY | C-MYC pathway |
| 0.0 | 0.6 | PID KIT PATHWAY | Signaling events mediated by Stem cell factor receptor (c-Kit) |
| 0.0 | 0.3 | PID EPHRINB REV PATHWAY | Ephrin B reverse signaling |
| 0.0 | 0.9 | PID BMP PATHWAY | BMP receptor signaling |
| 0.0 | 0.0 | PID THROMBIN PAR1 PATHWAY | PAR1-mediated thrombin signaling events |
| 0.0 | 0.0 | ST G ALPHA S PATHWAY | G alpha s Pathway |
| 0.0 | 0.7 | PID FOXM1 PATHWAY | FOXM1 transcription factor network |
| 0.0 | 0.3 | PID P38 ALPHA BETA PATHWAY | Regulation of p38-alpha and p38-beta |
| 0.0 | 0.3 | PID ANTHRAX PATHWAY | Cellular roles of Anthrax toxin |
| 0.0 | 0.2 | PID UPA UPAR PATHWAY | Urokinase-type plasminogen activator (uPA) and uPAR-mediated signaling |
| 0.0 | 0.8 | PID ARF6 PATHWAY | Arf6 signaling events |
| 0.0 | 1.1 | PID FOXO PATHWAY | FoxO family signaling |
| 0.0 | 0.8 | PID ERBB1 INTERNALIZATION PATHWAY | Internalization of ErbB1 |
| 0.0 | 0.5 | PID WNT NONCANONICAL PATHWAY | Noncanonical Wnt signaling pathway |
| 0.0 | 0.1 | PID RANBP2 PATHWAY | Sumoylation by RanBP2 regulates transcriptional repression |
| 0.0 | 0.2 | PID TXA2PATHWAY | Thromboxane A2 receptor signaling |
| 0.0 | 0.1 | SIG CD40PATHWAYMAP | Genes related to CD40 signaling |
| 0.0 | 1.4 | PID PDGFRB PATHWAY | PDGFR-beta signaling pathway |
| 0.0 | 0.2 | PID EPHA2 FWD PATHWAY | EPHA2 forward signaling |
| 0.0 | 0.5 | PID RAS PATHWAY | Regulation of Ras family activation |
| 0.0 | 0.3 | ST JNK MAPK PATHWAY | JNK MAPK Pathway |
| 0.0 | 0.2 | PID HDAC CLASSIII PATHWAY | Signaling events mediated by HDAC Class III |
| 0.0 | 2.6 | NABA ECM AFFILIATED | Genes encoding proteins affiliated structurally or functionally to extracellular matrix proteins |
| 0.0 | 0.7 | PID AR TF PATHWAY | Regulation of Androgen receptor activity |
| 0.0 | 0.0 | SIG PIP3 SIGNALING IN B LYMPHOCYTES | Genes related to PIP3 signaling in B lymphocytes |
Gene overrepresentation in curated gene sets: REACTOME pathways category:
| Log-likelihood per target | Total log-likelihood | Term | Description |
|---|---|---|---|
| 0.1 | 2.7 | REACTOME CS DS DEGRADATION | Genes involved in CS/DS degradation |
| 0.1 | 2.0 | REACTOME NOREPINEPHRINE NEUROTRANSMITTER RELEASE CYCLE | Genes involved in Norepinephrine Neurotransmitter Release Cycle |
| 0.1 | 1.5 | REACTOME ROLE OF DCC IN REGULATING APOPTOSIS | Genes involved in Role of DCC in regulating apoptosis |
| 0.1 | 1.8 | REACTOME TETRAHYDROBIOPTERIN BH4 SYNTHESIS RECYCLING SALVAGE AND REGULATION | Genes involved in Tetrahydrobiopterin (BH4) synthesis, recycling, salvage and regulation |
| 0.1 | 1.2 | REACTOME COMMON PATHWAY | Genes involved in Common Pathway |
| 0.1 | 2.8 | REACTOME GLUTATHIONE CONJUGATION | Genes involved in Glutathione conjugation |
| 0.1 | 0.8 | REACTOME CREATION OF C4 AND C2 ACTIVATORS | Genes involved in Creation of C4 and C2 activators |
| 0.1 | 0.8 | REACTOME ETHANOL OXIDATION | Genes involved in Ethanol oxidation |
| 0.1 | 1.1 | REACTOME TRANSLOCATION OF ZAP 70 TO IMMUNOLOGICAL SYNAPSE | Genes involved in Translocation of ZAP-70 to Immunological synapse |
| 0.1 | 1.5 | REACTOME METABOLISM OF PORPHYRINS | Genes involved in Metabolism of porphyrins |
| 0.0 | 1.0 | REACTOME IL 7 SIGNALING | Genes involved in Interleukin-7 signaling |
| 0.0 | 1.1 | REACTOME REGULATION OF IFNA SIGNALING | Genes involved in Regulation of IFNA signaling |
| 0.0 | 0.8 | REACTOME REGULATION OF IFNG SIGNALING | Genes involved in Regulation of IFNG signaling |
| 0.0 | 0.5 | REACTOME PROSTANOID LIGAND RECEPTORS | Genes involved in Prostanoid ligand receptors |
| 0.0 | 1.0 | REACTOME RETROGRADE NEUROTROPHIN SIGNALLING | Genes involved in Retrograde neurotrophin signalling |
| 0.0 | 0.3 | REACTOME P53 INDEPENDENT G1 S DNA DAMAGE CHECKPOINT | Genes involved in p53-Independent G1/S DNA damage checkpoint |
| 0.0 | 1.7 | REACTOME SMOOTH MUSCLE CONTRACTION | Genes involved in Smooth Muscle Contraction |
| 0.0 | 1.1 | REACTOME BRANCHED CHAIN AMINO ACID CATABOLISM | Genes involved in Branched-chain amino acid catabolism |
| 0.0 | 2.3 | REACTOME NEGATIVE REGULATORS OF RIG I MDA5 SIGNALING | Genes involved in Negative regulators of RIG-I/MDA5 signaling |
| 0.0 | 2.9 | REACTOME RESPIRATORY ELECTRON TRANSPORT | Genes involved in Respiratory electron transport |
| 0.0 | 0.6 | REACTOME SEMA3A PLEXIN REPULSION SIGNALING BY INHIBITING INTEGRIN ADHESION | Genes involved in SEMA3A-Plexin repulsion signaling by inhibiting Integrin adhesion |
| 0.0 | 0.6 | REACTOME SIGNALLING TO P38 VIA RIT AND RIN | Genes involved in Signalling to p38 via RIT and RIN |
| 0.0 | 4.9 | REACTOME PEPTIDE CHAIN ELONGATION | Genes involved in Peptide chain elongation |
| 0.0 | 1.1 | REACTOME SYNTHESIS AND INTERCONVERSION OF NUCLEOTIDE DI AND TRIPHOSPHATES | Genes involved in Synthesis and interconversion of nucleotide di- and triphosphates |
| 0.0 | 0.7 | REACTOME ACTIVATION OF THE AP1 FAMILY OF TRANSCRIPTION FACTORS | Genes involved in Activation of the AP-1 family of transcription factors |
| 0.0 | 0.4 | REACTOME SYNTHESIS OF BILE ACIDS AND BILE SALTS VIA 24 HYDROXYCHOLESTEROL | Genes involved in Synthesis of bile acids and bile salts via 24-hydroxycholesterol |
| 0.0 | 0.9 | REACTOME AMINO ACID SYNTHESIS AND INTERCONVERSION TRANSAMINATION | Genes involved in Amino acid synthesis and interconversion (transamination) |
| 0.0 | 0.7 | REACTOME HS GAG DEGRADATION | Genes involved in HS-GAG degradation |
| 0.0 | 0.3 | REACTOME SHC MEDIATED SIGNALLING | Genes involved in SHC-mediated signalling |
| 0.0 | 0.6 | REACTOME PROTEOLYTIC CLEAVAGE OF SNARE COMPLEX PROTEINS | Genes involved in Proteolytic cleavage of SNARE complex proteins |
| 0.0 | 1.0 | REACTOME PRE NOTCH TRANSCRIPTION AND TRANSLATION | Genes involved in Pre-NOTCH Transcription and Translation |
| 0.0 | 0.7 | REACTOME REGULATION OF AMPK ACTIVITY VIA LKB1 | Genes involved in Regulation of AMPK activity via LKB1 |
| 0.0 | 1.8 | REACTOME REGULATION OF ORNITHINE DECARBOXYLASE ODC | Genes involved in Regulation of ornithine decarboxylase (ODC) |
| 0.0 | 0.3 | REACTOME NEGATIVE REGULATION OF THE PI3K AKT NETWORK | Genes involved in Negative regulation of the PI3K/AKT network |
| 0.0 | 0.7 | REACTOME RESOLUTION OF AP SITES VIA THE MULTIPLE NUCLEOTIDE PATCH REPLACEMENT PATHWAY | Genes involved in Resolution of AP sites via the multiple-nucleotide patch replacement pathway |
| 0.0 | 0.6 | REACTOME PLATELET SENSITIZATION BY LDL | Genes involved in Platelet sensitization by LDL |
| 0.0 | 0.5 | REACTOME ABORTIVE ELONGATION OF HIV1 TRANSCRIPT IN THE ABSENCE OF TAT | Genes involved in Abortive elongation of HIV-1 transcript in the absence of Tat |
| 0.0 | 1.9 | REACTOME COLLAGEN FORMATION | Genes involved in Collagen formation |
| 0.0 | 0.7 | REACTOME CIRCADIAN REPRESSION OF EXPRESSION BY REV ERBA | Genes involved in Circadian Repression of Expression by REV-ERBA |
| 0.0 | 0.6 | REACTOME SULFUR AMINO ACID METABOLISM | Genes involved in Sulfur amino acid metabolism |
| 0.0 | 1.1 | REACTOME G1 PHASE | Genes involved in G1 Phase |
| 0.0 | 0.3 | REACTOME GLYCOPROTEIN HORMONES | Genes involved in Glycoprotein hormones |
| 0.0 | 0.9 | REACTOME DEFENSINS | Genes involved in Defensins |
| 0.0 | 0.9 | REACTOME INTERACTION BETWEEN L1 AND ANKYRINS | Genes involved in Interaction between L1 and Ankyrins |
| 0.0 | 1.5 | REACTOME INTERFERON ALPHA BETA SIGNALING | Genes involved in Interferon alpha/beta signaling |
| 0.0 | 0.5 | REACTOME RNA POL III CHAIN ELONGATION | Genes involved in RNA Polymerase III Chain Elongation |
| 0.0 | 0.2 | REACTOME DSCAM INTERACTIONS | Genes involved in DSCAM interactions |
| 0.0 | 0.2 | REACTOME RECYCLING OF BILE ACIDS AND SALTS | Genes involved in Recycling of bile acids and salts |
| 0.0 | 1.4 | REACTOME NETRIN1 SIGNALING | Genes involved in Netrin-1 signaling |
| 0.0 | 0.5 | REACTOME IONOTROPIC ACTIVITY OF KAINATE RECEPTORS | Genes involved in Ionotropic activity of Kainate Receptors |
| 0.0 | 0.2 | REACTOME SYNTHESIS OF BILE ACIDS AND BILE SALTS VIA 7ALPHA HYDROXYCHOLESTEROL | Genes involved in Synthesis of bile acids and bile salts via 7alpha-hydroxycholesterol |
| 0.0 | 0.1 | REACTOME SIGNAL ATTENUATION | Genes involved in Signal attenuation |
| 0.0 | 0.1 | REACTOME G BETA GAMMA SIGNALLING THROUGH PLC BETA | Genes involved in G beta:gamma signalling through PLC beta |
| 0.0 | 0.3 | REACTOME MITOCHONDRIAL FATTY ACID BETA OXIDATION | Genes involved in Mitochondrial Fatty Acid Beta-Oxidation |
| 0.0 | 0.3 | REACTOME PROLACTIN RECEPTOR SIGNALING | Genes involved in Prolactin receptor signaling |
| 0.0 | 0.7 | REACTOME THROMBIN SIGNALLING THROUGH PROTEINASE ACTIVATED RECEPTORS PARS | Genes involved in Thrombin signalling through proteinase activated receptors (PARs) |
| 0.0 | 0.2 | REACTOME REGULATION OF KIT SIGNALING | Genes involved in Regulation of KIT signaling |
| 0.0 | 0.5 | REACTOME ENDOSOMAL SORTING COMPLEX REQUIRED FOR TRANSPORT ESCRT | Genes involved in Endosomal Sorting Complex Required For Transport (ESCRT) |
| 0.0 | 0.1 | REACTOME ADENYLATE CYCLASE ACTIVATING PATHWAY | Genes involved in Adenylate cyclase activating pathway |
| 0.0 | 0.4 | REACTOME OTHER SEMAPHORIN INTERACTIONS | Genes involved in Other semaphorin interactions |
| 0.0 | 0.2 | REACTOME SIGNAL REGULATORY PROTEIN SIRP FAMILY INTERACTIONS | Genes involved in Signal regulatory protein (SIRP) family interactions |
| 0.0 | 0.6 | REACTOME REGULATION OF GENE EXPRESSION IN BETA CELLS | Genes involved in Regulation of gene expression in beta cells |
| 0.0 | 0.6 | REACTOME INSULIN RECEPTOR RECYCLING | Genes involved in Insulin receptor recycling |
| 0.0 | 0.7 | REACTOME INTRINSIC PATHWAY FOR APOPTOSIS | Genes involved in Intrinsic Pathway for Apoptosis |
| 0.0 | 0.2 | REACTOME SYNTHESIS OF PIPS AT THE LATE ENDOSOME MEMBRANE | Genes involved in Synthesis of PIPs at the late endosome membrane |
| 0.0 | 0.3 | REACTOME AMINE DERIVED HORMONES | Genes involved in Amine-derived hormones |
| 0.0 | 0.5 | REACTOME FORMATION OF INCISION COMPLEX IN GG NER | Genes involved in Formation of incision complex in GG-NER |
| 0.0 | 0.2 | REACTOME ANDROGEN BIOSYNTHESIS | Genes involved in Androgen biosynthesis |
| 0.0 | 0.4 | REACTOME ACTIVATED TAK1 MEDIATES P38 MAPK ACTIVATION | Genes involved in activated TAK1 mediates p38 MAPK activation |
| 0.0 | 0.5 | REACTOME DOWNREGULATION OF SMAD2 3 SMAD4 TRANSCRIPTIONAL ACTIVITY | Genes involved in Downregulation of SMAD2/3:SMAD4 transcriptional activity |
| 0.0 | 0.4 | REACTOME RAP1 SIGNALLING | Genes involved in Rap1 signalling |
| 0.0 | 0.2 | REACTOME CYCLIN E ASSOCIATED EVENTS DURING G1 S TRANSITION | Genes involved in Cyclin E associated events during G1/S transition |
| 0.0 | 0.3 | REACTOME IRON UPTAKE AND TRANSPORT | Genes involved in Iron uptake and transport |
| 0.0 | 0.1 | REACTOME SIGNALING BY CONSTITUTIVELY ACTIVE EGFR | Genes involved in Signaling by constitutively active EGFR |
| 0.0 | 0.6 | REACTOME AMYLOIDS | Genes involved in Amyloids |
| 0.0 | 0.1 | REACTOME NEPHRIN INTERACTIONS | Genes involved in Nephrin interactions |
| 0.0 | 0.3 | REACTOME PRESYNAPTIC NICOTINIC ACETYLCHOLINE RECEPTORS | Genes involved in Presynaptic nicotinic acetylcholine receptors |
| 0.0 | 0.6 | REACTOME TRAFFICKING OF AMPA RECEPTORS | Genes involved in Trafficking of AMPA receptors |
| 0.0 | 0.7 | REACTOME NOTCH1 INTRACELLULAR DOMAIN REGULATES TRANSCRIPTION | Genes involved in NOTCH1 Intracellular Domain Regulates Transcription |
| 0.0 | 0.7 | REACTOME STRIATED MUSCLE CONTRACTION | Genes involved in Striated Muscle Contraction |
| 0.0 | 0.2 | REACTOME SEMA3A PAK DEPENDENT AXON REPULSION | Genes involved in Sema3A PAK dependent Axon repulsion |
| 0.0 | 0.6 | REACTOME SIGNALING BY ROBO RECEPTOR | Genes involved in Signaling by Robo receptor |
| 0.0 | 0.4 | REACTOME POST CHAPERONIN TUBULIN FOLDING PATHWAY | Genes involved in Post-chaperonin tubulin folding pathway |
| 0.0 | 0.1 | REACTOME APOBEC3G MEDIATED RESISTANCE TO HIV1 INFECTION | Genes involved in APOBEC3G mediated resistance to HIV-1 infection |
| 0.0 | 0.2 | REACTOME EGFR DOWNREGULATION | Genes involved in EGFR downregulation |
| 0.0 | 0.5 | REACTOME EXTRACELLULAR MATRIX ORGANIZATION | Genes involved in Extracellular matrix organization |
| 0.0 | 0.4 | REACTOME EXTRINSIC PATHWAY FOR APOPTOSIS | Genes involved in Extrinsic Pathway for Apoptosis |
| 0.0 | 0.4 | REACTOME PI3K AKT ACTIVATION | Genes involved in PI3K/AKT activation |
| 0.0 | 0.3 | REACTOME SYNTHESIS OF PIPS AT THE GOLGI MEMBRANE | Genes involved in Synthesis of PIPs at the Golgi membrane |
| 0.0 | 0.5 | REACTOME CA DEPENDENT EVENTS | Genes involved in Ca-dependent events |
| 0.0 | 0.7 | REACTOME GLUCONEOGENESIS | Genes involved in Gluconeogenesis |
| 0.0 | 0.2 | REACTOME CRMPS IN SEMA3A SIGNALING | Genes involved in CRMPs in Sema3A signaling |
| 0.0 | 0.1 | REACTOME ACTIVATED AMPK STIMULATES FATTY ACID OXIDATION IN MUSCLE | Genes involved in Activated AMPK stimulates fatty-acid oxidation in muscle |
| 0.0 | 0.4 | REACTOME SPHINGOLIPID DE NOVO BIOSYNTHESIS | Genes involved in Sphingolipid de novo biosynthesis |
| 0.0 | 0.0 | REACTOME ARMS MEDIATED ACTIVATION | Genes involved in ARMS-mediated activation |
| 0.0 | 0.1 | REACTOME INITIAL TRIGGERING OF COMPLEMENT | Genes involved in Initial triggering of complement |
| 0.0 | 0.2 | REACTOME FACILITATIVE NA INDEPENDENT GLUCOSE TRANSPORTERS | Genes involved in Facilitative Na+-independent glucose transporters |
| 0.0 | 1.0 | REACTOME METABOLISM OF AMINO ACIDS AND DERIVATIVES | Genes involved in Metabolism of amino acids and derivatives |