Project
Epithelial-Mesenchymal Transition, human (Scheel, 2011)
Navigation
Downloads
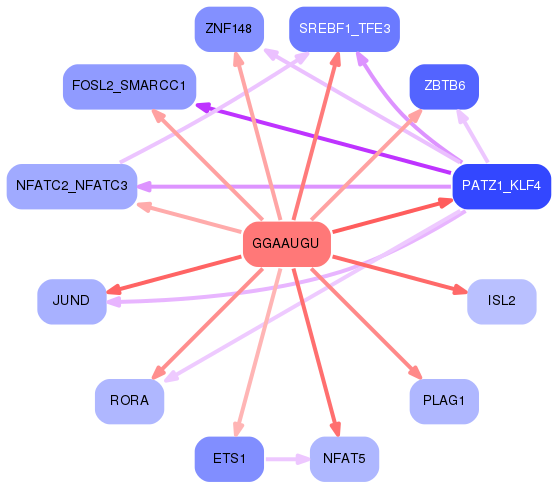
Results for GGAAUGU
Z-value: 1.07
Motif logo

miRNA associated with seed GGAAUGU
| Name | miRBASE accession |
|---|---|
|
hsa-miR-1-3p
|
MIMAT0000416 |
|
hsa-miR-206
|
MIMAT0000462 |
|
hsa-miR-613
|
MIMAT0003281 |
Activity profile of GGAAUGU motif
Sorted Z-values of GGAAUGU motif
Network of associatons between targets according to the STRING database.

First level regulatory network of GGAAUGU
Gene Ontology Analysis
Gene overrepresentation in biological process category:
| Log-likelihood per target | Total log-likelihood | Term | Description |
|---|---|---|---|
| 0.3 | 1.3 | GO:0007181 | transforming growth factor beta receptor complex assembly(GO:0007181) response to luteinizing hormone(GO:0034699) |
| 0.3 | 0.9 | GO:1903400 | L-arginine transmembrane transport(GO:1903400) |
| 0.2 | 1.1 | GO:0061428 | negative regulation of transcription from RNA polymerase II promoter in response to hypoxia(GO:0061428) |
| 0.2 | 0.5 | GO:0060823 | canonical Wnt signaling pathway involved in neural plate anterior/posterior pattern formation(GO:0060823) |
| 0.2 | 0.6 | GO:0009051 | pentose-phosphate shunt, oxidative branch(GO:0009051) |
| 0.1 | 0.4 | GO:0098746 | fast, calcium ion-dependent exocytosis of neurotransmitter(GO:0098746) |
| 0.1 | 0.7 | GO:2000312 | regulation of kainate selective glutamate receptor activity(GO:2000312) |
| 0.1 | 0.4 | GO:0090076 | relaxation of skeletal muscle(GO:0090076) |
| 0.1 | 0.5 | GO:1905040 | vestibulocochlear nerve structural organization(GO:0021649) positive regulation of cytokine activity(GO:0060301) ganglion morphogenesis(GO:0061552) VEGF-activated neuropilin signaling pathway involved in axon guidance(GO:1902378) dorsal root ganglion morphogenesis(GO:1904835) otic placode development(GO:1905040) |
| 0.1 | 0.4 | GO:0014846 | esophagus smooth muscle contraction(GO:0014846) |
| 0.1 | 0.5 | GO:0070213 | protein auto-ADP-ribosylation(GO:0070213) |
| 0.1 | 0.9 | GO:0048843 | negative regulation of axon extension involved in axon guidance(GO:0048843) |
| 0.1 | 0.3 | GO:0048022 | negative regulation of melanin biosynthetic process(GO:0048022) negative regulation of secondary metabolite biosynthetic process(GO:1900377) |
| 0.1 | 1.8 | GO:2001256 | regulation of store-operated calcium entry(GO:2001256) |
| 0.1 | 0.3 | GO:0061182 | negative regulation of chondrocyte development(GO:0061182) |
| 0.1 | 0.4 | GO:1903758 | regulation of transcription from RNA polymerase II promoter by histone modification(GO:1903756) negative regulation of transcription from RNA polymerase II promoter by histone modification(GO:1903758) |
| 0.1 | 0.3 | GO:0014740 | negative regulation of muscle hyperplasia(GO:0014740) |
| 0.1 | 0.3 | GO:1905051 | regulation of base-excision repair(GO:1905051) positive regulation of base-excision repair(GO:1905053) |
| 0.1 | 0.4 | GO:0015015 | heparan sulfate proteoglycan biosynthetic process, enzymatic modification(GO:0015015) |
| 0.1 | 0.3 | GO:0060979 | vasculogenesis involved in coronary vascular morphogenesis(GO:0060979) |
| 0.1 | 0.2 | GO:0021524 | visceral motor neuron differentiation(GO:0021524) |
| 0.1 | 0.2 | GO:1904017 | cellular response to Thyroglobulin triiodothyronine(GO:1904017) |
| 0.1 | 0.4 | GO:0006041 | glucosamine metabolic process(GO:0006041) |
| 0.1 | 0.4 | GO:2001271 | regulation of cysteine-type endopeptidase activity involved in execution phase of apoptosis(GO:2001270) negative regulation of cysteine-type endopeptidase activity involved in execution phase of apoptosis(GO:2001271) |
| 0.1 | 0.2 | GO:0018008 | N-terminal peptidyl-glycine N-myristoylation(GO:0018008) |
| 0.1 | 0.4 | GO:0071896 | protein localization to adherens junction(GO:0071896) |
| 0.1 | 0.3 | GO:0009996 | negative regulation of cell fate specification(GO:0009996) |
| 0.1 | 0.2 | GO:0016333 | morphogenesis of follicular epithelium(GO:0016333) establishment or maintenance of polarity of follicular epithelium(GO:0016334) establishment of planar polarity of follicular epithelium(GO:0042247) |
| 0.1 | 0.2 | GO:1904381 | Golgi apparatus mannose trimming(GO:1904381) |
| 0.1 | 0.3 | GO:0044111 | development involved in symbiotic interaction(GO:0044111) |
| 0.0 | 0.1 | GO:0036515 | serotonergic neuron axon guidance(GO:0036515) |
| 0.0 | 0.1 | GO:0015993 | L-ascorbic acid transport(GO:0015882) molecular hydrogen transport(GO:0015993) transepithelial L-ascorbic acid transport(GO:0070904) |
| 0.0 | 0.9 | GO:0043568 | positive regulation of insulin-like growth factor receptor signaling pathway(GO:0043568) |
| 0.0 | 0.2 | GO:0006408 | snRNA export from nucleus(GO:0006408) |
| 0.0 | 0.3 | GO:1903593 | regulation of histamine secretion by mast cell(GO:1903593) |
| 0.0 | 0.1 | GO:1901804 | beta-glucoside metabolic process(GO:1901804) beta-glucoside catabolic process(GO:1901805) positive regulation of neuronal action potential(GO:1904457) |
| 0.0 | 0.5 | GO:0030578 | PML body organization(GO:0030578) |
| 0.0 | 0.3 | GO:1903026 | negative regulation of RNA polymerase II regulatory region sequence-specific DNA binding(GO:1903026) |
| 0.0 | 0.1 | GO:0021637 | trigeminal nerve morphogenesis(GO:0021636) trigeminal nerve structural organization(GO:0021637) semaphorin-plexin signaling pathway involved in axon guidance(GO:1902287) |
| 0.0 | 0.4 | GO:0010739 | positive regulation of protein kinase A signaling(GO:0010739) |
| 0.0 | 0.3 | GO:0070164 | negative regulation of adiponectin secretion(GO:0070164) |
| 0.0 | 0.4 | GO:0007221 | positive regulation of transcription of Notch receptor target(GO:0007221) |
| 0.0 | 0.2 | GO:0051684 | maintenance of Golgi location(GO:0051684) |
| 0.0 | 0.1 | GO:0006127 | glycerophosphate shuttle(GO:0006127) |
| 0.0 | 0.1 | GO:0090176 | microtubule cytoskeleton organization involved in establishment of planar polarity(GO:0090176) |
| 0.0 | 0.1 | GO:0097676 | histone H3-K36 dimethylation(GO:0097676) |
| 0.0 | 0.3 | GO:0046520 | sphingoid biosynthetic process(GO:0046520) |
| 0.0 | 0.1 | GO:0071630 | nucleus-associated proteasomal ubiquitin-dependent protein catabolic process(GO:0071630) |
| 0.0 | 0.1 | GO:0019046 | release from viral latency(GO:0019046) regulation of DNA strand elongation(GO:0060382) |
| 0.0 | 0.2 | GO:0098735 | positive regulation of the force of heart contraction(GO:0098735) |
| 0.0 | 0.1 | GO:0034316 | negative regulation of Arp2/3 complex-mediated actin nucleation(GO:0034316) |
| 0.0 | 0.4 | GO:0071670 | smooth muscle cell chemotaxis(GO:0071670) |
| 0.0 | 1.0 | GO:0070884 | regulation of calcineurin-NFAT signaling cascade(GO:0070884) |
| 0.0 | 1.2 | GO:0016601 | Rac protein signal transduction(GO:0016601) |
| 0.0 | 0.1 | GO:0090365 | regulation of mRNA modification(GO:0090365) |
| 0.0 | 0.1 | GO:1902954 | regulation of early endosome to recycling endosome transport(GO:1902954) |
| 0.0 | 0.4 | GO:0033148 | positive regulation of intracellular estrogen receptor signaling pathway(GO:0033148) |
| 0.0 | 0.1 | GO:0015798 | myo-inositol transport(GO:0015798) |
| 0.0 | 0.2 | GO:0015014 | heparan sulfate proteoglycan biosynthetic process, polysaccharide chain biosynthetic process(GO:0015014) |
| 0.0 | 0.0 | GO:0045053 | protein retention in Golgi apparatus(GO:0045053) |
| 0.0 | 0.1 | GO:1900126 | negative regulation of hyaluronan biosynthetic process(GO:1900126) |
| 0.0 | 0.2 | GO:0044387 | negative regulation of protein kinase activity by regulation of protein phosphorylation(GO:0044387) |
| 0.0 | 0.1 | GO:1903553 | positive regulation of extracellular exosome assembly(GO:1903553) |
| 0.0 | 0.2 | GO:0097012 | cellular response to granulocyte macrophage colony-stimulating factor stimulus(GO:0097011) response to granulocyte macrophage colony-stimulating factor(GO:0097012) |
| 0.0 | 0.1 | GO:0003219 | cardiac right ventricle formation(GO:0003219) |
| 0.0 | 0.0 | GO:1900147 | Schwann cell migration(GO:0036135) regulation of Schwann cell migration(GO:1900147) |
| 0.0 | 0.1 | GO:2000301 | negative regulation of synaptic vesicle exocytosis(GO:2000301) |
| 0.0 | 0.2 | GO:0006621 | protein retention in ER lumen(GO:0006621) |
| 0.0 | 0.0 | GO:0090341 | negative regulation of secretion of lysosomal enzymes(GO:0090341) |
| 0.0 | 0.1 | GO:0018106 | peptidyl-histidine phosphorylation(GO:0018106) |
| 0.0 | 0.1 | GO:1903385 | regulation of homophilic cell adhesion(GO:1903385) |
| 0.0 | 0.4 | GO:0060008 | Sertoli cell differentiation(GO:0060008) |
| 0.0 | 0.1 | GO:0042426 | choline catabolic process(GO:0042426) |
| 0.0 | 0.0 | GO:0043321 | regulation of natural killer cell degranulation(GO:0043321) positive regulation of natural killer cell degranulation(GO:0043323) |
| 0.0 | 0.0 | GO:0046619 | optic placode formation(GO:0001743) optic placode formation involved in camera-type eye formation(GO:0046619) |
| 0.0 | 0.1 | GO:0046963 | 3'-phosphoadenosine 5'-phosphosulfate transport(GO:0046963) 3'-phospho-5'-adenylyl sulfate transmembrane transport(GO:1902559) |
| 0.0 | 0.2 | GO:0010763 | positive regulation of fibroblast migration(GO:0010763) |
| 0.0 | 0.1 | GO:0048549 | positive regulation of pinocytosis(GO:0048549) negative regulation of dendritic cell apoptotic process(GO:2000669) |
| 0.0 | 1.4 | GO:0006334 | nucleosome assembly(GO:0006334) |
| 0.0 | 0.4 | GO:0018345 | protein palmitoylation(GO:0018345) |
| 0.0 | 0.1 | GO:0090625 | mRNA cleavage involved in gene silencing by siRNA(GO:0090625) |
| 0.0 | 0.4 | GO:0006607 | NLS-bearing protein import into nucleus(GO:0006607) |
| 0.0 | 0.3 | GO:0048240 | sperm capacitation(GO:0048240) |
| 0.0 | 0.1 | GO:0033327 | Leydig cell differentiation(GO:0033327) |
| 0.0 | 0.2 | GO:0021694 | cerebellar Purkinje cell layer formation(GO:0021694) cerebellar Purkinje cell differentiation(GO:0021702) |
| 0.0 | 0.1 | GO:0090204 | protein localization to nuclear pore(GO:0090204) |
Gene overrepresentation in cellular component category:
| Log-likelihood per target | Total log-likelihood | Term | Description |
|---|---|---|---|
| 0.2 | 1.3 | GO:0034673 | inhibin-betaglycan-ActRII complex(GO:0034673) |
| 0.1 | 0.8 | GO:0060199 | clathrin-sculpted glutamate transport vesicle(GO:0060199) clathrin-sculpted glutamate transport vesicle membrane(GO:0060203) |
| 0.1 | 0.3 | GO:1990667 | PCSK9-AnxA2 complex(GO:1990667) |
| 0.1 | 0.6 | GO:0097443 | sorting endosome(GO:0097443) |
| 0.1 | 0.4 | GO:0000308 | cytoplasmic cyclin-dependent protein kinase holoenzyme complex(GO:0000308) |
| 0.0 | 0.2 | GO:0042643 | actomyosin, actin portion(GO:0042643) |
| 0.0 | 0.7 | GO:0098839 | postsynaptic density membrane(GO:0098839) |
| 0.0 | 0.2 | GO:0071598 | neuronal ribonucleoprotein granule(GO:0071598) |
| 0.0 | 0.3 | GO:0031211 | serine C-palmitoyltransferase complex(GO:0017059) endoplasmic reticulum palmitoyltransferase complex(GO:0031211) |
| 0.0 | 0.3 | GO:0035976 | AP1 complex(GO:0035976) |
| 0.0 | 0.7 | GO:0000786 | nucleosome(GO:0000786) |
| 0.0 | 0.4 | GO:0031209 | SCAR complex(GO:0031209) |
| 0.0 | 0.3 | GO:0097524 | sperm plasma membrane(GO:0097524) |
| 0.0 | 0.1 | GO:0009331 | glycerol-3-phosphate dehydrogenase complex(GO:0009331) |
| 0.0 | 0.2 | GO:0030121 | AP-1 adaptor complex(GO:0030121) |
| 0.0 | 0.1 | GO:0016272 | prefoldin complex(GO:0016272) |
| 0.0 | 0.1 | GO:0032777 | Piccolo NuA4 histone acetyltransferase complex(GO:0032777) |
| 0.0 | 0.5 | GO:0000242 | pericentriolar material(GO:0000242) |
| 0.0 | 0.1 | GO:0030891 | VCB complex(GO:0030891) |
| 0.0 | 0.2 | GO:0016600 | flotillin complex(GO:0016600) |
| 0.0 | 0.1 | GO:0030130 | clathrin coat of trans-Golgi network vesicle(GO:0030130) |
| 0.0 | 0.4 | GO:0005719 | nuclear euchromatin(GO:0005719) |
| 0.0 | 0.1 | GO:0005846 | nuclear cap binding complex(GO:0005846) |
| 0.0 | 0.1 | GO:0036157 | outer dynein arm(GO:0036157) |
| 0.0 | 0.1 | GO:0002079 | inner acrosomal membrane(GO:0002079) outer acrosomal membrane(GO:0002081) |
Gene overrepresentation in molecular function category:
| Log-likelihood per target | Total log-likelihood | Term | Description |
|---|---|---|---|
| 0.3 | 0.9 | GO:0005287 | high-affinity basic amino acid transmembrane transporter activity(GO:0005287) high-affinity arginine transmembrane transporter activity(GO:0005289) high-affinity lysine transmembrane transporter activity(GO:0005292) |
| 0.2 | 0.9 | GO:0035373 | chondroitin sulfate proteoglycan binding(GO:0035373) |
| 0.2 | 0.5 | GO:0004345 | glucose-6-phosphate dehydrogenase activity(GO:0004345) |
| 0.1 | 0.4 | GO:0004616 | phosphogluconate dehydrogenase (decarboxylating) activity(GO:0004616) |
| 0.1 | 1.3 | GO:0005114 | type II transforming growth factor beta receptor binding(GO:0005114) |
| 0.1 | 0.5 | GO:0038085 | vascular endothelial growth factor binding(GO:0038085) |
| 0.1 | 0.8 | GO:0008597 | calcium-dependent protein serine/threonine phosphatase regulator activity(GO:0008597) |
| 0.1 | 0.3 | GO:0005173 | stem cell factor receptor binding(GO:0005173) |
| 0.1 | 1.0 | GO:0031995 | insulin-like growth factor II binding(GO:0031995) |
| 0.1 | 0.2 | GO:0033142 | progesterone receptor binding(GO:0033142) |
| 0.1 | 0.4 | GO:0008449 | N-acetylglucosamine-6-sulfatase activity(GO:0008449) |
| 0.1 | 0.4 | GO:0030348 | syntaxin-3 binding(GO:0030348) |
| 0.1 | 1.1 | GO:0050693 | LBD domain binding(GO:0050693) |
| 0.1 | 0.3 | GO:0016454 | serine C-palmitoyltransferase activity(GO:0004758) C-palmitoyltransferase activity(GO:0016454) |
| 0.1 | 0.4 | GO:0008467 | [heparan sulfate]-glucosamine 3-sulfotransferase 1 activity(GO:0008467) |
| 0.1 | 0.2 | GO:0004379 | glycylpeptide N-tetradecanoyltransferase activity(GO:0004379) myristoyltransferase activity(GO:0019107) |
| 0.1 | 0.3 | GO:0001010 | transcription factor activity, sequence-specific DNA binding transcription factor recruiting(GO:0001010) |
| 0.1 | 0.3 | GO:0019834 | phospholipase A2 inhibitor activity(GO:0019834) |
| 0.0 | 0.1 | GO:0008523 | L-ascorbate:sodium symporter activity(GO:0008520) sodium-dependent multivitamin transmembrane transporter activity(GO:0008523) L-ascorbic acid transporter activity(GO:0015229) sodium-dependent L-ascorbate transmembrane transporter activity(GO:0070890) |
| 0.0 | 0.2 | GO:0050119 | N-acetylglucosamine deacetylase activity(GO:0050119) |
| 0.0 | 0.1 | GO:0004782 | sulfinoalanine decarboxylase activity(GO:0004782) |
| 0.0 | 0.3 | GO:1904929 | coreceptor activity involved in Wnt signaling pathway, planar cell polarity pathway(GO:1904929) |
| 0.0 | 0.1 | GO:0052590 | sn-glycerol-3-phosphate:ubiquinone oxidoreductase activity(GO:0052590) sn-glycerol-3-phosphate:ubiquinone-8 oxidoreductase activity(GO:0052591) |
| 0.0 | 0.1 | GO:0005010 | insulin-like growth factor-activated receptor activity(GO:0005010) |
| 0.0 | 0.1 | GO:0005137 | interleukin-5 receptor binding(GO:0005137) |
| 0.0 | 0.2 | GO:0030628 | pre-mRNA 3'-splice site binding(GO:0030628) |
| 0.0 | 0.4 | GO:0017034 | Rap guanyl-nucleotide exchange factor activity(GO:0017034) |
| 0.0 | 0.5 | GO:0015467 | G-protein activated inward rectifier potassium channel activity(GO:0015467) |
| 0.0 | 0.2 | GO:0099580 | ion antiporter activity involved in regulation of postsynaptic membrane potential(GO:0099580) |
| 0.0 | 0.1 | GO:0004348 | glucosylceramidase activity(GO:0004348) |
| 0.0 | 0.1 | GO:0035276 | ethanol binding(GO:0035276) |
| 0.0 | 0.2 | GO:0004571 | mannosyl-oligosaccharide 1,2-alpha-mannosidase activity(GO:0004571) |
| 0.0 | 0.1 | GO:0050510 | N-acetylgalactosaminyl-proteoglycan 3-beta-glucuronosyltransferase activity(GO:0050510) |
| 0.0 | 0.3 | GO:0046790 | virion binding(GO:0046790) |
| 0.0 | 0.1 | GO:0047315 | kynurenine-glyoxylate transaminase activity(GO:0047315) |
| 0.0 | 0.4 | GO:0008179 | adenylate cyclase binding(GO:0008179) |
| 0.0 | 0.3 | GO:0005168 | neurotrophin TRKA receptor binding(GO:0005168) |
| 0.0 | 0.3 | GO:0030215 | semaphorin receptor binding(GO:0030215) |
| 0.0 | 0.9 | GO:0001106 | RNA polymerase II transcription corepressor activity(GO:0001106) |
| 0.0 | 0.5 | GO:0016922 | ligand-dependent nuclear receptor binding(GO:0016922) |
| 0.0 | 0.3 | GO:0047372 | acylglycerol lipase activity(GO:0047372) |
| 0.0 | 0.1 | GO:0015220 | choline transmembrane transporter activity(GO:0015220) |
| 0.0 | 0.1 | GO:0004534 | 5'-3' exoribonuclease activity(GO:0004534) |
| 0.0 | 0.1 | GO:0051033 | nucleic acid transmembrane transporter activity(GO:0051032) RNA transmembrane transporter activity(GO:0051033) |
| 0.0 | 0.1 | GO:0102345 | 3-hydroxy-behenoyl-CoA dehydratase activity(GO:0102344) 3-hydroxy-lignoceroyl-CoA dehydratase activity(GO:0102345) |
| 0.0 | 0.5 | GO:0070064 | proline-rich region binding(GO:0070064) |
| 0.0 | 0.5 | GO:0004181 | metallocarboxypeptidase activity(GO:0004181) |
| 0.0 | 0.1 | GO:1990460 | leptin receptor binding(GO:1990460) |
| 0.0 | 0.1 | GO:0016900 | oxidoreductase activity, acting on the CH-OH group of donors, disulfide as acceptor(GO:0016900) vitamin-K-epoxide reductase (warfarin-sensitive) activity(GO:0047057) |
| 0.0 | 0.3 | GO:0035925 | mRNA 3'-UTR AU-rich region binding(GO:0035925) |
| 0.0 | 0.4 | GO:0019707 | protein-cysteine S-palmitoyltransferase activity(GO:0019706) protein-cysteine S-acyltransferase activity(GO:0019707) |
| 0.0 | 0.1 | GO:0046964 | 3'-phosphoadenosine 5'-phosphosulfate transmembrane transporter activity(GO:0046964) |
| 0.0 | 0.1 | GO:0008318 | protein prenyltransferase activity(GO:0008318) |
| 0.0 | 0.0 | GO:0072320 | volume-sensitive chloride channel activity(GO:0072320) |
| 0.0 | 0.3 | GO:0031005 | filamin binding(GO:0031005) |
| 0.0 | 0.5 | GO:0003950 | NAD+ ADP-ribosyltransferase activity(GO:0003950) |
| 0.0 | 0.1 | GO:0046975 | histone methyltransferase activity (H3-K36 specific)(GO:0046975) |
| 0.0 | 1.7 | GO:0005179 | hormone activity(GO:0005179) |
| 0.0 | 0.1 | GO:0015166 | polyol transmembrane transporter activity(GO:0015166) |
| 0.0 | 0.1 | GO:0071933 | Arp2/3 complex binding(GO:0071933) |
| 0.0 | 0.2 | GO:0015643 | toxic substance binding(GO:0015643) |
| 0.0 | 0.0 | GO:0043273 | CTPase activity(GO:0043273) |
| 0.0 | 0.1 | GO:0046974 | histone methyltransferase activity (H3-K9 specific)(GO:0046974) |
Gene overrepresentation in curated gene sets: canonical pathways category:
| Log-likelihood per target | Total log-likelihood | Term | Description |
|---|---|---|---|
| 0.0 | 1.3 | PID WNT SIGNALING PATHWAY | Wnt signaling network |
| 0.0 | 0.9 | PID HIF2PATHWAY | HIF-2-alpha transcription factor network |
| 0.0 | 0.8 | PID PI3K PLC TRK PATHWAY | Trk receptor signaling mediated by PI3K and PLC-gamma |
| 0.0 | 0.7 | PID TCR CALCIUM PATHWAY | Calcium signaling in the CD4+ TCR pathway |
| 0.0 | 1.2 | PID TGFBR PATHWAY | TGF-beta receptor signaling |
| 0.0 | 0.1 | PID TCR JNK PATHWAY | JNK signaling in the CD4+ TCR pathway |
| 0.0 | 0.1 | PID VEGF VEGFR PATHWAY | VEGF and VEGFR signaling network |
Gene overrepresentation in curated gene sets: REACTOME pathways category:
| Log-likelihood per target | Total log-likelihood | Term | Description |
|---|---|---|---|
| 0.0 | 1.0 | REACTOME REGULATION OF INSULIN LIKE GROWTH FACTOR IGF ACTIVITY BY INSULIN LIKE GROWTH FACTOR BINDING PROTEINS IGFBPS | Genes involved in Regulation of Insulin-like Growth Factor (IGF) Activity by Insulin-like Growth Factor Binding Proteins (IGFBPs) |
| 0.0 | 0.8 | REACTOME NOREPINEPHRINE NEUROTRANSMITTER RELEASE CYCLE | Genes involved in Norepinephrine Neurotransmitter Release Cycle |
| 0.0 | 0.9 | REACTOME OTHER SEMAPHORIN INTERACTIONS | Genes involved in Other semaphorin interactions |
| 0.0 | 0.5 | REACTOME SEMA3A PLEXIN REPULSION SIGNALING BY INHIBITING INTEGRIN ADHESION | Genes involved in SEMA3A-Plexin repulsion signaling by inhibiting Integrin adhesion |
| 0.0 | 0.4 | REACTOME SYNTHESIS OF SUBSTRATES IN N GLYCAN BIOSYTHESIS | Genes involved in Synthesis of substrates in N-glycan biosythesis |
| 0.0 | 0.2 | REACTOME ROLE OF SECOND MESSENGERS IN NETRIN1 SIGNALING | Genes involved in Role of second messengers in netrin-1 signaling |
| 0.0 | 0.2 | REACTOME MEMBRANE BINDING AND TARGETTING OF GAG PROTEINS | Genes involved in Membrane binding and targetting of GAG proteins |
| 0.0 | 0.4 | REACTOME NOTCH HLH TRANSCRIPTION PATHWAY | Genes involved in Notch-HLH transcription pathway |
| 0.0 | 0.9 | REACTOME AMINO ACID TRANSPORT ACROSS THE PLASMA MEMBRANE | Genes involved in Amino acid transport across the plasma membrane |
| 0.0 | 0.6 | REACTOME HS GAG BIOSYNTHESIS | Genes involved in HS-GAG biosynthesis |
| 0.0 | 0.4 | REACTOME DEPOSITION OF NEW CENPA CONTAINING NUCLEOSOMES AT THE CENTROMERE | Genes involved in Deposition of New CENPA-containing Nucleosomes at the Centromere |
| 0.0 | 0.2 | REACTOME NEF MEDIATED DOWNREGULATION OF MHC CLASS I COMPLEX CELL SURFACE EXPRESSION | Genes involved in Nef mediated downregulation of MHC class I complex cell surface expression |
| 0.0 | 0.4 | REACTOME CIRCADIAN REPRESSION OF EXPRESSION BY REV ERBA | Genes involved in Circadian Repression of Expression by REV-ERBA |
| 0.0 | 0.3 | REACTOME SYNTHESIS SECRETION AND DEACYLATION OF GHRELIN | Genes involved in Synthesis, Secretion, and Deacylation of Ghrelin |
| 0.0 | 0.3 | REACTOME CELL EXTRACELLULAR MATRIX INTERACTIONS | Genes involved in Cell-extracellular matrix interactions |
| 0.0 | 0.3 | REACTOME PLATELET CALCIUM HOMEOSTASIS | Genes involved in Platelet calcium homeostasis |