Project
Epithelial-Mesenchymal Transition, human (Scheel, 2011)
Navigation
Downloads
Results for HDX
Z-value: 0.36
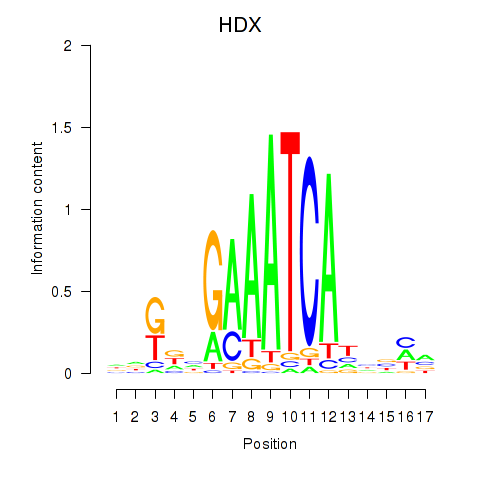
Motif logo
Transcription factors associated with HDX
| Gene Symbol | Gene ID | Gene Info |
|---|---|---|
|
HDX
|
ENSG00000165259.14 | highly divergent homeobox |
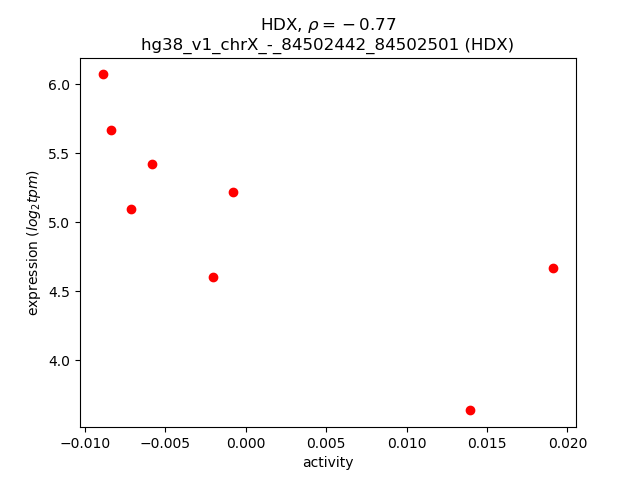
Activity-expression correlation:
| Gene | Promoter | Pearson corr. coef. | P-value | Plot |
|---|---|---|---|---|
| HDX | hg38_v1_chrX_-_84502442_84502501 | -0.77 | 2.7e-02 | Click! |
Activity profile of HDX motif
Sorted Z-values of HDX motif
| Promoter | Log-likelihood | Transcript | Gene | Gene Info |
|---|---|---|---|---|
| chr18_+_31447732 | 0.70 |
ENST00000257189.5
|
DSG3
|
desmoglein 3 |
| chr2_-_112836702 | 0.69 |
ENST00000416750.1
ENST00000263341.7 ENST00000418817.5 |
IL1B
|
interleukin 1 beta |
| chr1_-_153390976 | 0.58 |
ENST00000368732.5
ENST00000368733.4 |
S100A8
|
S100 calcium binding protein A8 |
| chr1_-_209652329 | 0.37 |
ENST00000367030.7
ENST00000356082.9 |
LAMB3
|
laminin subunit beta 3 |
| chr5_+_140786291 | 0.27 |
ENST00000394633.7
|
PCDHA1
|
protocadherin alpha 1 |
| chr5_-_35230332 | 0.19 |
ENST00000504500.5
|
PRLR
|
prolactin receptor |
| chr2_+_112977998 | 0.16 |
ENST00000259205.5
ENST00000376489.6 |
IL36G
|
interleukin 36 gamma |
| chr18_+_58362467 | 0.15 |
ENST00000675101.1
|
NEDD4L
|
NEDD4 like E3 ubiquitin protein ligase |
| chr1_+_84164684 | 0.15 |
ENST00000370680.5
|
PRKACB
|
protein kinase cAMP-activated catalytic subunit beta |
| chr1_-_10964201 | 0.13 |
ENST00000418570.6
|
C1orf127
|
chromosome 1 open reading frame 127 |
| chr1_+_117060309 | 0.12 |
ENST00000369466.9
|
TTF2
|
transcription termination factor 2 |
| chr12_-_39340963 | 0.11 |
ENST00000552961.5
|
KIF21A
|
kinesin family member 21A |
| chr4_+_70334963 | 0.09 |
ENST00000273936.6
|
CABS1
|
calcium binding protein, spermatid associated 1 |
| chr2_+_127645864 | 0.08 |
ENST00000544369.5
|
GPR17
|
G protein-coupled receptor 17 |
| chr19_-_41428730 | 0.08 |
ENST00000321702.2
|
B3GNT8
|
UDP-GlcNAc:betaGal beta-1,3-N-acetylglucosaminyltransferase 8 |
| chr1_-_205422050 | 0.07 |
ENST00000367153.9
|
LEMD1
|
LEM domain containing 1 |
| chr2_+_127646145 | 0.07 |
ENST00000486700.2
ENST00000272644.7 |
GPR17
|
G protein-coupled receptor 17 |
| chr7_-_135728177 | 0.07 |
ENST00000682651.1
ENST00000354042.8 |
SLC13A4
|
solute carrier family 13 member 4 |
| chr7_+_80135694 | 0.06 |
ENST00000457358.7
|
GNAI1
|
G protein subunit alpha i1 |
| chr15_-_53733103 | 0.06 |
ENST00000559418.5
|
WDR72
|
WD repeat domain 72 |
| chr12_+_56763316 | 0.06 |
ENST00000322165.1
|
HSD17B6
|
hydroxysteroid 17-beta dehydrogenase 6 |
| chr1_+_62597510 | 0.05 |
ENST00000371129.4
|
ANGPTL3
|
angiopoietin like 3 |
| chr3_-_51499950 | 0.04 |
ENST00000423656.5
ENST00000504652.5 ENST00000684031.1 |
DCAF1
|
DDB1 and CUL4 associated factor 1 |
| chr1_-_169711603 | 0.04 |
ENST00000236147.6
ENST00000650983.1 |
SELL
|
selectin L |
| chrX_+_55623400 | 0.03 |
ENST00000339140.5
|
FOXR2
|
forkhead box R2 |
| chr7_+_129368123 | 0.03 |
ENST00000460109.5
ENST00000474594.5 |
AHCYL2
|
adenosylhomocysteinase like 2 |
| chr5_-_135954962 | 0.03 |
ENST00000522943.5
ENST00000514447.2 ENST00000274507.6 |
LECT2
|
leukocyte cell derived chemotaxin 2 |
| chr1_-_110519175 | 0.03 |
ENST00000369771.4
|
KCNA10
|
potassium voltage-gated channel subfamily A member 10 |
| chr12_-_118359639 | 0.02 |
ENST00000541786.5
ENST00000419821.6 ENST00000541878.5 |
TAOK3
|
TAO kinase 3 |
| chr19_-_57974527 | 0.02 |
ENST00000314391.3
|
C19orf18
|
chromosome 19 open reading frame 18 |
| chr10_+_18400562 | 0.01 |
ENST00000377315.5
ENST00000650685.1 |
CACNB2
|
calcium voltage-gated channel auxiliary subunit beta 2 |
| chr20_-_37158904 | 0.01 |
ENST00000417458.5
|
MROH8
|
maestro heat like repeat family member 8 |
| chr3_+_107523026 | 0.01 |
ENST00000416476.6
|
BBX
|
BBX high mobility group box domain containing |
| chr5_-_35230467 | 0.01 |
ENST00000515839.1
ENST00000618457.5 |
PRLR
|
prolactin receptor |
| chr3_+_107522936 | 0.00 |
ENST00000415149.6
ENST00000402543.5 ENST00000325805.13 ENST00000427402.5 |
BBX
|
BBX high mobility group box domain containing |
| chr8_+_109086585 | 0.00 |
ENST00000518632.2
|
TRHR
|
thyrotropin releasing hormone receptor |
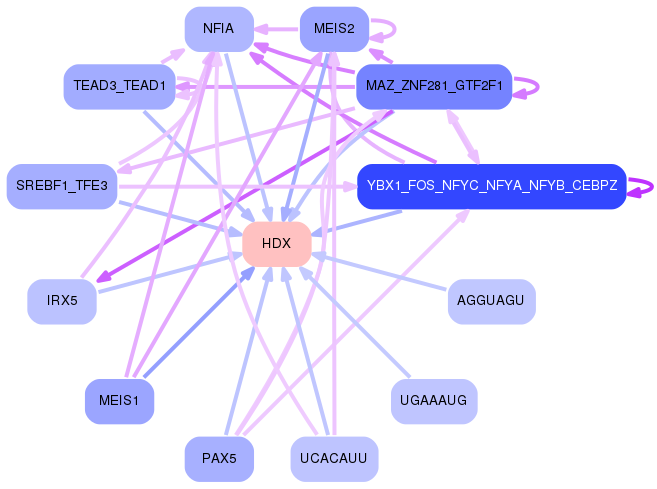
Network of associatons between targets according to the STRING database.

First level regulatory network of HDX
Gene Ontology Analysis
Gene overrepresentation in biological process category:
| Log-likelihood per target | Total log-likelihood | Term | Description |
|---|---|---|---|
| 0.2 | 0.7 | GO:0060559 | positive regulation of vitamin metabolic process(GO:0046136) positive regulation of vitamin D biosynthetic process(GO:0060557) positive regulation of calcidiol 1-monooxygenase activity(GO:0060559) |
| 0.0 | 0.2 | GO:0038161 | prolactin signaling pathway(GO:0038161) |
| 0.0 | 0.6 | GO:0032119 | sequestering of zinc ion(GO:0032119) |
| 0.0 | 0.1 | GO:0097338 | response to clozapine(GO:0097338) |
| 0.0 | 0.1 | GO:0030311 | poly-N-acetyllactosamine biosynthetic process(GO:0030311) |
| 0.0 | 0.4 | GO:0031581 | hemidesmosome assembly(GO:0031581) |
| 0.0 | 0.1 | GO:2001288 | positive regulation of caveolin-mediated endocytosis(GO:2001288) |
Gene overrepresentation in cellular component category:
| Log-likelihood per target | Total log-likelihood | Term | Description |
|---|---|---|---|
| 0.1 | 0.4 | GO:0005610 | laminin-5 complex(GO:0005610) |
| 0.0 | 0.7 | GO:0030057 | desmosome(GO:0030057) |
Gene overrepresentation in molecular function category:
| Log-likelihood per target | Total log-likelihood | Term | Description |
|---|---|---|---|
| 0.1 | 0.6 | GO:0035662 | Toll-like receptor 4 binding(GO:0035662) |
| 0.0 | 0.2 | GO:0004925 | prolactin receptor activity(GO:0004925) |
| 0.0 | 0.9 | GO:0005149 | interleukin-1 receptor binding(GO:0005149) |
| 0.0 | 0.1 | GO:0016262 | protein N-acetylglucosaminyltransferase activity(GO:0016262) |
Gene overrepresentation in curated gene sets: canonical pathways category:
| Log-likelihood per target | Total log-likelihood | Term | Description |
|---|---|---|---|
| 0.0 | 0.7 | PID ANTHRAX PATHWAY | Cellular roles of Anthrax toxin |
| 0.0 | 0.4 | PID INTEGRIN4 PATHWAY | Alpha6 beta4 integrin-ligand interactions |
| 0.0 | 0.6 | PID TOLL ENDOGENOUS PATHWAY | Endogenous TLR signaling |
Gene overrepresentation in curated gene sets: REACTOME pathways category:
| Log-likelihood per target | Total log-likelihood | Term | Description |
|---|---|---|---|
| 0.0 | 0.7 | REACTOME APOPTOTIC CLEAVAGE OF CELL ADHESION PROTEINS | Genes involved in Apoptotic cleavage of cell adhesion proteins |
| 0.0 | 0.7 | REACTOME IL1 SIGNALING | Genes involved in Interleukin-1 signaling |