Project
Epithelial-Mesenchymal Transition, human (Scheel, 2011)
Navigation
Downloads
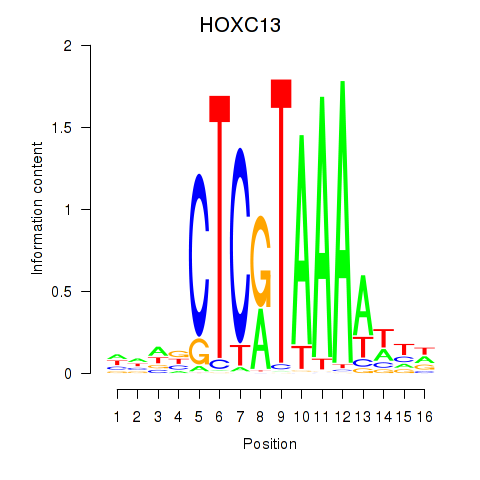
Results for HOXC13
Z-value: 0.38
Motif logo
Transcription factors associated with HOXC13
| Gene Symbol | Gene ID | Gene Info |
|---|---|---|
|
HOXC13
|
ENSG00000123364.5 | homeobox C13 |
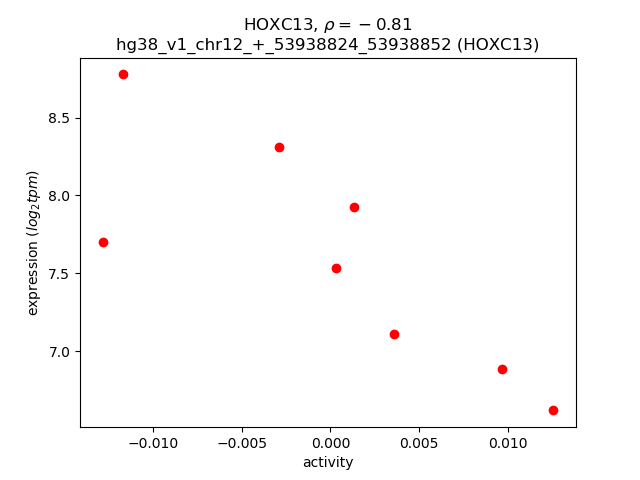
Activity-expression correlation:
| Gene | Promoter | Pearson corr. coef. | P-value | Plot |
|---|---|---|---|---|
| HOXC13 | hg38_v1_chr12_+_53938824_53938852 | -0.81 | 1.4e-02 | Click! |
Activity profile of HOXC13 motif
Sorted Z-values of HOXC13 motif
| Promoter | Log-likelihood | Transcript | Gene | Gene Info |
|---|---|---|---|---|
| chr18_+_63887698 | 0.22 |
ENST00000457692.5
ENST00000299502.9 ENST00000413956.5 |
SERPINB2
|
serpin family B member 2 |
| chr17_-_41382298 | 0.22 |
ENST00000394001.3
|
KRT34
|
keratin 34 |
| chr12_-_10998304 | 0.19 |
ENST00000538986.2
|
TAS2R20
|
taste 2 receptor member 20 |
| chr1_-_169711603 | 0.18 |
ENST00000236147.6
ENST00000650983.1 |
SELL
|
selectin L |
| chr1_+_109113963 | 0.14 |
ENST00000526264.5
|
ELAPOR1
|
endosome-lysosome associated apoptosis and autophagy regulator 1 |
| chr4_-_127965930 | 0.13 |
ENST00000641447.1
ENST00000296468.8 ENST00000641134.1 ENST00000641147.1 ENST00000641178.1 |
MFSD8
|
major facilitator superfamily domain containing 8 |
| chr4_+_94757921 | 0.13 |
ENST00000515059.6
|
BMPR1B
|
bone morphogenetic protein receptor type 1B |
| chr3_-_149377637 | 0.13 |
ENST00000305366.8
|
TM4SF1
|
transmembrane 4 L six family member 1 |
| chr11_-_7830840 | 0.13 |
ENST00000641167.1
|
OR5P3
|
olfactory receptor family 5 subfamily P member 3 |
| chr14_+_73167829 | 0.12 |
ENST00000406768.1
|
PSEN1
|
presenilin 1 |
| chr2_+_33134579 | 0.12 |
ENST00000418533.6
|
LTBP1
|
latent transforming growth factor beta binding protein 1 |
| chr11_-_5154757 | 0.12 |
ENST00000380367.3
|
OR52A1
|
olfactory receptor family 52 subfamily A member 1 |
| chr2_+_33134620 | 0.12 |
ENST00000402934.5
ENST00000404525.5 ENST00000407925.5 |
LTBP1
|
latent transforming growth factor beta binding protein 1 |
| chr12_-_11134644 | 0.12 |
ENST00000539585.1
|
TAS2R30
|
taste 2 receptor member 30 |
| chr2_-_86105839 | 0.11 |
ENST00000263857.11
|
POLR1A
|
RNA polymerase I subunit A |
| chr13_+_33818063 | 0.11 |
ENST00000434425.5
|
RFC3
|
replication factor C subunit 3 |
| chr21_+_38256698 | 0.11 |
ENST00000613499.4
ENST00000612702.4 ENST00000398925.5 ENST00000398928.5 ENST00000328656.8 ENST00000443341.5 |
KCNJ15
|
potassium inwardly rectifying channel subfamily J member 15 |
| chr10_-_77637902 | 0.11 |
ENST00000286627.10
ENST00000639486.1 ENST00000640523.1 |
KCNMA1
|
potassium calcium-activated channel subfamily M alpha 1 |
| chrX_+_49922559 | 0.11 |
ENST00000376091.8
|
CLCN5
|
chloride voltage-gated channel 5 |
| chr3_-_123620571 | 0.11 |
ENST00000583087.5
|
MYLK
|
myosin light chain kinase |
| chrX_+_49922605 | 0.11 |
ENST00000376088.7
|
CLCN5
|
chloride voltage-gated channel 5 |
| chr17_-_41489907 | 0.10 |
ENST00000328119.11
|
KRT36
|
keratin 36 |
| chr3_-_123620496 | 0.10 |
ENST00000578202.1
|
MYLK
|
myosin light chain kinase |
| chr10_-_112183698 | 0.10 |
ENST00000369425.5
ENST00000348367.9 |
GPAM
|
glycerol-3-phosphate acyltransferase, mitochondrial |
| chr1_+_43300971 | 0.10 |
ENST00000372476.8
ENST00000538015.1 |
TIE1
|
tyrosine kinase with immunoglobulin like and EGF like domains 1 |
| chr5_+_36608146 | 0.10 |
ENST00000381918.4
ENST00000513646.1 |
SLC1A3
|
solute carrier family 1 member 3 |
| chr10_-_77637789 | 0.10 |
ENST00000481070.1
ENST00000640969.1 ENST00000286628.14 ENST00000638991.1 ENST00000639913.1 ENST00000480683.2 |
KCNMA1
|
potassium calcium-activated channel subfamily M alpha 1 |
| chr11_+_62123991 | 0.10 |
ENST00000533896.5
ENST00000278849.4 ENST00000394818.8 |
INCENP
|
inner centromere protein |
| chr12_-_52434363 | 0.09 |
ENST00000252245.6
|
KRT75
|
keratin 75 |
| chr8_-_109680812 | 0.09 |
ENST00000528716.5
ENST00000527600.5 ENST00000531230.5 ENST00000532189.5 ENST00000534184.5 ENST00000408889.7 ENST00000533171.5 |
SYBU
|
syntabulin |
| chr11_+_30231000 | 0.09 |
ENST00000254122.8
ENST00000533718.2 ENST00000417547.1 |
FSHB
|
follicle stimulating hormone subunit beta |
| chr2_+_27275429 | 0.09 |
ENST00000420191.5
ENST00000296097.8 |
DNAJC5G
|
DnaJ heat shock protein family (Hsp40) member C5 gamma |
| chr5_+_36596583 | 0.09 |
ENST00000680318.1
|
SLC1A3
|
solute carrier family 1 member 3 |
| chr14_-_94509469 | 0.09 |
ENST00000677451.1
|
SERPINA12
|
serpin family A member 12 |
| chr9_-_86100123 | 0.09 |
ENST00000388711.7
ENST00000466178.1 |
GOLM1
|
golgi membrane protein 1 |
| chr2_-_224947030 | 0.09 |
ENST00000409592.7
|
DOCK10
|
dedicator of cytokinesis 10 |
| chr19_+_21082140 | 0.08 |
ENST00000616183.1
ENST00000596053.5 |
ZNF714
|
zinc finger protein 714 |
| chr9_-_136245802 | 0.08 |
ENST00000358701.10
|
QSOX2
|
quiescin sulfhydryl oxidase 2 |
| chr9_-_127771335 | 0.08 |
ENST00000373276.7
ENST00000373277.8 |
SH2D3C
|
SH2 domain containing 3C |
| chr10_-_77637721 | 0.08 |
ENST00000638848.1
ENST00000639406.1 ENST00000618048.2 ENST00000639120.1 ENST00000640834.1 ENST00000639601.1 ENST00000638514.1 ENST00000457953.6 ENST00000639090.1 ENST00000639489.1 ENST00000372440.6 ENST00000404771.8 ENST00000638203.1 ENST00000638306.1 ENST00000638351.1 ENST00000638606.1 ENST00000639591.1 ENST00000640182.1 ENST00000640605.1 ENST00000640141.1 |
KCNMA1
|
potassium calcium-activated channel subfamily M alpha 1 |
| chr19_-_20565769 | 0.08 |
ENST00000427401.9
|
ZNF737
|
zinc finger protein 737 |
| chr1_+_39215255 | 0.08 |
ENST00000671089.1
|
MACF1
|
microtubule actin crosslinking factor 1 |
| chr3_+_190615308 | 0.08 |
ENST00000412080.1
|
IL1RAP
|
interleukin 1 receptor accessory protein |
| chr16_-_72172135 | 0.08 |
ENST00000537465.5
ENST00000237353.15 |
PMFBP1
|
polyamine modulated factor 1 binding protein 1 |
| chr7_-_41703062 | 0.07 |
ENST00000242208.5
|
INHBA
|
inhibin subunit beta A |
| chr3_-_51499950 | 0.07 |
ENST00000423656.5
ENST00000504652.5 ENST00000684031.1 |
DCAF1
|
DDB1 and CUL4 associated factor 1 |
| chr1_+_34176900 | 0.07 |
ENST00000488417.2
|
C1orf94
|
chromosome 1 open reading frame 94 |
| chr1_+_109113910 | 0.07 |
ENST00000531664.5
ENST00000534476.5 |
ELAPOR1
|
endosome-lysosome associated apoptosis and autophagy regulator 1 |
| chr11_+_61228377 | 0.07 |
ENST00000537932.5
|
PGA4
|
pepsinogen A4 |
| chr9_+_114611206 | 0.07 |
ENST00000374049.4
ENST00000288502.9 |
TMEM268
|
transmembrane protein 268 |
| chr19_+_49581304 | 0.07 |
ENST00000246794.10
|
PRRG2
|
proline rich and Gla domain 2 |
| chr15_+_70892809 | 0.07 |
ENST00000260382.10
ENST00000560755.5 |
LRRC49
|
leucine rich repeat containing 49 |
| chr17_+_37375974 | 0.07 |
ENST00000615133.2
ENST00000611038.4 |
C17orf78
|
chromosome 17 open reading frame 78 |
| chr3_+_122795039 | 0.07 |
ENST00000261038.6
|
SLC49A4
|
solute carrier family 49 member 4 |
| chr6_+_87472925 | 0.06 |
ENST00000369556.7
ENST00000369557.9 ENST00000369552.9 |
SLC35A1
|
solute carrier family 35 member A1 |
| chr15_+_70892443 | 0.06 |
ENST00000443425.6
ENST00000560369.5 |
LRRC49
|
leucine rich repeat containing 49 |
| chr10_-_77638369 | 0.06 |
ENST00000372443.6
|
KCNMA1
|
potassium calcium-activated channel subfamily M alpha 1 |
| chr1_-_46941464 | 0.06 |
ENST00000462347.5
ENST00000371905.1 ENST00000310638.9 |
CYP4A11
|
cytochrome P450 family 4 subfamily A member 11 |
| chr6_-_85644043 | 0.06 |
ENST00000678930.1
ENST00000678355.1 |
SYNCRIP
|
synaptotagmin binding cytoplasmic RNA interacting protein |
| chr10_+_17951906 | 0.06 |
ENST00000377371.3
ENST00000377369.7 |
SLC39A12
|
solute carrier family 39 member 12 |
| chr10_+_17951885 | 0.06 |
ENST00000377374.8
|
SLC39A12
|
solute carrier family 39 member 12 |
| chr6_+_10585748 | 0.06 |
ENST00000265012.5
|
GCNT2
|
glucosaminyl (N-acetyl) transferase 2 (I blood group) |
| chr16_-_18896874 | 0.06 |
ENST00000565324.5
ENST00000561947.5 |
SMG1
|
SMG1 nonsense mediated mRNA decay associated PI3K related kinase |
| chr1_+_99970430 | 0.06 |
ENST00000370153.6
|
SLC35A3
|
solute carrier family 35 member A3 |
| chr10_+_17951825 | 0.06 |
ENST00000539911.5
|
SLC39A12
|
solute carrier family 39 member 12 |
| chr2_+_102337148 | 0.06 |
ENST00000311734.6
ENST00000409584.5 |
IL1RL1
|
interleukin 1 receptor like 1 |
| chr12_+_18262730 | 0.06 |
ENST00000675017.1
|
PIK3C2G
|
phosphatidylinositol-4-phosphate 3-kinase catalytic subunit type 2 gamma |
| chr11_-_124800630 | 0.06 |
ENST00000239614.8
ENST00000674284.1 |
MSANTD2
|
Myb/SANT DNA binding domain containing 2 |
| chr9_-_86099506 | 0.06 |
ENST00000388712.7
|
GOLM1
|
golgi membrane protein 1 |
| chr7_-_86965872 | 0.06 |
ENST00000398276.6
ENST00000416314.5 ENST00000425689.1 |
ELAPOR2
|
endosome-lysosome associated apoptosis and autophagy regulator family member 2 |
| chr15_+_70936487 | 0.06 |
ENST00000558456.5
ENST00000560158.6 ENST00000558808.5 ENST00000559806.5 ENST00000559069.1 |
LRRC49
|
leucine rich repeat containing 49 |
| chr5_+_140868945 | 0.05 |
ENST00000398640.7
|
PCDHA11
|
protocadherin alpha 11 |
| chr12_+_130162456 | 0.05 |
ENST00000539839.1
ENST00000229030.5 |
FZD10
|
frizzled class receptor 10 |
| chr14_-_49852760 | 0.05 |
ENST00000555970.5
ENST00000298310.10 ENST00000554626.5 ENST00000556672.1 |
NEMF
|
nuclear export mediator factor |
| chr10_+_133394119 | 0.05 |
ENST00000317502.11
ENST00000432508.3 |
MTG1
|
mitochondrial ribosome associated GTPase 1 |
| chrX_+_78747705 | 0.05 |
ENST00000614823.5
ENST00000435339.3 ENST00000514744.5 |
LPAR4
|
lysophosphatidic acid receptor 4 |
| chr2_-_222656067 | 0.05 |
ENST00000281828.8
|
FARSB
|
phenylalanyl-tRNA synthetase subunit beta |
| chr3_-_126056786 | 0.05 |
ENST00000383598.6
|
SLC41A3
|
solute carrier family 41 member 3 |
| chr12_-_13095664 | 0.05 |
ENST00000337630.10
ENST00000545699.1 |
GSG1
|
germ cell associated 1 |
| chr10_+_116427839 | 0.05 |
ENST00000369230.4
|
PNLIPRP3
|
pancreatic lipase related protein 3 |
| chr19_+_16888991 | 0.05 |
ENST00000248076.4
|
F2RL3
|
F2R like thrombin or trypsin receptor 3 |
| chr5_-_88731827 | 0.05 |
ENST00000627170.2
|
MEF2C
|
myocyte enhancer factor 2C |
| chr1_+_47137435 | 0.05 |
ENST00000371891.8
ENST00000371890.7 ENST00000619754.4 ENST00000294337.7 ENST00000620131.1 |
CYP4A22
|
cytochrome P450 family 4 subfamily A member 22 |
| chr19_-_9107475 | 0.05 |
ENST00000641081.1
|
OR7G2
|
olfactory receptor family 7 subfamily G member 2 |
| chr1_+_158845798 | 0.05 |
ENST00000438394.1
|
MNDA
|
myeloid cell nuclear differentiation antigen |
| chr11_+_123902167 | 0.05 |
ENST00000641687.1
|
OR8D4
|
olfactory receptor family 8 subfamily D member 4 |
| chr5_+_102808057 | 0.05 |
ENST00000684043.1
ENST00000682407.1 |
PAM
|
peptidylglycine alpha-amidating monooxygenase |
| chr9_-_2844058 | 0.05 |
ENST00000397885.3
|
PUM3
|
pumilio RNA binding family member 3 |
| chr3_-_172523460 | 0.05 |
ENST00000420541.6
|
TNFSF10
|
TNF superfamily member 10 |
| chr7_-_30026617 | 0.05 |
ENST00000222803.10
|
FKBP14
|
FKBP prolyl isomerase 14 |
| chr3_-_172523423 | 0.05 |
ENST00000241261.7
|
TNFSF10
|
TNF superfamily member 10 |
| chr13_+_33818122 | 0.05 |
ENST00000380071.8
|
RFC3
|
replication factor C subunit 3 |
| chr19_+_20923222 | 0.05 |
ENST00000597314.5
ENST00000328178.13 ENST00000601924.5 |
ZNF85
|
zinc finger protein 85 |
| chr7_-_57132425 | 0.05 |
ENST00000319636.10
|
ZNF479
|
zinc finger protein 479 |
| chr8_-_92017637 | 0.05 |
ENST00000422361.6
|
RUNX1T1
|
RUNX1 partner transcriptional co-repressor 1 |
| chrX_+_114584037 | 0.05 |
ENST00000371951.5
ENST00000371950.3 ENST00000276198.6 |
HTR2C
|
5-hydroxytryptamine receptor 2C |
| chr17_-_17577440 | 0.05 |
ENST00000395782.5
|
PEMT
|
phosphatidylethanolamine N-methyltransferase |
| chr19_+_21142024 | 0.05 |
ENST00000600692.5
ENST00000599296.5 ENST00000594425.5 ENST00000311048.11 |
ZNF431
|
zinc finger protein 431 |
| chr15_+_76931704 | 0.05 |
ENST00000320963.9
ENST00000394885.8 ENST00000394883.3 |
RCN2
|
reticulocalbin 2 |
| chr18_-_72865680 | 0.04 |
ENST00000397929.5
|
NETO1
|
neuropilin and tolloid like 1 |
| chr11_+_89924064 | 0.04 |
ENST00000623787.3
|
TRIM49D2
|
tripartite motif containing 49D2 |
| chr3_-_100993409 | 0.04 |
ENST00000471714.6
|
ABI3BP
|
ABI family member 3 binding protein |
| chr3_+_155083889 | 0.04 |
ENST00000680282.1
|
MME
|
membrane metalloendopeptidase |
| chr8_+_132866948 | 0.04 |
ENST00000220616.9
|
TG
|
thyroglobulin |
| chr4_-_154612635 | 0.04 |
ENST00000407946.5
ENST00000405164.5 ENST00000336098.8 ENST00000393846.6 ENST00000404648.7 ENST00000443553.5 |
FGG
|
fibrinogen gamma chain |
| chr12_+_45216128 | 0.04 |
ENST00000681156.1
|
ANO6
|
anoctamin 6 |
| chr8_-_108787563 | 0.04 |
ENST00000297459.4
|
TMEM74
|
transmembrane protein 74 |
| chr17_+_50373214 | 0.04 |
ENST00000393271.6
ENST00000338165.9 ENST00000511519.6 |
EME1
|
essential meiotic structure-specific endonuclease 1 |
| chr3_+_98147479 | 0.04 |
ENST00000641380.1
|
OR5H14
|
olfactory receptor family 5 subfamily H member 14 |
| chr9_-_101384999 | 0.04 |
ENST00000259407.7
|
BAAT
|
bile acid-CoA:amino acid N-acyltransferase |
| chr6_+_87407965 | 0.04 |
ENST00000369562.9
|
CFAP206
|
cilia and flagella associated protein 206 |
| chr4_+_169660062 | 0.04 |
ENST00000507875.5
ENST00000613795.4 |
CLCN3
|
chloride voltage-gated channel 3 |
| chr16_-_84617547 | 0.04 |
ENST00000567786.2
|
COTL1
|
coactosin like F-actin binding protein 1 |
| chr11_+_118304721 | 0.04 |
ENST00000361763.9
|
CD3E
|
CD3e molecule |
| chrM_+_8489 | 0.04 |
ENST00000361899.2
|
MT-ATP6
|
mitochondrially encoded ATP synthase membrane subunit 6 |
| chr4_+_20251896 | 0.04 |
ENST00000504154.6
|
SLIT2
|
slit guidance ligand 2 |
| chr13_-_102798958 | 0.04 |
ENST00000376004.5
|
POGLUT2
|
protein O-glucosyltransferase 2 |
| chr9_-_32526185 | 0.04 |
ENST00000379883.3
ENST00000379868.6 ENST00000679859.1 |
DDX58
|
DExD/H-box helicase 58 |
| chr2_+_137964279 | 0.03 |
ENST00000329366.8
|
HNMT
|
histamine N-methyltransferase |
| chr9_+_101185029 | 0.03 |
ENST00000395056.2
|
PLPPR1
|
phospholipid phosphatase related 1 |
| chr19_-_11346196 | 0.03 |
ENST00000586218.5
|
TMEM205
|
transmembrane protein 205 |
| chr1_+_89995102 | 0.03 |
ENST00000340281.9
ENST00000361911.9 ENST00000370447.3 |
ZNF326
|
zinc finger protein 326 |
| chr3_-_98523013 | 0.03 |
ENST00000394181.6
ENST00000508902.5 ENST00000394180.6 |
CLDND1
|
claudin domain containing 1 |
| chr19_+_11239602 | 0.03 |
ENST00000252453.12
|
ANGPTL8
|
angiopoietin like 8 |
| chr12_+_45216079 | 0.03 |
ENST00000423947.7
ENST00000680498.1 ENST00000320560.13 |
ANO6
|
anoctamin 6 |
| chr6_+_42155399 | 0.03 |
ENST00000623004.2
ENST00000372963.4 ENST00000654459.1 |
GUCA1ANB
GUCA1A
|
GUCA1A neighbor guanylate cyclase activator 1A |
| chr22_+_32043253 | 0.03 |
ENST00000266088.9
|
SLC5A1
|
solute carrier family 5 member 1 |
| chr5_+_42756811 | 0.03 |
ENST00000388827.4
ENST00000361970.10 |
CCDC152
|
coiled-coil domain containing 152 |
| chr1_-_150236150 | 0.03 |
ENST00000629042.2
|
ANP32E
|
acidic nuclear phosphoprotein 32 family member E |
| chr3_+_101779425 | 0.03 |
ENST00000491511.6
|
NXPE3
|
neurexophilin and PC-esterase domain family member 3 |
| chr3_-_71130557 | 0.03 |
ENST00000497355.7
|
FOXP1
|
forkhead box P1 |
| chr9_-_72060605 | 0.03 |
ENST00000377024.8
ENST00000651200.2 ENST00000652752.1 |
C9orf57
|
chromosome 9 open reading frame 57 |
| chr1_+_174875505 | 0.03 |
ENST00000486220.5
|
RABGAP1L
|
RAB GTPase activating protein 1 like |
| chr12_+_47773195 | 0.03 |
ENST00000442218.3
|
SLC48A1
|
solute carrier family 48 member 1 |
| chr12_-_4538440 | 0.03 |
ENST00000261250.8
ENST00000541014.5 ENST00000545746.5 ENST00000542080.5 |
C12orf4
|
chromosome 12 open reading frame 4 |
| chr19_-_11346228 | 0.03 |
ENST00000588560.5
ENST00000592952.5 |
TMEM205
|
transmembrane protein 205 |
| chr12_-_57237090 | 0.03 |
ENST00000556732.1
|
NDUFA4L2
|
NDUFA4 mitochondrial complex associated like 2 |
| chr1_-_150236064 | 0.03 |
ENST00000532744.2
ENST00000369114.9 ENST00000369115.3 ENST00000583931.6 |
ANP32E
|
acidic nuclear phosphoprotein 32 family member E |
| chr8_+_117135259 | 0.03 |
ENST00000519688.5
|
SLC30A8
|
solute carrier family 30 member 8 |
| chr8_+_144798913 | 0.03 |
ENST00000359971.4
ENST00000528012.5 |
ZNF517
|
zinc finger protein 517 |
| chr2_+_191245185 | 0.03 |
ENST00000418908.5
ENST00000339514.8 ENST00000392318.8 |
MYO1B
|
myosin IB |
| chr1_-_150235995 | 0.03 |
ENST00000436748.6
|
ANP32E
|
acidic nuclear phosphoprotein 32 family member E |
| chr9_-_72060590 | 0.03 |
ENST00000652156.1
|
C9orf57
|
chromosome 9 open reading frame 57 |
| chr3_-_15797930 | 0.03 |
ENST00000683139.1
|
ANKRD28
|
ankyrin repeat domain 28 |
| chr19_+_21082224 | 0.03 |
ENST00000620627.1
|
ZNF714
|
zinc finger protein 714 |
| chr6_-_52087569 | 0.03 |
ENST00000340994.4
ENST00000371117.8 |
PKHD1
|
PKHD1 ciliary IPT domain containing fibrocystin/polyductin |
| chr16_-_11273610 | 0.03 |
ENST00000327157.4
|
PRM3
|
protamine 3 |
| chr4_+_121801311 | 0.03 |
ENST00000379663.7
ENST00000243498.10 ENST00000509800.5 |
EXOSC9
|
exosome component 9 |
| chr5_-_78985951 | 0.03 |
ENST00000396151.7
|
ARSB
|
arylsulfatase B |
| chr5_-_161546970 | 0.03 |
ENST00000675303.1
|
GABRB2
|
gamma-aminobutyric acid type A receptor subunit beta2 |
| chr3_+_155083523 | 0.03 |
ENST00000680057.1
|
MME
|
membrane metalloendopeptidase |
| chr5_-_180649613 | 0.03 |
ENST00000393347.7
ENST00000619105.4 |
FLT4
|
fms related receptor tyrosine kinase 4 |
| chr1_+_149477960 | 0.03 |
ENST00000369227.7
|
NBPF19
|
NBPF member 19 |
| chr11_+_22668101 | 0.03 |
ENST00000630668.2
ENST00000278187.7 |
GAS2
|
growth arrest specific 2 |
| chr2_+_37925256 | 0.02 |
ENST00000354545.8
|
RMDN2
|
regulator of microtubule dynamics 2 |
| chr14_+_71586261 | 0.02 |
ENST00000358550.6
|
SIPA1L1
|
signal induced proliferation associated 1 like 1 |
| chr5_-_161546671 | 0.02 |
ENST00000517547.5
|
GABRB2
|
gamma-aminobutyric acid type A receptor subunit beta2 |
| chr16_-_2329687 | 0.02 |
ENST00000567910.1
|
ABCA3
|
ATP binding cassette subfamily A member 3 |
| chr2_+_167187364 | 0.02 |
ENST00000672671.1
|
XIRP2
|
xin actin binding repeat containing 2 |
| chr1_-_85708382 | 0.02 |
ENST00000370574.4
ENST00000431532.6 |
ZNHIT6
|
zinc finger HIT-type containing 6 |
| chr19_-_11346406 | 0.02 |
ENST00000587948.5
|
TMEM205
|
transmembrane protein 205 |
| chr7_+_65373839 | 0.02 |
ENST00000431504.1
ENST00000328747.12 |
ZNF92
|
zinc finger protein 92 |
| chr4_+_71062642 | 0.02 |
ENST00000649996.1
|
SLC4A4
|
solute carrier family 4 member 4 |
| chr5_-_161546708 | 0.02 |
ENST00000393959.6
|
GABRB2
|
gamma-aminobutyric acid type A receptor subunit beta2 |
| chr4_+_87799546 | 0.02 |
ENST00000226284.7
|
IBSP
|
integrin binding sialoprotein |
| chr10_-_46046264 | 0.02 |
ENST00000581478.5
ENST00000582163.3 |
MSMB
|
microseminoprotein beta |
| chr1_-_244862381 | 0.02 |
ENST00000640001.1
ENST00000639628.1 |
HNRNPU
|
heterogeneous nuclear ribonucleoprotein U |
| chr12_+_64780465 | 0.02 |
ENST00000542120.6
|
TBC1D30
|
TBC1 domain family member 30 |
| chr12_-_118359105 | 0.02 |
ENST00000541186.5
ENST00000539872.5 |
TAOK3
|
TAO kinase 3 |
| chr17_-_44014946 | 0.02 |
ENST00000587529.1
ENST00000206380.8 |
TMEM101
|
transmembrane protein 101 |
| chr7_+_65373873 | 0.02 |
ENST00000450302.2
|
ZNF92
|
zinc finger protein 92 |
| chr11_-_114559866 | 0.02 |
ENST00000534921.2
|
NXPE1
|
neurexophilin and PC-esterase domain family member 1 |
| chr4_-_163473732 | 0.02 |
ENST00000280605.5
|
TKTL2
|
transketolase like 2 |
| chr17_-_41481140 | 0.02 |
ENST00000246639.6
ENST00000393989.1 |
KRT35
|
keratin 35 |
| chr7_+_57450171 | 0.02 |
ENST00000420713.2
|
ZNF716
|
zinc finger protein 716 |
| chr12_-_55296569 | 0.02 |
ENST00000358433.3
|
OR6C6
|
olfactory receptor family 6 subfamily C member 6 |
| chr6_-_144008118 | 0.02 |
ENST00000629195.2
ENST00000650125.1 ENST00000647880.1 ENST00000649307.1 ENST00000674357.1 ENST00000417959.4 ENST00000635591.1 |
PLAGL1
HYMAI
|
PLAG1 like zinc finger 1 hydatidiform mole associated and imprinted |
| chr12_+_4649097 | 0.02 |
ENST00000648836.1
ENST00000266544.10 |
ENSG00000255639.3
NDUFA9
|
novel protein NADH:ubiquinone oxidoreductase subunit A9 |
| chr22_+_22322452 | 0.02 |
ENST00000390290.3
|
IGLV1-51
|
immunoglobulin lambda variable 1-51 |
| chr1_+_50105666 | 0.02 |
ENST00000651347.1
|
ELAVL4
|
ELAV like RNA binding protein 4 |
| chr1_+_54641806 | 0.02 |
ENST00000409996.5
|
MROH7
|
maestro heat like repeat family member 7 |
| chr12_-_52814106 | 0.02 |
ENST00000551956.2
|
KRT4
|
keratin 4 |
| chr7_-_75994574 | 0.02 |
ENST00000439537.5
ENST00000493111.7 ENST00000417509.5 ENST00000485200.1 |
TMEM120A
|
transmembrane protein 120A |
| chr1_+_54641754 | 0.02 |
ENST00000339553.9
ENST00000421030.7 |
MROH7
|
maestro heat like repeat family member 7 |
| chr6_-_33271835 | 0.02 |
ENST00000482399.5
ENST00000445902.3 |
VPS52
|
VPS52 subunit of GARP complex |
| chr1_+_50106265 | 0.02 |
ENST00000357083.8
|
ELAVL4
|
ELAV like RNA binding protein 4 |
| chr11_-_5269933 | 0.02 |
ENST00000396895.3
|
HBE1
|
hemoglobin subunit epsilon 1 |
| chr19_+_21082190 | 0.02 |
ENST00000618422.1
ENST00000618008.4 ENST00000425625.5 ENST00000456283.7 |
ZNF714
|
zinc finger protein 714 |
| chr12_-_118359639 | 0.02 |
ENST00000541786.5
ENST00000419821.6 ENST00000541878.5 |
TAOK3
|
TAO kinase 3 |
| chr1_+_213051229 | 0.02 |
ENST00000615329.4
ENST00000543354.5 ENST00000614059.4 ENST00000543470.5 ENST00000366960.8 ENST00000366959.4 |
RPS6KC1
|
ribosomal protein S6 kinase C1 |
| chr3_-_45995807 | 0.02 |
ENST00000535325.5
ENST00000296137.7 |
FYCO1
|
FYVE and coiled-coil domain autophagy adaptor 1 |
| chr11_+_66510626 | 0.02 |
ENST00000526815.5
ENST00000318312.12 ENST00000525809.5 ENST00000455748.6 ENST00000393994.4 ENST00000630659.2 |
BBS1
|
Bardet-Biedl syndrome 1 |
| chr7_-_144410227 | 0.02 |
ENST00000467773.1
ENST00000483238.5 |
NOBOX
|
NOBOX oogenesis homeobox |
| chr18_-_27143024 | 0.02 |
ENST00000581714.5
|
CHST9
|
carbohydrate sulfotransferase 9 |
| chr10_-_68527498 | 0.02 |
ENST00000609923.6
|
SLC25A16
|
solute carrier family 25 member 16 |
| chr11_-_114559847 | 0.02 |
ENST00000251921.6
|
NXPE1
|
neurexophilin and PC-esterase domain family member 1 |
| chr1_-_150235972 | 0.02 |
ENST00000534220.1
|
ANP32E
|
acidic nuclear phosphoprotein 32 family member E |
| chr19_-_6737565 | 0.01 |
ENST00000601716.1
ENST00000264080.11 |
GPR108
|
G protein-coupled receptor 108 |
| chr19_-_11346486 | 0.01 |
ENST00000590482.5
|
TMEM205
|
transmembrane protein 205 |
| chr16_-_67999468 | 0.01 |
ENST00000393847.6
ENST00000573808.1 ENST00000572624.5 |
DPEP2
|
dipeptidase 2 |
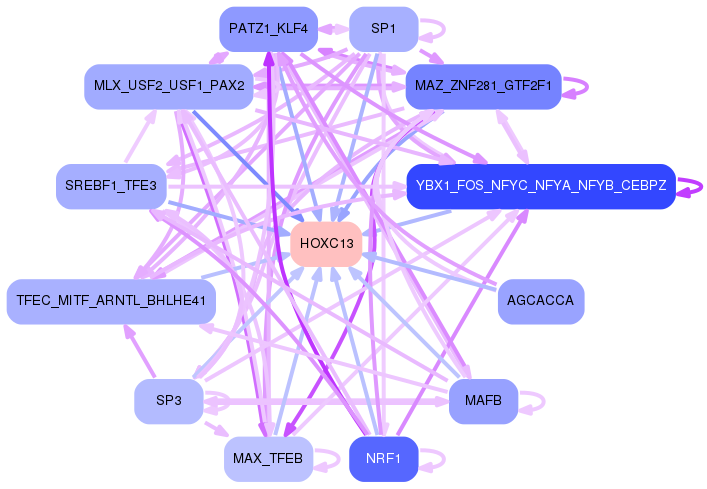
Network of associatons between targets according to the STRING database.

First level regulatory network of HOXC13
Gene Ontology Analysis
Gene overrepresentation in biological process category:
| Log-likelihood per target | Total log-likelihood | Term | Description |
|---|---|---|---|
| 0.0 | 0.2 | GO:0060414 | aorta smooth muscle tissue morphogenesis(GO:0060414) |
| 0.0 | 0.2 | GO:0035583 | sequestering of TGFbeta in extracellular matrix(GO:0035583) |
| 0.0 | 0.3 | GO:0034465 | response to carbon monoxide(GO:0034465) |
| 0.0 | 0.1 | GO:0060279 | positive regulation of ovulation(GO:0060279) |
| 0.0 | 0.1 | GO:0016080 | synaptic vesicle targeting(GO:0016080) |
| 0.0 | 0.2 | GO:1900262 | regulation of DNA-directed DNA polymerase activity(GO:1900262) positive regulation of DNA-directed DNA polymerase activity(GO:1900264) |
| 0.0 | 0.1 | GO:1990569 | UDP-N-acetylglucosamine transport(GO:0015788) UDP-N-acetylglucosamine transmembrane transport(GO:1990569) |
| 0.0 | 0.1 | GO:0038172 | interleukin-33-mediated signaling pathway(GO:0038172) |
| 0.0 | 0.1 | GO:1902731 | ovarian cumulus expansion(GO:0001550) fused antrum stage(GO:0048165) negative regulation of chondrocyte proliferation(GO:1902731) |
| 0.0 | 0.2 | GO:0006537 | glutamate biosynthetic process(GO:0006537) gamma-aminobutyric acid biosynthetic process(GO:0009449) |
| 0.0 | 0.1 | GO:1904749 | regulation of protein localization to nucleolus(GO:1904749) |
| 0.0 | 0.1 | GO:0003095 | pressure natriuresis(GO:0003095) |
| 0.0 | 0.0 | GO:0043396 | corticotropin-releasing hormone secretion(GO:0043396) regulation of corticotropin-releasing hormone secretion(GO:0043397) |
| 0.0 | 0.0 | GO:0072429 | response to intra-S DNA damage checkpoint signaling(GO:0072429) |
| 0.0 | 0.1 | GO:0097045 | phosphatidylserine exposure on blood platelet(GO:0097045) |
| 0.0 | 0.1 | GO:0006701 | progesterone biosynthetic process(GO:0006701) Sertoli cell proliferation(GO:0060011) |
| 0.0 | 0.0 | GO:0071676 | negative regulation of mononuclear cell migration(GO:0071676) |
| 0.0 | 0.0 | GO:0018032 | protein amidation(GO:0018032) |
| 0.0 | 0.1 | GO:0070236 | negative regulation of activation-induced cell death of T cells(GO:0070236) |
| 0.0 | 0.2 | GO:0071578 | zinc II ion transmembrane import(GO:0071578) |
| 0.0 | 0.1 | GO:1990164 | histone H2A phosphorylation(GO:1990164) |
Gene overrepresentation in cellular component category:
| Log-likelihood per target | Total log-likelihood | Term | Description |
|---|---|---|---|
| 0.0 | 0.1 | GO:0043512 | inhibin complex(GO:0043511) inhibin A complex(GO:0043512) |
| 0.0 | 0.2 | GO:0005663 | DNA replication factor C complex(GO:0005663) |
| 0.0 | 0.1 | GO:0000801 | central element(GO:0000801) |
| 0.0 | 0.1 | GO:0070765 | gamma-secretase complex(GO:0070765) |
| 0.0 | 0.0 | GO:0097545 | radial spoke(GO:0001534) axonemal outer doublet(GO:0097545) |
| 0.0 | 0.1 | GO:0009328 | phenylalanine-tRNA ligase complex(GO:0009328) |
| 0.0 | 0.0 | GO:0005753 | mitochondrial proton-transporting ATP synthase complex(GO:0005753) proton-transporting ATP synthase complex(GO:0045259) |
| 0.0 | 0.0 | GO:0044609 | DBIRD complex(GO:0044609) |
Gene overrepresentation in molecular function category:
| Log-likelihood per target | Total log-likelihood | Term | Description |
|---|---|---|---|
| 0.0 | 0.2 | GO:0050436 | microfibril binding(GO:0050436) |
| 0.0 | 0.3 | GO:0060072 | large conductance calcium-activated potassium channel activity(GO:0060072) |
| 0.0 | 0.2 | GO:0043208 | glycosphingolipid binding(GO:0043208) |
| 0.0 | 0.2 | GO:0004687 | myosin light chain kinase activity(GO:0004687) |
| 0.0 | 0.1 | GO:0005462 | UDP-N-acetylglucosamine transmembrane transporter activity(GO:0005462) |
| 0.0 | 0.1 | GO:0002113 | interleukin-33 binding(GO:0002113) |
| 0.0 | 0.1 | GO:0002114 | interleukin-33 receptor activity(GO:0002114) |
| 0.0 | 0.2 | GO:0003689 | DNA clamp loader activity(GO:0003689) protein-DNA loading ATPase activity(GO:0033170) |
| 0.0 | 0.1 | GO:0042500 | aspartic endopeptidase activity, intramembrane cleaving(GO:0042500) |
| 0.0 | 0.1 | GO:0016971 | flavin-linked sulfhydryl oxidase activity(GO:0016971) |
| 0.0 | 0.1 | GO:0004366 | glycerol-3-phosphate O-acyltransferase activity(GO:0004366) |
| 0.0 | 0.3 | GO:0033038 | bitter taste receptor activity(GO:0033038) |
| 0.0 | 0.0 | GO:0080101 | phosphatidyl-N-methylethanolamine N-methyltransferase activity(GO:0000773) phosphatidylethanolamine N-methyltransferase activity(GO:0004608) phosphatidyl-N-dimethylethanolamine N-methyltransferase activity(GO:0080101) |
| 0.0 | 0.0 | GO:0052816 | medium-chain acyl-CoA hydrolase activity(GO:0052815) long-chain acyl-CoA hydrolase activity(GO:0052816) |
| 0.0 | 0.2 | GO:0015501 | glutamate:sodium symporter activity(GO:0015501) |
| 0.0 | 0.3 | GO:0005247 | voltage-gated chloride channel activity(GO:0005247) |
| 0.0 | 0.0 | GO:0004598 | peptidylglycine monooxygenase activity(GO:0004504) peptidylamidoglycolate lyase activity(GO:0004598) |
| 0.0 | 0.1 | GO:0005025 | transforming growth factor beta receptor activity, type I(GO:0005025) |
| 0.0 | 0.1 | GO:0050051 | alkane 1-monooxygenase activity(GO:0018685) leukotriene-B4 20-monooxygenase activity(GO:0050051) |
Gene overrepresentation in curated gene sets: REACTOME pathways category:
| Log-likelihood per target | Total log-likelihood | Term | Description |
|---|---|---|---|
| 0.0 | 0.2 | REACTOME GLYCOPROTEIN HORMONES | Genes involved in Glycoprotein hormones |