Project
Epithelial-Mesenchymal Transition, human (Scheel, 2011)
Navigation
Downloads
Results for ID4_TCF4_SNAI2
Z-value: 3.38
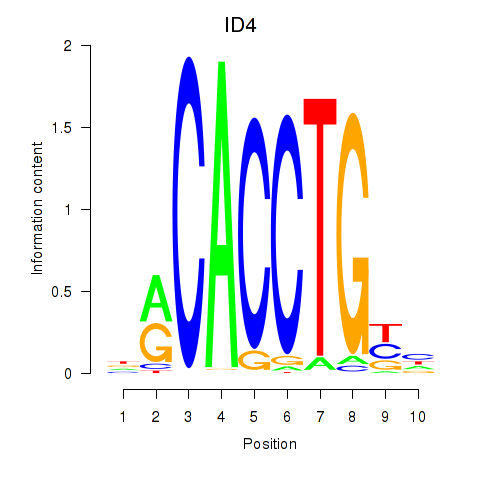
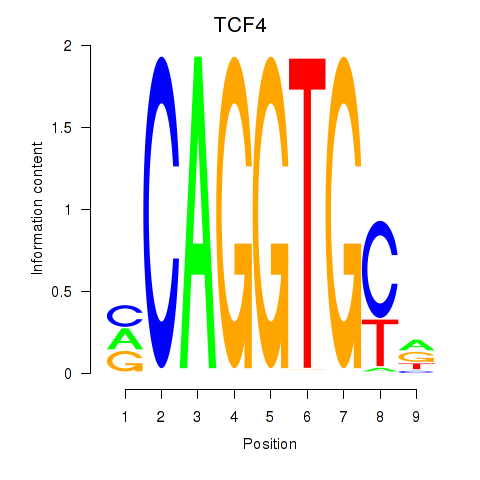
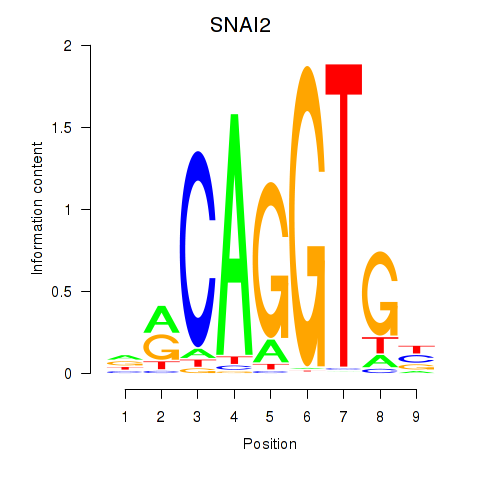
Motif logo
Transcription factors associated with ID4_TCF4_SNAI2
| Gene Symbol | Gene ID | Gene Info |
|---|---|---|
|
ID4
|
ENSG00000172201.12 | inhibitor of DNA binding 4, HLH protein |
|
TCF4
|
ENSG00000196628.20 | transcription factor 4 |
|
SNAI2
|
ENSG00000019549.13 | snail family transcriptional repressor 2 |
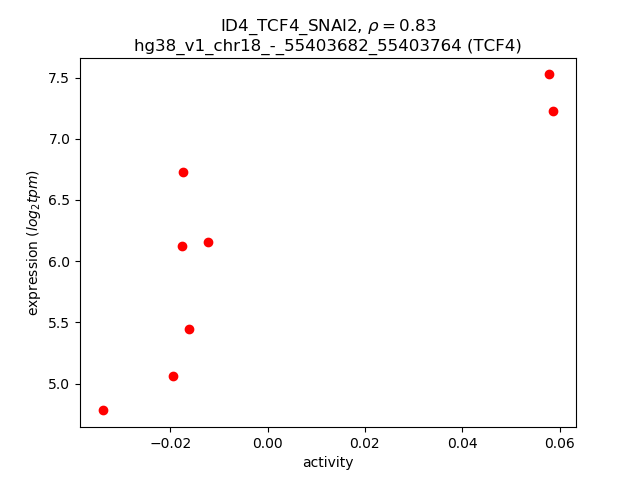
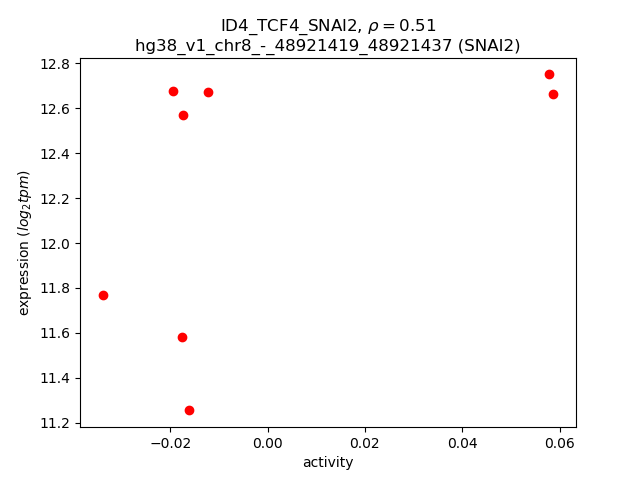
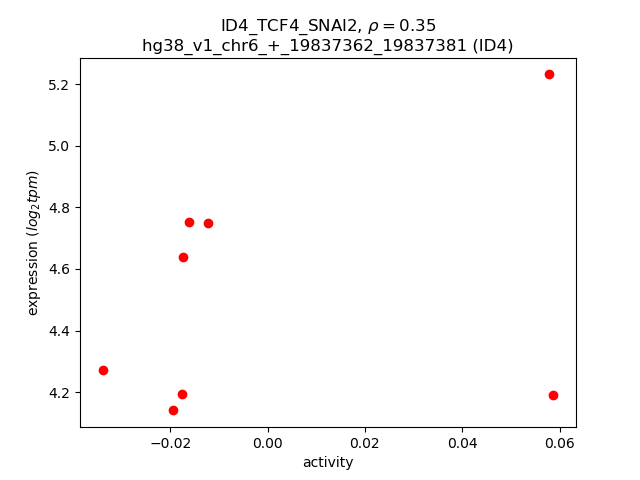
Activity-expression correlation:
| Gene | Promoter | Pearson corr. coef. | P-value | Plot |
|---|---|---|---|---|
| TCF4 | hg38_v1_chr18_-_55403682_55403764 | 0.83 | 1.0e-02 | Click! |
| SNAI2 | hg38_v1_chr8_-_48921419_48921437 | 0.51 | 2.0e-01 | Click! |
| ID4 | hg38_v1_chr6_+_19837362_19837381 | 0.35 | 3.9e-01 | Click! |
Activity profile of ID4_TCF4_SNAI2 motif
Sorted Z-values of ID4_TCF4_SNAI2 motif
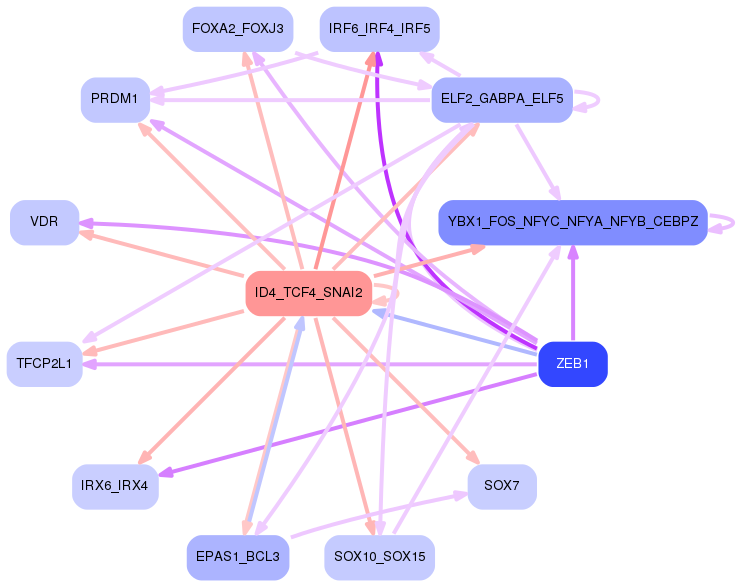
Network of associatons between targets according to the STRING database.

First level regulatory network of ID4_TCF4_SNAI2
Gene Ontology Analysis
Gene overrepresentation in biological process category:
| Log-likelihood per target | Total log-likelihood | Term | Description |
|---|---|---|---|
| 5.1 | 30.5 | GO:1904274 | tricellular tight junction assembly(GO:1904274) |
| 4.7 | 18.7 | GO:0060671 | epithelial cell differentiation involved in embryonic placenta development(GO:0060671) epithelial cell morphogenesis involved in placental branching(GO:0060672) |
| 2.9 | 8.7 | GO:0048817 | negative regulation of hair follicle maturation(GO:0048817) |
| 2.0 | 12.2 | GO:0002225 | positive regulation of antimicrobial peptide production(GO:0002225) positive regulation of antibacterial peptide production(GO:0002803) |
| 1.9 | 11.4 | GO:2001181 | positive regulation of interleukin-10 secretion(GO:2001181) |
| 1.9 | 7.4 | GO:1903575 | cornified envelope assembly(GO:1903575) |
| 1.6 | 12.8 | GO:0086073 | bundle of His cell-Purkinje myocyte adhesion involved in cell communication(GO:0086073) |
| 1.6 | 7.8 | GO:0097021 | lymphocyte migration into lymphoid organs(GO:0097021) |
| 1.5 | 7.6 | GO:0044752 | response to human chorionic gonadotropin(GO:0044752) |
| 1.5 | 1.5 | GO:0045976 | negative regulation of mitotic cell cycle, embryonic(GO:0045976) |
| 1.5 | 4.5 | GO:2000309 | positive regulation of tumor necrosis factor (ligand) superfamily member 11 production(GO:2000309) |
| 1.5 | 5.9 | GO:0032913 | B cell receptor transport within lipid bilayer(GO:0032595) B cell receptor transport into membrane raft(GO:0032597) protein transport out of membrane raft(GO:0032599) chemokine receptor transport out of membrane raft(GO:0032600) negative regulation of transforming growth factor beta3 production(GO:0032913) chemokine receptor transport within lipid bilayer(GO:0033606) |
| 1.3 | 3.8 | GO:0043000 | Golgi to plasma membrane CFTR protein transport(GO:0043000) |
| 1.2 | 5.9 | GO:0034343 | type III interferon production(GO:0034343) regulation of type III interferon production(GO:0034344) |
| 1.1 | 8.0 | GO:0032439 | endosome localization(GO:0032439) |
| 1.1 | 3.4 | GO:0002415 | immunoglobulin transcytosis in epithelial cells mediated by polymeric immunoglobulin receptor(GO:0002415) |
| 1.1 | 12.2 | GO:0071680 | response to indole-3-methanol(GO:0071680) cellular response to indole-3-methanol(GO:0071681) |
| 1.0 | 2.1 | GO:0002585 | positive regulation of antigen processing and presentation of peptide or polysaccharide antigen via MHC class II(GO:0002582) positive regulation of antigen processing and presentation of peptide antigen(GO:0002585) positive regulation of antigen processing and presentation of peptide antigen via MHC class II(GO:0002588) |
| 1.0 | 5.1 | GO:0071109 | superior temporal gyrus development(GO:0071109) |
| 1.0 | 4.0 | GO:0010979 | regulation of vitamin D 24-hydroxylase activity(GO:0010979) positive regulation of vitamin D 24-hydroxylase activity(GO:0010980) |
| 1.0 | 2.0 | GO:0002159 | desmosome assembly(GO:0002159) |
| 0.9 | 2.8 | GO:0048560 | establishment of anatomical structure orientation(GO:0048560) |
| 0.9 | 2.7 | GO:0045014 | carbon catabolite repression of transcription(GO:0045013) negative regulation of transcription by glucose(GO:0045014) |
| 0.9 | 3.6 | GO:0034164 | negative regulation of toll-like receptor 9 signaling pathway(GO:0034164) |
| 0.9 | 2.7 | GO:0042231 | interleukin-13 biosynthetic process(GO:0042231) |
| 0.8 | 2.5 | GO:0061573 | endoplasmic reticulum polarization(GO:0061163) actin filament bundle retrograde transport(GO:0061573) actin filament bundle distribution(GO:0070650) |
| 0.8 | 22.5 | GO:0031581 | hemidesmosome assembly(GO:0031581) |
| 0.8 | 4.0 | GO:0048319 | axial mesoderm morphogenesis(GO:0048319) |
| 0.8 | 2.4 | GO:0070318 | positive regulation of G0 to G1 transition(GO:0070318) |
| 0.8 | 9.9 | GO:0038129 | ERBB3 signaling pathway(GO:0038129) |
| 0.8 | 5.3 | GO:2000048 | negative regulation of cell-cell adhesion mediated by cadherin(GO:2000048) |
| 0.7 | 1.5 | GO:0046136 | positive regulation of vitamin metabolic process(GO:0046136) positive regulation of vitamin D biosynthetic process(GO:0060557) positive regulation of calcidiol 1-monooxygenase activity(GO:0060559) |
| 0.7 | 4.4 | GO:0045218 | zonula adherens maintenance(GO:0045218) |
| 0.7 | 2.2 | GO:0009720 | detection of hormone stimulus(GO:0009720) |
| 0.7 | 6.5 | GO:0001661 | conditioned taste aversion(GO:0001661) |
| 0.7 | 2.1 | GO:1900220 | semaphorin-plexin signaling pathway involved in bone trabecula morphogenesis(GO:1900220) |
| 0.7 | 4.1 | GO:0003011 | involuntary skeletal muscle contraction(GO:0003011) |
| 0.7 | 2.0 | GO:0003245 | cardiac muscle tissue growth involved in heart morphogenesis(GO:0003245) |
| 0.7 | 2.7 | GO:0015772 | disaccharide transport(GO:0015766) sucrose transport(GO:0015770) oligosaccharide transport(GO:0015772) |
| 0.7 | 2.6 | GO:0000738 | DNA catabolic process, exonucleolytic(GO:0000738) |
| 0.6 | 3.8 | GO:0006021 | inositol biosynthetic process(GO:0006021) |
| 0.6 | 3.2 | GO:2000721 | positive regulation of transcription from RNA polymerase II promoter involved in smooth muscle cell differentiation(GO:2000721) |
| 0.6 | 5.0 | GO:0060750 | epithelial cell proliferation involved in mammary gland duct elongation(GO:0060750) |
| 0.6 | 2.4 | GO:0097089 | methyl-branched fatty acid metabolic process(GO:0097089) |
| 0.6 | 1.8 | GO:0071810 | circadian temperature homeostasis(GO:0060086) regulation of fever generation by regulation of prostaglandin secretion(GO:0071810) positive regulation of fever generation by positive regulation of prostaglandin secretion(GO:0071812) positive regulation of ERK1 and ERK2 cascade via TNFSF11-mediated signaling(GO:0071848) regulation of fever generation by prostaglandin secretion(GO:0100009) |
| 0.6 | 1.2 | GO:0097252 | oligodendrocyte apoptotic process(GO:0097252) |
| 0.6 | 4.6 | GO:0044332 | Wnt signaling pathway involved in dorsal/ventral axis specification(GO:0044332) |
| 0.6 | 2.8 | GO:0071955 | recycling endosome to Golgi transport(GO:0071955) |
| 0.6 | 12.3 | GO:0051823 | regulation of synapse structural plasticity(GO:0051823) |
| 0.6 | 8.9 | GO:0090179 | planar cell polarity pathway involved in neural tube closure(GO:0090179) |
| 0.6 | 5.0 | GO:0061302 | smooth muscle cell-matrix adhesion(GO:0061302) |
| 0.5 | 3.8 | GO:0010481 | epidermal cell division(GO:0010481) regulation of epidermal cell division(GO:0010482) |
| 0.5 | 1.6 | GO:0060003 | copper ion export(GO:0060003) |
| 0.5 | 6.8 | GO:0001766 | membrane raft polarization(GO:0001766) membrane raft distribution(GO:0031580) |
| 0.5 | 4.5 | GO:0070673 | response to interleukin-18(GO:0070673) |
| 0.5 | 2.5 | GO:0002934 | desmosome organization(GO:0002934) |
| 0.5 | 5.5 | GO:0019368 | fatty acid elongation, saturated fatty acid(GO:0019367) fatty acid elongation, unsaturated fatty acid(GO:0019368) fatty acid elongation, monounsaturated fatty acid(GO:0034625) fatty acid elongation, polyunsaturated fatty acid(GO:0034626) |
| 0.5 | 1.5 | GO:1990654 | regulation of extrathymic T cell differentiation(GO:0033082) sebum secreting cell proliferation(GO:1990654) |
| 0.5 | 2.5 | GO:0010986 | positive regulation of lipoprotein particle clearance(GO:0010986) |
| 0.5 | 2.5 | GO:1904209 | regulation of chemokine (C-C motif) ligand 2 secretion(GO:1904207) positive regulation of chemokine (C-C motif) ligand 2 secretion(GO:1904209) |
| 0.5 | 3.4 | GO:0001705 | ectoderm formation(GO:0001705) ectodermal cell fate commitment(GO:0001712) |
| 0.5 | 3.4 | GO:0015705 | iodide transport(GO:0015705) |
| 0.5 | 1.0 | GO:0060809 | mesodermal to mesenchymal transition involved in gastrulation(GO:0060809) |
| 0.5 | 1.4 | GO:0000103 | sulfate assimilation(GO:0000103) |
| 0.5 | 1.4 | GO:0060166 | olfactory pit development(GO:0060166) |
| 0.5 | 1.4 | GO:0090271 | positive regulation of fibroblast growth factor production(GO:0090271) |
| 0.5 | 2.3 | GO:0090611 | ubiquitin-independent protein catabolic process via the multivesicular body sorting pathway(GO:0090611) |
| 0.5 | 1.4 | GO:0051040 | regulation of calcium-independent cell-cell adhesion(GO:0051040) |
| 0.5 | 5.9 | GO:0051547 | regulation of keratinocyte migration(GO:0051547) |
| 0.5 | 0.9 | GO:0045084 | positive regulation of interleukin-12 biosynthetic process(GO:0045084) |
| 0.5 | 1.8 | GO:1990523 | bone regeneration(GO:1990523) |
| 0.4 | 0.4 | GO:1904862 | inhibitory synapse assembly(GO:1904862) |
| 0.4 | 1.7 | GO:0045631 | regulation of auditory receptor cell differentiation(GO:0045607) regulation of mechanoreceptor differentiation(GO:0045631) regulation of inner ear receptor cell differentiation(GO:2000980) |
| 0.4 | 2.6 | GO:0015864 | pyrimidine nucleoside transport(GO:0015864) |
| 0.4 | 1.7 | GO:0003104 | positive regulation of glomerular filtration(GO:0003104) |
| 0.4 | 1.2 | GO:0044771 | meiotic cell cycle phase transition(GO:0044771) regulation of meiotic cell cycle phase transition(GO:1901993) negative regulation of meiotic cell cycle phase transition(GO:1901994) |
| 0.4 | 10.7 | GO:0051639 | actin filament network formation(GO:0051639) |
| 0.4 | 4.8 | GO:2001288 | positive regulation of caveolin-mediated endocytosis(GO:2001288) |
| 0.4 | 4.8 | GO:0060120 | auditory receptor cell fate commitment(GO:0009912) inner ear receptor cell fate commitment(GO:0060120) |
| 0.4 | 1.6 | GO:0045658 | regulation of neutrophil differentiation(GO:0045658) negative regulation of neutrophil differentiation(GO:0045659) |
| 0.4 | 1.6 | GO:0021999 | neural plate anterior/posterior regionalization(GO:0021999) |
| 0.4 | 1.1 | GO:0060738 | epithelial-mesenchymal signaling involved in prostate gland development(GO:0060738) |
| 0.4 | 2.6 | GO:0060373 | regulation of ventricular cardiac muscle cell membrane depolarization(GO:0060373) |
| 0.4 | 0.4 | GO:0019858 | cytosine metabolic process(GO:0019858) |
| 0.4 | 2.2 | GO:0060356 | leucine import(GO:0060356) |
| 0.4 | 1.5 | GO:0050712 | negative regulation of interleukin-1 alpha production(GO:0032690) negative regulation of interleukin-1 alpha secretion(GO:0050712) |
| 0.4 | 3.7 | GO:0038044 | transforming growth factor-beta secretion(GO:0038044) |
| 0.4 | 1.4 | GO:0038018 | Wnt receptor catabolic process(GO:0038018) |
| 0.4 | 1.1 | GO:1990922 | regulation of hepatic stellate cell proliferation(GO:1904897) positive regulation of hepatic stellate cell proliferation(GO:1904899) hepatic stellate cell proliferation(GO:1990922) |
| 0.4 | 1.4 | GO:0002337 | B-1a B cell differentiation(GO:0002337) |
| 0.4 | 0.7 | GO:0048867 | stem cell fate determination(GO:0048867) |
| 0.3 | 1.7 | GO:0032929 | negative regulation of superoxide anion generation(GO:0032929) |
| 0.3 | 1.0 | GO:1903984 | positive regulation of TRAIL-activated apoptotic signaling pathway(GO:1903984) |
| 0.3 | 3.7 | GO:0006657 | CDP-choline pathway(GO:0006657) |
| 0.3 | 4.4 | GO:1900029 | positive regulation of ruffle assembly(GO:1900029) |
| 0.3 | 1.7 | GO:0071400 | cellular response to oleic acid(GO:0071400) |
| 0.3 | 1.3 | GO:0001897 | cytolysis by symbiont of host cells(GO:0001897) |
| 0.3 | 3.9 | GO:0031642 | negative regulation of myelination(GO:0031642) |
| 0.3 | 4.9 | GO:0070863 | positive regulation of protein exit from endoplasmic reticulum(GO:0070863) |
| 0.3 | 2.5 | GO:0061709 | reticulophagy(GO:0061709) |
| 0.3 | 0.3 | GO:1901187 | regulation of ephrin receptor signaling pathway(GO:1901187) |
| 0.3 | 1.2 | GO:0015670 | carbon dioxide transport(GO:0015670) |
| 0.3 | 0.9 | GO:1903028 | positive regulation of opsonization(GO:1903028) |
| 0.3 | 0.3 | GO:0072554 | blood vessel lumenization(GO:0072554) |
| 0.3 | 1.5 | GO:0018352 | protein-pyridoxal-5-phosphate linkage(GO:0018352) |
| 0.3 | 0.6 | GO:0034351 | regulation of glial cell apoptotic process(GO:0034350) negative regulation of glial cell apoptotic process(GO:0034351) |
| 0.3 | 4.2 | GO:0051599 | response to hydrostatic pressure(GO:0051599) |
| 0.3 | 2.7 | GO:0051121 | hepoxilin metabolic process(GO:0051121) hepoxilin biosynthetic process(GO:0051122) |
| 0.3 | 0.9 | GO:0002528 | regulation of vascular permeability involved in acute inflammatory response(GO:0002528) |
| 0.3 | 0.6 | GO:0030974 | thiamine pyrophosphate transport(GO:0030974) |
| 0.3 | 9.5 | GO:0016338 | calcium-independent cell-cell adhesion via plasma membrane cell-adhesion molecules(GO:0016338) |
| 0.3 | 2.0 | GO:0035290 | trunk segmentation(GO:0035290) trunk neural crest cell migration(GO:0036484) ventral trunk neural crest cell migration(GO:0036486) |
| 0.3 | 2.6 | GO:0048842 | positive regulation of axon extension involved in axon guidance(GO:0048842) |
| 0.3 | 0.6 | GO:0086042 | cardiac muscle cell-cardiac muscle cell adhesion(GO:0086042) |
| 0.3 | 1.1 | GO:2000660 | negative regulation of interleukin-1-mediated signaling pathway(GO:2000660) |
| 0.3 | 2.0 | GO:1903237 | negative regulation of leukocyte tethering or rolling(GO:1903237) |
| 0.3 | 4.5 | GO:0003334 | keratinocyte development(GO:0003334) |
| 0.3 | 0.8 | GO:0033076 | isoquinoline alkaloid metabolic process(GO:0033076) |
| 0.3 | 2.5 | GO:0031444 | slow-twitch skeletal muscle fiber contraction(GO:0031444) |
| 0.3 | 1.4 | GO:1903588 | negative regulation of blood vessel endothelial cell proliferation involved in sprouting angiogenesis(GO:1903588) |
| 0.3 | 15.2 | GO:0051602 | response to electrical stimulus(GO:0051602) |
| 0.3 | 25.0 | GO:0070830 | bicellular tight junction assembly(GO:0070830) |
| 0.3 | 3.5 | GO:0014722 | regulation of skeletal muscle contraction by calcium ion signaling(GO:0014722) |
| 0.3 | 0.8 | GO:0031508 | pericentric heterochromatin assembly(GO:0031508) |
| 0.3 | 3.7 | GO:0006685 | sphingomyelin catabolic process(GO:0006685) |
| 0.3 | 1.6 | GO:1904220 | regulation of serine C-palmitoyltransferase activity(GO:1904220) |
| 0.3 | 2.6 | GO:0098967 | exocytic insertion of neurotransmitter receptor to plasma membrane(GO:0098881) exocytic insertion of neurotransmitter receptor to postsynaptic membrane(GO:0098967) |
| 0.3 | 0.8 | GO:0033685 | negative regulation of luteinizing hormone secretion(GO:0033685) response to acrylamide(GO:1903937) |
| 0.3 | 0.5 | GO:0090038 | negative regulation of protein kinase C signaling(GO:0090038) |
| 0.3 | 4.4 | GO:0070886 | positive regulation of calcineurin-NFAT signaling cascade(GO:0070886) |
| 0.3 | 0.3 | GO:0031587 | positive regulation of inositol 1,4,5-trisphosphate-sensitive calcium-release channel activity(GO:0031587) |
| 0.3 | 2.8 | GO:0035095 | behavioral response to nicotine(GO:0035095) |
| 0.3 | 4.1 | GO:0006670 | sphingosine metabolic process(GO:0006670) |
| 0.3 | 0.3 | GO:0061763 | multivesicular body-lysosome fusion(GO:0061763) |
| 0.3 | 1.0 | GO:1903371 | regulation of endoplasmic reticulum tubular network organization(GO:1903371) |
| 0.2 | 2.0 | GO:0070995 | NADPH oxidation(GO:0070995) |
| 0.2 | 0.5 | GO:0071896 | protein localization to adherens junction(GO:0071896) |
| 0.2 | 1.0 | GO:1900138 | negative regulation of phospholipase A2 activity(GO:1900138) |
| 0.2 | 3.1 | GO:0070327 | thyroid hormone transport(GO:0070327) |
| 0.2 | 0.2 | GO:0097114 | NMDA glutamate receptor clustering(GO:0097114) |
| 0.2 | 1.0 | GO:0032287 | peripheral nervous system myelin maintenance(GO:0032287) |
| 0.2 | 0.9 | GO:1902164 | regulation of DNA damage response, signal transduction by p53 class mediator resulting in transcription of p21 class mediator(GO:1902162) positive regulation of DNA damage response, signal transduction by p53 class mediator resulting in transcription of p21 class mediator(GO:1902164) |
| 0.2 | 0.7 | GO:0010360 | negative regulation of anion channel activity(GO:0010360) |
| 0.2 | 1.6 | GO:0060481 | lobar bronchus epithelium development(GO:0060481) |
| 0.2 | 0.7 | GO:0050976 | response to alkaline pH(GO:0010446) sensory perception of touch(GO:0050975) detection of mechanical stimulus involved in sensory perception of touch(GO:0050976) cellular response to alkaline pH(GO:0071469) |
| 0.2 | 0.9 | GO:0035627 | ceramide transport(GO:0035627) |
| 0.2 | 1.4 | GO:2000503 | positive regulation of natural killer cell chemotaxis(GO:2000503) |
| 0.2 | 3.9 | GO:0015871 | choline transport(GO:0015871) |
| 0.2 | 0.9 | GO:0030200 | heparan sulfate proteoglycan catabolic process(GO:0030200) |
| 0.2 | 5.9 | GO:0060644 | mammary gland epithelial cell differentiation(GO:0060644) |
| 0.2 | 2.0 | GO:0030263 | apoptotic chromosome condensation(GO:0030263) |
| 0.2 | 2.5 | GO:0007028 | cytoplasm organization(GO:0007028) |
| 0.2 | 2.7 | GO:0032782 | bile acid secretion(GO:0032782) |
| 0.2 | 0.7 | GO:0018057 | peptidyl-lysine oxidation(GO:0018057) |
| 0.2 | 1.9 | GO:1904352 | positive regulation of protein catabolic process in the vacuole(GO:1904352) |
| 0.2 | 0.2 | GO:0046368 | GDP-L-fucose metabolic process(GO:0046368) |
| 0.2 | 1.5 | GO:0060648 | mammary gland bud morphogenesis(GO:0060648) |
| 0.2 | 0.8 | GO:2000393 | negative regulation of lamellipodium morphogenesis(GO:2000393) |
| 0.2 | 0.6 | GO:0061502 | early endosome to recycling endosome transport(GO:0061502) |
| 0.2 | 0.4 | GO:1902499 | positive regulation of protein autoubiquitination(GO:1902499) |
| 0.2 | 0.4 | GO:0071288 | cellular response to mercury ion(GO:0071288) |
| 0.2 | 0.4 | GO:1904504 | lipophagy(GO:0061724) regulation of lipophagy(GO:1904502) positive regulation of lipophagy(GO:1904504) |
| 0.2 | 0.2 | GO:0072387 | flavin adenine dinucleotide metabolic process(GO:0072387) |
| 0.2 | 0.6 | GO:0015920 | lipopolysaccharide transport(GO:0015920) |
| 0.2 | 0.8 | GO:1904637 | response to ionomycin(GO:1904636) cellular response to ionomycin(GO:1904637) |
| 0.2 | 1.4 | GO:0070560 | protein secretion by platelet(GO:0070560) |
| 0.2 | 2.2 | GO:0035331 | negative regulation of hippo signaling(GO:0035331) |
| 0.2 | 0.8 | GO:1904693 | embryonic nail plate morphogenesis(GO:0035880) establishment of body hair or bristle planar orientation(GO:0048104) establishment of body hair planar orientation(GO:0048105) midbrain morphogenesis(GO:1904693) |
| 0.2 | 0.4 | GO:0097106 | postsynaptic density organization(GO:0097106) |
| 0.2 | 1.0 | GO:0009137 | purine nucleoside diphosphate catabolic process(GO:0009137) purine ribonucleoside diphosphate catabolic process(GO:0009181) |
| 0.2 | 3.1 | GO:1901642 | nucleoside transmembrane transport(GO:1901642) |
| 0.2 | 0.4 | GO:0071727 | toll-like receptor TLR1:TLR2 signaling pathway(GO:0038123) detection of triacyl bacterial lipopeptide(GO:0042495) detection of bacterial lipopeptide(GO:0070340) response to triacyl bacterial lipopeptide(GO:0071725) cellular response to triacyl bacterial lipopeptide(GO:0071727) |
| 0.2 | 2.7 | GO:0019317 | fucose catabolic process(GO:0019317) L-fucose metabolic process(GO:0042354) L-fucose catabolic process(GO:0042355) |
| 0.2 | 0.7 | GO:0018879 | biphenyl metabolic process(GO:0018879) |
| 0.2 | 0.9 | GO:0030035 | microspike assembly(GO:0030035) |
| 0.2 | 1.1 | GO:0006196 | AMP catabolic process(GO:0006196) |
| 0.2 | 0.6 | GO:0046967 | cytosol to ER transport(GO:0046967) |
| 0.2 | 0.2 | GO:0035634 | response to stilbenoid(GO:0035634) |
| 0.2 | 0.5 | GO:0046110 | xanthine metabolic process(GO:0046110) |
| 0.2 | 4.2 | GO:0007250 | activation of NF-kappaB-inducing kinase activity(GO:0007250) |
| 0.2 | 0.2 | GO:0032425 | positive regulation of mismatch repair(GO:0032425) |
| 0.2 | 8.8 | GO:0098927 | vesicle-mediated transport between endosomal compartments(GO:0098927) |
| 0.2 | 0.2 | GO:0071603 | endothelial cell-cell adhesion(GO:0071603) |
| 0.2 | 2.9 | GO:0046415 | urate metabolic process(GO:0046415) |
| 0.2 | 0.7 | GO:1900827 | maintenance of protein location in membrane(GO:0072658) maintenance of protein location in plasma membrane(GO:0072660) positive regulation of membrane depolarization during cardiac muscle cell action potential(GO:1900827) |
| 0.2 | 2.1 | GO:0070257 | positive regulation of mucus secretion(GO:0070257) |
| 0.2 | 6.4 | GO:0007638 | mechanosensory behavior(GO:0007638) |
| 0.2 | 0.7 | GO:0090214 | spongiotrophoblast layer developmental growth(GO:0090214) |
| 0.2 | 0.2 | GO:0016339 | calcium-dependent cell-cell adhesion via plasma membrane cell adhesion molecules(GO:0016339) |
| 0.2 | 1.1 | GO:0060019 | radial glial cell differentiation(GO:0060019) |
| 0.2 | 3.5 | GO:0002523 | leukocyte migration involved in inflammatory response(GO:0002523) |
| 0.2 | 0.9 | GO:0032185 | septin cytoskeleton organization(GO:0032185) |
| 0.2 | 3.0 | GO:0035269 | protein O-linked mannosylation(GO:0035269) |
| 0.2 | 0.7 | GO:0042377 | menaquinone catabolic process(GO:0042361) vitamin K catabolic process(GO:0042377) |
| 0.2 | 1.2 | GO:0015760 | hexose phosphate transport(GO:0015712) glucose-6-phosphate transport(GO:0015760) |
| 0.2 | 0.9 | GO:0097411 | hypoxia-inducible factor-1alpha signaling pathway(GO:0097411) |
| 0.2 | 0.7 | GO:0032904 | viral protein processing(GO:0019082) regulation of nerve growth factor production(GO:0032903) negative regulation of nerve growth factor production(GO:0032904) dibasic protein processing(GO:0090472) |
| 0.2 | 0.7 | GO:1901594 | detection of temperature stimulus involved in thermoception(GO:0050960) response to capsazepine(GO:1901594) |
| 0.2 | 0.3 | GO:2000866 | positive regulation of estrogen secretion(GO:2000863) positive regulation of estradiol secretion(GO:2000866) |
| 0.2 | 0.5 | GO:0038195 | urokinase plasminogen activator signaling pathway(GO:0038195) |
| 0.2 | 2.9 | GO:0045741 | positive regulation of epidermal growth factor-activated receptor activity(GO:0045741) |
| 0.2 | 6.6 | GO:0003009 | skeletal muscle contraction(GO:0003009) |
| 0.2 | 0.2 | GO:1900195 | positive regulation of oocyte maturation(GO:1900195) |
| 0.2 | 0.5 | GO:0046379 | extracellular polysaccharide biosynthetic process(GO:0045226) extracellular polysaccharide metabolic process(GO:0046379) |
| 0.2 | 0.5 | GO:0060168 | regulation of adenosine receptor signaling pathway(GO:0060167) positive regulation of adenosine receptor signaling pathway(GO:0060168) |
| 0.2 | 0.5 | GO:0009386 | translational attenuation(GO:0009386) |
| 0.2 | 0.8 | GO:0010760 | negative regulation of macrophage chemotaxis(GO:0010760) |
| 0.2 | 1.3 | GO:2000321 | positive regulation of T-helper 17 cell differentiation(GO:2000321) |
| 0.2 | 1.0 | GO:0046952 | ketone body catabolic process(GO:0046952) |
| 0.2 | 1.0 | GO:2000620 | innate vocalization behavior(GO:0098582) positive regulation of histone H4-K16 acetylation(GO:2000620) |
| 0.2 | 0.3 | GO:2000553 | positive regulation of T-helper 2 cell cytokine production(GO:2000553) |
| 0.2 | 1.5 | GO:0097500 | receptor localization to nonmotile primary cilium(GO:0097500) |
| 0.2 | 0.5 | GO:0032827 | natural killer cell differentiation involved in immune response(GO:0002325) negative regulation of natural killer cell differentiation(GO:0032824) regulation of natural killer cell differentiation involved in immune response(GO:0032826) negative regulation of natural killer cell differentiation involved in immune response(GO:0032827) |
| 0.2 | 1.8 | GO:0009415 | response to water(GO:0009415) |
| 0.2 | 0.7 | GO:1990834 | response to odorant(GO:1990834) |
| 0.2 | 0.5 | GO:1990641 | response to iron ion starvation(GO:1990641) |
| 0.2 | 2.3 | GO:0048387 | negative regulation of retinoic acid receptor signaling pathway(GO:0048387) |
| 0.2 | 0.6 | GO:0060666 | dichotomous subdivision of terminal units involved in salivary gland branching(GO:0060666) |
| 0.2 | 0.8 | GO:0042574 | retinal metabolic process(GO:0042574) |
| 0.2 | 5.3 | GO:0042573 | retinoic acid metabolic process(GO:0042573) |
| 0.2 | 0.6 | GO:0098957 | anterograde axonal transport of mitochondrion(GO:0098957) |
| 0.2 | 0.2 | GO:0042640 | anagen(GO:0042640) |
| 0.2 | 0.5 | GO:0071934 | thiamine transmembrane transport(GO:0071934) |
| 0.2 | 0.6 | GO:2000271 | positive regulation of fibroblast apoptotic process(GO:2000271) |
| 0.2 | 1.9 | GO:0021800 | cerebral cortex tangential migration(GO:0021800) |
| 0.2 | 0.5 | GO:0060739 | mesenchymal-epithelial cell signaling involved in prostate gland development(GO:0060739) |
| 0.2 | 0.8 | GO:1903385 | regulation of homophilic cell adhesion(GO:1903385) |
| 0.1 | 0.1 | GO:1903826 | arginine transmembrane transport(GO:1903826) |
| 0.1 | 0.6 | GO:0006258 | UDP-glucose catabolic process(GO:0006258) |
| 0.1 | 0.9 | GO:0031133 | regulation of axon diameter(GO:0031133) |
| 0.1 | 2.1 | GO:0021796 | cerebral cortex regionalization(GO:0021796) |
| 0.1 | 0.3 | GO:0030185 | nitric oxide transport(GO:0030185) |
| 0.1 | 0.3 | GO:1902174 | positive regulation of keratinocyte apoptotic process(GO:1902174) |
| 0.1 | 0.7 | GO:0060179 | male mating behavior(GO:0060179) |
| 0.1 | 0.4 | GO:0051541 | elastin metabolic process(GO:0051541) |
| 0.1 | 0.4 | GO:0048627 | myoblast development(GO:0048627) |
| 0.1 | 0.4 | GO:0002194 | hepatocyte cell migration(GO:0002194) otic placode formation(GO:0043049) branching involved in pancreas morphogenesis(GO:0061114) acinar cell differentiation(GO:0090425) positive regulation of forebrain neuron differentiation(GO:2000979) |
| 0.1 | 0.6 | GO:0000821 | regulation of arginine metabolic process(GO:0000821) |
| 0.1 | 3.0 | GO:0039535 | regulation of RIG-I signaling pathway(GO:0039535) |
| 0.1 | 0.6 | GO:0007538 | primary sex determination(GO:0007538) |
| 0.1 | 0.6 | GO:0045399 | response to molecule of fungal origin(GO:0002238) positive regulation of interleukin-3 production(GO:0032752) interleukin-3 biosynthetic process(GO:0042223) regulation of interleukin-3 biosynthetic process(GO:0045399) positive regulation of interleukin-3 biosynthetic process(GO:0045401) cellular response to molecule of fungal origin(GO:0071226) |
| 0.1 | 0.1 | GO:2001293 | malonyl-CoA metabolic process(GO:2001293) |
| 0.1 | 2.2 | GO:0090361 | platelet-derived growth factor production(GO:0090360) regulation of platelet-derived growth factor production(GO:0090361) |
| 0.1 | 1.0 | GO:0016554 | cytidine to uridine editing(GO:0016554) |
| 0.1 | 0.4 | GO:0060266 | respiratory burst involved in inflammatory response(GO:0002536) regulation of respiratory burst involved in inflammatory response(GO:0060264) negative regulation of respiratory burst involved in inflammatory response(GO:0060266) |
| 0.1 | 1.5 | GO:1900025 | negative regulation of substrate adhesion-dependent cell spreading(GO:1900025) |
| 0.1 | 0.4 | GO:0060800 | regulation of cell differentiation involved in embryonic placenta development(GO:0060800) |
| 0.1 | 0.7 | GO:1902202 | regulation of hepatocyte growth factor receptor signaling pathway(GO:1902202) |
| 0.1 | 0.7 | GO:1904751 | positive regulation of protein localization to nucleolus(GO:1904751) |
| 0.1 | 0.4 | GO:0036046 | protein demalonylation(GO:0036046) peptidyl-lysine demalonylation(GO:0036047) protein desuccinylation(GO:0036048) peptidyl-lysine desuccinylation(GO:0036049) protein deglutarylation(GO:0061698) peptidyl-lysine deglutarylation(GO:0061699) |
| 0.1 | 0.5 | GO:1904398 | positive regulation of neuromuscular junction development(GO:1904398) |
| 0.1 | 0.3 | GO:1902714 | negative regulation of interferon-gamma secretion(GO:1902714) |
| 0.1 | 1.0 | GO:0050859 | negative regulation of B cell receptor signaling pathway(GO:0050859) |
| 0.1 | 0.1 | GO:0072204 | cell-cell signaling involved in kidney development(GO:0060995) Wnt signaling pathway involved in kidney development(GO:0061289) canonical Wnt signaling pathway involved in metanephric kidney development(GO:0061290) cell-cell signaling involved in metanephros development(GO:0072204) |
| 0.1 | 0.4 | GO:0060282 | positive regulation of oocyte development(GO:0060282) |
| 0.1 | 0.5 | GO:0097475 | motor neuron migration(GO:0097475) |
| 0.1 | 0.3 | GO:0010650 | positive regulation of cell communication by electrical coupling(GO:0010650) |
| 0.1 | 0.4 | GO:0000964 | mitochondrial RNA 5'-end processing(GO:0000964) |
| 0.1 | 0.4 | GO:0045423 | regulation of granulocyte macrophage colony-stimulating factor biosynthetic process(GO:0045423) |
| 0.1 | 1.3 | GO:1902902 | negative regulation of autophagosome assembly(GO:1902902) |
| 0.1 | 1.1 | GO:0042985 | negative regulation of amyloid precursor protein biosynthetic process(GO:0042985) |
| 0.1 | 1.2 | GO:0045188 | regulation of circadian sleep/wake cycle, non-REM sleep(GO:0045188) |
| 0.1 | 0.3 | GO:0061589 | calcium activated phosphatidylserine scrambling(GO:0061589) |
| 0.1 | 0.4 | GO:2001287 | negative regulation of caveolin-mediated endocytosis(GO:2001287) |
| 0.1 | 0.8 | GO:0009253 | peptidoglycan metabolic process(GO:0000270) peptidoglycan catabolic process(GO:0009253) |
| 0.1 | 0.5 | GO:0051563 | astrocyte activation involved in immune response(GO:0002265) smooth endoplasmic reticulum calcium ion homeostasis(GO:0051563) |
| 0.1 | 0.6 | GO:0036302 | atrioventricular canal development(GO:0036302) |
| 0.1 | 0.5 | GO:0060287 | epithelial cilium movement involved in determination of left/right asymmetry(GO:0060287) |
| 0.1 | 0.5 | GO:0032725 | positive regulation of granulocyte macrophage colony-stimulating factor production(GO:0032725) |
| 0.1 | 1.5 | GO:0060700 | regulation of ribonuclease activity(GO:0060700) |
| 0.1 | 1.3 | GO:0060670 | branching involved in labyrinthine layer morphogenesis(GO:0060670) |
| 0.1 | 1.1 | GO:0007256 | activation of JNKK activity(GO:0007256) |
| 0.1 | 21.4 | GO:0008543 | fibroblast growth factor receptor signaling pathway(GO:0008543) |
| 0.1 | 0.6 | GO:1902412 | regulation of mitotic cytokinesis(GO:1902412) |
| 0.1 | 0.3 | GO:0032911 | negative regulation of transforming growth factor beta1 production(GO:0032911) |
| 0.1 | 13.5 | GO:0070268 | cornification(GO:0070268) |
| 0.1 | 0.9 | GO:0033353 | S-adenosylmethionine cycle(GO:0033353) |
| 0.1 | 0.1 | GO:0098735 | positive regulation of the force of heart contraction(GO:0098735) |
| 0.1 | 0.4 | GO:1904582 | regulation of intracellular mRNA localization(GO:1904580) positive regulation of intracellular mRNA localization(GO:1904582) |
| 0.1 | 0.2 | GO:0045217 | cell-cell junction maintenance(GO:0045217) |
| 0.1 | 0.5 | GO:1900108 | negative regulation of nodal signaling pathway(GO:1900108) |
| 0.1 | 0.4 | GO:0015917 | aminophospholipid transport(GO:0015917) |
| 0.1 | 1.0 | GO:1902474 | positive regulation of protein localization to synapse(GO:1902474) |
| 0.1 | 0.4 | GO:0015842 | aminergic neurotransmitter loading into synaptic vesicle(GO:0015842) sequestering of neurotransmitter(GO:0042137) |
| 0.1 | 0.4 | GO:0010193 | response to ozone(GO:0010193) |
| 0.1 | 0.4 | GO:0007518 | myoblast fate determination(GO:0007518) |
| 0.1 | 0.2 | GO:0061183 | central nervous system morphogenesis(GO:0021551) dermatome development(GO:0061054) regulation of dermatome development(GO:0061183) positive regulation of dermatome development(GO:0061184) |
| 0.1 | 0.2 | GO:0032972 | regulation of muscle filament sliding speed(GO:0032972) |
| 0.1 | 0.4 | GO:0072344 | rescue of stalled ribosome(GO:0072344) |
| 0.1 | 0.8 | GO:0042271 | susceptibility to natural killer cell mediated cytotoxicity(GO:0042271) |
| 0.1 | 0.2 | GO:0005989 | lactose metabolic process(GO:0005988) lactose biosynthetic process(GO:0005989) |
| 0.1 | 0.1 | GO:0016115 | sesquiterpenoid metabolic process(GO:0006714) sesquiterpenoid catabolic process(GO:0016107) terpenoid catabolic process(GO:0016115) farnesol metabolic process(GO:0016487) farnesol catabolic process(GO:0016488) |
| 0.1 | 0.4 | GO:0006478 | peptidyl-tyrosine sulfation(GO:0006478) |
| 0.1 | 0.2 | GO:0051552 | flavone metabolic process(GO:0051552) |
| 0.1 | 1.7 | GO:0030948 | negative regulation of vascular endothelial growth factor receptor signaling pathway(GO:0030948) |
| 0.1 | 0.5 | GO:0000706 | meiotic DNA double-strand break processing(GO:0000706) |
| 0.1 | 0.2 | GO:0045915 | positive regulation of catecholamine metabolic process(GO:0045915) positive regulation of dopamine metabolic process(GO:0045964) |
| 0.1 | 0.7 | GO:2000234 | positive regulation of ribosome biogenesis(GO:0090070) positive regulation of rRNA processing(GO:2000234) |
| 0.1 | 0.1 | GO:0048633 | positive regulation of skeletal muscle tissue growth(GO:0048633) |
| 0.1 | 0.6 | GO:2000047 | regulation of cell-cell adhesion mediated by cadherin(GO:2000047) |
| 0.1 | 0.2 | GO:1904744 | positive regulation of telomeric DNA binding(GO:1904744) |
| 0.1 | 0.3 | GO:0014738 | regulation of muscle hyperplasia(GO:0014738) negative regulation of muscle hyperplasia(GO:0014740) |
| 0.1 | 0.7 | GO:0051958 | methotrexate transport(GO:0051958) |
| 0.1 | 0.3 | GO:1902269 | positive regulation of polyamine transmembrane transport(GO:1902269) |
| 0.1 | 1.4 | GO:0043117 | positive regulation of vascular permeability(GO:0043117) |
| 0.1 | 0.5 | GO:0051971 | positive regulation of transmission of nerve impulse(GO:0051971) |
| 0.1 | 1.4 | GO:0019388 | galactose catabolic process(GO:0019388) |
| 0.1 | 0.7 | GO:0035469 | determination of pancreatic left/right asymmetry(GO:0035469) determination of liver left/right asymmetry(GO:0071910) |
| 0.1 | 0.3 | GO:0006421 | asparaginyl-tRNA aminoacylation(GO:0006421) |
| 0.1 | 3.3 | GO:0045745 | positive regulation of G-protein coupled receptor protein signaling pathway(GO:0045745) |
| 0.1 | 2.3 | GO:1903830 | magnesium ion transmembrane transport(GO:1903830) |
| 0.1 | 0.4 | GO:0031117 | positive regulation of microtubule depolymerization(GO:0031117) |
| 0.1 | 0.7 | GO:0006543 | glutamine catabolic process(GO:0006543) |
| 0.1 | 0.2 | GO:1904796 | regulation of core promoter binding(GO:1904796) |
| 0.1 | 0.2 | GO:0001560 | regulation of cell growth by extracellular stimulus(GO:0001560) |
| 0.1 | 0.4 | GO:0070640 | calcitriol biosynthetic process from calciol(GO:0036378) vitamin D3 metabolic process(GO:0070640) |
| 0.1 | 0.2 | GO:0032289 | central nervous system myelin formation(GO:0032289) |
| 0.1 | 5.1 | GO:0019985 | translesion synthesis(GO:0019985) |
| 0.1 | 1.5 | GO:0070933 | histone H4 deacetylation(GO:0070933) |
| 0.1 | 0.3 | GO:0036079 | GDP-fucose transport(GO:0015783) purine nucleotide-sugar transport(GO:0036079) |
| 0.1 | 0.9 | GO:0002943 | tRNA dihydrouridine synthesis(GO:0002943) |
| 0.1 | 0.1 | GO:1904044 | response to aldosterone(GO:1904044) |
| 0.1 | 1.0 | GO:1902510 | regulation of apoptotic DNA fragmentation(GO:1902510) |
| 0.1 | 0.3 | GO:1901876 | regulation of calcium ion binding(GO:1901876) negative regulation of calcium ion binding(GO:1901877) |
| 0.1 | 0.4 | GO:1902617 | response to fluoride(GO:1902617) |
| 0.1 | 0.6 | GO:0036493 | positive regulation of translation in response to endoplasmic reticulum stress(GO:0036493) |
| 0.1 | 0.5 | GO:0015692 | lead ion transport(GO:0015692) |
| 0.1 | 0.4 | GO:2000491 | positive regulation of hepatic stellate cell activation(GO:2000491) |
| 0.1 | 0.2 | GO:0032079 | positive regulation of endodeoxyribonuclease activity(GO:0032079) |
| 0.1 | 0.5 | GO:0006269 | DNA replication, synthesis of RNA primer(GO:0006269) |
| 0.1 | 0.5 | GO:0035995 | detection of muscle stretch(GO:0035995) |
| 0.1 | 0.4 | GO:0046900 | tetrahydrofolylpolyglutamate metabolic process(GO:0046900) |
| 0.1 | 0.3 | GO:1904970 | brush border assembly(GO:1904970) |
| 0.1 | 0.5 | GO:0071918 | urea transmembrane transport(GO:0071918) |
| 0.1 | 0.1 | GO:0061052 | negative regulation of cell growth involved in cardiac muscle cell development(GO:0061052) |
| 0.1 | 0.7 | GO:1900262 | regulation of DNA-directed DNA polymerase activity(GO:1900262) positive regulation of DNA-directed DNA polymerase activity(GO:1900264) |
| 0.1 | 0.2 | GO:1902856 | negative regulation of nonmotile primary cilium assembly(GO:1902856) |
| 0.1 | 0.4 | GO:0035521 | monoubiquitinated histone deubiquitination(GO:0035521) monoubiquitinated histone H2A deubiquitination(GO:0035522) |
| 0.1 | 0.2 | GO:0035962 | response to interleukin-13(GO:0035962) |
| 0.1 | 0.2 | GO:0070245 | positive regulation of thymocyte apoptotic process(GO:0070245) |
| 0.1 | 0.5 | GO:0001575 | globoside metabolic process(GO:0001575) |
| 0.1 | 0.7 | GO:0044341 | sodium-dependent phosphate transport(GO:0044341) |
| 0.1 | 0.6 | GO:2000348 | regulation of CD40 signaling pathway(GO:2000348) |
| 0.1 | 0.5 | GO:1901523 | leukotriene catabolic process(GO:0036100) leukotriene B4 catabolic process(GO:0036101) leukotriene B4 metabolic process(GO:0036102) icosanoid catabolic process(GO:1901523) fatty acid derivative catabolic process(GO:1901569) |
| 0.1 | 0.4 | GO:0002541 | activation of plasma proteins involved in acute inflammatory response(GO:0002541) |
| 0.1 | 0.4 | GO:0006477 | protein sulfation(GO:0006477) |
| 0.1 | 0.7 | GO:0008295 | spermidine biosynthetic process(GO:0008295) |
| 0.1 | 3.9 | GO:0035774 | positive regulation of insulin secretion involved in cellular response to glucose stimulus(GO:0035774) |
| 0.1 | 0.9 | GO:0002084 | protein depalmitoylation(GO:0002084) |
| 0.1 | 0.3 | GO:1904158 | axonemal central apparatus assembly(GO:1904158) |
| 0.1 | 0.1 | GO:0060005 | vestibular reflex(GO:0060005) |
| 0.1 | 0.1 | GO:1904954 | canonical Wnt signaling pathway involved in midbrain dopaminergic neuron differentiation(GO:1904954) |
| 0.1 | 0.3 | GO:0006391 | transcription initiation from mitochondrial promoter(GO:0006391) |
| 0.1 | 0.3 | GO:0038043 | interleukin-5-mediated signaling pathway(GO:0038043) |
| 0.1 | 0.2 | GO:1901899 | positive regulation of relaxation of cardiac muscle(GO:1901899) |
| 0.1 | 0.6 | GO:0070829 | response to vitamin B2(GO:0033274) heterochromatin maintenance(GO:0070829) |
| 0.1 | 0.1 | GO:0010730 | negative regulation of hydrogen peroxide biosynthetic process(GO:0010730) |
| 0.1 | 1.0 | GO:0001977 | renal system process involved in regulation of blood volume(GO:0001977) |
| 0.1 | 0.5 | GO:0016480 | negative regulation of transcription from RNA polymerase III promoter(GO:0016480) |
| 0.1 | 3.8 | GO:0097503 | sialylation(GO:0097503) |
| 0.1 | 4.1 | GO:0051904 | pigment granule transport(GO:0051904) |
| 0.1 | 0.3 | GO:0010133 | proline catabolic process to glutamate(GO:0010133) |
| 0.1 | 0.2 | GO:0045080 | positive regulation of chemokine biosynthetic process(GO:0045080) |
| 0.1 | 0.3 | GO:0016199 | axon midline choice point recognition(GO:0016199) |
| 0.1 | 4.9 | GO:0031424 | keratinization(GO:0031424) |
| 0.1 | 0.1 | GO:0006233 | dUDP biosynthetic process(GO:0006227) dTDP biosynthetic process(GO:0006233) pyrimidine nucleoside diphosphate biosynthetic process(GO:0009139) pyrimidine deoxyribonucleoside diphosphate metabolic process(GO:0009196) pyrimidine deoxyribonucleoside diphosphate biosynthetic process(GO:0009197) dTDP metabolic process(GO:0046072) dUDP metabolic process(GO:0046077) |
| 0.1 | 0.3 | GO:0061300 | cerebellum vasculature development(GO:0061300) |
| 0.1 | 0.3 | GO:0038163 | thrombopoietin-mediated signaling pathway(GO:0038163) |
| 0.1 | 0.3 | GO:0036451 | cap mRNA methylation(GO:0036451) |
| 0.1 | 0.5 | GO:0097647 | dimeric G-protein coupled receptor signaling pathway(GO:0038042) calcitonin family receptor signaling pathway(GO:0097646) amylin receptor signaling pathway(GO:0097647) |
| 0.1 | 0.3 | GO:1902595 | regulation of DNA replication origin binding(GO:1902595) |
| 0.1 | 1.9 | GO:0071481 | cellular response to X-ray(GO:0071481) |
| 0.1 | 0.5 | GO:0015891 | iron chelate transport(GO:0015688) siderophore transport(GO:0015891) |
| 0.1 | 0.4 | GO:0043382 | positive regulation of memory T cell differentiation(GO:0043382) |
| 0.1 | 0.5 | GO:2001206 | positive regulation of osteoclast development(GO:2001206) |
| 0.1 | 0.2 | GO:1904749 | regulation of protein localization to nucleolus(GO:1904749) |
| 0.1 | 1.2 | GO:0015732 | prostaglandin transport(GO:0015732) |
| 0.1 | 1.0 | GO:0048003 | antigen processing and presentation of lipid antigen via MHC class Ib(GO:0048003) antigen processing and presentation, exogenous lipid antigen via MHC class Ib(GO:0048007) |
| 0.1 | 0.2 | GO:0030886 | negative regulation of myeloid dendritic cell activation(GO:0030886) |
| 0.1 | 0.5 | GO:0071051 | polyadenylation-dependent snoRNA 3'-end processing(GO:0071051) |
| 0.1 | 0.3 | GO:0097680 | double-strand break repair via classical nonhomologous end joining(GO:0097680) |
| 0.1 | 0.3 | GO:0035938 | estrogen secretion(GO:0035937) estradiol secretion(GO:0035938) regulation of estrogen secretion(GO:2000861) regulation of estradiol secretion(GO:2000864) |
| 0.1 | 0.2 | GO:0010764 | negative regulation of fibroblast migration(GO:0010764) |
| 0.1 | 4.5 | GO:0007340 | acrosome reaction(GO:0007340) |
| 0.1 | 0.5 | GO:0010166 | wax biosynthetic process(GO:0010025) wax metabolic process(GO:0010166) |
| 0.1 | 0.5 | GO:0071847 | TNFSF11-mediated signaling pathway(GO:0071847) |
| 0.1 | 0.3 | GO:0046586 | regulation of calcium-dependent cell-cell adhesion(GO:0046586) |
| 0.1 | 0.4 | GO:0038016 | insulin receptor internalization(GO:0038016) |
| 0.1 | 0.3 | GO:0001869 | regulation of complement activation, lectin pathway(GO:0001868) negative regulation of complement activation, lectin pathway(GO:0001869) |
| 0.1 | 0.4 | GO:1900425 | negative regulation of defense response to bacterium(GO:1900425) |
| 0.1 | 0.8 | GO:0016998 | cell wall macromolecule catabolic process(GO:0016998) |
| 0.1 | 0.5 | GO:0030581 | intracellular transport of viral protein in host cell(GO:0019060) symbiont intracellular protein transport in host(GO:0030581) intracellular protein transport in other organism involved in symbiotic interaction(GO:0051708) |
| 0.1 | 0.3 | GO:0050915 | sensory perception of sour taste(GO:0050915) |
| 0.1 | 0.9 | GO:0009950 | dorsal/ventral axis specification(GO:0009950) |
| 0.1 | 1.0 | GO:1900625 | regulation of monocyte aggregation(GO:1900623) positive regulation of monocyte aggregation(GO:1900625) |
| 0.1 | 0.3 | GO:0009106 | lipoate metabolic process(GO:0009106) |
| 0.1 | 0.3 | GO:0015788 | UDP-N-acetylglucosamine transport(GO:0015788) UDP-N-acetylglucosamine transmembrane transport(GO:1990569) |
| 0.1 | 0.5 | GO:0086068 | Purkinje myocyte to ventricular cardiac muscle cell signaling(GO:0086029) Purkinje myocyte to ventricular cardiac muscle cell communication(GO:0086068) |
| 0.1 | 0.1 | GO:0090370 | negative regulation of cholesterol efflux(GO:0090370) |
| 0.1 | 1.2 | GO:0000050 | urea cycle(GO:0000050) |
| 0.1 | 0.3 | GO:0043335 | protein unfolding(GO:0043335) |
| 0.1 | 2.7 | GO:0090200 | positive regulation of release of cytochrome c from mitochondria(GO:0090200) |
| 0.1 | 1.6 | GO:0042753 | positive regulation of circadian rhythm(GO:0042753) |
| 0.1 | 0.2 | GO:0036265 | RNA (guanine-N7)-methylation(GO:0036265) rRNA (guanine-N7)-methylation(GO:0070476) |
| 0.1 | 0.9 | GO:0031284 | positive regulation of guanylate cyclase activity(GO:0031284) |
| 0.1 | 0.1 | GO:0043634 | polyadenylation-dependent RNA catabolic process(GO:0043633) polyadenylation-dependent ncRNA catabolic process(GO:0043634) nuclear ncRNA surveillance(GO:0071029) nuclear polyadenylation-dependent rRNA catabolic process(GO:0071035) nuclear polyadenylation-dependent ncRNA catabolic process(GO:0071046) |
| 0.1 | 1.7 | GO:2000249 | regulation of actin cytoskeleton reorganization(GO:2000249) |
| 0.1 | 1.8 | GO:0051255 | spindle midzone assembly(GO:0051255) |
| 0.1 | 0.7 | GO:0014718 | positive regulation of satellite cell activation involved in skeletal muscle regeneration(GO:0014718) |
| 0.1 | 0.1 | GO:0042335 | cuticle development(GO:0042335) |
| 0.1 | 0.2 | GO:0061588 | calcium activated phospholipid scrambling(GO:0061588) calcium activated phosphatidylcholine scrambling(GO:0061590) calcium activated galactosylceramide scrambling(GO:0061591) |
| 0.1 | 0.4 | GO:0072602 | interleukin-4 secretion(GO:0072602) |
| 0.1 | 0.2 | GO:0061537 | glycine secretion(GO:0061536) glycine secretion, neurotransmission(GO:0061537) |
| 0.1 | 0.3 | GO:1900017 | positive regulation of cytokine production involved in inflammatory response(GO:1900017) |
| 0.1 | 0.5 | GO:0048165 | ovarian cumulus expansion(GO:0001550) fused antrum stage(GO:0048165) negative regulation of chondrocyte proliferation(GO:1902731) |
| 0.1 | 0.2 | GO:0043490 | malate-aspartate shuttle(GO:0043490) |
| 0.1 | 0.2 | GO:0061370 | testosterone biosynthetic process(GO:0061370) |
| 0.1 | 2.6 | GO:0035590 | purinergic nucleotide receptor signaling pathway(GO:0035590) |
| 0.1 | 0.4 | GO:0006287 | base-excision repair, gap-filling(GO:0006287) |
| 0.1 | 0.1 | GO:2000182 | regulation of progesterone biosynthetic process(GO:2000182) |
| 0.1 | 0.1 | GO:0016078 | tRNA catabolic process(GO:0016078) |
| 0.1 | 0.2 | GO:0035854 | regulation of primitive erythrocyte differentiation(GO:0010725) eosinophil fate commitment(GO:0035854) |
| 0.1 | 0.2 | GO:0006659 | phosphatidylserine biosynthetic process(GO:0006659) |
| 0.1 | 0.2 | GO:0050902 | leukocyte adhesive activation(GO:0050902) |
| 0.1 | 0.2 | GO:1904528 | regulation of microtubule plus-end binding(GO:1903031) positive regulation of microtubule plus-end binding(GO:1903033) positive regulation of microtubule binding(GO:1904528) |
| 0.1 | 0.3 | GO:0060454 | positive regulation of gastric acid secretion(GO:0060454) positive regulation of sensory perception of pain(GO:1904058) |
| 0.1 | 0.2 | GO:1900368 | regulation of RNA interference(GO:1900368) |
| 0.1 | 0.5 | GO:0097264 | self proteolysis(GO:0097264) |
| 0.1 | 0.9 | GO:0070777 | D-aspartate transport(GO:0070777) D-aspartate import(GO:0070779) |
| 0.1 | 0.5 | GO:0043129 | surfactant homeostasis(GO:0043129) |
| 0.1 | 0.4 | GO:0045204 | MAPK export from nucleus(GO:0045204) |
| 0.1 | 0.6 | GO:0034773 | histone H4-K20 trimethylation(GO:0034773) |
| 0.1 | 0.3 | GO:0098902 | regulation of membrane depolarization during action potential(GO:0098902) |
| 0.1 | 0.2 | GO:1905204 | regulation of connective tissue replacement involved in inflammatory response wound healing(GO:1904596) negative regulation of connective tissue replacement involved in inflammatory response wound healing(GO:1904597) regulation of advanced glycation end-product receptor activity(GO:1904603) negative regulation of advanced glycation end-product receptor activity(GO:1904604) negative regulation of connective tissue replacement(GO:1905204) |
| 0.1 | 0.7 | GO:2000210 | positive regulation of anoikis(GO:2000210) |
| 0.1 | 0.4 | GO:0000379 | tRNA-type intron splice site recognition and cleavage(GO:0000379) |
| 0.1 | 0.4 | GO:0014859 | negative regulation of skeletal muscle cell proliferation(GO:0014859) negative regulation of skeletal muscle satellite cell proliferation(GO:1902723) |
| 0.1 | 0.6 | GO:0002407 | dendritic cell chemotaxis(GO:0002407) |
| 0.1 | 0.5 | GO:0035616 | histone H2B conserved C-terminal lysine deubiquitination(GO:0035616) |
| 0.1 | 0.2 | GO:1900453 | modulation by host of viral RNA genome replication(GO:0044830) negative regulation of long term synaptic depression(GO:1900453) positive regulation of intracellular transport of viral material(GO:1901254) |
| 0.1 | 1.0 | GO:0002862 | negative regulation of inflammatory response to antigenic stimulus(GO:0002862) |
| 0.1 | 1.1 | GO:2000291 | regulation of myoblast proliferation(GO:2000291) |
| 0.1 | 0.3 | GO:0048749 | compound eye development(GO:0048749) |
| 0.1 | 1.5 | GO:0030322 | stabilization of membrane potential(GO:0030322) |
| 0.1 | 0.6 | GO:0032218 | riboflavin transport(GO:0032218) |
| 0.1 | 0.2 | GO:1903750 | regulation of intrinsic apoptotic signaling pathway in response to hydrogen peroxide(GO:1903750) negative regulation of intrinsic apoptotic signaling pathway in response to hydrogen peroxide(GO:1903751) |
| 0.1 | 0.9 | GO:0051873 | killing by host of symbiont cells(GO:0051873) |
| 0.1 | 0.5 | GO:1900864 | mitochondrial tRNA modification(GO:0070900) mitochondrial RNA modification(GO:1900864) |
| 0.1 | 0.3 | GO:0035897 | proteolysis in other organism(GO:0035897) |
| 0.1 | 1.1 | GO:0009812 | flavonoid metabolic process(GO:0009812) |
| 0.1 | 0.1 | GO:1900222 | negative regulation of beta-amyloid clearance(GO:1900222) |
| 0.1 | 2.3 | GO:0070286 | axonemal dynein complex assembly(GO:0070286) |
| 0.1 | 0.5 | GO:0072757 | cellular response to camptothecin(GO:0072757) |
| 0.1 | 0.3 | GO:0071415 | cellular response to purine-containing compound(GO:0071415) |
| 0.1 | 0.6 | GO:0002191 | cap-dependent translational initiation(GO:0002191) |
| 0.1 | 0.2 | GO:1905216 | positive regulation of mRNA binding(GO:1902416) positive regulation of RNA binding(GO:1905216) |
| 0.1 | 1.3 | GO:0090162 | establishment of epithelial cell polarity(GO:0090162) |
| 0.1 | 0.2 | GO:0034116 | positive regulation of heterotypic cell-cell adhesion(GO:0034116) |
| 0.1 | 0.1 | GO:1902688 | fermentation(GO:0006113) regulation of fermentation(GO:0043465) regulation of NAD metabolic process(GO:1902688) |
| 0.1 | 0.2 | GO:0030259 | lipid glycosylation(GO:0030259) |
| 0.1 | 1.0 | GO:0045078 | positive regulation of interferon-gamma biosynthetic process(GO:0045078) |
| 0.1 | 3.3 | GO:2000649 | regulation of sodium ion transmembrane transporter activity(GO:2000649) |
| 0.1 | 0.3 | GO:0045065 | cytotoxic T cell differentiation(GO:0045065) |
| 0.1 | 0.1 | GO:0070885 | negative regulation of calcineurin-NFAT signaling cascade(GO:0070885) |
| 0.1 | 0.3 | GO:0002396 | MHC protein complex assembly(GO:0002396) MHC class II protein complex assembly(GO:0002399) |
| 0.1 | 0.1 | GO:0016198 | axon choice point recognition(GO:0016198) |
| 0.1 | 0.3 | GO:0071802 | negative regulation of podosome assembly(GO:0071802) |
| 0.1 | 0.1 | GO:0021558 | trochlear nerve development(GO:0021558) |
| 0.1 | 0.1 | GO:0009441 | glycolate metabolic process(GO:0009441) |
| 0.1 | 0.1 | GO:0002679 | respiratory burst involved in defense response(GO:0002679) |
| 0.1 | 1.5 | GO:0018146 | keratan sulfate biosynthetic process(GO:0018146) |
| 0.1 | 0.2 | GO:0035544 | negative regulation of SNARE complex assembly(GO:0035544) |
| 0.1 | 0.7 | GO:0032688 | negative regulation of interferon-beta production(GO:0032688) |
| 0.1 | 0.7 | GO:0006516 | glycoprotein catabolic process(GO:0006516) |
| 0.1 | 0.1 | GO:0044333 | Wnt signaling pathway involved in digestive tract morphogenesis(GO:0044333) |
| 0.1 | 0.1 | GO:0032808 | lacrimal gland development(GO:0032808) |
| 0.1 | 0.5 | GO:0006382 | adenosine to inosine editing(GO:0006382) |
| 0.1 | 0.3 | GO:0036149 | phosphatidylinositol acyl-chain remodeling(GO:0036149) |
| 0.1 | 0.2 | GO:0009644 | response to high light intensity(GO:0009644) |
| 0.1 | 0.4 | GO:0072540 | T-helper 17 cell lineage commitment(GO:0072540) |
| 0.1 | 1.0 | GO:2000052 | positive regulation of non-canonical Wnt signaling pathway(GO:2000052) |
| 0.1 | 2.0 | GO:0030488 | tRNA methylation(GO:0030488) |
| 0.1 | 0.5 | GO:0006072 | glycerol-3-phosphate metabolic process(GO:0006072) |
| 0.1 | 0.3 | GO:0010533 | regulation of activation of Janus kinase activity(GO:0010533) |
| 0.1 | 0.3 | GO:0021780 | oligodendrocyte cell fate specification(GO:0021778) oligodendrocyte cell fate commitment(GO:0021779) glial cell fate specification(GO:0021780) |
| 0.1 | 0.1 | GO:0016321 | female meiosis chromosome segregation(GO:0016321) |
| 0.1 | 0.4 | GO:0070475 | rRNA base methylation(GO:0070475) |
| 0.1 | 1.0 | GO:0030046 | parallel actin filament bundle assembly(GO:0030046) |
| 0.1 | 0.2 | GO:0002774 | Fc receptor mediated inhibitory signaling pathway(GO:0002774) |
| 0.1 | 0.3 | GO:0044209 | AMP salvage(GO:0044209) |
| 0.1 | 1.7 | GO:0035767 | endothelial cell chemotaxis(GO:0035767) |
| 0.1 | 1.2 | GO:0042554 | superoxide anion generation(GO:0042554) |
| 0.1 | 0.2 | GO:0018171 | peptidyl-cysteine oxidation(GO:0018171) |
| 0.1 | 0.4 | GO:0009052 | pentose-phosphate shunt, non-oxidative branch(GO:0009052) |
| 0.1 | 0.7 | GO:0006552 | leucine catabolic process(GO:0006552) |
| 0.1 | 1.3 | GO:0016180 | snRNA processing(GO:0016180) |
| 0.1 | 3.1 | GO:0044380 | protein localization to cytoskeleton(GO:0044380) |
| 0.1 | 0.2 | GO:0045404 | negative regulation of T cell tolerance induction(GO:0002665) negative regulation of T cell anergy(GO:0002668) negative regulation of lymphocyte anergy(GO:0002912) regulation of lymphotoxin A production(GO:0032681) positive regulation of lymphotoxin A production(GO:0032761) interleukin-4 biosynthetic process(GO:0042097) regulation of lymphotoxin A biosynthetic process(GO:0043016) positive regulation of lymphotoxin A biosynthetic process(GO:0043017) regulation of interleukin-4 biosynthetic process(GO:0045402) positive regulation of interleukin-4 biosynthetic process(GO:0045404) |
| 0.1 | 0.2 | GO:0071422 | succinate transport(GO:0015744) succinate transmembrane transport(GO:0071422) |
| 0.1 | 1.2 | GO:0030150 | protein import into mitochondrial matrix(GO:0030150) |
| 0.1 | 4.8 | GO:0045576 | mast cell activation(GO:0045576) |
| 0.1 | 0.5 | GO:0097012 | cellular response to granulocyte macrophage colony-stimulating factor stimulus(GO:0097011) response to granulocyte macrophage colony-stimulating factor(GO:0097012) |
| 0.1 | 0.6 | GO:0002480 | antigen processing and presentation of exogenous peptide antigen via MHC class I, TAP-independent(GO:0002480) |
| 0.1 | 0.1 | GO:1903774 | positive regulation of viral budding via host ESCRT complex(GO:1903774) |
| 0.1 | 0.1 | GO:0002316 | follicular B cell differentiation(GO:0002316) |
| 0.1 | 0.7 | GO:0019919 | peptidyl-arginine methylation, to asymmetrical-dimethyl arginine(GO:0019919) |
| 0.1 | 2.4 | GO:0038128 | ERBB2 signaling pathway(GO:0038128) |
| 0.1 | 0.5 | GO:0070234 | positive regulation of T cell apoptotic process(GO:0070234) |
| 0.1 | 0.2 | GO:0090156 | cellular sphingolipid homeostasis(GO:0090156) |
| 0.1 | 0.2 | GO:0046689 | response to mercury ion(GO:0046689) |
| 0.1 | 2.1 | GO:0010738 | regulation of protein kinase A signaling(GO:0010738) |
| 0.1 | 1.5 | GO:0010591 | regulation of lamellipodium assembly(GO:0010591) |
| 0.1 | 0.5 | GO:0002675 | positive regulation of acute inflammatory response(GO:0002675) |
| 0.1 | 0.7 | GO:0046654 | tetrahydrofolate biosynthetic process(GO:0046654) |
| 0.1 | 0.3 | GO:0048539 | bone marrow development(GO:0048539) |
| 0.1 | 0.7 | GO:0001573 | ganglioside metabolic process(GO:0001573) |
| 0.1 | 0.4 | GO:0002097 | tRNA wobble base modification(GO:0002097) |
| 0.1 | 0.2 | GO:0016256 | N-glycan processing to lysosome(GO:0016256) |
| 0.1 | 0.9 | GO:0001913 | T cell mediated cytotoxicity(GO:0001913) |
| 0.1 | 0.1 | GO:0071931 | positive regulation of transcription involved in G1/S transition of mitotic cell cycle(GO:0071931) |
| 0.1 | 0.3 | GO:1904491 | protein localization to ciliary transition zone(GO:1904491) |
| 0.1 | 0.1 | GO:0033861 | negative regulation of NAD(P)H oxidase activity(GO:0033861) |
| 0.1 | 0.2 | GO:2000490 | negative regulation of hepatic stellate cell activation(GO:2000490) |
| 0.1 | 0.4 | GO:0051969 | regulation of transmission of nerve impulse(GO:0051969) |
| 0.1 | 0.1 | GO:0009794 | regulation of mitotic cell cycle, embryonic(GO:0009794) mitotic cell cycle, embryonic(GO:0045448) |
| 0.1 | 0.3 | GO:0032468 | Golgi calcium ion homeostasis(GO:0032468) |
| 0.1 | 0.2 | GO:2001166 | regulation of histone H2B ubiquitination(GO:2001166) positive regulation of histone H2B ubiquitination(GO:2001168) |
| 0.1 | 0.3 | GO:0032020 | ISG15-protein conjugation(GO:0032020) |
| 0.1 | 0.7 | GO:0006570 | tyrosine metabolic process(GO:0006570) |
| 0.1 | 0.1 | GO:0072061 | inner medullary collecting duct development(GO:0072061) |
| 0.1 | 0.3 | GO:0042851 | L-alanine metabolic process(GO:0042851) L-alanine catabolic process(GO:0042853) |
| 0.1 | 0.7 | GO:0015866 | ADP transport(GO:0015866) |
| 0.1 | 0.6 | GO:0048227 | plasma membrane to endosome transport(GO:0048227) |
| 0.1 | 0.2 | GO:0048073 | regulation of eye pigmentation(GO:0048073) |
| 0.1 | 0.3 | GO:2000468 | negative regulation of dopamine uptake involved in synaptic transmission(GO:0051585) norepinephrine uptake(GO:0051620) regulation of norepinephrine uptake(GO:0051621) negative regulation of norepinephrine uptake(GO:0051622) negative regulation of catecholamine uptake involved in synaptic transmission(GO:0051945) regulation of glutathione peroxidase activity(GO:1903282) positive regulation of glutathione peroxidase activity(GO:1903284) positive regulation of hydrogen peroxide catabolic process(GO:1903285) regulation of peroxidase activity(GO:2000468) positive regulation of peroxidase activity(GO:2000470) |
| 0.1 | 0.2 | GO:0006620 | posttranslational protein targeting to membrane(GO:0006620) |
| 0.1 | 0.2 | GO:0019348 | dolichol metabolic process(GO:0019348) |
| 0.1 | 0.2 | GO:1990164 | histone H2A phosphorylation(GO:1990164) |
| 0.1 | 0.7 | GO:0046940 | nucleoside monophosphate phosphorylation(GO:0046940) |
| 0.1 | 0.4 | GO:0032364 | oxygen homeostasis(GO:0032364) |
| 0.1 | 0.2 | GO:0002881 | microglial cell activation involved in immune response(GO:0002282) chronic inflammatory response to non-antigenic stimulus(GO:0002545) regulation of chronic inflammatory response to non-antigenic stimulus(GO:0002880) negative regulation of chronic inflammatory response to non-antigenic stimulus(GO:0002881) |
| 0.1 | 0.1 | GO:1903862 | positive regulation of oxidative phosphorylation(GO:1903862) |
| 0.1 | 0.1 | GO:0006680 | glucosylceramide catabolic process(GO:0006680) |
| 0.1 | 0.8 | GO:0031167 | rRNA methylation(GO:0031167) |
| 0.1 | 0.3 | GO:0030644 | cellular chloride ion homeostasis(GO:0030644) |
| 0.1 | 0.2 | GO:0042738 | exogenous drug catabolic process(GO:0042738) |
| 0.1 | 1.7 | GO:0008593 | regulation of Notch signaling pathway(GO:0008593) |
| 0.1 | 0.1 | GO:0090521 | glomerular visceral epithelial cell migration(GO:0090521) |
| 0.1 | 0.1 | GO:2000382 | positive regulation of mesoderm development(GO:2000382) |
| 0.1 | 0.6 | GO:1990118 | sodium ion import across plasma membrane(GO:0098719) sodium ion import into cell(GO:1990118) |
| 0.1 | 0.5 | GO:0006390 | transcription from mitochondrial promoter(GO:0006390) |
| 0.1 | 1.0 | GO:0045161 | neuronal ion channel clustering(GO:0045161) |
| 0.1 | 1.8 | GO:2000300 | regulation of synaptic vesicle exocytosis(GO:2000300) |
| 0.1 | 0.2 | GO:0043615 | astrocyte cell migration(GO:0043615) |
| 0.1 | 0.9 | GO:0001696 | gastric acid secretion(GO:0001696) |
| 0.1 | 0.3 | GO:0010155 | regulation of proton transport(GO:0010155) |
| 0.1 | 0.2 | GO:0030174 | regulation of DNA-dependent DNA replication initiation(GO:0030174) |
| 0.1 | 0.1 | GO:0097695 | establishment of RNA localization to telomere(GO:0097694) establishment of macromolecular complex localization to telomere(GO:0097695) |
| 0.1 | 0.2 | GO:0030222 | eosinophil differentiation(GO:0030222) |
| 0.1 | 1.4 | GO:0060216 | definitive hemopoiesis(GO:0060216) |
| 0.1 | 0.3 | GO:0048312 | intracellular distribution of mitochondria(GO:0048312) |
| 0.1 | 0.2 | GO:0006114 | glycerol biosynthetic process(GO:0006114) alditol biosynthetic process(GO:0019401) |
| 0.1 | 0.2 | GO:0030037 | actin filament reorganization involved in cell cycle(GO:0030037) |
| 0.0 | 0.5 | GO:1901409 | positive regulation of phosphorylation of RNA polymerase II C-terminal domain(GO:1901409) |
| 0.0 | 0.1 | GO:0035574 | histone H4-K20 demethylation(GO:0035574) |
| 0.0 | 0.1 | GO:0021898 | regulation of transcription from RNA polymerase II promoter involved in forebrain neuron fate commitment(GO:0021882) cerebral cortex GABAergic interneuron fate commitment(GO:0021893) commitment of multipotent stem cells to neuronal lineage in forebrain(GO:0021898) positive regulation of neural retina development(GO:0061075) positive regulation of retina development in camera-type eye(GO:1902868) regulation of amacrine cell differentiation(GO:1902869) positive regulation of amacrine cell differentiation(GO:1902871) |
| 0.0 | 1.1 | GO:0006853 | carnitine shuttle(GO:0006853) |
| 0.0 | 0.5 | GO:0010908 | regulation of heparan sulfate proteoglycan biosynthetic process(GO:0010908) positive regulation of heparan sulfate proteoglycan biosynthetic process(GO:0010909) positive regulation of proteoglycan biosynthetic process(GO:1902730) |
| 0.0 | 0.6 | GO:0018095 | protein polyglutamylation(GO:0018095) |
| 0.0 | 0.4 | GO:0006991 | response to sterol depletion(GO:0006991) SREBP signaling pathway(GO:0032933) cellular response to sterol depletion(GO:0071501) |
| 0.0 | 1.4 | GO:0030970 | retrograde protein transport, ER to cytosol(GO:0030970) |
| 0.0 | 0.2 | GO:2000612 | thyroid-stimulating hormone secretion(GO:0070460) regulation of thyroid-stimulating hormone secretion(GO:2000612) |
| 0.0 | 0.2 | GO:0061760 | antifungal innate immune response(GO:0061760) |
| 0.0 | 0.1 | GO:0032971 | regulation of muscle filament sliding(GO:0032971) |
| 0.0 | 0.2 | GO:1902570 | protein localization to nucleolus(GO:1902570) |
| 0.0 | 0.6 | GO:0016446 | somatic hypermutation of immunoglobulin genes(GO:0016446) |
| 0.0 | 0.1 | GO:0099540 | synaptic signaling via neuropeptide(GO:0099538) trans-synaptic signaling by neuropeptide(GO:0099540) trans-synaptic signalling, modulating synaptic transmission(GO:0099550) trans-synaptic signaling by neuropeptide, modulating synaptic transmission(GO:0099551) |
| 0.0 | 0.9 | GO:2000251 | positive regulation of actin cytoskeleton reorganization(GO:2000251) |
| 0.0 | 0.3 | GO:0035093 | spermatogenesis, exchange of chromosomal proteins(GO:0035093) |
| 0.0 | 0.1 | GO:2000418 | positive regulation of eosinophil migration(GO:2000418) |
| 0.0 | 0.3 | GO:2000324 | positive regulation of glucocorticoid receptor signaling pathway(GO:2000324) |
| 0.0 | 0.7 | GO:0048266 | behavioral response to pain(GO:0048266) |
| 0.0 | 0.2 | GO:0014807 | regulation of somitogenesis(GO:0014807) |
| 0.0 | 0.3 | GO:0035860 | glial cell-derived neurotrophic factor receptor signaling pathway(GO:0035860) |
| 0.0 | 0.1 | GO:0098507 | polynucleotide 5' dephosphorylation(GO:0098507) |
| 0.0 | 0.5 | GO:0007635 | chemosensory behavior(GO:0007635) |
| 0.0 | 0.0 | GO:0032621 | interleukin-18 production(GO:0032621) |
| 0.0 | 0.0 | GO:0044026 | DNA hypermethylation(GO:0044026) |
| 0.0 | 0.2 | GO:0071596 | ubiquitin-dependent protein catabolic process via the N-end rule pathway(GO:0071596) |
| 0.0 | 0.5 | GO:0097205 | renal filtration(GO:0097205) |
| 0.0 | 0.3 | GO:0060736 | prostate gland growth(GO:0060736) |
| 0.0 | 9.3 | GO:0007163 | establishment or maintenance of cell polarity(GO:0007163) |
| 0.0 | 0.1 | GO:0010968 | regulation of microtubule nucleation(GO:0010968) |
| 0.0 | 0.1 | GO:0060368 | regulation of Fc receptor mediated stimulatory signaling pathway(GO:0060368) |
| 0.0 | 0.0 | GO:0001956 | positive regulation of neurotransmitter secretion(GO:0001956) |
| 0.0 | 0.4 | GO:0090168 | Golgi reassembly(GO:0090168) |
| 0.0 | 0.4 | GO:0031118 | rRNA pseudouridine synthesis(GO:0031118) |
| 0.0 | 0.9 | GO:0036150 | phosphatidylserine acyl-chain remodeling(GO:0036150) |
| 0.0 | 0.1 | GO:0015847 | putrescine transport(GO:0015847) |
| 0.0 | 0.2 | GO:0070127 | tRNA aminoacylation for mitochondrial protein translation(GO:0070127) |
| 0.0 | 1.3 | GO:0045746 | negative regulation of Notch signaling pathway(GO:0045746) |
| 0.0 | 1.0 | GO:0010863 | positive regulation of phospholipase C activity(GO:0010863) |
| 0.0 | 0.1 | GO:0010387 | COP9 signalosome assembly(GO:0010387) |
| 0.0 | 0.7 | GO:0010666 | positive regulation of striated muscle cell apoptotic process(GO:0010663) positive regulation of cardiac muscle cell apoptotic process(GO:0010666) |
| 0.0 | 0.3 | GO:0007506 | gonadal mesoderm development(GO:0007506) |
| 0.0 | 0.1 | GO:0046643 | regulation of gamma-delta T cell differentiation(GO:0045586) regulation of gamma-delta T cell activation(GO:0046643) |
| 0.0 | 0.1 | GO:0001994 | norepinephrine-epinephrine vasoconstriction involved in regulation of systemic arterial blood pressure(GO:0001994) |
| 0.0 | 0.4 | GO:0072643 | interferon-gamma secretion(GO:0072643) |
| 0.0 | 0.0 | GO:0021764 | amygdala development(GO:0021764) |
| 0.0 | 0.1 | GO:0006147 | guanine catabolic process(GO:0006147) |
| 0.0 | 0.2 | GO:0009405 | pathogenesis(GO:0009405) |
| 0.0 | 0.3 | GO:0016188 | synaptic vesicle maturation(GO:0016188) |
| 0.0 | 0.1 | GO:1901299 | negative regulation of hydrogen peroxide-mediated programmed cell death(GO:1901299) |
| 0.0 | 0.2 | GO:0072092 | ureteric bud invasion(GO:0072092) metanephric renal vesicle formation(GO:0072093) |
| 0.0 | 0.5 | GO:0018377 | protein myristoylation(GO:0018377) |
| 0.0 | 0.3 | GO:0045950 | negative regulation of mitotic recombination(GO:0045950) |
| 0.0 | 1.3 | GO:1902475 | L-alpha-amino acid transmembrane transport(GO:1902475) |
| 0.0 | 0.5 | GO:1901673 | regulation of mitotic spindle assembly(GO:1901673) |
| 0.0 | 0.0 | GO:1903587 | regulation of blood vessel endothelial cell proliferation involved in sprouting angiogenesis(GO:1903587) |
| 0.0 | 0.0 | GO:0090118 | receptor-mediated endocytosis of low-density lipoprotein particle involved in cholesterol transport(GO:0090118) |
| 0.0 | 0.5 | GO:0048302 | regulation of isotype switching to IgG isotypes(GO:0048302) |
| 0.0 | 0.1 | GO:0018199 | peptidyl-glutamine modification(GO:0018199) |
| 0.0 | 0.3 | GO:0045716 | positive regulation of low-density lipoprotein particle receptor biosynthetic process(GO:0045716) |
| 0.0 | 0.3 | GO:1901315 | negative regulation of histone ubiquitination(GO:0033183) regulation of histone H2A K63-linked ubiquitination(GO:1901314) negative regulation of histone H2A K63-linked ubiquitination(GO:1901315) |
| 0.0 | 0.2 | GO:0097119 | postsynaptic density protein 95 clustering(GO:0097119) |
| 0.0 | 0.1 | GO:0071344 | diphosphate metabolic process(GO:0071344) |
| 0.0 | 0.2 | GO:0002870 | lymphocyte anergy(GO:0002249) regulation of T cell anergy(GO:0002667) T cell anergy(GO:0002870) regulation of lymphocyte anergy(GO:0002911) |
| 0.0 | 0.7 | GO:1904814 | regulation of protein localization to chromosome, telomeric region(GO:1904814) positive regulation of protein localization to chromosome, telomeric region(GO:1904816) |
| 0.0 | 2.3 | GO:0035722 | interleukin-12-mediated signaling pathway(GO:0035722) response to interleukin-12(GO:0070671) cellular response to interleukin-12(GO:0071349) |
| 0.0 | 0.2 | GO:0051754 | meiotic sister chromatid cohesion, centromeric(GO:0051754) |
| 0.0 | 0.2 | GO:0010900 | negative regulation of phosphatidylcholine catabolic process(GO:0010900) |
| 0.0 | 2.2 | GO:0008088 | axo-dendritic transport(GO:0008088) |
| 0.0 | 0.2 | GO:0002024 | diet induced thermogenesis(GO:0002024) |
| 0.0 | 0.2 | GO:1904116 | response to vasopressin(GO:1904116) cellular response to vasopressin(GO:1904117) |
| 0.0 | 0.2 | GO:0002318 | myeloid progenitor cell differentiation(GO:0002318) |
| 0.0 | 0.8 | GO:0042491 | auditory receptor cell differentiation(GO:0042491) |
| 0.0 | 0.2 | GO:1903690 | negative regulation of wound healing, spreading of epidermal cells(GO:1903690) |
| 0.0 | 0.6 | GO:1901836 | regulation of transcription of nuclear large rRNA transcript from RNA polymerase I promoter(GO:1901836) |
| 0.0 | 0.3 | GO:0007042 | lysosomal lumen acidification(GO:0007042) |
| 0.0 | 0.6 | GO:0003374 | dynamin polymerization involved in membrane fission(GO:0003373) dynamin polymerization involved in mitochondrial fission(GO:0003374) |
| 0.0 | 0.2 | GO:0010668 | ectodermal cell differentiation(GO:0010668) |
| 0.0 | 0.5 | GO:0050879 | multicellular organismal movement(GO:0050879) musculoskeletal movement(GO:0050881) |
| 0.0 | 0.4 | GO:0090218 | positive regulation of lipid kinase activity(GO:0090218) |
| 0.0 | 0.1 | GO:0071504 | cellular response to heparin(GO:0071504) |
| 0.0 | 0.2 | GO:0010579 | regulation of adenylate cyclase activity involved in G-protein coupled receptor signaling pathway(GO:0010578) positive regulation of adenylate cyclase activity involved in G-protein coupled receptor signaling pathway(GO:0010579) |
| 0.0 | 0.5 | GO:0015939 | pantothenate metabolic process(GO:0015939) |
| 0.0 | 0.2 | GO:0048200 | COPI-coated vesicle budding(GO:0035964) Golgi transport vesicle coating(GO:0048200) COPI coating of Golgi vesicle(GO:0048205) |
| 0.0 | 0.8 | GO:0051290 | protein heterotetramerization(GO:0051290) |
| 0.0 | 0.4 | GO:2000786 | positive regulation of autophagosome assembly(GO:2000786) |
| 0.0 | 1.4 | GO:0045773 | positive regulation of axon extension(GO:0045773) |
| 0.0 | 0.4 | GO:0038203 | TORC2 signaling(GO:0038203) |
| 0.0 | 0.2 | GO:0007000 | nucleolus organization(GO:0007000) |
| 0.0 | 0.4 | GO:0008340 | determination of adult lifespan(GO:0008340) |
| 0.0 | 0.5 | GO:0032757 | positive regulation of interleukin-8 production(GO:0032757) |
| 0.0 | 0.1 | GO:1905224 | clathrin-coated pit assembly(GO:1905224) |
| 0.0 | 0.2 | GO:0051988 | regulation of attachment of spindle microtubules to kinetochore(GO:0051988) |
| 0.0 | 0.3 | GO:0007197 | adenylate cyclase-inhibiting G-protein coupled acetylcholine receptor signaling pathway(GO:0007197) |
| 0.0 | 0.1 | GO:0046271 | phenylpropanoid catabolic process(GO:0046271) |
| 0.0 | 0.3 | GO:0045943 | positive regulation of transcription from RNA polymerase I promoter(GO:0045943) |
| 0.0 | 0.3 | GO:1904321 | response to forskolin(GO:1904321) cellular response to forskolin(GO:1904322) |
| 0.0 | 0.8 | GO:0007130 | synaptonemal complex assembly(GO:0007130) |
| 0.0 | 0.1 | GO:0006288 | base-excision repair, DNA ligation(GO:0006288) |
| 0.0 | 0.1 | GO:0040009 | regulation of growth rate(GO:0040009) |
| 0.0 | 0.2 | GO:0001880 | Mullerian duct regression(GO:0001880) |
| 0.0 | 0.6 | GO:0060412 | ventricular septum morphogenesis(GO:0060412) |
| 0.0 | 0.2 | GO:0043457 | regulation of cellular respiration(GO:0043457) |
| 0.0 | 0.1 | GO:0006788 | heme oxidation(GO:0006788) |
| 0.0 | 0.7 | GO:0060314 | regulation of ryanodine-sensitive calcium-release channel activity(GO:0060314) |
| 0.0 | 0.2 | GO:0051026 | chiasma assembly(GO:0051026) |
| 0.0 | 0.1 | GO:0060449 | bud elongation involved in lung branching(GO:0060449) |
| 0.0 | 0.2 | GO:0009213 | pyrimidine nucleoside triphosphate catabolic process(GO:0009149) pyrimidine deoxyribonucleoside triphosphate catabolic process(GO:0009213) |
| 0.0 | 0.1 | GO:1901098 | positive regulation of autophagosome maturation(GO:1901098) |
| 0.0 | 0.2 | GO:0048298 | positive regulation of isotype switching to IgA isotypes(GO:0048298) |
| 0.0 | 0.1 | GO:1902775 | mitochondrial large ribosomal subunit assembly(GO:1902775) |
| 0.0 | 0.3 | GO:0045039 | protein import into mitochondrial inner membrane(GO:0045039) |
| 0.0 | 0.3 | GO:0017196 | N-terminal peptidyl-methionine acetylation(GO:0017196) |
| 0.0 | 1.2 | GO:0046627 | negative regulation of insulin receptor signaling pathway(GO:0046627) |
| 0.0 | 0.1 | GO:0003431 | growth plate cartilage chondrocyte development(GO:0003431) |
| 0.0 | 0.2 | GO:0032494 | response to peptidoglycan(GO:0032494) |
| 0.0 | 0.1 | GO:2000586 | regulation of platelet-derived growth factor receptor-beta signaling pathway(GO:2000586) |
| 0.0 | 2.1 | GO:0051897 | positive regulation of protein kinase B signaling(GO:0051897) |
| 0.0 | 0.3 | GO:0000480 | endonucleolytic cleavage in 5'-ETS of tricistronic rRNA transcript (SSU-rRNA, 5.8S rRNA, LSU-rRNA)(GO:0000480) |
| 0.0 | 0.1 | GO:0043400 | cortisol secretion(GO:0043400) regulation of cortisol secretion(GO:0051462) positive regulation of cortisol secretion(GO:0051464) positive regulation of glucocorticoid secretion(GO:2000851) |
| 0.0 | 0.2 | GO:0051694 | pointed-end actin filament capping(GO:0051694) |
| 0.0 | 0.0 | GO:0019075 | virus maturation(GO:0019075) |
| 0.0 | 0.1 | GO:0021623 | oculomotor nerve development(GO:0021557) oculomotor nerve morphogenesis(GO:0021622) oculomotor nerve formation(GO:0021623) |
| 0.0 | 0.2 | GO:0034436 | glycoprotein transport(GO:0034436) reelin-mediated signaling pathway(GO:0038026) |
| 0.0 | 0.1 | GO:0070105 | regulation of interleukin-6-mediated signaling pathway(GO:0070103) positive regulation of interleukin-6-mediated signaling pathway(GO:0070105) |
| 0.0 | 0.3 | GO:0006828 | manganese ion transport(GO:0006828) |
| 0.0 | 0.1 | GO:0018242 | protein O-linked glycosylation via serine(GO:0018242) |
| 0.0 | 0.1 | GO:0030573 | bile acid catabolic process(GO:0030573) |
| 0.0 | 0.4 | GO:0016075 | rRNA catabolic process(GO:0016075) |
| 0.0 | 0.4 | GO:0097286 | iron ion import(GO:0097286) |
| 0.0 | 0.1 | GO:0042264 | peptidyl-aspartic acid hydroxylation(GO:0042264) |
| 0.0 | 0.2 | GO:0071318 | cellular response to ATP(GO:0071318) |
| 0.0 | 0.1 | GO:0018076 | N-terminal peptidyl-lysine acetylation(GO:0018076) |
| 0.0 | 0.1 | GO:0000023 | maltose metabolic process(GO:0000023) |
| 0.0 | 0.3 | GO:0050862 | positive regulation of T cell receptor signaling pathway(GO:0050862) |
| 0.0 | 0.1 | GO:0002268 | follicular dendritic cell activation(GO:0002266) follicular dendritic cell differentiation(GO:0002268) |
| 0.0 | 0.5 | GO:0042744 | hydrogen peroxide catabolic process(GO:0042744) |
| 0.0 | 0.4 | GO:0002438 | acute inflammatory response to antigenic stimulus(GO:0002438) |
| 0.0 | 0.2 | GO:0015014 | heparan sulfate proteoglycan biosynthetic process, polysaccharide chain biosynthetic process(GO:0015014) |
| 0.0 | 0.1 | GO:0048250 | mitochondrial iron ion transport(GO:0048250) |
| 0.0 | 0.1 | GO:0019673 | GDP-mannose biosynthetic process(GO:0009298) GDP-mannose metabolic process(GO:0019673) |
| 0.0 | 0.2 | GO:1990573 | potassium ion import across plasma membrane(GO:1990573) |
| 0.0 | 0.6 | GO:0030851 | granulocyte differentiation(GO:0030851) |
| 0.0 | 2.8 | GO:0035725 | sodium ion transmembrane transport(GO:0035725) |
| 0.0 | 0.1 | GO:0006012 | galactose metabolic process(GO:0006012) |
| 0.0 | 0.2 | GO:0030202 | heparin metabolic process(GO:0030202) heparin biosynthetic process(GO:0030210) |
| 0.0 | 0.1 | GO:0093001 | glycolytic process through glucose-1-phosphate(GO:0061622) glycolysis from storage polysaccharide through glucose-1-phosphate(GO:0093001) |
| 0.0 | 0.2 | GO:0032264 | IMP salvage(GO:0032264) |
| 0.0 | 0.1 | GO:2000609 | regulation of thyroid hormone generation(GO:2000609) |
| 0.0 | 2.5 | GO:0010923 | negative regulation of phosphatase activity(GO:0010923) |
| 0.0 | 0.4 | GO:0034975 | protein folding in endoplasmic reticulum(GO:0034975) |
| 0.0 | 0.2 | GO:0032482 | Rab protein signal transduction(GO:0032482) |
| 0.0 | 0.1 | GO:0070970 | interleukin-2 secretion(GO:0070970) |
| 0.0 | 0.1 | GO:0035881 | amacrine cell differentiation(GO:0035881) |
| 0.0 | 0.1 | GO:0060332 | positive regulation of response to interferon-gamma(GO:0060332) positive regulation of interferon-gamma-mediated signaling pathway(GO:0060335) |
| 0.0 | 0.2 | GO:0033227 | dsRNA transport(GO:0033227) |
| 0.0 | 0.1 | GO:0007621 | negative regulation of female receptivity(GO:0007621) |
| 0.0 | 0.2 | GO:0098703 | calcium ion import across plasma membrane(GO:0098703) calcium ion import into cell(GO:1990035) |
| 0.0 | 0.1 | GO:0043418 | homocysteine catabolic process(GO:0043418) |
| 0.0 | 0.1 | GO:0003415 | chondrocyte hypertrophy(GO:0003415) |
| 0.0 | 0.1 | GO:0061182 | negative regulation of chondrocyte development(GO:0061182) |
| 0.0 | 0.2 | GO:1904874 | positive regulation of telomerase RNA localization to Cajal body(GO:1904874) |
| 0.0 | 0.1 | GO:0051039 | histone displacement(GO:0001207) positive regulation of transcription involved in meiotic cell cycle(GO:0051039) |
| 0.0 | 0.3 | GO:0002430 | complement receptor mediated signaling pathway(GO:0002430) |
| 0.0 | 0.1 | GO:0006015 | 5-phosphoribose 1-diphosphate biosynthetic process(GO:0006015) 5-phosphoribose 1-diphosphate metabolic process(GO:0046391) |
| 0.0 | 1.1 | GO:0032755 | positive regulation of interleukin-6 production(GO:0032755) |
| 0.0 | 0.1 | GO:1900121 | negative regulation of receptor binding(GO:1900121) |
| 0.0 | 0.2 | GO:0021527 | spinal cord association neuron differentiation(GO:0021527) |
| 0.0 | 0.0 | GO:0007161 | calcium-independent cell-matrix adhesion(GO:0007161) |
| 0.0 | 0.1 | GO:1901898 | negative regulation of relaxation of muscle(GO:1901078) negative regulation of relaxation of cardiac muscle(GO:1901898) |
| 0.0 | 0.0 | GO:0010609 | mRNA localization resulting in posttranscriptional regulation of gene expression(GO:0010609) |
| 0.0 | 0.2 | GO:0071472 | cellular response to salt stress(GO:0071472) |
| 0.0 | 0.1 | GO:0090309 | positive regulation of methylation-dependent chromatin silencing(GO:0090309) |
| 0.0 | 0.1 | GO:0070874 | negative regulation of glycogen metabolic process(GO:0070874) |
| 0.0 | 0.1 | GO:0019626 | short-chain fatty acid catabolic process(GO:0019626) |
| 0.0 | 0.4 | GO:0048240 | sperm capacitation(GO:0048240) |
| 0.0 | 0.1 | GO:0072656 | maintenance of protein location in mitochondrion(GO:0072656) |
| 0.0 | 0.1 | GO:0033625 | positive regulation of integrin activation(GO:0033625) |
| 0.0 | 0.1 | GO:0007386 | compartment pattern specification(GO:0007386) |
| 0.0 | 0.9 | GO:0042267 | natural killer cell mediated cytotoxicity(GO:0042267) |
| 0.0 | 0.0 | GO:0006663 | platelet activating factor biosynthetic process(GO:0006663) |
| 0.0 | 0.1 | GO:0021526 | medial motor column neuron differentiation(GO:0021526) |
| 0.0 | 0.2 | GO:0006707 | cholesterol catabolic process(GO:0006707) sterol catabolic process(GO:0016127) |
| 0.0 | 0.3 | GO:0046931 | pore complex assembly(GO:0046931) |
| 0.0 | 0.1 | GO:0071449 | response to lipid hydroperoxide(GO:0006982) cellular response to lipid hydroperoxide(GO:0071449) |
| 0.0 | 0.0 | GO:0071474 | cellular hyperosmotic response(GO:0071474) |
| 0.0 | 0.1 | GO:0060152 | peroxisome localization(GO:0060151) microtubule-based peroxisome localization(GO:0060152) |
| 0.0 | 0.1 | GO:0048712 | negative regulation of astrocyte differentiation(GO:0048712) |
| 0.0 | 0.1 | GO:0032581 | ER-dependent peroxisome organization(GO:0032581) |
| 0.0 | 0.1 | GO:0060766 | negative regulation of androgen receptor signaling pathway(GO:0060766) |
| 0.0 | 0.6 | GO:0000729 | DNA double-strand break processing(GO:0000729) |
| 0.0 | 0.0 | GO:1902310 | positive regulation of peptidyl-serine dephosphorylation(GO:1902310) |
| 0.0 | 0.1 | GO:2000312 | regulation of kainate selective glutamate receptor activity(GO:2000312) |
| 0.0 | 0.0 | GO:0016553 | base conversion or substitution editing(GO:0016553) |
| 0.0 | 1.5 | GO:0030819 | positive regulation of cAMP biosynthetic process(GO:0030819) |
| 0.0 | 1.2 | GO:0035019 | somatic stem cell population maintenance(GO:0035019) |
| 0.0 | 0.6 | GO:0006361 | transcription initiation from RNA polymerase I promoter(GO:0006361) termination of RNA polymerase I transcription(GO:0006363) |
| 0.0 | 0.1 | GO:0001865 | NK T cell differentiation(GO:0001865) |
| 0.0 | 0.2 | GO:0000389 | mRNA 3'-splice site recognition(GO:0000389) |
| 0.0 | 0.1 | GO:0051085 | chaperone mediated protein folding requiring cofactor(GO:0051085) |
| 0.0 | 0.2 | GO:1900078 | positive regulation of cellular response to insulin stimulus(GO:1900078) |
| 0.0 | 0.1 | GO:0035696 | monocyte extravasation(GO:0035696) |
| 0.0 | 0.1 | GO:0002933 | lipid hydroxylation(GO:0002933) |
| 0.0 | 0.3 | GO:0019373 | epoxygenase P450 pathway(GO:0019373) |
| 0.0 | 0.1 | GO:0042758 | long-chain fatty acid catabolic process(GO:0042758) |
| 0.0 | 0.1 | GO:2000821 | regulation of grooming behavior(GO:2000821) |
| 0.0 | 0.1 | GO:0008616 | queuosine biosynthetic process(GO:0008616) queuosine metabolic process(GO:0046116) |
| 0.0 | 0.1 | GO:0050689 | negative regulation of defense response to virus by host(GO:0050689) |
| 0.0 | 0.1 | GO:0008582 | regulation of synaptic growth at neuromuscular junction(GO:0008582) regulation of neuromuscular junction development(GO:1904396) |
| 0.0 | 0.2 | GO:0001562 | response to protozoan(GO:0001562) defense response to protozoan(GO:0042832) |
| 0.0 | 0.0 | GO:0019249 | lactate biosynthetic process(GO:0019249) |
| 0.0 | 0.3 | GO:2000622 | regulation of nuclear-transcribed mRNA catabolic process, nonsense-mediated decay(GO:2000622) negative regulation of nuclear-transcribed mRNA catabolic process, nonsense-mediated decay(GO:2000623) |
| 0.0 | 0.1 | GO:1904562 | phosphatidylinositol 5-phosphate metabolic process(GO:1904562) |
| 0.0 | 0.2 | GO:0003309 | type B pancreatic cell differentiation(GO:0003309) |
| 0.0 | 0.1 | GO:0019074 | viral genome packaging(GO:0019072) viral RNA genome packaging(GO:0019074) |
| 0.0 | 0.3 | GO:0071243 | cellular response to arsenic-containing substance(GO:0071243) |
| 0.0 | 0.1 | GO:0090435 | protein localization to nuclear envelope(GO:0090435) |
| 0.0 | 0.2 | GO:0009125 | nucleoside monophosphate catabolic process(GO:0009125) |
| 0.0 | 0.1 | GO:0046946 | hydroxylysine metabolic process(GO:0046946) hydroxylysine biosynthetic process(GO:0046947) |
| 0.0 | 0.1 | GO:1903251 | multi-ciliated epithelial cell differentiation(GO:1903251) |
| 0.0 | 0.1 | GO:0097428 | protein maturation by iron-sulfur cluster transfer(GO:0097428) |
| 0.0 | 0.0 | GO:0043353 | enucleate erythrocyte differentiation(GO:0043353) |
| 0.0 | 0.0 | GO:0060623 | regulation of chromosome condensation(GO:0060623) |
| 0.0 | 0.0 | GO:2000667 | positive regulation of interleukin-13 secretion(GO:2000667) |
| 0.0 | 0.2 | GO:0015919 | peroxisomal membrane transport(GO:0015919) protein import into peroxisome membrane(GO:0045046) |
| 0.0 | 0.1 | GO:0006999 | nuclear pore organization(GO:0006999) |
| 0.0 | 0.1 | GO:0018201 | N-terminal protein amino acid methylation(GO:0006480) N-terminal peptidyl-alanine methylation(GO:0018011) N-terminal peptidyl-alanine trimethylation(GO:0018012) N-terminal peptidyl-glycine methylation(GO:0018013) N-terminal peptidyl-proline dimethylation(GO:0018016) peptidyl-alanine modification(GO:0018194) peptidyl-glycine modification(GO:0018201) N-terminal peptidyl-proline methylation(GO:0035568) N-terminal peptidyl-serine methylation(GO:0035570) N-terminal peptidyl-serine dimethylation(GO:0035572) N-terminal peptidyl-serine trimethylation(GO:0035573) |
| 0.0 | 0.1 | GO:0035247 | peptidyl-arginine omega-N-methylation(GO:0035247) |
| 0.0 | 0.0 | GO:0043551 | regulation of phosphatidylinositol 3-kinase activity(GO:0043551) |
| 0.0 | 0.0 | GO:0014049 | positive regulation of glutamate secretion(GO:0014049) |
| 0.0 | 0.1 | GO:0070269 | pyroptosis(GO:0070269) |
| 0.0 | 0.1 | GO:0070296 | sarcoplasmic reticulum calcium ion transport(GO:0070296) |
| 0.0 | 0.1 | GO:0090481 | pyrimidine nucleotide-sugar transmembrane transport(GO:0090481) |
| 0.0 | 0.1 | GO:0010032 | meiotic chromosome condensation(GO:0010032) |
| 0.0 | 0.2 | GO:2001241 | positive regulation of extrinsic apoptotic signaling pathway in absence of ligand(GO:2001241) |
| 0.0 | 0.1 | GO:0002051 | osteoblast fate commitment(GO:0002051) |
| 0.0 | 0.0 | GO:0045819 | positive regulation of glycogen catabolic process(GO:0045819) |
| 0.0 | 0.1 | GO:0010996 | response to auditory stimulus(GO:0010996) |
| 0.0 | 0.1 | GO:0044565 | dendritic cell proliferation(GO:0044565) |
| 0.0 | 0.3 | GO:0007007 | inner mitochondrial membrane organization(GO:0007007) |
| 0.0 | 0.5 | GO:0006123 | mitochondrial electron transport, cytochrome c to oxygen(GO:0006123) |
| 0.0 | 0.1 | GO:0009048 | dosage compensation(GO:0007549) dosage compensation by inactivation of X chromosome(GO:0009048) |
| 0.0 | 0.1 | GO:0051084 | 'de novo' posttranslational protein folding(GO:0051084) |
| 0.0 | 0.0 | GO:0036269 | swimming behavior(GO:0036269) |
| 0.0 | 0.2 | GO:0001682 | tRNA 5'-leader removal(GO:0001682) |
| 0.0 | 0.1 | GO:1902866 | regulation of retina development in camera-type eye(GO:1902866) |
| 0.0 | 2.6 | GO:0007156 | homophilic cell adhesion via plasma membrane adhesion molecules(GO:0007156) |
| 0.0 | 1.0 | GO:0007032 | endosome organization(GO:0007032) |
| 0.0 | 0.1 | GO:0051415 | interphase microtubule nucleation by interphase microtubule organizing center(GO:0051415) microtubule nucleation by microtubule organizing center(GO:0051418) |
| 0.0 | 0.1 | GO:0016560 | protein import into peroxisome matrix, docking(GO:0016560) |
| 0.0 | 0.1 | GO:0006004 | fucose metabolic process(GO:0006004) |
| 0.0 | 0.1 | GO:0007217 | tachykinin receptor signaling pathway(GO:0007217) |
| 0.0 | 0.1 | GO:0070681 | glutaminyl-tRNAGln biosynthesis via transamidation(GO:0070681) |
| 0.0 | 0.4 | GO:1901998 | toxin transport(GO:1901998) |
| 0.0 | 0.1 | GO:0010265 | SCF complex assembly(GO:0010265) |
| 0.0 | 0.1 | GO:0000154 | rRNA modification(GO:0000154) |
| 0.0 | 0.1 | GO:0055009 | atrial cardiac muscle tissue development(GO:0003228) atrial cardiac muscle tissue morphogenesis(GO:0055009) |
| 0.0 | 0.2 | GO:0009304 | tRNA transcription(GO:0009304) |
| 0.0 | 0.1 | GO:0000255 | allantoin metabolic process(GO:0000255) |
| 0.0 | 0.0 | GO:0070315 | G1 to G0 transition involved in cell differentiation(GO:0070315) |
| 0.0 | 0.0 | GO:0061107 | seminal vesicle development(GO:0061107) |
| 0.0 | 0.1 | GO:0006686 | sphingomyelin biosynthetic process(GO:0006686) |
| 0.0 | 0.1 | GO:0020027 | hemoglobin metabolic process(GO:0020027) |
| 0.0 | 0.0 | GO:1990426 | homologous recombination-dependent replication fork processing(GO:1990426) |
| 0.0 | 0.3 | GO:0016254 | preassembly of GPI anchor in ER membrane(GO:0016254) |
| 0.0 | 0.2 | GO:0055070 | copper ion homeostasis(GO:0055070) |
| 0.0 | 0.1 | GO:0008063 | Toll signaling pathway(GO:0008063) |
| 0.0 | 0.2 | GO:0048305 | immunoglobulin secretion(GO:0048305) |
| 0.0 | 0.0 | GO:1904688 | regulation of cap-independent translational initiation(GO:1903677) positive regulation of cap-independent translational initiation(GO:1903679) regulation of cytoplasmic translational initiation(GO:1904688) positive regulation of cytoplasmic translational initiation(GO:1904690) |
| 0.0 | 0.2 | GO:0030201 | heparan sulfate proteoglycan metabolic process(GO:0030201) |
| 0.0 | 0.0 | GO:0070634 | transepithelial ammonium transport(GO:0070634) |
| 0.0 | 0.2 | GO:0043666 | regulation of phosphoprotein phosphatase activity(GO:0043666) |
| 0.0 | 0.1 | GO:0030961 | peptidyl-arginine hydroxylation(GO:0030961) |
| 0.0 | 0.1 | GO:0052695 | cellular glucuronidation(GO:0052695) |
| 0.0 | 0.4 | GO:0031018 | endocrine pancreas development(GO:0031018) |
| 0.0 | 0.1 | GO:0071557 | histone H3-K27 demethylation(GO:0071557) |
| 0.0 | 0.0 | GO:0070200 | establishment of protein localization to telomere(GO:0070200) |
| 0.0 | 0.2 | GO:0090004 | positive regulation of establishment of protein localization to plasma membrane(GO:0090004) |
| 0.0 | 0.2 | GO:0008356 | asymmetric cell division(GO:0008356) |
| 0.0 | 1.1 | GO:1903169 | regulation of calcium ion transmembrane transport(GO:1903169) |
| 0.0 | 0.0 | GO:1901529 | positive regulation of anion channel activity(GO:1901529) |
| 0.0 | 0.1 | GO:0045656 | negative regulation of monocyte differentiation(GO:0045656) |
| 0.0 | 0.0 | GO:1900244 | positive regulation of synaptic vesicle endocytosis(GO:1900244) positive regulation of synaptic vesicle transport(GO:1902805) positive regulation of synaptic vesicle recycling(GO:1903423) |
| 0.0 | 0.2 | GO:0000338 | protein deneddylation(GO:0000338) |
| 0.0 | 0.0 | GO:0016240 | autophagosome docking(GO:0016240) |
| 0.0 | 0.5 | GO:0042026 | protein refolding(GO:0042026) |
| 0.0 | 0.1 | GO:0051697 | protein delipidation(GO:0051697) |
| 0.0 | 0.0 | GO:0035552 | oxidative single-stranded DNA demethylation(GO:0035552) |
| 0.0 | 0.1 | GO:0090129 | positive regulation of synapse maturation(GO:0090129) |
| 0.0 | 0.0 | GO:0014067 | negative regulation of phosphatidylinositol 3-kinase signaling(GO:0014067) |
| 0.0 | 0.2 | GO:2000059 | negative regulation of protein ubiquitination involved in ubiquitin-dependent protein catabolic process(GO:2000059) |
| 0.0 | 0.0 | GO:0008628 | hormone-mediated apoptotic signaling pathway(GO:0008628) |
| 0.0 | 0.1 | GO:0045329 | carnitine biosynthetic process(GO:0045329) |
| 0.0 | 0.0 | GO:0032759 | TRAIL production(GO:0032639) regulation of TRAIL production(GO:0032679) positive regulation of TRAIL production(GO:0032759) TRAIL biosynthetic process(GO:0045553) regulation of TRAIL biosynthetic process(GO:0045554) positive regulation of TRAIL biosynthetic process(GO:0045556) |
| 0.0 | 0.1 | GO:0097026 | dendritic cell dendrite assembly(GO:0097026) |
| 0.0 | 0.2 | GO:0006450 | regulation of translational fidelity(GO:0006450) |
| 0.0 | 0.1 | GO:0019720 | Mo-molybdopterin cofactor biosynthetic process(GO:0006777) Mo-molybdopterin cofactor metabolic process(GO:0019720) |
| 0.0 | 0.1 | GO:1990001 | inhibition of cysteine-type endopeptidase activity involved in apoptotic process(GO:1990001) |
| 0.0 | 1.3 | GO:0070126 | mitochondrial translational termination(GO:0070126) |
| 0.0 | 0.2 | GO:0015812 | gamma-aminobutyric acid transport(GO:0015812) |
| 0.0 | 0.2 | GO:1902894 | negative regulation of pri-miRNA transcription from RNA polymerase II promoter(GO:1902894) |
| 0.0 | 0.0 | GO:0030423 | targeting of mRNA for destruction involved in RNA interference(GO:0030423) |
| 0.0 | 1.8 | GO:0050911 | detection of chemical stimulus involved in sensory perception of smell(GO:0050911) |
| 0.0 | 0.0 | GO:0002023 | reduction of food intake in response to dietary excess(GO:0002023) |
| 0.0 | 0.0 | GO:0005997 | xylulose metabolic process(GO:0005997) |
| 0.0 | 0.0 | GO:0034395 | regulation of transcription from RNA polymerase II promoter in response to iron(GO:0034395) |
| 0.0 | 0.1 | GO:0060836 | lymphatic endothelial cell differentiation(GO:0060836) |
| 0.0 | 0.1 | GO:0090026 | positive regulation of monocyte chemotaxis(GO:0090026) |
| 0.0 | 0.0 | GO:0032497 | detection of lipopolysaccharide(GO:0032497) |
| 0.0 | 0.1 | GO:0006069 | ethanol oxidation(GO:0006069) |
| 0.0 | 0.3 | GO:0048268 | clathrin coat assembly(GO:0048268) |
| 0.0 | 0.1 | GO:0030497 | fatty acid elongation(GO:0030497) |
| 0.0 | 0.0 | GO:0032877 | positive regulation of DNA endoreduplication(GO:0032877) |
| 0.0 | 0.2 | GO:0071353 | cellular response to interleukin-4(GO:0071353) |
Gene overrepresentation in cellular component category:
| Log-likelihood per target | Total log-likelihood | Term | Description |
|---|---|---|---|
| 3.3 | 32.5 | GO:0061689 | tricellular tight junction(GO:0061689) |
| 1.8 | 12.8 | GO:0097209 | epidermal lamellar body(GO:0097209) |
| 1.5 | 4.6 | GO:0032127 | dense core granule membrane(GO:0032127) |
| 1.5 | 19.8 | GO:0045179 | apical cortex(GO:0045179) |
| 1.3 | 8.0 | GO:0070695 | FHF complex(GO:0070695) |
| 1.0 | 3.9 | GO:0034685 | integrin alphav-beta6 complex(GO:0034685) |
| 0.8 | 21.3 | GO:0005922 | connexon complex(GO:0005922) |
| 0.8 | 26.0 | GO:0016327 | apicolateral plasma membrane(GO:0016327) |
| 0.7 | 5.1 | GO:0005610 | laminin-5 complex(GO:0005610) |
| 0.7 | 12.2 | GO:0016600 | flotillin complex(GO:0016600) |
| 0.7 | 2.9 | GO:1990851 | Wnt-Frizzled-LRP5/6 complex(GO:1990851) |
| 0.7 | 5.7 | GO:0035976 | AP1 complex(GO:0035976) |
| 0.7 | 20.9 | GO:0030057 | desmosome(GO:0030057) |
| 0.6 | 3.2 | GO:0043256 | laminin complex(GO:0043256) |
| 0.6 | 1.8 | GO:0036338 | viral envelope(GO:0019031) viral membrane(GO:0036338) |
| 0.5 | 2.6 | GO:1990796 | photoreceptor cell terminal bouton(GO:1990796) |
| 0.5 | 11.0 | GO:0005861 | troponin complex(GO:0005861) |
| 0.5 | 3.1 | GO:0030485 | smooth muscle contractile fiber(GO:0030485) |
| 0.5 | 0.5 | GO:0034750 | Scrib-APC-beta-catenin complex(GO:0034750) |
| 0.4 | 7.2 | GO:0035253 | ciliary rootlet(GO:0035253) |
| 0.4 | 2.1 | GO:1990031 | pinceau fiber(GO:1990031) |
| 0.4 | 1.6 | GO:1990357 | terminal web(GO:1990357) |
| 0.4 | 6.0 | GO:0033010 | paranodal junction(GO:0033010) |
| 0.4 | 3.6 | GO:0031313 | extrinsic component of endosome membrane(GO:0031313) |
| 0.4 | 5.0 | GO:0005915 | zonula adherens(GO:0005915) |
| 0.4 | 1.9 | GO:0032449 | CBM complex(GO:0032449) |
| 0.4 | 8.0 | GO:0030056 | hemidesmosome(GO:0030056) |
| 0.3 | 2.4 | GO:0034688 | integrin alphaM-beta2 complex(GO:0034688) |
| 0.3 | 1.4 | GO:0017109 | glutamate-cysteine ligase complex(GO:0017109) |
| 0.3 | 4.8 | GO:0016013 | syntrophin complex(GO:0016013) |
| 0.3 | 2.7 | GO:0097451 | glial limiting end-foot(GO:0097451) |
| 0.3 | 1.9 | GO:0097129 | cyclin D2-CDK4 complex(GO:0097129) |
| 0.3 | 0.3 | GO:0034667 | integrin alpha3-beta1 complex(GO:0034667) |
| 0.3 | 2.6 | GO:0033269 | internode region of axon(GO:0033269) |
| 0.3 | 7.8 | GO:0001533 | cornified envelope(GO:0001533) |
| 0.3 | 3.6 | GO:0036056 | filtration diaphragm(GO:0036056) slit diaphragm(GO:0036057) |
| 0.2 | 2.5 | GO:0030314 | junctional membrane complex(GO:0030314) |
| 0.2 | 6.3 | GO:0044295 | axonal growth cone(GO:0044295) |
| 0.2 | 0.5 | GO:0034686 | integrin alphav-beta8 complex(GO:0034686) |
| 0.2 | 1.4 | GO:0032010 | phagolysosome(GO:0032010) |
| 0.2 | 0.7 | GO:0000333 | telomerase catalytic core complex(GO:0000333) |
| 0.2 | 2.2 | GO:0044194 | cytolytic granule(GO:0044194) |
| 0.2 | 14.2 | GO:0033017 | sarcoplasmic reticulum membrane(GO:0033017) |
| 0.2 | 16.6 | GO:0045095 | keratin filament(GO:0045095) |
| 0.2 | 6.8 | GO:0034706 | sodium channel complex(GO:0034706) |
| 0.2 | 1.6 | GO:0098560 | cytoplasmic side of late endosome membrane(GO:0098560) |
| 0.2 | 3.0 | GO:0046581 | intercellular canaliculus(GO:0046581) |
| 0.2 | 15.7 | GO:0016328 | lateral plasma membrane(GO:0016328) |
| 0.2 | 0.6 | GO:0005600 | collagen type XIII trimer(GO:0005600) transmembrane collagen trimer(GO:0030936) |
| 0.2 | 9.3 | GO:0030673 | axolemma(GO:0030673) |
| 0.2 | 2.0 | GO:0097197 | tetraspanin-enriched microdomain(GO:0097197) |
| 0.2 | 0.4 | GO:1990622 | CHOP-ATF3 complex(GO:1990622) |
| 0.2 | 4.8 | GO:0031362 | anchored component of external side of plasma membrane(GO:0031362) |
| 0.2 | 0.9 | GO:0001405 | presequence translocase-associated import motor(GO:0001405) |
| 0.2 | 0.7 | GO:0045323 | interleukin-1 receptor complex(GO:0045323) |
| 0.2 | 0.5 | GO:0005900 | oncostatin-M receptor complex(GO:0005900) |
| 0.2 | 1.1 | GO:1990597 | AIP1-IRE1 complex(GO:1990597) |
| 0.2 | 3.2 | GO:0005865 | striated muscle thin filament(GO:0005865) |
| 0.2 | 0.6 | GO:0044307 | dendritic branch(GO:0044307) |
| 0.1 | 2.5 | GO:0000815 | ESCRT III complex(GO:0000815) |
| 0.1 | 0.6 | GO:0019815 | B cell receptor complex(GO:0019815) |
| 0.1 | 0.7 | GO:0071438 | invadopodium membrane(GO:0071438) |
| 0.1 | 0.4 | GO:0000939 | condensed chromosome inner kinetochore(GO:0000939) |
| 0.1 | 2.3 | GO:0031254 | uropod(GO:0001931) cell trailing edge(GO:0031254) |
| 0.1 | 0.4 | GO:0035354 | Toll-like receptor 1-Toll-like receptor 2 protein complex(GO:0035354) |
| 0.1 | 0.1 | GO:0034455 | t-UTP complex(GO:0034455) |
| 0.1 | 0.5 | GO:0005960 | glycine cleavage complex(GO:0005960) |
| 0.1 | 6.7 | GO:0001772 | immunological synapse(GO:0001772) |
| 0.1 | 0.5 | GO:0032937 | SREBP-SCAP-Insig complex(GO:0032937) |
| 0.1 | 1.7 | GO:0014731 | spectrin-associated cytoskeleton(GO:0014731) |
| 0.1 | 3.1 | GO:0031143 | pseudopodium(GO:0031143) |
| 0.1 | 0.5 | GO:0070826 | paraferritin complex(GO:0070826) |
| 0.1 | 0.1 | GO:1902710 | GABA receptor complex(GO:1902710) |
| 0.1 | 0.5 | GO:0036502 | Derlin-1-VIMP complex(GO:0036502) |
| 0.1 | 0.3 | GO:1990716 | axonemal central apparatus(GO:1990716) |
| 0.1 | 14.6 | GO:0070160 | occluding junction(GO:0070160) |
| 0.1 | 0.8 | GO:0072687 | meiotic spindle(GO:0072687) |
| 0.1 | 0.7 | GO:0070436 | Grb2-EGFR complex(GO:0070436) |
| 0.1 | 0.4 | GO:1990879 | CST complex(GO:1990879) |
| 0.1 | 0.4 | GO:0000839 | Hrd1p ubiquitin ligase ERAD-L complex(GO:0000839) |
| 0.1 | 1.0 | GO:0035692 | macrophage migration inhibitory factor receptor complex(GO:0035692) |
| 0.1 | 0.9 | GO:0031390 | Ctf18 RFC-like complex(GO:0031390) |
| 0.1 | 7.0 | GO:0005771 | multivesicular body(GO:0005771) |
| 0.1 | 0.8 | GO:0012510 | trans-Golgi network transport vesicle membrane(GO:0012510) |
| 0.1 | 8.7 | GO:0030134 | ER to Golgi transport vesicle(GO:0030134) |
| 0.1 | 0.4 | GO:0034666 | integrin alpha2-beta1 complex(GO:0034666) |
| 0.1 | 1.2 | GO:0030877 | beta-catenin destruction complex(GO:0030877) |
| 0.1 | 1.1 | GO:0005818 | astral microtubule(GO:0000235) aster(GO:0005818) |
| 0.1 | 1.8 | GO:0044613 | nuclear pore central transport channel(GO:0044613) |
| 0.1 | 0.3 | GO:0002139 | stereocilia coupling link(GO:0002139) |
| 0.1 | 1.4 | GO:0032039 | integrator complex(GO:0032039) |
| 0.1 | 0.4 | GO:0031074 | nucleocytoplasmic shuttling complex(GO:0031074) |
| 0.1 | 0.7 | GO:0002169 | 3-methylcrotonyl-CoA carboxylase complex, mitochondrial(GO:0002169) methylcrotonoyl-CoA carboxylase complex(GO:1905202) |
| 0.1 | 0.6 | GO:1990452 | Parkin-FBXW7-Cul1 ubiquitin ligase complex(GO:1990452) |
| 0.1 | 2.6 | GO:0051233 | spindle midzone(GO:0051233) |
| 0.1 | 8.2 | GO:0005913 | cell-cell adherens junction(GO:0005913) |
| 0.1 | 23.9 | GO:0016323 | basolateral plasma membrane(GO:0016323) |
| 0.1 | 0.5 | GO:0005658 | alpha DNA polymerase:primase complex(GO:0005658) |
| 0.1 | 0.6 | GO:0005827 | polar microtubule(GO:0005827) |
| 0.1 | 0.2 | GO:1902737 | dendritic filopodium(GO:1902737) |
| 0.1 | 8.0 | GO:0070821 | tertiary granule membrane(GO:0070821) |
| 0.1 | 0.3 | GO:0097425 | smooth endoplasmic reticulum membrane(GO:0030868) smooth endoplasmic reticulum part(GO:0097425) |
| 0.1 | 1.1 | GO:0032426 | stereocilium tip(GO:0032426) |
| 0.1 | 1.3 | GO:0042101 | T cell receptor complex(GO:0042101) |
| 0.1 | 0.6 | GO:0042406 | extrinsic component of endoplasmic reticulum membrane(GO:0042406) |
| 0.1 | 2.0 | GO:0005892 | acetylcholine-gated channel complex(GO:0005892) |
| 0.1 | 2.2 | GO:0031231 | integral component of peroxisomal membrane(GO:0005779) intrinsic component of peroxisomal membrane(GO:0031231) |
| 0.1 | 0.2 | GO:0008623 | CHRAC(GO:0008623) |
| 0.1 | 0.9 | GO:0033256 | I-kappaB/NF-kappaB complex(GO:0033256) |
| 0.1 | 0.7 | GO:0071439 | clathrin complex(GO:0071439) |
| 0.1 | 0.4 | GO:0000214 | tRNA-intron endonuclease complex(GO:0000214) |
| 0.1 | 0.2 | GO:0043159 | acrosomal matrix(GO:0043159) |
| 0.1 | 0.7 | GO:0072559 | NLRP3 inflammasome complex(GO:0072559) |
| 0.1 | 0.6 | GO:0005577 | fibrinogen complex(GO:0005577) |
| 0.1 | 0.2 | GO:0048237 | rough endoplasmic reticulum lumen(GO:0048237) |
| 0.1 | 0.4 | GO:0032021 | NELF complex(GO:0032021) |
| 0.1 | 3.5 | GO:0030131 | clathrin adaptor complex(GO:0030131) |
| 0.1 | 0.2 | GO:0032437 | cuticular plate(GO:0032437) |
| 0.1 | 0.4 | GO:0042825 | TAP complex(GO:0042825) |
| 0.1 | 5.9 | GO:0032580 | Golgi cisterna membrane(GO:0032580) |
| 0.1 | 0.1 | GO:0072558 | NLRP1 inflammasome complex(GO:0072558) |
| 0.1 | 0.2 | GO:0098574 | cytoplasmic side of lysosomal membrane(GO:0098574) |
| 0.1 | 0.5 | GO:1903440 | calcitonin family receptor complex(GO:1903439) amylin receptor complex(GO:1903440) |
| 0.1 | 4.0 | GO:0030670 | phagocytic vesicle membrane(GO:0030670) |
| 0.1 | 0.2 | GO:0036398 | TCR signalosome(GO:0036398) |
| 0.1 | 0.6 | GO:0071541 | eukaryotic translation initiation factor 3 complex, eIF3m(GO:0071541) |
| 0.1 | 0.7 | GO:0060091 | kinocilium(GO:0060091) |
| 0.1 | 4.5 | GO:0031463 | Cul3-RING ubiquitin ligase complex(GO:0031463) |
| 0.1 | 0.2 | GO:0072536 | interleukin-23 receptor complex(GO:0072536) |
| 0.1 | 0.2 | GO:0005968 | Rab-protein geranylgeranyltransferase complex(GO:0005968) |
| 0.1 | 0.2 | GO:0000799 | nuclear condensin complex(GO:0000799) |
| 0.1 | 1.1 | GO:0045277 | respiratory chain complex IV(GO:0045277) |
| 0.1 | 0.3 | GO:0032807 | DNA ligase IV complex(GO:0032807) |
| 0.1 | 0.1 | GO:1990723 | cytoplasmic periphery of the nuclear pore complex(GO:1990723) |
| 0.1 | 0.7 | GO:0072546 | ER membrane protein complex(GO:0072546) |
| 0.1 | 0.5 | GO:0042788 | polysomal ribosome(GO:0042788) |
| 0.1 | 1.0 | GO:0005605 | basal lamina(GO:0005605) |
| 0.1 | 0.3 | GO:0032541 | cortical endoplasmic reticulum(GO:0032541) |
| 0.0 | 0.1 | GO:0005674 | transcription factor TFIIF complex(GO:0005674) |
| 0.0 | 1.3 | GO:0005639 | integral component of nuclear inner membrane(GO:0005639) intrinsic component of nuclear inner membrane(GO:0031229) |
| 0.0 | 0.3 | GO:0033503 | HULC complex(GO:0033503) |
| 0.0 | 0.2 | GO:0035339 | SPOTS complex(GO:0035339) |
| 0.0 | 0.9 | GO:0005736 | DNA-directed RNA polymerase I complex(GO:0005736) |
| 0.0 | 9.0 | GO:0001650 | fibrillar center(GO:0001650) |
| 0.0 | 0.2 | GO:0071595 | Nem1-Spo7 phosphatase complex(GO:0071595) |
| 0.0 | 0.6 | GO:0005666 | DNA-directed RNA polymerase III complex(GO:0005666) |
| 0.0 | 0.6 | GO:0000176 | nuclear exosome (RNase complex)(GO:0000176) |
| 0.0 | 0.1 | GO:1990075 | periciliary membrane compartment(GO:1990075) |
| 0.0 | 0.2 | GO:0005713 | recombination nodule(GO:0005713) |
| 0.0 | 0.1 | GO:0071817 | MMXD complex(GO:0071817) |
| 0.0 | 0.3 | GO:0034663 | endoplasmic reticulum chaperone complex(GO:0034663) |
| 0.0 | 0.4 | GO:0034464 | BBSome(GO:0034464) |
| 0.0 | 0.3 | GO:0005642 | annulate lamellae(GO:0005642) |
| 0.0 | 2.7 | GO:0015030 | Cajal body(GO:0015030) |
| 0.0 | 0.2 | GO:0031838 | haptoglobin-hemoglobin complex(GO:0031838) |
| 0.0 | 0.3 | GO:1990635 | proximal dendrite(GO:1990635) |
| 0.0 | 0.5 | GO:0031528 | microvillus membrane(GO:0031528) |
| 0.0 | 3.6 | GO:0034707 | chloride channel complex(GO:0034707) |
| 0.0 | 0.2 | GO:0005602 | complement component C1 complex(GO:0005602) |
| 0.0 | 0.2 | GO:0033263 | CORVET complex(GO:0033263) |
| 0.0 | 0.2 | GO:0000801 | central element(GO:0000801) |
| 0.0 | 0.1 | GO:0016938 | kinesin I complex(GO:0016938) |
| 0.0 | 0.5 | GO:0005845 | mRNA cap binding complex(GO:0005845) |
| 0.0 | 0.3 | GO:0042721 | mitochondrial inner membrane protein insertion complex(GO:0042721) |
| 0.0 | 0.1 | GO:0044611 | nuclear pore inner ring(GO:0044611) |
| 0.0 | 0.5 | GO:0001673 | male germ cell nucleus(GO:0001673) |
| 0.0 | 0.5 | GO:0016281 | eukaryotic translation initiation factor 4F complex(GO:0016281) |
| 0.0 | 0.1 | GO:0070701 | mucus layer(GO:0070701) |
| 0.0 | 0.4 | GO:0000506 | glycosylphosphatidylinositol-N-acetylglucosaminyltransferase (GPI-GnT) complex(GO:0000506) |
| 0.0 | 0.6 | GO:0098576 | lumenal side of membrane(GO:0098576) |
| 0.0 | 0.7 | GO:0042622 | photoreceptor outer segment membrane(GO:0042622) |
| 0.0 | 0.3 | GO:1990712 | HFE-transferrin receptor complex(GO:1990712) |
| 0.0 | 0.3 | GO:0030061 | mitochondrial crista(GO:0030061) |
| 0.0 | 0.1 | GO:1990909 | Wnt signalosome(GO:1990909) |
| 0.0 | 0.1 | GO:0030895 | apolipoprotein B mRNA editing enzyme complex(GO:0030895) |
| 0.0 | 0.1 | GO:0030678 | mitochondrial ribonuclease P complex(GO:0030678) |
| 0.0 | 0.3 | GO:0005744 | mitochondrial inner membrane presequence translocase complex(GO:0005744) |
| 0.0 | 0.2 | GO:0009331 | glycerol-3-phosphate dehydrogenase complex(GO:0009331) |
| 0.0 | 4.0 | GO:0035578 | azurophil granule lumen(GO:0035578) |
| 0.0 | 4.2 | GO:0048770 | melanosome(GO:0042470) pigment granule(GO:0048770) |
| 0.0 | 0.1 | GO:0036195 | muscle cell projection(GO:0036194) muscle cell projection membrane(GO:0036195) |
| 0.0 | 0.1 | GO:0032279 | asymmetric synapse(GO:0032279) |
| 0.0 | 0.3 | GO:0031095 | platelet dense tubular network membrane(GO:0031095) |
| 0.0 | 0.0 | GO:0071159 | NF-kappaB complex(GO:0071159) |
| 0.0 | 0.1 | GO:0036156 | inner dynein arm(GO:0036156) |
| 0.0 | 0.2 | GO:0008282 | ATP-sensitive potassium channel complex(GO:0008282) |
| 0.0 | 0.1 | GO:0032593 | insulin-responsive compartment(GO:0032593) |
| 0.0 | 0.1 | GO:0042720 | mitochondrial inner membrane peptidase complex(GO:0042720) |
| 0.0 | 0.1 | GO:0042272 | nuclear RNA export factor complex(GO:0042272) |
| 0.0 | 0.3 | GO:0070449 | elongin complex(GO:0070449) |
| 0.0 | 0.1 | GO:0000942 | condensed nuclear chromosome outer kinetochore(GO:0000942) |
| 0.0 | 0.2 | GO:0061700 | GATOR2 complex(GO:0061700) |
| 0.0 | 0.2 | GO:0098536 | deuterosome(GO:0098536) |
| 0.0 | 0.1 | GO:0002189 | ribose phosphate diphosphokinase complex(GO:0002189) |
| 0.0 | 0.4 | GO:0005952 | cAMP-dependent protein kinase complex(GO:0005952) |
| 0.0 | 3.9 | GO:0005911 | cell-cell junction(GO:0005911) |
| 0.0 | 0.1 | GO:0035841 | new growing cell tip(GO:0035841) |
| 0.0 | 2.0 | GO:0001750 | photoreceptor outer segment(GO:0001750) |
| 0.0 | 0.2 | GO:0045252 | oxoglutarate dehydrogenase complex(GO:0045252) |
| 0.0 | 0.1 | GO:0005945 | 6-phosphofructokinase complex(GO:0005945) |
| 0.0 | 0.2 | GO:0097550 | transcriptional preinitiation complex(GO:0097550) |
| 0.0 | 0.2 | GO:0019907 | cyclin-dependent protein kinase activating kinase holoenzyme complex(GO:0019907) |
| 0.0 | 0.1 | GO:0038038 | G-protein coupled receptor homodimeric complex(GO:0038038) |
| 0.0 | 0.2 | GO:0005921 | gap junction(GO:0005921) |
| 0.0 | 0.0 | GO:0033093 | Weibel-Palade body(GO:0033093) |
| 0.0 | 0.3 | GO:0030015 | CCR4-NOT core complex(GO:0030015) |
| 0.0 | 0.2 | GO:0097524 | sperm plasma membrane(GO:0097524) |
| 0.0 | 0.1 | GO:0034715 | pICln-Sm protein complex(GO:0034715) |
| 0.0 | 0.0 | GO:0030125 | clathrin vesicle coat(GO:0030125) |
| 0.0 | 1.2 | GO:0009295 | nucleoid(GO:0009295) mitochondrial nucleoid(GO:0042645) |
| 0.0 | 1.0 | GO:0030173 | integral component of Golgi membrane(GO:0030173) |
| 0.0 | 0.3 | GO:0005677 | chromatin silencing complex(GO:0005677) |
| 0.0 | 6.1 | GO:0009897 | external side of plasma membrane(GO:0009897) |
| 0.0 | 0.9 | GO:0030315 | T-tubule(GO:0030315) |
| 0.0 | 0.3 | GO:0031080 | nuclear pore outer ring(GO:0031080) |
| 0.0 | 0.2 | GO:0000938 | GARP complex(GO:0000938) |
| 0.0 | 0.5 | GO:0031932 | TORC2 complex(GO:0031932) |
| 0.0 | 0.7 | GO:0000314 | organellar small ribosomal subunit(GO:0000314) mitochondrial small ribosomal subunit(GO:0005763) |
| 0.0 | 0.8 | GO:0000791 | euchromatin(GO:0000791) |
| 0.0 | 0.3 | GO:0031414 | N-terminal protein acetyltransferase complex(GO:0031414) |
| 0.0 | 0.9 | GO:0016592 | mediator complex(GO:0016592) |
| 0.0 | 0.1 | GO:0048476 | Holliday junction resolvase complex(GO:0048476) |
| 0.0 | 0.1 | GO:1990393 | 3M complex(GO:1990393) |
| 0.0 | 0.4 | GO:0000800 | lateral element(GO:0000800) |
| 0.0 | 1.0 | GO:0005801 | cis-Golgi network(GO:0005801) |
| 0.0 | 0.1 | GO:0001534 | radial spoke(GO:0001534) |
| 0.0 | 2.4 | GO:0032587 | ruffle membrane(GO:0032587) |
| 0.0 | 0.0 | GO:0031523 | Myb complex(GO:0031523) |
| 0.0 | 0.1 | GO:0071149 | TEAD-2-YAP complex(GO:0071149) |
| 0.0 | 0.3 | GO:0071004 | U2-type prespliceosome(GO:0071004) |
| 0.0 | 0.1 | GO:0008024 | cyclin/CDK positive transcription elongation factor complex(GO:0008024) |
| 0.0 | 0.1 | GO:0044224 | juxtaparanode region of axon(GO:0044224) |
| 0.0 | 0.1 | GO:0030956 | glutamyl-tRNA(Gln) amidotransferase complex(GO:0030956) |
| 0.0 | 0.1 | GO:0035867 | alphav-beta3 integrin-IGF-1-IGF1R complex(GO:0035867) |
| 0.0 | 1.4 | GO:0005903 | brush border(GO:0005903) |
| 0.0 | 0.0 | GO:0097679 | other organism cytoplasm(GO:0097679) |
| 0.0 | 0.1 | GO:0035032 | phosphatidylinositol 3-kinase complex, class III(GO:0035032) |
| 0.0 | 0.1 | GO:0043527 | tRNA methyltransferase complex(GO:0043527) |
| 0.0 | 0.6 | GO:0016514 | SWI/SNF complex(GO:0016514) |
| 0.0 | 0.5 | GO:0005682 | U5 snRNP(GO:0005682) |
| 0.0 | 0.1 | GO:0000811 | GINS complex(GO:0000811) |
| 0.0 | 0.0 | GO:0070876 | SOSS complex(GO:0070876) |
| 0.0 | 0.1 | GO:0000127 | transcription factor TFIIIC complex(GO:0000127) |
| 0.0 | 0.1 | GO:1990316 | ATG1/ULK1 kinase complex(GO:1990316) |
| 0.0 | 0.3 | GO:0031904 | endosome lumen(GO:0031904) |
| 0.0 | 0.1 | GO:0031228 | intrinsic component of Golgi membrane(GO:0031228) |
| 0.0 | 0.2 | GO:0005852 | eukaryotic translation initiation factor 3 complex(GO:0005852) |
| 0.0 | 0.1 | GO:0097255 | R2TP complex(GO:0097255) |
| 0.0 | 0.0 | GO:0005826 | actomyosin contractile ring(GO:0005826) |
| 0.0 | 0.1 | GO:0005672 | transcription factor TFIIA complex(GO:0005672) |
| 0.0 | 0.1 | GO:0061617 | MICOS complex(GO:0061617) |
| 0.0 | 0.0 | GO:0044609 | DBIRD complex(GO:0044609) |
| 0.0 | 0.1 | GO:0005967 | mitochondrial pyruvate dehydrogenase complex(GO:0005967) |
| 0.0 | 0.1 | GO:0034709 | methylosome(GO:0034709) |
| 0.0 | 0.1 | GO:0000172 | ribonuclease MRP complex(GO:0000172) |
| 0.0 | 0.1 | GO:0032389 | MutLalpha complex(GO:0032389) |
| 0.0 | 0.1 | GO:0005787 | signal peptidase complex(GO:0005787) |
Gene overrepresentation in molecular function category:
| Log-likelihood per target | Total log-likelihood | Term | Description |
|---|---|---|---|
| 1.6 | 12.8 | GO:0086083 | cell adhesive protein binding involved in bundle of His cell-Purkinje myocyte communication(GO:0086083) |
| 1.3 | 4.0 | GO:1902271 | D3 vitamins binding(GO:1902271) |
| 1.2 | 3.6 | GO:0004605 | phosphatidate cytidylyltransferase activity(GO:0004605) |
| 1.1 | 13.5 | GO:0038132 | neuregulin binding(GO:0038132) |
| 1.0 | 2.9 | GO:1904928 | coreceptor activity involved in canonical Wnt signaling pathway(GO:1904928) |
| 0.9 | 2.6 | GO:0008859 | exoribonuclease II activity(GO:0008859) |
| 0.9 | 5.1 | GO:0042392 | sphingosine-1-phosphate phosphatase activity(GO:0042392) |
| 0.8 | 2.4 | GO:0003845 | 11-beta-hydroxysteroid dehydrogenase [NAD(P)] activity(GO:0003845) |
| 0.8 | 3.1 | GO:0015111 | iodide transmembrane transporter activity(GO:0015111) |
| 0.8 | 10.6 | GO:0031014 | troponin T binding(GO:0031014) |
| 0.7 | 3.4 | GO:0019834 | phospholipase A2 inhibitor activity(GO:0019834) |
| 0.7 | 2.7 | GO:0008515 | sucrose:proton symporter activity(GO:0008506) sucrose transmembrane transporter activity(GO:0008515) disaccharide transmembrane transporter activity(GO:0015154) oligosaccharide transmembrane transporter activity(GO:0015157) |
| 0.7 | 3.9 | GO:0038062 | protein tyrosine kinase collagen receptor activity(GO:0038062) |
| 0.6 | 8.2 | GO:0017034 | Rap guanyl-nucleotide exchange factor activity(GO:0017034) |
| 0.6 | 1.8 | GO:0005055 | laminin receptor activity(GO:0005055) |
| 0.6 | 3.1 | GO:0034040 | lipid-transporting ATPase activity(GO:0034040) |
| 0.6 | 9.8 | GO:0019911 | structural constituent of myelin sheath(GO:0019911) |
| 0.6 | 2.8 | GO:0050473 | arachidonate 15-lipoxygenase activity(GO:0050473) |
| 0.6 | 9.9 | GO:0005176 | ErbB-2 class receptor binding(GO:0005176) |
| 0.5 | 1.6 | GO:0004008 | copper-exporting ATPase activity(GO:0004008) copper-transporting ATPase activity(GO:0043682) |
| 0.5 | 14.9 | GO:0098641 | cadherin binding involved in cell-cell adhesion(GO:0098641) |
| 0.5 | 5.5 | GO:0102336 | fatty acid elongase activity(GO:0009922) 3-oxo-arachidoyl-CoA synthase activity(GO:0102336) 3-oxo-cerotoyl-CoA synthase activity(GO:0102337) 3-oxo-lignoceronyl-CoA synthase activity(GO:0102338) |
| 0.5 | 4.3 | GO:0015220 | choline transmembrane transporter activity(GO:0015220) |
| 0.5 | 4.2 | GO:0035252 | UDP-xylosyltransferase activity(GO:0035252) xylosyltransferase activity(GO:0042285) |
| 0.5 | 1.4 | GO:0004566 | beta-glucuronidase activity(GO:0004566) |
| 0.5 | 2.8 | GO:0003835 | beta-galactoside alpha-2,6-sialyltransferase activity(GO:0003835) |
| 0.4 | 3.1 | GO:0016416 | O-palmitoyltransferase activity(GO:0016416) |
| 0.4 | 2.2 | GO:0004706 | JUN kinase kinase kinase activity(GO:0004706) |
| 0.4 | 8.9 | GO:0005243 | gap junction channel activity(GO:0005243) |
| 0.4 | 10.1 | GO:0043560 | insulin receptor substrate binding(GO:0043560) |
| 0.4 | 5.9 | GO:0004865 | protein serine/threonine phosphatase inhibitor activity(GO:0004865) |
| 0.4 | 1.3 | GO:0052810 | 1-phosphatidylinositol-5-kinase activity(GO:0052810) |
| 0.4 | 1.7 | GO:0050252 | retinol O-fatty-acyltransferase activity(GO:0050252) |
| 0.4 | 11.6 | GO:0032794 | GTPase activating protein binding(GO:0032794) |
| 0.4 | 7.5 | GO:0019215 | intermediate filament binding(GO:0019215) |
| 0.4 | 3.1 | GO:0015349 | thyroid hormone transmembrane transporter activity(GO:0015349) |
| 0.4 | 1.1 | GO:0005150 | interleukin-1, Type I receptor binding(GO:0005150) |
| 0.4 | 2.5 | GO:0008467 | [heparan sulfate]-glucosamine 3-sulfotransferase 1 activity(GO:0008467) |
| 0.3 | 1.0 | GO:0004699 | calcium-independent protein kinase C activity(GO:0004699) |
| 0.3 | 1.0 | GO:0003858 | 3-hydroxybutyrate dehydrogenase activity(GO:0003858) |
| 0.3 | 2.1 | GO:0031735 | CCR10 chemokine receptor binding(GO:0031735) |
| 0.3 | 1.4 | GO:0003978 | UDP-N-acetylglucosamine 4-epimerase activity(GO:0003974) UDP-glucose 4-epimerase activity(GO:0003978) |
| 0.3 | 1.4 | GO:0004357 | glutamate-cysteine ligase activity(GO:0004357) |
| 0.3 | 1.0 | GO:0061629 | RNA polymerase II sequence-specific DNA binding transcription factor binding(GO:0061629) |
| 0.3 | 1.3 | GO:0033829 | O-fucosylpeptide 3-beta-N-acetylglucosaminyltransferase activity(GO:0033829) |
| 0.3 | 2.2 | GO:0004465 | lipoprotein lipase activity(GO:0004465) |
| 0.3 | 2.1 | GO:0070891 | lipoteichoic acid binding(GO:0070891) |
| 0.3 | 2.6 | GO:0086006 | voltage-gated sodium channel activity involved in cardiac muscle cell action potential(GO:0086006) |
| 0.3 | 0.6 | GO:0090422 | thiamine pyrophosphate transporter activity(GO:0090422) |
| 0.3 | 0.9 | GO:0004052 | arachidonate 12-lipoxygenase activity(GO:0004052) |
| 0.3 | 0.6 | GO:0010465 | nerve growth factor receptor activity(GO:0010465) |
| 0.3 | 3.4 | GO:0004767 | sphingomyelin phosphodiesterase activity(GO:0004767) |
| 0.3 | 1.1 | GO:0004419 | hydroxymethylglutaryl-CoA lyase activity(GO:0004419) |
| 0.3 | 2.1 | GO:0052834 | inositol monophosphate 1-phosphatase activity(GO:0008934) inositol monophosphate 3-phosphatase activity(GO:0052832) inositol monophosphate 4-phosphatase activity(GO:0052833) inositol monophosphate phosphatase activity(GO:0052834) |
| 0.3 | 1.3 | GO:0004910 | interleukin-1, Type II, blocking receptor activity(GO:0004910) |
| 0.3 | 4.8 | GO:0019871 | sodium channel inhibitor activity(GO:0019871) |
| 0.3 | 2.5 | GO:0043533 | inositol 1,3,4,5 tetrakisphosphate binding(GO:0043533) |
| 0.2 | 1.2 | GO:0015119 | hexose phosphate transmembrane transporter activity(GO:0015119) organophosphate:inorganic phosphate antiporter activity(GO:0015315) hexose-phosphate:inorganic phosphate antiporter activity(GO:0015526) glucose 6-phosphate:inorganic phosphate antiporter activity(GO:0061513) |
| 0.2 | 2.2 | GO:0070097 | delta-catenin binding(GO:0070097) |
| 0.2 | 1.4 | GO:0050294 | steroid sulfotransferase activity(GO:0050294) |
| 0.2 | 5.9 | GO:0038191 | neuropilin binding(GO:0038191) |
| 0.2 | 1.6 | GO:0035662 | Toll-like receptor 4 binding(GO:0035662) |
| 0.2 | 0.7 | GO:0097604 | temperature-gated cation channel activity(GO:0097604) |
| 0.2 | 3.2 | GO:0052650 | NADP-retinol dehydrogenase activity(GO:0052650) |
| 0.2 | 0.9 | GO:0032450 | maltose alpha-glucosidase activity(GO:0032450) |
| 0.2 | 2.1 | GO:0030369 | ICAM-3 receptor activity(GO:0030369) |
| 0.2 | 1.4 | GO:0047696 | beta-adrenergic receptor kinase activity(GO:0047696) |
| 0.2 | 0.7 | GO:0015389 | pyrimidine- and adenine-specific:sodium symporter activity(GO:0015389) |
| 0.2 | 0.9 | GO:0045569 | TRAIL binding(GO:0045569) |
| 0.2 | 2.2 | GO:0004064 | arylesterase activity(GO:0004064) |
| 0.2 | 1.3 | GO:0016314 | phosphatidylinositol-3,4,5-trisphosphate 3-phosphatase activity(GO:0016314) |
| 0.2 | 1.1 | GO:0050436 | microfibril binding(GO:0050436) |
| 0.2 | 0.9 | GO:0004948 | calcitonin receptor activity(GO:0004948) |
| 0.2 | 5.9 | GO:0005095 | GTPase inhibitor activity(GO:0005095) |
| 0.2 | 3.6 | GO:0001161 | intronic transcription regulatory region sequence-specific DNA binding(GO:0001161) intronic transcription regulatory region DNA binding(GO:0044213) |
| 0.2 | 3.2 | GO:0001730 | 2'-5'-oligoadenylate synthetase activity(GO:0001730) |
| 0.2 | 3.4 | GO:0015280 | ligand-gated sodium channel activity(GO:0015280) |
| 0.2 | 1.2 | GO:0004522 | ribonuclease A activity(GO:0004522) |
| 0.2 | 2.3 | GO:0005005 | transmembrane-ephrin receptor activity(GO:0005005) |
| 0.2 | 0.8 | GO:0047192 | 1-alkylglycerophosphocholine O-acetyltransferase activity(GO:0047192) |
| 0.2 | 5.5 | GO:0005229 | intracellular calcium activated chloride channel activity(GO:0005229) |
| 0.2 | 0.8 | GO:0004040 | amidase activity(GO:0004040) |
| 0.2 | 0.4 | GO:0051120 | hepoxilin A3 synthase activity(GO:0051120) |
| 0.2 | 0.6 | GO:0005174 | CD40 receptor binding(GO:0005174) |
| 0.2 | 0.6 | GO:0017116 | single-stranded DNA-dependent ATP-dependent DNA helicase activity(GO:0017116) |
| 0.2 | 1.0 | GO:0071253 | connexin binding(GO:0071253) |
| 0.2 | 1.5 | GO:0004351 | glutamate decarboxylase activity(GO:0004351) |
| 0.2 | 2.3 | GO:0015143 | urate transmembrane transporter activity(GO:0015143) salt transmembrane transporter activity(GO:1901702) |
| 0.2 | 0.6 | GO:0047025 | 3-oxoacyl-[acyl-carrier-protein] reductase (NADH) activity(GO:0047025) |
| 0.2 | 0.9 | GO:0004447 | iodide peroxidase activity(GO:0004447) |
| 0.2 | 0.2 | GO:0008988 | rRNA (adenine-N6-)-methyltransferase activity(GO:0008988) |
| 0.2 | 5.7 | GO:0005337 | nucleoside transmembrane transporter activity(GO:0005337) |
| 0.2 | 1.3 | GO:0019534 | toxin transporter activity(GO:0019534) |
| 0.2 | 5.6 | GO:0005035 | tumor necrosis factor-activated receptor activity(GO:0005031) death receptor activity(GO:0005035) |
| 0.2 | 1.3 | GO:0004111 | creatine kinase activity(GO:0004111) |
| 0.2 | 3.2 | GO:0008417 | fucosyltransferase activity(GO:0008417) |
| 0.2 | 0.9 | GO:0004809 | tRNA (guanine-N2-)-methyltransferase activity(GO:0004809) |
| 0.2 | 10.1 | GO:0005154 | epidermal growth factor receptor binding(GO:0005154) |
| 0.2 | 7.5 | GO:0008157 | protein phosphatase 1 binding(GO:0008157) |
| 0.2 | 0.7 | GO:0097603 | temperature-gated ion channel activity(GO:0097603) |
| 0.2 | 0.3 | GO:0051033 | nucleic acid transmembrane transporter activity(GO:0051032) RNA transmembrane transporter activity(GO:0051033) |
| 0.2 | 0.3 | GO:0004530 | deoxyribonuclease I activity(GO:0004530) |
| 0.2 | 0.7 | GO:0090599 | alpha-glucosidase activity(GO:0090599) |
| 0.2 | 0.5 | GO:0031687 | A2A adenosine receptor binding(GO:0031687) |
| 0.2 | 0.7 | GO:0030172 | troponin C binding(GO:0030172) |
| 0.2 | 1.2 | GO:0009019 | tRNA (guanine-N1-)-methyltransferase activity(GO:0009019) |
| 0.2 | 1.8 | GO:0016595 | glutamate binding(GO:0016595) |
| 0.2 | 7.1 | GO:0043014 | alpha-tubulin binding(GO:0043014) |
| 0.2 | 0.5 | GO:0016503 | pheromone receptor activity(GO:0016503) |
| 0.2 | 0.8 | GO:0000179 | rRNA (adenine-N6,N6-)-dimethyltransferase activity(GO:0000179) |
| 0.2 | 0.8 | GO:0015319 | sodium:inorganic phosphate symporter activity(GO:0015319) |
| 0.2 | 0.5 | GO:0004766 | spermidine synthase activity(GO:0004766) |
| 0.2 | 0.5 | GO:0000994 | RNA polymerase III core binding(GO:0000994) |
| 0.2 | 0.6 | GO:0017159 | pantetheine hydrolase activity(GO:0017159) |
| 0.2 | 0.8 | GO:0047273 | galactosylgalactosylglucosylceramide beta-D-acetylgalactosaminyltransferase activity(GO:0047273) |
| 0.2 | 2.0 | GO:0051011 | microtubule minus-end binding(GO:0051011) |
| 0.2 | 6.9 | GO:0000146 | microfilament motor activity(GO:0000146) |
| 0.2 | 0.5 | GO:0015234 | thiamine transmembrane transporter activity(GO:0015234) thiamine uptake transmembrane transporter activity(GO:0015403) |
| 0.2 | 0.6 | GO:0016524 | latrotoxin receptor activity(GO:0016524) |
| 0.2 | 0.5 | GO:0097258 | tocopherol omega-hydroxylase activity(GO:0052870) alpha-tocopherol omega-hydroxylase activity(GO:0052871) 20-hydroxy-leukotriene B4 omega oxidase activity(GO:0097258) 20-aldehyde-leukotriene B4 20-monooxygenase activity(GO:0097259) |
| 0.2 | 3.2 | GO:0008510 | sodium:bicarbonate symporter activity(GO:0008510) |
| 0.2 | 3.5 | GO:0042813 | Wnt-activated receptor activity(GO:0042813) |
| 0.2 | 6.1 | GO:0030676 | Rac guanyl-nucleotide exchange factor activity(GO:0030676) |
| 0.1 | 3.4 | GO:0001608 | G-protein coupled nucleotide receptor activity(GO:0001608) G-protein coupled purinergic nucleotide receptor activity(GO:0045028) |
| 0.1 | 1.0 | GO:0001517 | N-acetylglucosamine 6-O-sulfotransferase activity(GO:0001517) |
| 0.1 | 0.7 | GO:0046899 | nucleoside triphosphate adenylate kinase activity(GO:0046899) |
| 0.1 | 0.6 | GO:0046624 | sphingolipid transporter activity(GO:0046624) |
| 0.1 | 0.4 | GO:0001851 | complement component C3b binding(GO:0001851) |
| 0.1 | 1.3 | GO:0047623 | AMP deaminase activity(GO:0003876) adenosine-phosphate deaminase activity(GO:0047623) |
| 0.1 | 0.4 | GO:0050692 | DBD domain binding(GO:0050692) |
| 0.1 | 6.7 | GO:0017080 | sodium channel regulator activity(GO:0017080) |
| 0.1 | 0.9 | GO:0034186 | apolipoprotein A-I binding(GO:0034186) |
| 0.1 | 0.4 | GO:0008401 | retinoic acid 4-hydroxylase activity(GO:0008401) |
| 0.1 | 0.4 | GO:0004711 | ribosomal protein S6 kinase activity(GO:0004711) |
| 0.1 | 0.4 | GO:0005136 | interleukin-4 receptor binding(GO:0005136) |
| 0.1 | 1.8 | GO:0046625 | sphingolipid binding(GO:0046625) |
| 0.1 | 19.7 | GO:0004867 | serine-type endopeptidase inhibitor activity(GO:0004867) |
| 0.1 | 0.4 | GO:0004939 | beta-adrenergic receptor activity(GO:0004939) |
| 0.1 | 10.2 | GO:0019894 | kinesin binding(GO:0019894) |
| 0.1 | 0.1 | GO:0047894 | flavonol 3-sulfotransferase activity(GO:0047894) |
| 0.1 | 0.7 | GO:0042015 | interleukin-20 binding(GO:0042015) |
| 0.1 | 0.4 | GO:0061697 | protein-malonyllysine demalonylase activity(GO:0036054) protein-succinyllysine desuccinylase activity(GO:0036055) protein-glutaryllysine deglutarylase activity(GO:0061697) |
| 0.1 | 0.3 | GO:0038064 | collagen receptor activity(GO:0038064) |
| 0.1 | 0.5 | GO:0004694 | eukaryotic translation initiation factor 2alpha kinase activity(GO:0004694) |
| 0.1 | 0.7 | GO:0004995 | tachykinin receptor activity(GO:0004995) |
| 0.1 | 2.8 | GO:0001087 | transcription factor activity, sequence-specific DNA binding, RNA polymerase recruiting(GO:0001011) transcription factor activity, TFIIB-class binding(GO:0001087) |
| 0.1 | 0.5 | GO:0004517 | nitric-oxide synthase activity(GO:0004517) |
| 0.1 | 1.4 | GO:0004931 | extracellular ATP-gated cation channel activity(GO:0004931) ATP-gated ion channel activity(GO:0035381) |
| 0.1 | 0.4 | GO:0051377 | mannose-ethanolamine phosphotransferase activity(GO:0051377) |
| 0.1 | 4.1 | GO:0001972 | retinoic acid binding(GO:0001972) |
| 0.1 | 0.4 | GO:0016309 | 1-phosphatidylinositol-5-phosphate 4-kinase activity(GO:0016309) |
| 0.1 | 0.8 | GO:0004013 | adenosylhomocysteinase activity(GO:0004013) trialkylsulfonium hydrolase activity(GO:0016802) |
| 0.1 | 0.3 | GO:0035663 | Toll-like receptor 2 binding(GO:0035663) |
| 0.1 | 0.8 | GO:0030348 | syntaxin-3 binding(GO:0030348) |
| 0.1 | 1.1 | GO:0050682 | AF-2 domain binding(GO:0050682) |
| 0.1 | 1.9 | GO:0031435 | mitogen-activated protein kinase kinase kinase binding(GO:0031435) |
| 0.1 | 0.5 | GO:0004925 | prolactin receptor activity(GO:0004925) |
| 0.1 | 1.2 | GO:0001758 | retinal dehydrogenase activity(GO:0001758) |
| 0.1 | 0.5 | GO:0086089 | voltage-gated potassium channel activity involved in atrial cardiac muscle cell action potential repolarization(GO:0086089) |
| 0.1 | 0.1 | GO:0032551 | pyrimidine nucleoside binding(GO:0001884) UTP binding(GO:0002134) pyrimidine ribonucleoside binding(GO:0032551) |
| 0.1 | 0.5 | GO:0008745 | N-acetylmuramoyl-L-alanine amidase activity(GO:0008745) peptidoglycan receptor activity(GO:0016019) |
| 0.1 | 4.0 | GO:0034237 | protein kinase A regulatory subunit binding(GO:0034237) |
| 0.1 | 0.4 | GO:0008476 | protein-tyrosine sulfotransferase activity(GO:0008476) |
| 0.1 | 3.6 | GO:0005545 | 1-phosphatidylinositol binding(GO:0005545) |
| 0.1 | 0.5 | GO:1990430 | extracellular matrix protein binding(GO:1990430) |
| 0.1 | 0.4 | GO:0009032 | thymidine phosphorylase activity(GO:0009032) pyrimidine-nucleoside phosphorylase activity(GO:0016154) |
| 0.1 | 3.4 | GO:0017056 | structural constituent of nuclear pore(GO:0017056) |
| 0.1 | 0.4 | GO:0010348 | lithium:proton antiporter activity(GO:0010348) |
| 0.1 | 0.7 | GO:0005166 | neurotrophin p75 receptor binding(GO:0005166) |
| 0.1 | 0.5 | GO:0008426 | protein kinase C inhibitor activity(GO:0008426) |
| 0.1 | 0.6 | GO:0019912 | cyclin-dependent protein kinase activating kinase activity(GO:0019912) |
| 0.1 | 1.1 | GO:0071723 | lipopeptide binding(GO:0071723) |
| 0.1 | 0.7 | GO:0015350 | methotrexate transporter activity(GO:0015350) |
| 0.1 | 0.3 | GO:0042978 | ornithine decarboxylase activator activity(GO:0042978) |
| 0.1 | 0.5 | GO:0035241 | protein-arginine omega-N monomethyltransferase activity(GO:0035241) |
| 0.1 | 0.9 | GO:0008048 | calcium sensitive guanylate cyclase activator activity(GO:0008048) |
| 0.1 | 0.3 | GO:0052798 | beta-galactoside alpha-2,3-sialyltransferase activity(GO:0052798) |
| 0.1 | 0.4 | GO:0005111 | type 2 fibroblast growth factor receptor binding(GO:0005111) |
| 0.1 | 0.4 | GO:0070326 | very-low-density lipoprotein particle receptor binding(GO:0070326) |
| 0.1 | 4.6 | GO:0051959 | dynein light intermediate chain binding(GO:0051959) |
| 0.1 | 0.4 | GO:0070643 | vitamin D3 25-hydroxylase activity(GO:0030343) vitamin D 25-hydroxylase activity(GO:0070643) |
| 0.1 | 0.6 | GO:0023029 | MHC class Ib protein binding(GO:0023029) |
| 0.1 | 3.1 | GO:0031489 | myosin V binding(GO:0031489) |
| 0.1 | 0.3 | GO:0005457 | GDP-fucose transmembrane transporter activity(GO:0005457) purine nucleotide-sugar transmembrane transporter activity(GO:0036080) |
| 0.1 | 0.9 | GO:0017150 | tRNA dihydrouridine synthase activity(GO:0017150) |
| 0.1 | 2.0 | GO:0015245 | fatty acid transporter activity(GO:0015245) |
| 0.1 | 0.4 | GO:0050262 | ribosylnicotinamide kinase activity(GO:0050262) ribosylnicotinate kinase activity(GO:0061769) |
| 0.1 | 0.5 | GO:0015094 | cadmium ion transmembrane transporter activity(GO:0015086) cobalt ion transmembrane transporter activity(GO:0015087) lead ion transmembrane transporter activity(GO:0015094) ferrous iron uptake transmembrane transporter activity(GO:0015639) |
| 0.1 | 0.2 | GO:1990763 | arrestin family protein binding(GO:1990763) |
| 0.1 | 1.8 | GO:0032041 | histone deacetylase activity (H3-K14 specific)(GO:0031078) NAD-dependent histone deacetylase activity (H3-K14 specific)(GO:0032041) |
| 0.1 | 1.2 | GO:0001135 | transcription factor activity, RNA polymerase II transcription factor recruiting(GO:0001135) |
| 0.1 | 0.5 | GO:0015265 | urea channel activity(GO:0015265) |
| 0.1 | 0.1 | GO:0050405 | [hydroxymethylglutaryl-CoA reductase (NADPH)] kinase activity(GO:0047322) [acetyl-CoA carboxylase] kinase activity(GO:0050405) |
| 0.1 | 2.9 | GO:0005112 | Notch binding(GO:0005112) |
| 0.1 | 0.4 | GO:0047291 | neolactotetraosylceramide alpha-2,3-sialyltransferase activity(GO:0004513) lactosylceramide alpha-2,3-sialyltransferase activity(GO:0047291) |
| 0.1 | 0.3 | GO:0004772 | sterol O-acyltransferase activity(GO:0004772) cholesterol O-acyltransferase activity(GO:0034736) |
| 0.1 | 2.1 | GO:0015095 | magnesium ion transmembrane transporter activity(GO:0015095) |
| 0.1 | 1.4 | GO:0019957 | C-C chemokine binding(GO:0019957) |
| 0.1 | 2.7 | GO:0002162 | dystroglycan binding(GO:0002162) |
| 0.1 | 0.3 | GO:0004750 | ribulose-phosphate 3-epimerase activity(GO:0004750) |
| 0.1 | 0.4 | GO:0004741 | [pyruvate dehydrogenase (lipoamide)] phosphatase activity(GO:0004741) |
| 0.1 | 4.2 | GO:0003785 | actin monomer binding(GO:0003785) |
| 0.1 | 0.2 | GO:0005219 | ryanodine-sensitive calcium-release channel activity(GO:0005219) |
| 0.1 | 0.7 | GO:0008046 | axon guidance receptor activity(GO:0008046) |
| 0.1 | 1.6 | GO:0003796 | lysozyme activity(GO:0003796) |
| 0.1 | 0.3 | GO:0004914 | interleukin-5 receptor activity(GO:0004914) |
| 0.1 | 0.6 | GO:0004489 | methylenetetrahydrofolate reductase (NAD(P)H) activity(GO:0004489) |
| 0.1 | 0.3 | GO:0090555 | phosphatidylethanolamine-translocating ATPase activity(GO:0090555) |
| 0.1 | 11.2 | GO:0003725 | double-stranded RNA binding(GO:0003725) |
| 0.1 | 0.3 | GO:0004021 | L-alanine:2-oxoglutarate aminotransferase activity(GO:0004021) alanine-oxo-acid transaminase activity(GO:0047635) |
| 0.1 | 0.1 | GO:0047787 | delta4-3-oxosteroid 5beta-reductase activity(GO:0047787) |
| 0.1 | 4.1 | GO:0004198 | calcium-dependent cysteine-type endopeptidase activity(GO:0004198) |
| 0.1 | 2.5 | GO:0050321 | tau-protein kinase activity(GO:0050321) |
| 0.1 | 0.8 | GO:0034711 | inhibin binding(GO:0034711) |
| 0.1 | 0.3 | GO:0004483 | mRNA (nucleoside-2'-O-)-methyltransferase activity(GO:0004483) |
| 0.1 | 1.0 | GO:0042834 | peptidoglycan binding(GO:0042834) |
| 0.1 | 0.4 | GO:0034046 | poly(G) binding(GO:0034046) |
| 0.1 | 0.9 | GO:0015501 | glutamate:sodium symporter activity(GO:0015501) |
| 0.1 | 0.3 | GO:0005152 | interleukin-1 receptor antagonist activity(GO:0005152) |
| 0.1 | 0.5 | GO:0004427 | inorganic diphosphatase activity(GO:0004427) |
| 0.1 | 0.3 | GO:0061505 | DNA topoisomerase type II (ATP-hydrolyzing) activity(GO:0003918) DNA topoisomerase II activity(GO:0061505) |
| 0.1 | 9.9 | GO:0001618 | virus receptor activity(GO:0001618) |
| 0.1 | 0.4 | GO:0080019 | fatty-acyl-CoA reductase (alcohol-forming) activity(GO:0080019) |
| 0.1 | 6.3 | GO:0097110 | scaffold protein binding(GO:0097110) |
| 0.1 | 1.3 | GO:0016421 | CoA carboxylase activity(GO:0016421) |
| 0.1 | 26.5 | GO:0004252 | serine-type endopeptidase activity(GO:0004252) |
| 0.1 | 0.8 | GO:0004704 | NF-kappaB-inducing kinase activity(GO:0004704) |
| 0.1 | 0.3 | GO:0005462 | UDP-N-acetylglucosamine transmembrane transporter activity(GO:0005462) |
| 0.1 | 0.3 | GO:0008294 | calcium- and calmodulin-responsive adenylate cyclase activity(GO:0008294) |
| 0.1 | 0.7 | GO:0033170 | DNA clamp loader activity(GO:0003689) protein-DNA loading ATPase activity(GO:0033170) |
| 0.1 | 0.1 | GO:0000247 | C-8 sterol isomerase activity(GO:0000247) |
| 0.1 | 0.2 | GO:0005011 | macrophage colony-stimulating factor receptor activity(GO:0005011) |
| 0.1 | 0.3 | GO:0015222 | serotonin transmembrane transporter activity(GO:0015222) |
| 0.1 | 0.4 | GO:0004905 | type I interferon receptor activity(GO:0004905) |
| 0.1 | 0.6 | GO:0051575 | 5'-deoxyribose-5-phosphate lyase activity(GO:0051575) |
| 0.1 | 1.6 | GO:0016175 | superoxide-generating NADPH oxidase activity(GO:0016175) |
| 0.1 | 1.2 | GO:0008199 | ferric iron binding(GO:0008199) |
| 0.1 | 4.3 | GO:0005246 | calcium channel regulator activity(GO:0005246) |
| 0.1 | 0.7 | GO:0030368 | interleukin-17 receptor activity(GO:0030368) |
| 0.1 | 1.1 | GO:0008432 | JUN kinase binding(GO:0008432) |
| 0.1 | 0.5 | GO:0004740 | pyruvate dehydrogenase (acetyl-transferring) kinase activity(GO:0004740) |
| 0.1 | 2.1 | GO:0043325 | phosphatidylinositol-3,4-bisphosphate binding(GO:0043325) |
| 0.1 | 1.5 | GO:0004143 | diacylglycerol kinase activity(GO:0004143) |
| 0.1 | 0.3 | GO:0001626 | nociceptin receptor activity(GO:0001626) |
| 0.1 | 0.2 | GO:0030290 | sphingolipid activator protein activity(GO:0030290) beta-N-acetylgalactosaminidase activity(GO:0032428) |
| 0.1 | 1.5 | GO:0022841 | potassium ion leak channel activity(GO:0022841) |
| 0.1 | 0.6 | GO:0070740 | tubulin-glutamic acid ligase activity(GO:0070740) |
| 0.1 | 0.3 | GO:0001588 | dopamine neurotransmitter receptor activity, coupled via Gs(GO:0001588) |
| 0.1 | 0.5 | GO:0061649 | ubiquitinated histone binding(GO:0061649) |
| 0.1 | 0.8 | GO:0004969 | histamine receptor activity(GO:0004969) |
| 0.1 | 0.2 | GO:1904599 | advanced glycation end-product binding(GO:1904599) |
| 0.1 | 0.7 | GO:0001665 | alpha-N-acetylgalactosaminide alpha-2,6-sialyltransferase activity(GO:0001665) |
| 0.1 | 0.9 | GO:0098599 | palmitoyl-(protein) hydrolase activity(GO:0008474) palmitoyl hydrolase activity(GO:0098599) |
| 0.1 | 0.3 | GO:0033897 | ribonuclease T2 activity(GO:0033897) |
| 0.1 | 0.4 | GO:0016316 | phosphatidylinositol-3,4-bisphosphate 4-phosphatase activity(GO:0016316) inositol-1,3,4-trisphosphate 4-phosphatase activity(GO:0017161) phosphatidylinositol-4,5-bisphosphate 4-phosphatase activity(GO:0034597) inositol-3,4-bisphosphate 4-phosphatase activity(GO:0052828) |
| 0.1 | 0.3 | GO:0046933 | proton-transporting ATP synthase activity, rotational mechanism(GO:0046933) |
| 0.1 | 0.3 | GO:0004743 | pyruvate kinase activity(GO:0004743) |
| 0.1 | 1.8 | GO:0070016 | armadillo repeat domain binding(GO:0070016) |
| 0.1 | 0.2 | GO:0000035 | acyl binding(GO:0000035) |
| 0.1 | 2.1 | GO:0001784 | phosphotyrosine binding(GO:0001784) |
| 0.1 | 0.4 | GO:0004366 | glycerol-3-phosphate O-acyltransferase activity(GO:0004366) |
| 0.1 | 0.1 | GO:0019862 | IgA binding(GO:0019862) |
| 0.1 | 0.4 | GO:0048101 | calcium- and calmodulin-regulated 3',5'-cyclic-GMP phosphodiesterase activity(GO:0048101) |
| 0.1 | 0.6 | GO:0004727 | prenylated protein tyrosine phosphatase activity(GO:0004727) |
| 0.1 | 0.4 | GO:0009378 | four-way junction helicase activity(GO:0009378) |
| 0.1 | 3.3 | GO:0004385 | guanylate kinase activity(GO:0004385) |
| 0.1 | 0.3 | GO:0034647 | histone demethylase activity (H3-trimethyl-K4 specific)(GO:0034647) |
| 0.1 | 7.6 | GO:0005070 | SH3/SH2 adaptor activity(GO:0005070) |
| 0.1 | 0.4 | GO:0071936 | coreceptor activity involved in Wnt signaling pathway(GO:0071936) |
| 0.1 | 0.6 | GO:0008569 | ATP-dependent microtubule motor activity, minus-end-directed(GO:0008569) |
| 0.1 | 2.0 | GO:0022848 | acetylcholine-gated cation channel activity(GO:0022848) |
| 0.1 | 1.2 | GO:0004745 | retinol dehydrogenase activity(GO:0004745) |
| 0.1 | 0.2 | GO:0080130 | L-phenylalanine:2-oxoglutarate aminotransferase activity(GO:0080130) |
| 0.1 | 2.0 | GO:0004707 | MAP kinase activity(GO:0004707) |
| 0.1 | 0.3 | GO:0003976 | UDP-N-acetylglucosamine-lysosomal-enzyme N-acetylglucosaminephosphotransferase activity(GO:0003976) |
| 0.1 | 0.3 | GO:0001054 | RNA polymerase I activity(GO:0001054) |
| 0.1 | 2.4 | GO:0016709 | oxidoreductase activity, acting on paired donors, with incorporation or reduction of molecular oxygen, NAD(P)H as one donor, and incorporation of one atom of oxygen(GO:0016709) |
| 0.1 | 0.3 | GO:0004949 | cannabinoid receptor activity(GO:0004949) |
| 0.1 | 0.2 | GO:0004698 | calcium-dependent protein kinase C activity(GO:0004698) |
| 0.1 | 5.2 | GO:0005544 | calcium-dependent phospholipid binding(GO:0005544) |
| 0.1 | 2.4 | GO:0043027 | cysteine-type endopeptidase inhibitor activity involved in apoptotic process(GO:0043027) |
| 0.1 | 0.7 | GO:0070915 | lysophosphatidic acid receptor activity(GO:0070915) |
| 0.1 | 1.6 | GO:0001056 | RNA polymerase III activity(GO:0001056) |
| 0.1 | 0.1 | GO:0098847 | single-stranded telomeric DNA binding(GO:0043047) sequence-specific single stranded DNA binding(GO:0098847) |
| 0.1 | 0.8 | GO:0015643 | toxic substance binding(GO:0015643) |
| 0.1 | 0.3 | GO:0098821 | BMP receptor activity(GO:0098821) |
| 0.1 | 0.2 | GO:0001034 | RNA polymerase III transcription factor activity, sequence-specific DNA binding(GO:0001034) |
| 0.1 | 0.3 | GO:0047685 | amine sulfotransferase activity(GO:0047685) |
| 0.1 | 0.4 | GO:0004127 | cytidylate kinase activity(GO:0004127) |
| 0.1 | 0.3 | GO:0050816 | phosphothreonine binding(GO:0050816) |
| 0.1 | 0.9 | GO:0016723 | oxidoreductase activity, oxidizing metal ions, NAD or NADP as acceptor(GO:0016723) |
| 0.1 | 0.2 | GO:0002060 | purine nucleobase binding(GO:0002060) |
| 0.1 | 0.2 | GO:0015141 | succinate transmembrane transporter activity(GO:0015141) |
| 0.1 | 0.8 | GO:0044548 | S100 protein binding(GO:0044548) |
| 0.1 | 0.3 | GO:0048403 | brain-derived neurotrophic factor binding(GO:0048403) |
| 0.1 | 6.8 | GO:0031490 | chromatin DNA binding(GO:0031490) |
| 0.1 | 0.2 | GO:0008336 | gamma-butyrobetaine dioxygenase activity(GO:0008336) |
| 0.1 | 1.2 | GO:0030507 | spectrin binding(GO:0030507) |
| 0.1 | 0.2 | GO:0050509 | N-acetylglucosaminyl-proteoglycan 4-beta-glucuronosyltransferase activity(GO:0050509) |
| 0.1 | 0.2 | GO:0015375 | glycine:sodium symporter activity(GO:0015375) |
| 0.1 | 0.1 | GO:0004904 | interferon receptor activity(GO:0004904) interferon-gamma receptor activity(GO:0004906) |
| 0.1 | 0.9 | GO:0005149 | interleukin-1 receptor binding(GO:0005149) |
| 0.1 | 1.6 | GO:1990841 | promoter-specific chromatin binding(GO:1990841) |
| 0.1 | 0.2 | GO:0017098 | sulfonylurea receptor binding(GO:0017098) |
| 0.1 | 0.8 | GO:0003720 | telomerase activity(GO:0003720) RNA-directed DNA polymerase activity(GO:0003964) |
| 0.1 | 0.5 | GO:0003726 | double-stranded RNA adenosine deaminase activity(GO:0003726) |
| 0.1 | 0.3 | GO:0003945 | N-acetyllactosamine synthase activity(GO:0003945) |
| 0.1 | 0.2 | GO:0070095 | fructose-6-phosphate binding(GO:0070095) |
| 0.1 | 1.9 | GO:0019706 | protein-cysteine S-palmitoyltransferase activity(GO:0019706) protein-cysteine S-acyltransferase activity(GO:0019707) |
| 0.1 | 0.2 | GO:0047888 | fatty acid peroxidase activity(GO:0047888) |
| 0.1 | 0.2 | GO:0016979 | lipoate-protein ligase activity(GO:0016979) |
| 0.1 | 0.2 | GO:0033878 | hormone-sensitive lipase activity(GO:0033878) |
| 0.1 | 0.2 | GO:0016419 | [acyl-carrier-protein] S-malonyltransferase activity(GO:0004314) S-malonyltransferase activity(GO:0016419) malonyltransferase activity(GO:0016420) |
| 0.1 | 0.8 | GO:0005283 | sodium:amino acid symporter activity(GO:0005283) |
| 0.1 | 1.2 | GO:0005549 | odorant binding(GO:0005549) |
| 0.1 | 1.1 | GO:0004653 | polypeptide N-acetylgalactosaminyltransferase activity(GO:0004653) |
| 0.1 | 0.2 | GO:0098519 | nucleotide phosphatase activity, acting on free nucleotides(GO:0098519) |
| 0.1 | 0.3 | GO:0070878 | primary miRNA binding(GO:0070878) |
| 0.1 | 0.2 | GO:0042020 | interleukin-23 binding(GO:0042019) interleukin-23 receptor activity(GO:0042020) |
| 0.1 | 0.2 | GO:0016495 | C-X3-C chemokine receptor activity(GO:0016495) |
| 0.1 | 0.7 | GO:0010314 | phosphatidylinositol-5-phosphate binding(GO:0010314) |
| 0.1 | 4.0 | GO:0001102 | RNA polymerase II activating transcription factor binding(GO:0001102) |
| 0.1 | 0.2 | GO:0004663 | Rab geranylgeranyltransferase activity(GO:0004663) |
| 0.1 | 18.0 | GO:0044822 | mRNA binding(GO:0003729) poly(A) RNA binding(GO:0044822) |
| 0.1 | 0.2 | GO:0004980 | melanocyte-stimulating hormone receptor activity(GO:0004980) |
| 0.1 | 0.2 | GO:0043141 | ATP-dependent 5'-3' DNA helicase activity(GO:0043141) |
| 0.1 | 0.2 | GO:0038025 | very-low-density lipoprotein particle binding(GO:0034189) reelin receptor activity(GO:0038025) |
| 0.1 | 0.2 | GO:0050501 | hyaluronan synthase activity(GO:0050501) |
| 0.1 | 2.2 | GO:0005164 | tumor necrosis factor receptor binding(GO:0005164) |
| 0.1 | 0.4 | GO:0016725 | oxidoreductase activity, acting on CH or CH2 groups(GO:0016725) |
| 0.1 | 0.9 | GO:0031005 | filamin binding(GO:0031005) |
| 0.1 | 0.9 | GO:0017110 | nucleoside-diphosphatase activity(GO:0017110) |
| 0.1 | 0.2 | GO:0050253 | retinyl-palmitate esterase activity(GO:0050253) |
| 0.1 | 1.5 | GO:0005001 | transmembrane receptor protein tyrosine phosphatase activity(GO:0005001) transmembrane receptor protein phosphatase activity(GO:0019198) |
| 0.1 | 0.6 | GO:0031957 | very long-chain fatty acid-CoA ligase activity(GO:0031957) |
| 0.1 | 0.5 | GO:0030911 | TPR domain binding(GO:0030911) |
| 0.1 | 0.3 | GO:1903136 | cuprous ion binding(GO:1903136) |
| 0.0 | 1.1 | GO:0005547 | phosphatidylinositol-3,4,5-trisphosphate binding(GO:0005547) |
| 0.0 | 0.1 | GO:0035575 | histone demethylase activity (H4-K20 specific)(GO:0035575) |
| 0.0 | 0.4 | GO:0004985 | opioid receptor activity(GO:0004985) |
| 0.0 | 0.3 | GO:0016423 | tRNA (guanine) methyltransferase activity(GO:0016423) |
| 0.0 | 0.5 | GO:0008526 | phosphatidylinositol transporter activity(GO:0008526) |
| 0.0 | 0.3 | GO:0002114 | interleukin-33 receptor activity(GO:0002114) |
| 0.0 | 8.2 | GO:0017124 | SH3 domain binding(GO:0017124) |
| 0.0 | 0.6 | GO:1904264 | ubiquitin protein ligase activity involved in ERAD pathway(GO:1904264) |
| 0.0 | 0.4 | GO:0030215 | semaphorin receptor binding(GO:0030215) |
| 0.0 | 0.8 | GO:0031681 | G-protein beta-subunit binding(GO:0031681) |
| 0.0 | 1.3 | GO:0030159 | receptor signaling complex scaffold activity(GO:0030159) |
| 0.0 | 0.1 | GO:0001226 | RNA polymerase II transcription corepressor binding(GO:0001226) |
| 0.0 | 0.2 | GO:0047045 | testosterone 17-beta-dehydrogenase (NADP+) activity(GO:0047045) |
| 0.0 | 0.1 | GO:0008900 | hydrogen:potassium-exchanging ATPase activity(GO:0008900) |
| 0.0 | 0.3 | GO:0016167 | glial cell-derived neurotrophic factor receptor activity(GO:0016167) |
| 0.0 | 0.3 | GO:0015165 | pyrimidine nucleotide-sugar transmembrane transporter activity(GO:0015165) |
| 0.0 | 0.1 | GO:0034416 | bisphosphoglycerate phosphatase activity(GO:0034416) |
| 0.0 | 0.4 | GO:0030284 | estrogen receptor activity(GO:0030284) |
| 0.0 | 0.3 | GO:0005250 | A-type (transient outward) potassium channel activity(GO:0005250) |
| 0.0 | 0.1 | GO:0018685 | alkane 1-monooxygenase activity(GO:0018685) |
| 0.0 | 0.7 | GO:0035497 | cAMP response element binding(GO:0035497) |
| 0.0 | 0.1 | GO:0015489 | polyamine transmembrane transporter activity(GO:0015203) putrescine transmembrane transporter activity(GO:0015489) |
| 0.0 | 0.3 | GO:0031705 | bombesin receptor binding(GO:0031705) |
| 0.0 | 0.2 | GO:0004022 | alcohol dehydrogenase (NAD) activity(GO:0004022) |
| 0.0 | 0.2 | GO:0003963 | RNA-3'-phosphate cyclase activity(GO:0003963) |
| 0.0 | 0.2 | GO:0031726 | CCR1 chemokine receptor binding(GO:0031726) |
| 0.0 | 0.1 | GO:0004937 | alpha1-adrenergic receptor activity(GO:0004937) |
| 0.0 | 0.1 | GO:0008892 | guanine deaminase activity(GO:0008892) |
| 0.0 | 0.4 | GO:0005025 | transforming growth factor beta receptor activity, type I(GO:0005025) |
| 0.0 | 0.2 | GO:0016882 | cyclo-ligase activity(GO:0016882) |
| 0.0 | 0.1 | GO:0047750 | cholestenol delta-isomerase activity(GO:0047750) |
| 0.0 | 0.3 | GO:0070569 | uridylyltransferase activity(GO:0070569) |
| 0.0 | 0.2 | GO:0050211 | procollagen galactosyltransferase activity(GO:0050211) |
| 0.0 | 0.6 | GO:0005537 | mannose binding(GO:0005537) |
| 0.0 | 0.4 | GO:0015386 | potassium:proton antiporter activity(GO:0015386) |
| 0.0 | 0.3 | GO:0045505 | dynein intermediate chain binding(GO:0045505) |
| 0.0 | 0.3 | GO:0008889 | glycerophosphodiester phosphodiesterase activity(GO:0008889) |
| 0.0 | 0.2 | GO:0008970 | phosphatidylcholine 1-acylhydrolase activity(GO:0008970) |
| 0.0 | 0.4 | GO:0017176 | phosphatidylinositol N-acetylglucosaminyltransferase activity(GO:0017176) |
| 0.0 | 0.3 | GO:0015235 | cobalamin transporter activity(GO:0015235) |
| 0.0 | 0.2 | GO:0004920 | interleukin-10 receptor activity(GO:0004920) |
| 0.0 | 0.1 | GO:0036505 | prosaposin receptor activity(GO:0036505) |
| 0.0 | 0.1 | GO:0035014 | phosphatidylinositol 3-kinase regulator activity(GO:0035014) 1-phosphatidylinositol-3-kinase regulator activity(GO:0046935) |
| 0.0 | 0.4 | GO:0019784 | NEDD8-specific protease activity(GO:0019784) |
| 0.0 | 0.3 | GO:0042296 | ISG15 transferase activity(GO:0042296) |
| 0.0 | 0.1 | GO:0004075 | biotin carboxylase activity(GO:0004075) |
| 0.0 | 2.7 | GO:0019003 | GDP binding(GO:0019003) |
| 0.0 | 0.6 | GO:0016846 | carbon-sulfur lyase activity(GO:0016846) |
| 0.0 | 0.3 | GO:0004046 | aminoacylase activity(GO:0004046) |
| 0.0 | 0.2 | GO:0015183 | L-aspartate transmembrane transporter activity(GO:0015183) |
| 0.0 | 1.7 | GO:0008009 | chemokine activity(GO:0008009) |
| 0.0 | 0.4 | GO:0047498 | calcium-dependent phospholipase A2 activity(GO:0047498) |
| 0.0 | 0.3 | GO:0004514 | nicotinate-nucleotide diphosphorylase (carboxylating) activity(GO:0004514) |
| 0.0 | 0.1 | GO:0002046 | opsin binding(GO:0002046) |
| 0.0 | 0.3 | GO:0004045 | aminoacyl-tRNA hydrolase activity(GO:0004045) |
| 0.0 | 0.1 | GO:0033858 | N-acetylgalactosamine kinase activity(GO:0033858) |
| 0.0 | 0.1 | GO:0005026 | transforming growth factor beta receptor activity, type II(GO:0005026) |
| 0.0 | 1.2 | GO:0005546 | phosphatidylinositol-4,5-bisphosphate binding(GO:0005546) |
| 0.0 | 0.1 | GO:0060422 | peptidyl-dipeptidase inhibitor activity(GO:0060422) |
| 0.0 | 0.3 | GO:0045545 | syndecan binding(GO:0045545) |
| 0.0 | 0.3 | GO:0003910 | DNA ligase (ATP) activity(GO:0003910) |
| 0.0 | 0.6 | GO:0070840 | dynein complex binding(GO:0070840) |
| 0.0 | 0.3 | GO:0019238 | cyclohydrolase activity(GO:0019238) |
| 0.0 | 0.3 | GO:0016174 | NAD(P)H oxidase activity(GO:0016174) |
| 0.0 | 0.2 | GO:0046979 | TAP2 binding(GO:0046979) |
| 0.0 | 0.1 | GO:0070026 | oxidoreductase activity, acting on other nitrogenous compounds as donors, cytochrome as acceptor(GO:0016662) nitrite reductase (NO-forming) activity(GO:0050421) carbon monoxide binding(GO:0070025) nitric oxide binding(GO:0070026) nitrite reductase activity(GO:0098809) |
| 0.0 | 0.2 | GO:0004359 | glutaminase activity(GO:0004359) |
| 0.0 | 0.7 | GO:0033038 | bitter taste receptor activity(GO:0033038) |
| 0.0 | 0.2 | GO:0004368 | glycerol-3-phosphate dehydrogenase activity(GO:0004368) oxidoreductase activity, acting on the CH-OH group of donors, quinone or similar compound as acceptor(GO:0016901) |
| 0.0 | 0.1 | GO:0050220 | prostaglandin-E synthase activity(GO:0050220) |
| 0.0 | 0.2 | GO:0005078 | MAP-kinase scaffold activity(GO:0005078) |
| 0.0 | 0.2 | GO:0004305 | ethanolamine kinase activity(GO:0004305) |
| 0.0 | 0.1 | GO:0008534 | oxidized purine nucleobase lesion DNA N-glycosylase activity(GO:0008534) |
| 0.0 | 0.2 | GO:0030620 | U2 snRNA binding(GO:0030620) |
| 0.0 | 0.5 | GO:0097371 | MDM2/MDM4 family protein binding(GO:0097371) |
| 0.0 | 3.7 | GO:0004843 | thiol-dependent ubiquitin-specific protease activity(GO:0004843) |
| 0.0 | 0.1 | GO:0047184 | 1-acylglycerophosphocholine O-acyltransferase activity(GO:0047184) |
| 0.0 | 0.3 | GO:0061665 | SUMO ligase activity(GO:0061665) |
| 0.0 | 0.3 | GO:0004457 | lactate dehydrogenase activity(GO:0004457) |
| 0.0 | 0.2 | GO:0019103 | pyrimidine nucleotide binding(GO:0019103) |
| 0.0 | 0.2 | GO:0030144 | alpha-1,6-mannosylglycoprotein 6-beta-N-acetylglucosaminyltransferase activity(GO:0030144) |
| 0.0 | 0.5 | GO:0032395 | MHC class II receptor activity(GO:0032395) |
| 0.0 | 0.5 | GO:0003688 | DNA replication origin binding(GO:0003688) |
| 0.0 | 0.1 | GO:0016623 | oxidoreductase activity, acting on the aldehyde or oxo group of donors, oxygen as acceptor(GO:0016623) |
| 0.0 | 0.6 | GO:0070182 | DNA polymerase binding(GO:0070182) |
| 0.0 | 0.2 | GO:0008310 | single-stranded DNA 3'-5' exodeoxyribonuclease activity(GO:0008310) |
| 0.0 | 5.6 | GO:0017137 | Rab GTPase binding(GO:0017137) |
| 0.0 | 0.5 | GO:0043395 | heparan sulfate proteoglycan binding(GO:0043395) |
| 0.0 | 0.2 | GO:0016435 | rRNA (guanine) methyltransferase activity(GO:0016435) |
| 0.0 | 0.3 | GO:0034235 | GPI anchor binding(GO:0034235) |
| 0.0 | 0.2 | GO:0008142 | oxysterol binding(GO:0008142) |
| 0.0 | 0.6 | GO:0042809 | vitamin D receptor binding(GO:0042809) |
| 0.0 | 0.4 | GO:0008607 | phosphorylase kinase regulator activity(GO:0008607) |
| 0.0 | 0.1 | GO:0080023 | 3R-hydroxyacyl-CoA dehydratase activity(GO:0080023) |
| 0.0 | 0.4 | GO:0008061 | chitin binding(GO:0008061) |
| 0.0 | 0.1 | GO:0004999 | vasoactive intestinal polypeptide receptor activity(GO:0004999) |
| 0.0 | 0.1 | GO:0004583 | dolichyl-phosphate-glucose-glycolipid alpha-glucosyltransferase activity(GO:0004583) |
| 0.0 | 0.6 | GO:0070064 | proline-rich region binding(GO:0070064) |
| 0.0 | 0.2 | GO:0017050 | sphinganine kinase activity(GO:0008481) D-erythro-sphingosine kinase activity(GO:0017050) |
| 0.0 | 0.1 | GO:0003831 | beta-N-acetylglucosaminylglycopeptide beta-1,4-galactosyltransferase activity(GO:0003831) |
| 0.0 | 0.0 | GO:0015385 | sodium:proton antiporter activity(GO:0015385) |
| 0.0 | 0.3 | GO:0070679 | inositol 1,4,5 trisphosphate binding(GO:0070679) |
| 0.0 | 0.1 | GO:0004991 | parathyroid hormone receptor activity(GO:0004991) |
| 0.0 | 0.1 | GO:0004597 | peptide-aspartate beta-dioxygenase activity(GO:0004597) |
| 0.0 | 0.5 | GO:0016500 | protein-hormone receptor activity(GO:0016500) |
| 0.0 | 0.2 | GO:0031432 | titin binding(GO:0031432) |
| 0.0 | 0.1 | GO:0008177 | succinate dehydrogenase (ubiquinone) activity(GO:0008177) |
| 0.0 | 0.1 | GO:0043237 | laminin-1 binding(GO:0043237) |
| 0.0 | 0.2 | GO:0019788 | NEDD8 transferase activity(GO:0019788) |
| 0.0 | 0.1 | GO:0004647 | phosphoserine phosphatase activity(GO:0004647) |
| 0.0 | 9.1 | GO:0005088 | Ras guanyl-nucleotide exchange factor activity(GO:0005088) |
| 0.0 | 0.1 | GO:0098808 | mRNA cap binding(GO:0098808) |
| 0.0 | 0.8 | GO:0004709 | MAP kinase kinase kinase activity(GO:0004709) |
| 0.0 | 0.2 | GO:0035242 | protein-arginine omega-N asymmetric methyltransferase activity(GO:0035242) |
| 0.0 | 0.2 | GO:0035174 | histone serine kinase activity(GO:0035174) |
| 0.0 | 0.1 | GO:0032217 | riboflavin transporter activity(GO:0032217) |
| 0.0 | 0.1 | GO:0071558 | histone demethylase activity (H3-K27 specific)(GO:0071558) |
| 0.0 | 0.2 | GO:0004591 | oxoglutarate dehydrogenase (succinyl-transferring) activity(GO:0004591) |
| 0.0 | 0.1 | GO:0051538 | 3 iron, 4 sulfur cluster binding(GO:0051538) |
| 0.0 | 0.4 | GO:0050544 | arachidonic acid binding(GO:0050544) |
| 0.0 | 0.3 | GO:0030306 | ADP-ribosylation factor binding(GO:0030306) |
| 0.0 | 0.1 | GO:0005222 | intracellular cAMP activated cation channel activity(GO:0005222) |
| 0.0 | 1.1 | GO:0044390 | ubiquitin-like protein conjugating enzyme binding(GO:0044390) |
| 0.0 | 0.2 | GO:0032050 | clathrin heavy chain binding(GO:0032050) |
| 0.0 | 0.1 | GO:0033188 | sphingomyelin synthase activity(GO:0033188) ceramide cholinephosphotransferase activity(GO:0047493) |
| 0.0 | 0.2 | GO:1990381 | ubiquitin-specific protease binding(GO:1990381) |
| 0.0 | 0.3 | GO:0002161 | aminoacyl-tRNA editing activity(GO:0002161) |
| 0.0 | 0.3 | GO:0098505 | G-rich strand telomeric DNA binding(GO:0098505) |
| 0.0 | 0.1 | GO:0010521 | telomerase inhibitor activity(GO:0010521) |
| 0.0 | 0.1 | GO:0035939 | microsatellite binding(GO:0035939) |
| 0.0 | 0.3 | GO:0004526 | ribonuclease P activity(GO:0004526) |
| 0.0 | 0.2 | GO:0070728 | leucine binding(GO:0070728) |
| 0.0 | 0.1 | GO:0004882 | androgen receptor activity(GO:0004882) |
| 0.0 | 0.1 | GO:0047961 | glycine N-acyltransferase activity(GO:0047961) |
| 0.0 | 0.2 | GO:0004784 | superoxide dismutase activity(GO:0004784) oxidoreductase activity, acting on superoxide radicals as acceptor(GO:0016721) |
| 0.0 | 0.1 | GO:0089720 | caspase binding(GO:0089720) |
| 0.0 | 0.1 | GO:0005221 | intracellular cyclic nucleotide activated cation channel activity(GO:0005221) cyclic nucleotide-gated ion channel activity(GO:0043855) |
| 0.0 | 0.2 | GO:0004859 | phospholipase inhibitor activity(GO:0004859) |
| 0.0 | 0.2 | GO:0005542 | folic acid binding(GO:0005542) |
| 0.0 | 0.1 | GO:0010484 | H3 histone acetyltransferase activity(GO:0010484) |
| 0.0 | 0.0 | GO:0005497 | androgen binding(GO:0005497) |
| 0.0 | 0.1 | GO:0072345 | NAADP-sensitive calcium-release channel activity(GO:0072345) |
| 0.0 | 0.1 | GO:0004873 | asialoglycoprotein receptor activity(GO:0004873) |
| 0.0 | 0.2 | GO:0016594 | glycine binding(GO:0016594) |
| 0.0 | 0.2 | GO:0004303 | estradiol 17-beta-dehydrogenase activity(GO:0004303) |
| 0.0 | 0.3 | GO:0031433 | telethonin binding(GO:0031433) |
| 0.0 | 0.2 | GO:0043008 | ATP-dependent protein binding(GO:0043008) |
| 0.0 | 0.1 | GO:0045322 | unmethylated CpG binding(GO:0045322) |
| 0.0 | 0.2 | GO:0005237 | inhibitory extracellular ligand-gated ion channel activity(GO:0005237) |
| 0.0 | 0.1 | GO:0035374 | chondroitin sulfate binding(GO:0035374) |
| 0.0 | 0.1 | GO:0004965 | G-protein coupled GABA receptor activity(GO:0004965) |
| 0.0 | 0.1 | GO:0015181 | arginine transmembrane transporter activity(GO:0015181) |
| 0.0 | 0.1 | GO:0016426 | tRNA (adenine) methyltransferase activity(GO:0016426) |
| 0.0 | 0.2 | GO:0015174 | basic amino acid transmembrane transporter activity(GO:0015174) |
| 0.0 | 0.1 | GO:0004421 | hydroxymethylglutaryl-CoA synthase activity(GO:0004421) |
| 0.0 | 0.1 | GO:0016833 | oxo-acid-lyase activity(GO:0016833) |
| 0.0 | 0.1 | GO:0016176 | superoxide-generating NADPH oxidase activator activity(GO:0016176) |
| 0.0 | 0.0 | GO:0015140 | malate transmembrane transporter activity(GO:0015140) |
| 0.0 | 0.2 | GO:0015926 | glucosidase activity(GO:0015926) |
| 0.0 | 0.3 | GO:0022820 | potassium:chloride symporter activity(GO:0015379) potassium ion symporter activity(GO:0022820) |
| 0.0 | 0.2 | GO:0008649 | rRNA methyltransferase activity(GO:0008649) |
| 0.0 | 0.3 | GO:0008353 | RNA polymerase II carboxy-terminal domain kinase activity(GO:0008353) |
| 0.0 | 0.2 | GO:0048185 | activin binding(GO:0048185) |
| 0.0 | 0.1 | GO:0045131 | pre-mRNA branch point binding(GO:0045131) |
| 0.0 | 0.1 | GO:0071885 | N-terminal protein N-methyltransferase activity(GO:0071885) |
| 0.0 | 0.1 | GO:0008410 | CoA-transferase activity(GO:0008410) |
| 0.0 | 0.7 | GO:0015248 | sterol transporter activity(GO:0015248) |
| 0.0 | 0.2 | GO:0048156 | tau protein binding(GO:0048156) |
| 0.0 | 0.3 | GO:0035250 | UDP-galactosyltransferase activity(GO:0035250) |
| 0.0 | 0.2 | GO:0023026 | MHC class II protein complex binding(GO:0023026) |
| 0.0 | 0.1 | GO:0005004 | GPI-linked ephrin receptor activity(GO:0005004) |
| 0.0 | 0.1 | GO:0004749 | ribose phosphate diphosphokinase activity(GO:0004749) |
| 0.0 | 0.1 | GO:0034511 | U3 snoRNA binding(GO:0034511) |
| 0.0 | 0.3 | GO:0005487 | nucleocytoplasmic transporter activity(GO:0005487) |
| 0.0 | 0.1 | GO:0000403 | Y-form DNA binding(GO:0000403) |
| 0.0 | 0.1 | GO:0004001 | adenosine kinase activity(GO:0004001) |
| 0.0 | 0.0 | GO:0004563 | beta-N-acetylhexosaminidase activity(GO:0004563) |
| 0.0 | 0.1 | GO:0047144 | 2-acylglycerol-3-phosphate O-acyltransferase activity(GO:0047144) |
| 0.0 | 0.2 | GO:0008503 | benzodiazepine receptor activity(GO:0008503) |
| 0.0 | 0.1 | GO:0016520 | growth hormone-releasing hormone receptor activity(GO:0016520) |
| 0.0 | 0.1 | GO:0097322 | 7SK snRNA binding(GO:0097322) |
| 0.0 | 0.4 | GO:0005086 | ARF guanyl-nucleotide exchange factor activity(GO:0005086) |
| 0.0 | 0.3 | GO:0009982 | pseudouridine synthase activity(GO:0009982) |
| 0.0 | 0.7 | GO:0019212 | phosphatase inhibitor activity(GO:0019212) |
| 0.0 | 0.1 | GO:0043138 | 3'-5' DNA helicase activity(GO:0043138) |
| 0.0 | 0.4 | GO:0004003 | ATP-dependent DNA helicase activity(GO:0004003) |
| 0.0 | 0.2 | GO:0005328 | neurotransmitter:sodium symporter activity(GO:0005328) |
| 0.0 | 0.1 | GO:0031531 | thyrotropin-releasing hormone receptor binding(GO:0031531) |
| 0.0 | 0.1 | GO:0019958 | C-X-C chemokine binding(GO:0019958) |
| 0.0 | 0.1 | GO:0004565 | beta-galactosidase activity(GO:0004565) |
| 0.0 | 0.1 | GO:0003870 | 5-aminolevulinate synthase activity(GO:0003870) N-succinyltransferase activity(GO:0016749) |
| 0.0 | 0.1 | GO:0086080 | protein binding involved in heterotypic cell-cell adhesion(GO:0086080) |
| 0.0 | 0.2 | GO:0030275 | LRR domain binding(GO:0030275) |
| 0.0 | 1.3 | GO:0003774 | motor activity(GO:0003774) |
| 0.0 | 0.2 | GO:0004708 | MAP kinase kinase activity(GO:0004708) |
| 0.0 | 0.2 | GO:0042288 | MHC class I protein binding(GO:0042288) |
| 0.0 | 0.1 | GO:0035243 | protein-arginine omega-N symmetric methyltransferase activity(GO:0035243) |
| 0.0 | 0.1 | GO:0031434 | mitogen-activated protein kinase kinase binding(GO:0031434) |
| 0.0 | 0.0 | GO:0035473 | lipase binding(GO:0035473) |
| 0.0 | 0.0 | GO:0070259 | tyrosyl-DNA phosphodiesterase activity(GO:0070259) |
| 0.0 | 0.4 | GO:0008188 | neuropeptide receptor activity(GO:0008188) |
| 0.0 | 0.1 | GO:0004652 | polynucleotide adenylyltransferase activity(GO:0004652) |
| 0.0 | 0.1 | GO:0004719 | protein-L-isoaspartate (D-aspartate) O-methyltransferase activity(GO:0004719) |
| 0.0 | 10.1 | GO:0005198 | structural molecule activity(GO:0005198) |
| 0.0 | 0.0 | GO:0004611 | phosphoenolpyruvate carboxykinase activity(GO:0004611) phosphoenolpyruvate carboxykinase (GTP) activity(GO:0004613) |
| 0.0 | 0.1 | GO:0039706 | co-receptor binding(GO:0039706) |
| 0.0 | 0.1 | GO:0004594 | pantothenate kinase activity(GO:0004594) |
| 0.0 | 0.2 | GO:0004596 | peptide alpha-N-acetyltransferase activity(GO:0004596) |
| 0.0 | 0.8 | GO:0051117 | ATPase binding(GO:0051117) |
| 0.0 | 0.0 | GO:0005483 | soluble NSF attachment protein activity(GO:0005483) |
| 0.0 | 0.1 | GO:0030957 | Tat protein binding(GO:0030957) |
| 0.0 | 0.0 | GO:0033754 | indoleamine 2,3-dioxygenase activity(GO:0033754) |
| 0.0 | 0.4 | GO:0004715 | non-membrane spanning protein tyrosine kinase activity(GO:0004715) |
| 0.0 | 0.0 | GO:0047223 | beta-1,3-galactosyl-O-glycosyl-glycoprotein beta-1,3-N-acetylglucosaminyltransferase activity(GO:0047223) |
| 0.0 | 0.1 | GO:0032393 | MHC class I receptor activity(GO:0032393) |
| 0.0 | 0.0 | GO:0016428 | tRNA (cytosine-5-)-methyltransferase activity(GO:0016428) |
| 0.0 | 0.1 | GO:0008097 | 5S rRNA binding(GO:0008097) |
| 0.0 | 0.8 | GO:0005085 | guanyl-nucleotide exchange factor activity(GO:0005085) |
| 0.0 | 0.2 | GO:0019843 | rRNA binding(GO:0019843) |
| 0.0 | 0.0 | GO:0070984 | SET domain binding(GO:0070984) |
| 0.0 | 0.1 | GO:0050733 | RS domain binding(GO:0050733) |
| 0.0 | 0.1 | GO:0051525 | NFAT protein binding(GO:0051525) |
| 0.0 | 0.1 | GO:0030492 | hemoglobin binding(GO:0030492) |
Gene overrepresentation in curated gene sets: canonical pathways category:
| Log-likelihood per target | Total log-likelihood | Term | Description |
|---|---|---|---|
| 0.9 | 17.0 | PID INTEGRIN4 PATHWAY | Alpha6 beta4 integrin-ligand interactions |
| 0.6 | 22.2 | PID ERBB NETWORK PATHWAY | ErbB receptor signaling network |
| 0.4 | 7.0 | PID TCR RAS PATHWAY | Ras signaling in the CD4+ TCR pathway |
| 0.4 | 19.2 | PID NECTIN PATHWAY | Nectin adhesion pathway |
| 0.4 | 23.8 | PID RAS PATHWAY | Regulation of Ras family activation |
| 0.2 | 3.6 | PID ERBB1 DOWNSTREAM PATHWAY | ErbB1 downstream signaling |
| 0.2 | 1.2 | PID FRA PATHWAY | Validated transcriptional targets of AP1 family members Fra1 and Fra2 |
| 0.2 | 6.6 | PID WNT SIGNALING PATHWAY | Wnt signaling network |
| 0.2 | 5.1 | PID ANTHRAX PATHWAY | Cellular roles of Anthrax toxin |
| 0.2 | 0.6 | PID S1P S1P4 PATHWAY | S1P4 pathway |
| 0.2 | 3.3 | PID ECADHERIN KERATINOCYTE PATHWAY | E-cadherin signaling in keratinocytes |
| 0.1 | 4.0 | PID S1P S1P1 PATHWAY | S1P1 pathway |
| 0.1 | 0.5 | PID GMCSF PATHWAY | GMCSF-mediated signaling events |
| 0.1 | 1.2 | PID WNT CANONICAL PATHWAY | Canonical Wnt signaling pathway |
| 0.1 | 0.9 | PID LYMPH ANGIOGENESIS PATHWAY | VEGFR3 signaling in lymphatic endothelium |
| 0.1 | 10.7 | PID TAP63 PATHWAY | Validated transcriptional targets of TAp63 isoforms |
| 0.1 | 2.5 | PID INTEGRIN5 PATHWAY | Beta5 beta6 beta7 and beta8 integrin cell surface interactions |
| 0.1 | 4.0 | SA CASPASE CASCADE | Apoptosis is mediated by caspases, cysteine proteases arranged in a proteolytic cascade. |
| 0.1 | 4.4 | PID INTEGRIN A9B1 PATHWAY | Alpha9 beta1 integrin signaling events |
| 0.1 | 5.5 | PID ANGIOPOIETIN RECEPTOR PATHWAY | Angiopoietin receptor Tie2-mediated signaling |
| 0.1 | 8.1 | PID HNF3A PATHWAY | FOXA1 transcription factor network |
| 0.1 | 3.0 | PID A6B1 A6B4 INTEGRIN PATHWAY | a6b1 and a6b4 Integrin signaling |
| 0.1 | 2.4 | PID LPA4 PATHWAY | LPA4-mediated signaling events |
| 0.1 | 1.1 | SA TRKA RECEPTOR | The TrkA receptor binds nerve growth factor to activate MAP kinase pathways and promote cell growth. |
| 0.1 | 4.1 | PID ARF6 PATHWAY | Arf6 signaling events |
| 0.1 | 3.3 | PID INTEGRIN3 PATHWAY | Beta3 integrin cell surface interactions |
| 0.1 | 0.6 | ST PAC1 RECEPTOR PATHWAY | PAC1 Receptor Pathway |
| 0.1 | 3.7 | PID AMB2 NEUTROPHILS PATHWAY | amb2 Integrin signaling |
| 0.1 | 0.6 | PID NFKAPPAB ATYPICAL PATHWAY | Atypical NF-kappaB pathway |
| 0.1 | 1.5 | ST INTERLEUKIN 4 PATHWAY | Interleukin 4 (IL-4) Pathway |
| 0.1 | 2.9 | PID RHODOPSIN PATHWAY | Visual signal transduction: Rods |
| 0.1 | 9.1 | PID P73PATHWAY | p73 transcription factor network |
| 0.1 | 3.0 | PID CD8 TCR PATHWAY | TCR signaling in naïve CD8+ T cells |
| 0.1 | 4.2 | PID P38 ALPHA BETA DOWNSTREAM PATHWAY | Signaling mediated by p38-alpha and p38-beta |
| 0.1 | 2.5 | PID IL23 PATHWAY | IL23-mediated signaling events |
| 0.1 | 1.5 | ST P38 MAPK PATHWAY | p38 MAPK Pathway |
| 0.1 | 2.2 | PID TRAIL PATHWAY | TRAIL signaling pathway |
| 0.1 | 2.0 | PID IL1 PATHWAY | IL1-mediated signaling events |
| 0.1 | 2.4 | ST T CELL SIGNAL TRANSDUCTION | T Cell Signal Transduction |
| 0.1 | 0.3 | PID IL3 PATHWAY | IL3-mediated signaling events |
| 0.1 | 0.3 | ST GA12 PATHWAY | G alpha 12 Pathway |
| 0.1 | 1.4 | PID EPHRINB REV PATHWAY | Ephrin B reverse signaling |
| 0.1 | 3.3 | PID IL12 2PATHWAY | IL12-mediated signaling events |
| 0.1 | 0.1 | PID THROMBIN PAR4 PATHWAY | PAR4-mediated thrombin signaling events |
| 0.1 | 0.2 | PID EPO PATHWAY | EPO signaling pathway |
| 0.1 | 0.5 | SIG BCR SIGNALING PATHWAY | Members of the BCR signaling pathway |
| 0.1 | 0.3 | PID RETINOIC ACID PATHWAY | Retinoic acid receptors-mediated signaling |
| 0.0 | 0.4 | PID NEPHRIN NEPH1 PATHWAY | Nephrin/Neph1 signaling in the kidney podocyte |
| 0.0 | 1.6 | PID ALPHA SYNUCLEIN PATHWAY | Alpha-synuclein signaling |
| 0.0 | 0.4 | PID IL2 PI3K PATHWAY | IL2 signaling events mediated by PI3K |
| 0.0 | 1.2 | PID ENDOTHELIN PATHWAY | Endothelins |
| 0.0 | 0.5 | PID AVB3 OPN PATHWAY | Osteopontin-mediated events |
| 0.0 | 1.1 | ST WNT CA2 CYCLIC GMP PATHWAY | Wnt/Ca2+/cyclic GMP signaling. |
| 0.0 | 5.6 | PID MYC ACTIV PATHWAY | Validated targets of C-MYC transcriptional activation |
| 0.0 | 1.0 | PID DNA PK PATHWAY | DNA-PK pathway in nonhomologous end joining |
| 0.0 | 0.3 | PID CXCR4 PATHWAY | CXCR4-mediated signaling events |
| 0.0 | 1.2 | PID BETA CATENIN DEG PATHWAY | Degradation of beta catenin |
| 0.0 | 0.3 | PID IL5 PATHWAY | IL5-mediated signaling events |
| 0.0 | 0.5 | ST G ALPHA I PATHWAY | G alpha i Pathway |
| 0.0 | 1.0 | PID EPHA FWDPATHWAY | EPHA forward signaling |
| 0.0 | 0.5 | PID IL8 CXCR2 PATHWAY | IL8- and CXCR2-mediated signaling events |
| 0.0 | 0.5 | PID P38 ALPHA BETA PATHWAY | Regulation of p38-alpha and p38-beta |
| 0.0 | 1.3 | PID DELTA NP63 PATHWAY | Validated transcriptional targets of deltaNp63 isoforms |
| 0.0 | 0.1 | PID IFNG PATHWAY | IFN-gamma pathway |
| 0.0 | 0.1 | ST GAQ PATHWAY | G alpha q Pathway |
| 0.0 | 1.7 | PID FGF PATHWAY | FGF signaling pathway |
| 0.0 | 0.5 | PID CXCR3 PATHWAY | CXCR3-mediated signaling events |
| 0.0 | 2.9 | PID RHOA REG PATHWAY | Regulation of RhoA activity |
| 0.0 | 1.6 | PID AURORA B PATHWAY | Aurora B signaling |
| 0.0 | 1.1 | PID HIF2PATHWAY | HIF-2-alpha transcription factor network |
| 0.0 | 0.3 | ST ERK1 ERK2 MAPK PATHWAY | ERK1/ERK2 MAPK Pathway |
| 0.0 | 1.2 | PID CASPASE PATHWAY | Caspase cascade in apoptosis |
| 0.0 | 1.5 | PID NFAT TFPATHWAY | Calcineurin-regulated NFAT-dependent transcription in lymphocytes |
| 0.0 | 0.2 | PID IL27 PATHWAY | IL27-mediated signaling events |
| 0.0 | 0.5 | PID SMAD2 3PATHWAY | Regulation of cytoplasmic and nuclear SMAD2/3 signaling |
| 0.0 | 0.2 | PID TCPTP PATHWAY | Signaling events mediated by TCPTP |
| 0.0 | 0.5 | PID ERBB4 PATHWAY | ErbB4 signaling events |
| 0.0 | 0.9 | PID AJDISS 2PATHWAY | Posttranslational regulation of adherens junction stability and dissassembly |
| 0.0 | 0.1 | ST B CELL ANTIGEN RECEPTOR | B Cell Antigen Receptor |
| 0.0 | 1.7 | PID E2F PATHWAY | E2F transcription factor network |
| 0.0 | 0.2 | PID IL2 1PATHWAY | IL2-mediated signaling events |
| 0.0 | 0.1 | PID PDGFRA PATHWAY | PDGFR-alpha signaling pathway |
| 0.0 | 0.3 | PID BMP PATHWAY | BMP receptor signaling |
| 0.0 | 0.0 | PID RANBP2 PATHWAY | Sumoylation by RanBP2 regulates transcriptional repression |
| 0.0 | 0.4 | PID VEGFR1 2 PATHWAY | Signaling events mediated by VEGFR1 and VEGFR2 |
| 0.0 | 0.3 | PID GLYPICAN 1PATHWAY | Glypican 1 network |
| 0.0 | 0.5 | PID TGFBR PATHWAY | TGF-beta receptor signaling |
| 0.0 | 0.4 | PID INTEGRIN A4B1 PATHWAY | Alpha4 beta1 integrin signaling events |
| 0.0 | 0.2 | PID MAPK TRK PATHWAY | Trk receptor signaling mediated by the MAPK pathway |
| 0.0 | 0.2 | ST JNK MAPK PATHWAY | JNK MAPK Pathway |
| 0.0 | 0.0 | SA G1 AND S PHASES | Cdk2, 4, and 6 bind cyclin D in G1, while cdk2/cyclin E promotes the G1/S transition. |
Gene overrepresentation in curated gene sets: REACTOME pathways category:
| Log-likelihood per target | Total log-likelihood | Term | Description |
|---|---|---|---|
| 1.1 | 27.6 | REACTOME APOPTOTIC CLEAVAGE OF CELL ADHESION PROTEINS | Genes involved in Apoptotic cleavage of cell adhesion proteins |
| 0.9 | 21.3 | REACTOME GAP JUNCTION ASSEMBLY | Genes involved in Gap junction assembly |
| 0.8 | 17.6 | REACTOME TGF BETA RECEPTOR SIGNALING IN EMT EPITHELIAL TO MESENCHYMAL TRANSITION | Genes involved in TGF-beta receptor signaling in EMT (epithelial to mesenchymal transition) |
| 0.5 | 20.5 | REACTOME TIGHT JUNCTION INTERACTIONS | Genes involved in Tight junction interactions |
| 0.4 | 14.2 | REACTOME DOWNREGULATION OF ERBB2 ERBB3 SIGNALING | Genes involved in Downregulation of ERBB2:ERBB3 signaling |
| 0.4 | 5.0 | REACTOME RECEPTOR LIGAND BINDING INITIATES THE SECOND PROTEOLYTIC CLEAVAGE OF NOTCH RECEPTOR | Genes involved in Receptor-ligand binding initiates the second proteolytic cleavage of Notch receptor |
| 0.4 | 15.4 | REACTOME UNBLOCKING OF NMDA RECEPTOR GLUTAMATE BINDING AND ACTIVATION | Genes involved in Unblocking of NMDA receptor, glutamate binding and activation |
| 0.3 | 6.4 | REACTOME ACTIVATION OF THE AP1 FAMILY OF TRANSCRIPTION FACTORS | Genes involved in Activation of the AP-1 family of transcription factors |
| 0.3 | 4.2 | REACTOME NEF MEDIATED DOWNREGULATION OF MHC CLASS I COMPLEX CELL SURFACE EXPRESSION | Genes involved in Nef mediated downregulation of MHC class I complex cell surface expression |
| 0.2 | 1.9 | REACTOME P75NTR RECRUITS SIGNALLING COMPLEXES | Genes involved in p75NTR recruits signalling complexes |
| 0.2 | 0.2 | REACTOME REGULATION OF GLUCOKINASE BY GLUCOKINASE REGULATORY PROTEIN | Genes involved in Regulation of Glucokinase by Glucokinase Regulatory Protein |
| 0.2 | 4.5 | REACTOME NFKB ACTIVATION THROUGH FADD RIP1 PATHWAY MEDIATED BY CASPASE 8 AND10 | Genes involved in NF-kB activation through FADD/RIP-1 pathway mediated by caspase-8 and -10 |
| 0.2 | 4.4 | REACTOME ACTIVATION OF RAC | Genes involved in Activation of Rac |
| 0.2 | 5.6 | REACTOME P38MAPK EVENTS | Genes involved in p38MAPK events |
| 0.2 | 2.5 | REACTOME DSCAM INTERACTIONS | Genes involved in DSCAM interactions |
| 0.2 | 4.0 | REACTOME TRANSPORT OF ORGANIC ANIONS | Genes involved in Transport of organic anions |
| 0.2 | 18.8 | REACTOME CELL JUNCTION ORGANIZATION | Genes involved in Cell junction organization |
| 0.2 | 7.4 | REACTOME KINESINS | Genes involved in Kinesins |
| 0.2 | 5.2 | REACTOME TIE2 SIGNALING | Genes involved in Tie2 Signaling |
| 0.2 | 6.0 | REACTOME TRANSPORT OF VITAMINS NUCLEOSIDES AND RELATED MOLECULES | Genes involved in Transport of vitamins, nucleosides, and related molecules |
| 0.2 | 3.7 | REACTOME SIGNALING BY HIPPO | Genes involved in Signaling by Hippo |
| 0.2 | 2.4 | REACTOME ADENYLATE CYCLASE ACTIVATING PATHWAY | Genes involved in Adenylate cyclase activating pathway |
| 0.2 | 6.9 | REACTOME INTERACTION BETWEEN L1 AND ANKYRINS | Genes involved in Interaction between L1 and Ankyrins |
| 0.2 | 3.1 | REACTOME P2Y RECEPTORS | Genes involved in P2Y receptors |
| 0.1 | 0.3 | REACTOME ACTIVATED TAK1 MEDIATES P38 MAPK ACTIVATION | Genes involved in activated TAK1 mediates p38 MAPK activation |
| 0.1 | 3.3 | REACTOME N GLYCAN ANTENNAE ELONGATION | Genes involved in N-Glycan antennae elongation |
| 0.1 | 0.6 | REACTOME SIGNALING BY ERBB2 | Genes involved in Signaling by ERBB2 |
| 0.1 | 4.8 | REACTOME SYNTHESIS OF VERY LONG CHAIN FATTY ACYL COAS | Genes involved in Synthesis of very long-chain fatty acyl-CoAs |
| 0.1 | 0.3 | REACTOME SIGNALING BY FGFR | Genes involved in Signaling by FGFR |
| 0.1 | 12.1 | REACTOME INTERFERON GAMMA SIGNALING | Genes involved in Interferon gamma signaling |
| 0.1 | 2.8 | REACTOME PRE NOTCH PROCESSING IN GOLGI | Genes involved in Pre-NOTCH Processing in Golgi |
| 0.1 | 2.9 | REACTOME FGFR2C LIGAND BINDING AND ACTIVATION | Genes involved in FGFR2c ligand binding and activation |
| 0.1 | 7.6 | REACTOME STRIATED MUSCLE CONTRACTION | Genes involved in Striated Muscle Contraction |
| 0.1 | 1.9 | REACTOME NOD1 2 SIGNALING PATHWAY | Genes involved in NOD1/2 Signaling Pathway |
| 0.1 | 2.0 | REACTOME TANDEM PORE DOMAIN POTASSIUM CHANNELS | Genes involved in Tandem pore domain potassium channels |
| 0.1 | 1.6 | REACTOME APOPTOSIS INDUCED DNA FRAGMENTATION | Genes involved in Apoptosis induced DNA fragmentation |
| 0.1 | 2.4 | REACTOME HDL MEDIATED LIPID TRANSPORT | Genes involved in HDL-mediated lipid transport |
| 0.1 | 5.2 | REACTOME AMINE COMPOUND SLC TRANSPORTERS | Genes involved in Amine compound SLC transporters |
| 0.1 | 0.8 | REACTOME TRAFFICKING OF GLUR2 CONTAINING AMPA RECEPTORS | Genes involved in Trafficking of GluR2-containing AMPA receptors |
| 0.1 | 0.3 | REACTOME FGFR4 LIGAND BINDING AND ACTIVATION | Genes involved in FGFR4 ligand binding and activation |
| 0.1 | 0.3 | REACTOME CROSS PRESENTATION OF SOLUBLE EXOGENOUS ANTIGENS ENDOSOMES | Genes involved in Cross-presentation of soluble exogenous antigens (endosomes) |
| 0.1 | 0.1 | REACTOME PHOSPHORYLATION OF THE APC C | Genes involved in Phosphorylation of the APC/C |
| 0.1 | 0.6 | REACTOME BINDING AND ENTRY OF HIV VIRION | Genes involved in Binding and entry of HIV virion |
| 0.1 | 3.8 | REACTOME HS GAG BIOSYNTHESIS | Genes involved in HS-GAG biosynthesis |
| 0.1 | 2.4 | REACTOME PROTEOLYTIC CLEAVAGE OF SNARE COMPLEX PROTEINS | Genes involved in Proteolytic cleavage of SNARE complex proteins |
| 0.1 | 1.1 | REACTOME CIRCADIAN CLOCK | Genes involved in Circadian Clock |
| 0.1 | 0.3 | REACTOME PLATELET AGGREGATION PLUG FORMATION | Genes involved in Platelet Aggregation (Plug Formation) |
| 0.1 | 4.7 | REACTOME IL1 SIGNALING | Genes involved in Interleukin-1 signaling |
| 0.1 | 1.9 | REACTOME TRAF6 MEDIATED NFKB ACTIVATION | Genes involved in TRAF6 mediated NF-kB activation |
| 0.1 | 3.4 | REACTOME SPHINGOLIPID DE NOVO BIOSYNTHESIS | Genes involved in Sphingolipid de novo biosynthesis |
| 0.1 | 2.6 | REACTOME ENDOSOMAL SORTING COMPLEX REQUIRED FOR TRANSPORT ESCRT | Genes involved in Endosomal Sorting Complex Required For Transport (ESCRT) |
| 0.1 | 0.8 | REACTOME HS GAG DEGRADATION | Genes involved in HS-GAG degradation |
| 0.1 | 1.7 | REACTOME MITOCHONDRIAL TRNA AMINOACYLATION | Genes involved in Mitochondrial tRNA aminoacylation |
| 0.1 | 1.6 | REACTOME FACILITATIVE NA INDEPENDENT GLUCOSE TRANSPORTERS | Genes involved in Facilitative Na+-independent glucose transporters |
| 0.1 | 1.9 | REACTOME CYTOSOLIC SULFONATION OF SMALL MOLECULES | Genes involved in Cytosolic sulfonation of small molecules |
| 0.1 | 5.8 | REACTOME GOLGI ASSOCIATED VESICLE BIOGENESIS | Genes involved in Golgi Associated Vesicle Biogenesis |
| 0.1 | 6.2 | REACTOME CLASS B 2 SECRETIN FAMILY RECEPTORS | Genes involved in Class B/2 (Secretin family receptors) |
| 0.1 | 3.0 | REACTOME METABOLISM OF STEROID HORMONES AND VITAMINS A AND D | Genes involved in Metabolism of steroid hormones and vitamins A and D |
| 0.1 | 0.3 | REACTOME ACYL CHAIN REMODELLING OF PI | Genes involved in Acyl chain remodelling of PI |
| 0.1 | 2.7 | REACTOME AMINO ACID TRANSPORT ACROSS THE PLASMA MEMBRANE | Genes involved in Amino acid transport across the plasma membrane |
| 0.1 | 0.6 | REACTOME ELEVATION OF CYTOSOLIC CA2 LEVELS | Genes involved in Elevation of cytosolic Ca2+ levels |
| 0.1 | 1.4 | REACTOME OTHER SEMAPHORIN INTERACTIONS | Genes involved in Other semaphorin interactions |
| 0.1 | 0.6 | REACTOME ER PHAGOSOME PATHWAY | Genes involved in ER-Phagosome pathway |
| 0.1 | 0.9 | REACTOME ACYL CHAIN REMODELLING OF PS | Genes involved in Acyl chain remodelling of PS |
| 0.1 | 2.7 | REACTOME ION TRANSPORT BY P TYPE ATPASES | Genes involved in Ion transport by P-type ATPases |
| 0.1 | 0.9 | REACTOME REGULATION OF PYRUVATE DEHYDROGENASE PDH COMPLEX | Genes involved in Regulation of pyruvate dehydrogenase (PDH) complex |
| 0.1 | 1.3 | REACTOME PURINE SALVAGE | Genes involved in Purine salvage |
| 0.1 | 1.9 | REACTOME G0 AND EARLY G1 | Genes involved in G0 and Early G1 |
| 0.1 | 4.0 | REACTOME REGULATION OF WATER BALANCE BY RENAL AQUAPORINS | Genes involved in Regulation of Water Balance by Renal Aquaporins |
| 0.0 | 0.1 | REACTOME VIRAL MESSENGER RNA SYNTHESIS | Genes involved in Viral Messenger RNA Synthesis |
| 0.0 | 0.4 | REACTOME SHC1 EVENTS IN ERBB4 SIGNALING | Genes involved in SHC1 events in ERBB4 signaling |
| 0.0 | 0.9 | REACTOME MTORC1 MEDIATED SIGNALLING | Genes involved in mTORC1-mediated signalling |
| 0.0 | 1.2 | REACTOME RNA POL III CHAIN ELONGATION | Genes involved in RNA Polymerase III Chain Elongation |
| 0.0 | 0.8 | REACTOME PURINE CATABOLISM | Genes involved in Purine catabolism |
| 0.0 | 0.3 | REACTOME ACTIVATION OF NF KAPPAB IN B CELLS | Genes involved in Activation of NF-kappaB in B Cells |
| 0.0 | 0.2 | REACTOME APC C CDH1 MEDIATED DEGRADATION OF CDC20 AND OTHER APC C CDH1 TARGETED PROTEINS IN LATE MITOSIS EARLY G1 | Genes involved in APC/C:Cdh1 mediated degradation of Cdc20 and other APC/C:Cdh1 targeted proteins in late mitosis/early G1 |
| 0.0 | 4.4 | REACTOME L1CAM INTERACTIONS | Genes involved in L1CAM interactions |
| 0.0 | 0.9 | REACTOME EXTRINSIC PATHWAY FOR APOPTOSIS | Genes involved in Extrinsic Pathway for Apoptosis |
| 0.0 | 2.1 | REACTOME MYOGENESIS | Genes involved in Myogenesis |
| 0.0 | 0.6 | REACTOME METABOLISM OF POLYAMINES | Genes involved in Metabolism of polyamines |
| 0.0 | 0.4 | REACTOME THE ROLE OF NEF IN HIV1 REPLICATION AND DISEASE PATHOGENESIS | Genes involved in The role of Nef in HIV-1 replication and disease pathogenesis |
| 0.0 | 0.9 | REACTOME PERK REGULATED GENE EXPRESSION | Genes involved in PERK regulated gene expression |
| 0.0 | 0.8 | REACTOME KERATAN SULFATE BIOSYNTHESIS | Genes involved in Keratan sulfate biosynthesis |
| 0.0 | 1.8 | REACTOME REGULATION OF HYPOXIA INDUCIBLE FACTOR HIF BY OXYGEN | Genes involved in Regulation of Hypoxia-inducible Factor (HIF) by Oxygen |
| 0.0 | 0.2 | REACTOME CD28 DEPENDENT VAV1 PATHWAY | Genes involved in CD28 dependent Vav1 pathway |
| 0.0 | 0.4 | REACTOME SIGNALING BY CONSTITUTIVELY ACTIVE EGFR | Genes involved in Signaling by constitutively active EGFR |
| 0.0 | 0.7 | REACTOME TRANSCRIPTIONAL REGULATION OF WHITE ADIPOCYTE DIFFERENTIATION | Genes involved in Transcriptional Regulation of White Adipocyte Differentiation |
| 0.0 | 0.2 | REACTOME INHIBITION OF THE PROTEOLYTIC ACTIVITY OF APC C REQUIRED FOR THE ONSET OF ANAPHASE BY MITOTIC SPINDLE CHECKPOINT COMPONENTS | Genes involved in Inhibition of the proteolytic activity of APC/C required for the onset of anaphase by mitotic spindle checkpoint components |
| 0.0 | 1.1 | REACTOME CYTOKINE SIGNALING IN IMMUNE SYSTEM | Genes involved in Cytokine Signaling in Immune system |
| 0.0 | 0.6 | REACTOME XENOBIOTICS | Genes involved in Xenobiotics |
| 0.0 | 0.4 | REACTOME THE NLRP3 INFLAMMASOME | Genes involved in The NLRP3 inflammasome |
| 0.0 | 2.1 | REACTOME PHASE1 FUNCTIONALIZATION OF COMPOUNDS | Genes involved in Phase 1 - Functionalization of compounds |
| 0.0 | 0.8 | REACTOME DESTABILIZATION OF MRNA BY KSRP | Genes involved in Destabilization of mRNA by KSRP |
| 0.0 | 3.9 | REACTOME TRANSPORT OF INORGANIC CATIONS ANIONS AND AMINO ACIDS OLIGOPEPTIDES | Genes involved in Transport of inorganic cations/anions and amino acids/oligopeptides |
| 0.0 | 0.4 | REACTOME SPRY REGULATION OF FGF SIGNALING | Genes involved in Spry regulation of FGF signaling |
| 0.0 | 1.0 | REACTOME BETA DEFENSINS | Genes involved in Beta defensins |
| 0.0 | 0.3 | REACTOME G ALPHA S SIGNALLING EVENTS | Genes involved in G alpha (s) signalling events |
| 0.0 | 0.4 | REACTOME PROLACTIN RECEPTOR SIGNALING | Genes involved in Prolactin receptor signaling |
| 0.0 | 1.3 | REACTOME ASSOCIATION OF TRIC CCT WITH TARGET PROTEINS DURING BIOSYNTHESIS | Genes involved in Association of TriC/CCT with target proteins during biosynthesis |
| 0.0 | 0.6 | REACTOME GRB2 SOS PROVIDES LINKAGE TO MAPK SIGNALING FOR INTERGRINS | Genes involved in GRB2:SOS provides linkage to MAPK signaling for Intergrins |
| 0.0 | 0.8 | REACTOME SULFUR AMINO ACID METABOLISM | Genes involved in Sulfur amino acid metabolism |
| 0.0 | 0.4 | REACTOME PYRIMIDINE CATABOLISM | Genes involved in Pyrimidine catabolism |
| 0.0 | 0.4 | REACTOME TRAFFICKING AND PROCESSING OF ENDOSOMAL TLR | Genes involved in Trafficking and processing of endosomal TLR |
| 0.0 | 0.9 | REACTOME SIGNALING BY BMP | Genes involved in Signaling by BMP |
| 0.0 | 1.7 | REACTOME CHEMOKINE RECEPTORS BIND CHEMOKINES | Genes involved in Chemokine receptors bind chemokines |
| 0.0 | 0.3 | REACTOME CYTOSOLIC TRNA AMINOACYLATION | Genes involved in Cytosolic tRNA aminoacylation |
| 0.0 | 0.3 | REACTOME E2F ENABLED INHIBITION OF PRE REPLICATION COMPLEX FORMATION | Genes involved in E2F-enabled inhibition of pre-replication complex formation |
| 0.0 | 0.1 | REACTOME FGFR1 LIGAND BINDING AND ACTIVATION | Genes involved in FGFR1 ligand binding and activation |
| 0.0 | 0.4 | REACTOME PD1 SIGNALING | Genes involved in PD-1 signaling |
| 0.0 | 0.3 | REACTOME CD28 DEPENDENT PI3K AKT SIGNALING | Genes involved in CD28 dependent PI3K/Akt signaling |
| 0.0 | 0.5 | REACTOME GLUCURONIDATION | Genes involved in Glucuronidation |
| 0.0 | 0.3 | REACTOME RNA POL III TRANSCRIPTION INITIATION FROM TYPE 2 PROMOTER | Genes involved in RNA Polymerase III Transcription Initiation From Type 2 Promoter |
| 0.0 | 0.1 | REACTOME TRANSFERRIN ENDOCYTOSIS AND RECYCLING | Genes involved in Transferrin endocytosis and recycling |
| 0.0 | 1.6 | REACTOME MITOCHONDRIAL PROTEIN IMPORT | Genes involved in Mitochondrial Protein Import |
| 0.0 | 0.5 | REACTOME INTRINSIC PATHWAY | Genes involved in Intrinsic Pathway |
| 0.0 | 0.2 | REACTOME REGULATION OF ORNITHINE DECARBOXYLASE ODC | Genes involved in Regulation of ornithine decarboxylase (ODC) |
| 0.0 | 0.1 | REACTOME G BETA GAMMA SIGNALLING THROUGH PLC BETA | Genes involved in G beta:gamma signalling through PLC beta |
| 0.0 | 0.2 | REACTOME REGULATION OF INSULIN SECRETION BY GLUCAGON LIKE PEPTIDE1 | Genes involved in Regulation of Insulin Secretion by Glucagon-like Peptide-1 |
| 0.0 | 0.5 | REACTOME REGULATION OF SIGNALING BY CBL | Genes involved in Regulation of signaling by CBL |
| 0.0 | 0.5 | REACTOME RNA POL I TRANSCRIPTION TERMINATION | Genes involved in RNA Polymerase I Transcription Termination |
| 0.0 | 0.1 | REACTOME ADP SIGNALLING THROUGH P2RY12 | Genes involved in ADP signalling through P2Y purinoceptor 12 |
| 0.0 | 0.9 | REACTOME LATENT INFECTION OF HOMO SAPIENS WITH MYCOBACTERIUM TUBERCULOSIS | Genes involved in Latent infection of Homo sapiens with Mycobacterium tuberculosis |
| 0.0 | 0.2 | REACTOME PACKAGING OF TELOMERE ENDS | Genes involved in Packaging Of Telomere Ends |
| 0.0 | 0.0 | REACTOME PROSTACYCLIN SIGNALLING THROUGH PROSTACYCLIN RECEPTOR | Genes involved in Prostacyclin signalling through prostacyclin receptor |
| 0.0 | 0.3 | REACTOME CREATION OF C4 AND C2 ACTIVATORS | Genes involved in Creation of C4 and C2 activators |
| 0.0 | 0.1 | REACTOME RIP MEDIATED NFKB ACTIVATION VIA DAI | Genes involved in RIP-mediated NFkB activation via DAI |
| 0.0 | 0.0 | REACTOME BOTULINUM NEUROTOXICITY | Genes involved in Botulinum neurotoxicity |
| 0.0 | 0.4 | REACTOME SYNTHESIS OF GLYCOSYLPHOSPHATIDYLINOSITOL GPI | Genes involved in Synthesis of glycosylphosphatidylinositol (GPI) |
| 0.0 | 0.1 | REACTOME INFLAMMASOMES | Genes involved in Inflammasomes |
| 0.0 | 0.6 | REACTOME MEIOTIC RECOMBINATION | Genes involved in Meiotic Recombination |
| 0.0 | 0.3 | REACTOME DOUBLE STRAND BREAK REPAIR | Genes involved in Double-Strand Break Repair |
| 0.0 | 0.1 | REACTOME ERKS ARE INACTIVATED | Genes involved in ERKs are inactivated |
| 0.0 | 0.5 | REACTOME AMYLOIDS | Genes involved in Amyloids |
| 0.0 | 0.4 | REACTOME AMINO ACID SYNTHESIS AND INTERCONVERSION TRANSAMINATION | Genes involved in Amino acid synthesis and interconversion (transamination) |
| 0.0 | 1.0 | REACTOME VOLTAGE GATED POTASSIUM CHANNELS | Genes involved in Voltage gated Potassium channels |
| 0.0 | 0.1 | REACTOME SHC MEDIATED CASCADE | Genes involved in SHC-mediated cascade |
| 0.0 | 0.1 | REACTOME ABACAVIR TRANSPORT AND METABOLISM | Genes involved in Abacavir transport and metabolism |
| 0.0 | 1.6 | REACTOME OLFACTORY SIGNALING PATHWAY | Genes involved in Olfactory Signaling Pathway |
| 0.0 | 1.6 | REACTOME PEPTIDE LIGAND BINDING RECEPTORS | Genes involved in Peptide ligand-binding receptors |
| 0.0 | 0.4 | REACTOME SEMA4D INDUCED CELL MIGRATION AND GROWTH CONE COLLAPSE | Genes involved in Sema4D induced cell migration and growth-cone collapse |
| 0.0 | 0.0 | REACTOME ERK MAPK TARGETS | Genes involved in ERK/MAPK targets |