Project
Epithelial-Mesenchymal Transition, human (Scheel, 2011)
Navigation
Downloads
Results for IRF6_IRF4_IRF5
Z-value: 0.98
Motif logo
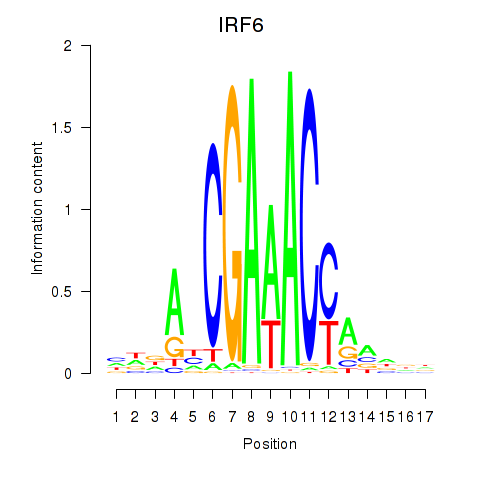
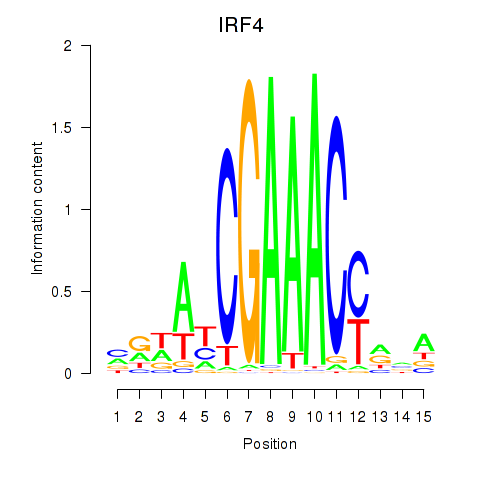
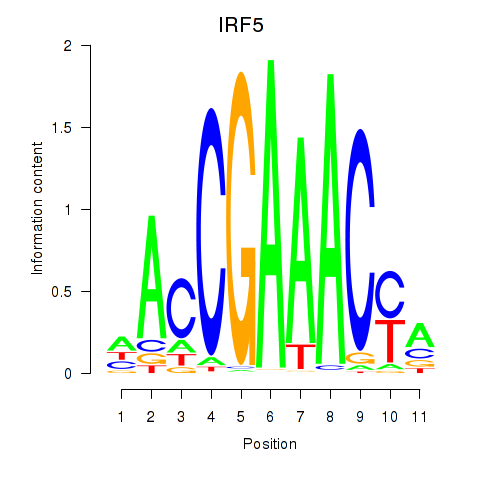
Transcription factors associated with IRF6_IRF4_IRF5
| Gene Symbol | Gene ID | Gene Info |
|---|---|---|
|
IRF6
|
ENSG00000117595.12 | interferon regulatory factor 6 |
|
IRF4
|
ENSG00000137265.15 | interferon regulatory factor 4 |
|
IRF5
|
ENSG00000128604.20 | interferon regulatory factor 5 |
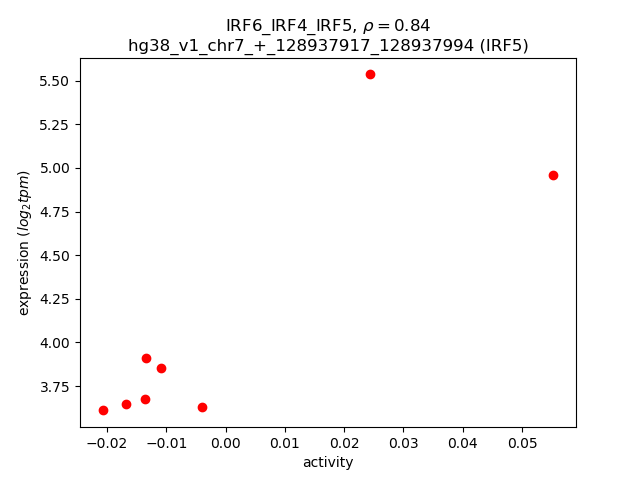
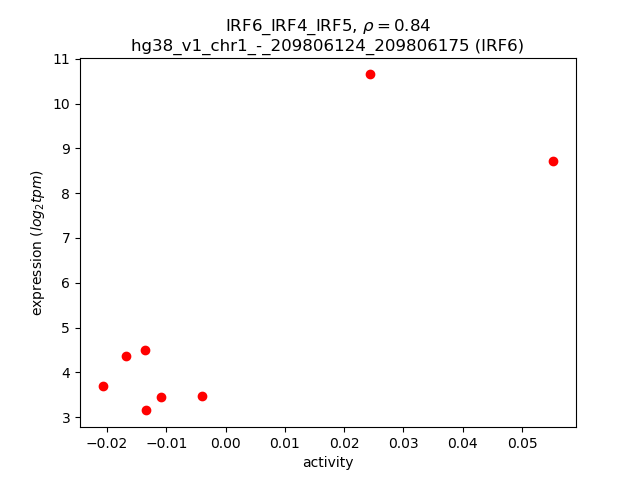
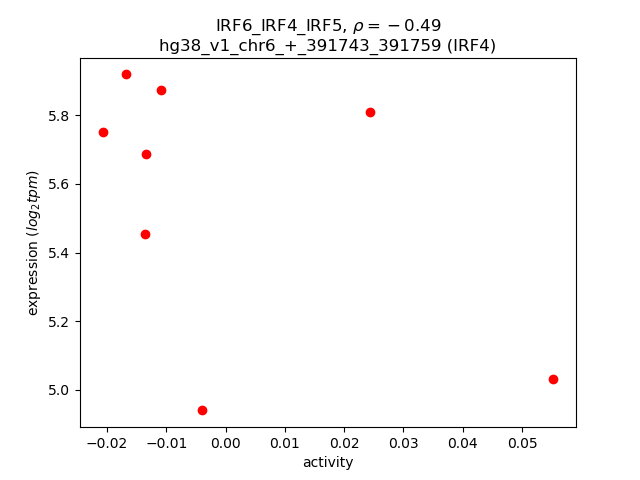
Activity-expression correlation:
| Gene | Promoter | Pearson corr. coef. | P-value | Plot |
|---|---|---|---|---|
| IRF5 | hg38_v1_chr7_+_128937917_128937994 | 0.84 | 9.3e-03 | Click! |
| IRF6 | hg38_v1_chr1_-_209806124_209806175 | 0.84 | 9.7e-03 | Click! |
| IRF4 | hg38_v1_chr6_+_391743_391759 | -0.49 | 2.2e-01 | Click! |
Activity profile of IRF6_IRF4_IRF5 motif
Sorted Z-values of IRF6_IRF4_IRF5 motif
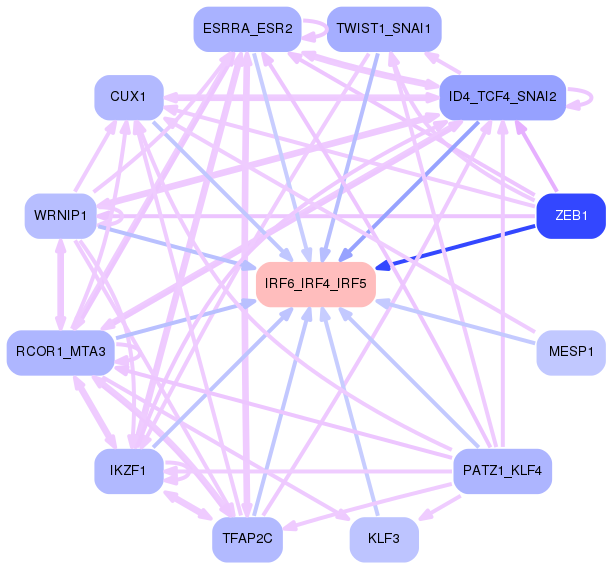
Network of associatons between targets according to the STRING database.

First level regulatory network of IRF6_IRF4_IRF5
Gene Ontology Analysis
Gene overrepresentation in biological process category:
| Log-likelihood per target | Total log-likelihood | Term | Description |
|---|---|---|---|
| 0.8 | 3.2 | GO:0032597 | B cell receptor transport within lipid bilayer(GO:0032595) B cell receptor transport into membrane raft(GO:0032597) protein transport out of membrane raft(GO:0032599) chemokine receptor transport out of membrane raft(GO:0032600) negative regulation of transforming growth factor beta3 production(GO:0032913) chemokine receptor transport within lipid bilayer(GO:0033606) |
| 0.3 | 1.5 | GO:0034344 | type III interferon production(GO:0034343) regulation of type III interferon production(GO:0034344) |
| 0.3 | 3.4 | GO:0060700 | regulation of ribonuclease activity(GO:0060700) |
| 0.2 | 1.3 | GO:2001181 | positive regulation of interleukin-10 secretion(GO:2001181) |
| 0.2 | 0.3 | GO:0002428 | antigen processing and presentation of peptide antigen via MHC class Ib(GO:0002428) |
| 0.2 | 0.6 | GO:0060671 | epithelial cell differentiation involved in embryonic placenta development(GO:0060671) epithelial cell morphogenesis involved in placental branching(GO:0060672) |
| 0.1 | 2.8 | GO:0003373 | dynamin polymerization involved in membrane fission(GO:0003373) dynamin polymerization involved in mitochondrial fission(GO:0003374) |
| 0.1 | 0.4 | GO:1990654 | regulation of extrathymic T cell differentiation(GO:0033082) sebum secreting cell proliferation(GO:1990654) |
| 0.1 | 0.8 | GO:0090191 | negative regulation of branching involved in ureteric bud morphogenesis(GO:0090191) |
| 0.1 | 0.4 | GO:0034758 | regulation of antigen processing and presentation of peptide antigen via MHC class I(GO:0002589) negative regulation of antigen processing and presentation of peptide antigen via MHC class I(GO:0002590) regulation of T cell antigen processing and presentation(GO:0002625) positive regulation of iron ion transport(GO:0034758) positive regulation of iron ion transmembrane transport(GO:0034761) regulation of iron ion import(GO:1900390) regulation of ferrous iron import into cell(GO:1903989) positive regulation of ferrous iron import into cell(GO:1903991) regulation of ferrous iron binding(GO:1904432) positive regulation of ferrous iron binding(GO:1904434) regulation of transferrin receptor binding(GO:1904435) positive regulation of transferrin receptor binding(GO:1904437) regulation of ferrous iron import across plasma membrane(GO:1904438) positive regulation of ferrous iron import across plasma membrane(GO:1904440) response to iron ion starvation(GO:1990641) |
| 0.1 | 0.4 | GO:1901994 | meiotic cell cycle phase transition(GO:0044771) regulation of meiotic cell cycle phase transition(GO:1901993) negative regulation of meiotic cell cycle phase transition(GO:1901994) |
| 0.1 | 0.4 | GO:0043311 | positive regulation of eosinophil degranulation(GO:0043311) positive regulation of eosinophil activation(GO:1902568) |
| 0.1 | 0.5 | GO:0071109 | superior temporal gyrus development(GO:0071109) |
| 0.1 | 0.3 | GO:0000964 | mitochondrial RNA 5'-end processing(GO:0000964) rRNA import into mitochondrion(GO:0035928) |
| 0.1 | 1.0 | GO:0070673 | response to interleukin-18(GO:0070673) |
| 0.1 | 2.9 | GO:0016338 | calcium-independent cell-cell adhesion via plasma membrane cell-adhesion molecules(GO:0016338) |
| 0.1 | 0.6 | GO:0015712 | hexose phosphate transport(GO:0015712) glucose-6-phosphate transport(GO:0015760) |
| 0.1 | 0.4 | GO:0034165 | positive regulation of toll-like receptor 9 signaling pathway(GO:0034165) |
| 0.1 | 0.2 | GO:0061536 | glycine secretion(GO:0061536) glycine secretion, neurotransmission(GO:0061537) |
| 0.1 | 0.1 | GO:0002857 | positive regulation of natural killer cell mediated immune response to tumor cell(GO:0002857) positive regulation of natural killer cell mediated cytotoxicity directed against tumor cell target(GO:0002860) |
| 0.1 | 0.3 | GO:1900245 | positive regulation of MDA-5 signaling pathway(GO:1900245) |
| 0.1 | 0.8 | GO:0060982 | coronary artery morphogenesis(GO:0060982) |
| 0.1 | 0.2 | GO:0009139 | dUDP biosynthetic process(GO:0006227) dTDP biosynthetic process(GO:0006233) pyrimidine nucleoside diphosphate biosynthetic process(GO:0009139) pyrimidine deoxyribonucleoside diphosphate metabolic process(GO:0009196) pyrimidine deoxyribonucleoside diphosphate biosynthetic process(GO:0009197) dTDP metabolic process(GO:0046072) dUDP metabolic process(GO:0046077) |
| 0.1 | 0.2 | GO:0015917 | aminophospholipid transport(GO:0015917) |
| 0.0 | 0.2 | GO:1901350 | cell-cell signaling involved in cell-cell junction organization(GO:1901350) |
| 0.0 | 0.2 | GO:0019556 | histidine catabolic process to glutamate and formamide(GO:0019556) histidine catabolic process to glutamate and formate(GO:0019557) formamide metabolic process(GO:0043606) |
| 0.0 | 0.2 | GO:0038161 | prolactin signaling pathway(GO:0038161) |
| 0.0 | 0.2 | GO:1904694 | negative regulation of vascular smooth muscle contraction(GO:1904694) |
| 0.0 | 0.1 | GO:0019413 | acetate biosynthetic process(GO:0019413) acetyl-CoA biosynthetic process from acetate(GO:0019427) propionate biosynthetic process(GO:0019542) |
| 0.0 | 0.7 | GO:0045741 | positive regulation of epidermal growth factor-activated receptor activity(GO:0045741) |
| 0.0 | 0.3 | GO:0007000 | nucleolus organization(GO:0007000) |
| 0.0 | 0.1 | GO:0035498 | carnosine metabolic process(GO:0035498) |
| 0.0 | 0.5 | GO:0051964 | negative regulation of synapse assembly(GO:0051964) |
| 0.0 | 6.2 | GO:0007156 | homophilic cell adhesion via plasma membrane adhesion molecules(GO:0007156) |
| 0.0 | 0.3 | GO:0006189 | 'de novo' IMP biosynthetic process(GO:0006189) |
| 0.0 | 0.1 | GO:0050823 | peptide stabilization(GO:0050822) peptide antigen stabilization(GO:0050823) |
| 0.0 | 0.5 | GO:0090557 | establishment of endothelial intestinal barrier(GO:0090557) |
| 0.0 | 0.2 | GO:0048312 | intracellular distribution of mitochondria(GO:0048312) |
| 0.0 | 0.2 | GO:0051754 | meiotic sister chromatid cohesion, centromeric(GO:0051754) |
| 0.0 | 0.2 | GO:0030259 | lipid glycosylation(GO:0030259) |
| 0.0 | 0.2 | GO:0010989 | negative regulation of low-density lipoprotein particle clearance(GO:0010989) |
| 0.0 | 0.1 | GO:0010513 | positive regulation of phosphatidylinositol biosynthetic process(GO:0010513) |
| 0.0 | 0.1 | GO:0035610 | protein side chain deglutamylation(GO:0035610) |
| 0.0 | 0.3 | GO:0006600 | creatine metabolic process(GO:0006600) |
| 0.0 | 0.2 | GO:0090050 | positive regulation of cell migration involved in sprouting angiogenesis(GO:0090050) |
| 0.0 | 0.2 | GO:0010533 | regulation of activation of Janus kinase activity(GO:0010533) |
| 0.0 | 0.9 | GO:0030206 | chondroitin sulfate biosynthetic process(GO:0030206) |
| 0.0 | 0.1 | GO:0033634 | positive regulation of cell-cell adhesion mediated by integrin(GO:0033634) |
| 0.0 | 0.1 | GO:0006667 | sphinganine metabolic process(GO:0006667) |
| 0.0 | 0.6 | GO:0035728 | response to hepatocyte growth factor(GO:0035728) |
| 0.0 | 0.1 | GO:1901355 | response to rapamycin(GO:1901355) |
| 0.0 | 0.1 | GO:0051182 | coenzyme transport(GO:0051182) |
| 0.0 | 0.3 | GO:0010818 | T cell chemotaxis(GO:0010818) |
| 0.0 | 1.9 | GO:0006024 | glycosaminoglycan biosynthetic process(GO:0006024) |
| 0.0 | 0.2 | GO:0009414 | response to water deprivation(GO:0009414) |
| 0.0 | 0.9 | GO:0036075 | endochondral ossification(GO:0001958) replacement ossification(GO:0036075) |
| 0.0 | 0.4 | GO:0007250 | activation of NF-kappaB-inducing kinase activity(GO:0007250) |
| 0.0 | 0.1 | GO:1900383 | regulation of synaptic plasticity by receptor localization to synapse(GO:1900383) |
| 0.0 | 0.0 | GO:0045715 | negative regulation of low-density lipoprotein particle receptor biosynthetic process(GO:0045715) |
| 0.0 | 0.1 | GO:0070940 | dephosphorylation of RNA polymerase II C-terminal domain(GO:0070940) |
| 0.0 | 0.2 | GO:0070257 | positive regulation of mucus secretion(GO:0070257) |
| 0.0 | 0.2 | GO:0097201 | negative regulation of transcription from RNA polymerase II promoter in response to stress(GO:0097201) |
| 0.0 | 0.1 | GO:0070389 | chaperone cofactor-dependent protein refolding(GO:0070389) |
| 0.0 | 0.0 | GO:0030573 | bile acid catabolic process(GO:0030573) |
Gene overrepresentation in cellular component category:
| Log-likelihood per target | Total log-likelihood | Term | Description |
|---|---|---|---|
| 0.3 | 0.9 | GO:0030936 | collagen type XIII trimer(GO:0005600) transmembrane collagen trimer(GO:0030936) |
| 0.1 | 1.5 | GO:0043203 | axon hillock(GO:0043203) |
| 0.1 | 3.2 | GO:0031362 | anchored component of external side of plasma membrane(GO:0031362) |
| 0.1 | 0.3 | GO:0097233 | lamellar body membrane(GO:0097232) alveolar lamellar body membrane(GO:0097233) |
| 0.1 | 0.4 | GO:1990357 | terminal web(GO:1990357) |
| 0.1 | 2.0 | GO:0016327 | apicolateral plasma membrane(GO:0016327) |
| 0.1 | 0.8 | GO:0036056 | filtration diaphragm(GO:0036056) slit diaphragm(GO:0036057) |
| 0.1 | 0.4 | GO:0042825 | TAP complex(GO:0042825) |
| 0.0 | 0.2 | GO:0071008 | U2-type post-mRNA release spliceosomal complex(GO:0071008) |
| 0.0 | 0.2 | GO:0000942 | condensed nuclear chromosome outer kinetochore(GO:0000942) |
| 0.0 | 0.2 | GO:0097425 | smooth endoplasmic reticulum membrane(GO:0030868) smooth endoplasmic reticulum part(GO:0097425) |
| 0.0 | 0.1 | GO:0001534 | radial spoke(GO:0001534) |
| 0.0 | 1.5 | GO:0009925 | basal plasma membrane(GO:0009925) |
| 0.0 | 0.5 | GO:0033010 | paranodal junction(GO:0033010) |
| 0.0 | 0.3 | GO:0042788 | polysomal ribosome(GO:0042788) |
| 0.0 | 0.2 | GO:0070449 | elongin complex(GO:0070449) |
| 0.0 | 0.2 | GO:0097427 | microtubule bundle(GO:0097427) |
| 0.0 | 0.3 | GO:0005736 | DNA-directed RNA polymerase I complex(GO:0005736) |
| 0.0 | 1.9 | GO:0005796 | Golgi lumen(GO:0005796) |
| 0.0 | 2.5 | GO:0005923 | bicellular tight junction(GO:0005923) |
| 0.0 | 0.7 | GO:0090544 | BAF-type complex(GO:0090544) |
| 0.0 | 0.1 | GO:0097452 | GAIT complex(GO:0097452) |
| 0.0 | 0.0 | GO:0034686 | integrin alphav-beta8 complex(GO:0034686) |
Gene overrepresentation in molecular function category:
| Log-likelihood per target | Total log-likelihood | Term | Description |
|---|---|---|---|
| 0.3 | 1.9 | GO:0008467 | [heparan sulfate]-glucosamine 3-sulfotransferase 1 activity(GO:0008467) |
| 0.2 | 3.4 | GO:0001730 | 2'-5'-oligoadenylate synthetase activity(GO:0001730) |
| 0.1 | 0.9 | GO:0050659 | N-acetylgalactosamine 4-sulfate 6-O-sulfotransferase activity(GO:0050659) |
| 0.1 | 0.6 | GO:0015315 | hexose phosphate transmembrane transporter activity(GO:0015119) organophosphate:inorganic phosphate antiporter activity(GO:0015315) hexose-phosphate:inorganic phosphate antiporter activity(GO:0015526) glucose 6-phosphate:inorganic phosphate antiporter activity(GO:0061513) |
| 0.1 | 0.5 | GO:0016524 | latrotoxin receptor activity(GO:0016524) |
| 0.1 | 0.4 | GO:0015433 | peptide antigen-transporting ATPase activity(GO:0015433) |
| 0.1 | 3.2 | GO:0030296 | protein tyrosine kinase activator activity(GO:0030296) |
| 0.1 | 1.5 | GO:0043560 | insulin receptor substrate binding(GO:0043560) |
| 0.1 | 0.3 | GO:0016882 | cyclo-ligase activity(GO:0016882) |
| 0.1 | 0.2 | GO:0004925 | prolactin receptor activity(GO:0004925) |
| 0.1 | 0.4 | GO:0015057 | thrombin receptor activity(GO:0015057) |
| 0.1 | 0.2 | GO:0015375 | glycine:sodium symporter activity(GO:0015375) |
| 0.1 | 0.2 | GO:0004798 | thymidylate kinase activity(GO:0004798) |
| 0.0 | 0.2 | GO:0016841 | ammonia-lyase activity(GO:0016841) |
| 0.0 | 0.2 | GO:0030226 | apolipoprotein receptor activity(GO:0030226) |
| 0.0 | 0.1 | GO:0008665 | 2'-phosphotransferase activity(GO:0008665) |
| 0.0 | 0.3 | GO:0034046 | poly(G) binding(GO:0034046) |
| 0.0 | 0.1 | GO:0045569 | TRAIL binding(GO:0045569) |
| 0.0 | 0.2 | GO:0043208 | glycosphingolipid binding(GO:0043208) |
| 0.0 | 0.1 | GO:0003987 | acetate-CoA ligase activity(GO:0003987) |
| 0.0 | 0.1 | GO:0008988 | rRNA (adenine-N6-)-methyltransferase activity(GO:0008988) |
| 0.0 | 0.4 | GO:0039706 | co-receptor binding(GO:0039706) |
| 0.0 | 0.7 | GO:0005229 | intracellular calcium activated chloride channel activity(GO:0005229) |
| 0.0 | 0.1 | GO:0051185 | coenzyme transporter activity(GO:0051185) |
| 0.0 | 0.3 | GO:0000774 | adenyl-nucleotide exchange factor activity(GO:0000774) |
| 0.0 | 0.1 | GO:0005143 | interleukin-12 receptor binding(GO:0005143) |
| 0.0 | 0.1 | GO:0004991 | parathyroid hormone receptor activity(GO:0004991) |
| 0.0 | 0.1 | GO:0000035 | acyl binding(GO:0000035) |
| 0.0 | 0.4 | GO:0008432 | JUN kinase binding(GO:0008432) |
| 0.0 | 0.2 | GO:0008440 | inositol-1,4,5-trisphosphate 3-kinase activity(GO:0008440) |
| 0.0 | 0.4 | GO:0070006 | metalloaminopeptidase activity(GO:0070006) |
| 0.0 | 0.3 | GO:0001054 | RNA polymerase I activity(GO:0001054) |
| 0.0 | 0.1 | GO:0002161 | aminoacyl-tRNA editing activity(GO:0002161) |
| 0.0 | 0.0 | GO:0042954 | lipoprotein transporter activity(GO:0042954) |
| 0.0 | 0.1 | GO:0016454 | serine C-palmitoyltransferase activity(GO:0004758) C-palmitoyltransferase activity(GO:0016454) |
| 0.0 | 0.2 | GO:0032041 | histone deacetylase activity (H3-K14 specific)(GO:0031078) NAD-dependent histone deacetylase activity (H3-K14 specific)(GO:0032041) |
| 0.0 | 0.6 | GO:0016303 | 1-phosphatidylinositol-3-kinase activity(GO:0016303) |
| 0.0 | 0.1 | GO:0000995 | transcription factor activity, core RNA polymerase III binding(GO:0000995) |
| 0.0 | 0.1 | GO:0045029 | UDP-activated nucleotide receptor activity(GO:0045029) |
| 0.0 | 0.5 | GO:0003950 | NAD+ ADP-ribosyltransferase activity(GO:0003950) |
Gene overrepresentation in curated gene sets: canonical pathways category:
| Log-likelihood per target | Total log-likelihood | Term | Description |
|---|---|---|---|
| 0.0 | 1.5 | PID INSULIN GLUCOSE PATHWAY | Insulin-mediated glucose transport |
| 0.0 | 1.2 | PID NECTIN PATHWAY | Nectin adhesion pathway |
| 0.0 | 0.8 | PID ERBB NETWORK PATHWAY | ErbB receptor signaling network |
| 0.0 | 0.7 | ST JNK MAPK PATHWAY | JNK MAPK Pathway |
| 0.0 | 0.4 | ST GA12 PATHWAY | G alpha 12 Pathway |
| 0.0 | 1.0 | PID TGFBR PATHWAY | TGF-beta receptor signaling |
Gene overrepresentation in curated gene sets: REACTOME pathways category:
| Log-likelihood per target | Total log-likelihood | Term | Description |
|---|---|---|---|
| 0.1 | 2.3 | REACTOME TGF BETA RECEPTOR SIGNALING IN EMT EPITHELIAL TO MESENCHYMAL TRANSITION | Genes involved in TGF-beta receptor signaling in EMT (epithelial to mesenchymal transition) |
| 0.1 | 1.2 | REACTOME NFKB ACTIVATION THROUGH FADD RIP1 PATHWAY MEDIATED BY CASPASE 8 AND10 | Genes involved in NF-kB activation through FADD/RIP-1 pathway mediated by caspase-8 and -10 |
| 0.0 | 1.2 | REACTOME APOPTOTIC CLEAVAGE OF CELL ADHESION PROTEINS | Genes involved in Apoptotic cleavage of cell adhesion proteins |
| 0.0 | 1.9 | REACTOME HS GAG BIOSYNTHESIS | Genes involved in HS-GAG biosynthesis |
| 0.0 | 3.9 | REACTOME INTERFERON ALPHA BETA SIGNALING | Genes involved in Interferon alpha/beta signaling |
| 0.0 | 1.3 | REACTOME TIGHT JUNCTION INTERACTIONS | Genes involved in Tight junction interactions |
| 0.0 | 0.9 | REACTOME CHONDROITIN SULFATE BIOSYNTHESIS | Genes involved in Chondroitin sulfate biosynthesis |
| 0.0 | 0.6 | REACTOME SIGNALING BY CONSTITUTIVELY ACTIVE EGFR | Genes involved in Signaling by constitutively active EGFR |
| 0.0 | 0.4 | REACTOME GRB2 SOS PROVIDES LINKAGE TO MAPK SIGNALING FOR INTERGRINS | Genes involved in GRB2:SOS provides linkage to MAPK signaling for Intergrins |
| 0.0 | 0.3 | REACTOME PURINE RIBONUCLEOSIDE MONOPHOSPHATE BIOSYNTHESIS | Genes involved in Purine ribonucleoside monophosphate biosynthesis |
| 0.0 | 3.2 | REACTOME L1CAM INTERACTIONS | Genes involved in L1CAM interactions |
| 0.0 | 0.3 | REACTOME ANTIGEN PRESENTATION FOLDING ASSEMBLY AND PEPTIDE LOADING OF CLASS I MHC | Genes involved in Antigen Presentation: Folding, assembly and peptide loading of class I MHC |