Project
Epithelial-Mesenchymal Transition, human (Scheel, 2011)
Navigation
Downloads
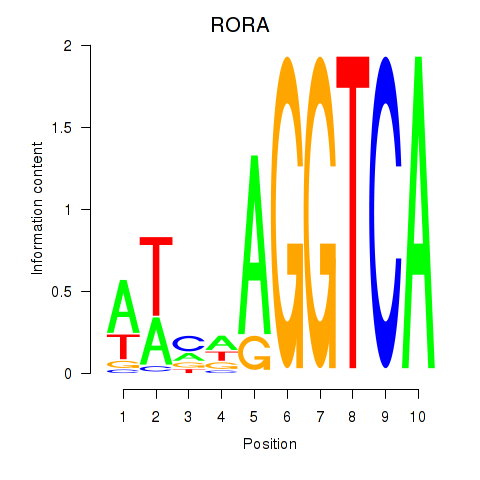
Results for RORA
Z-value: 0.37
Motif logo
Transcription factors associated with RORA
| Gene Symbol | Gene ID | Gene Info |
|---|---|---|
|
RORA
|
ENSG00000069667.16 | RAR related orphan receptor A |
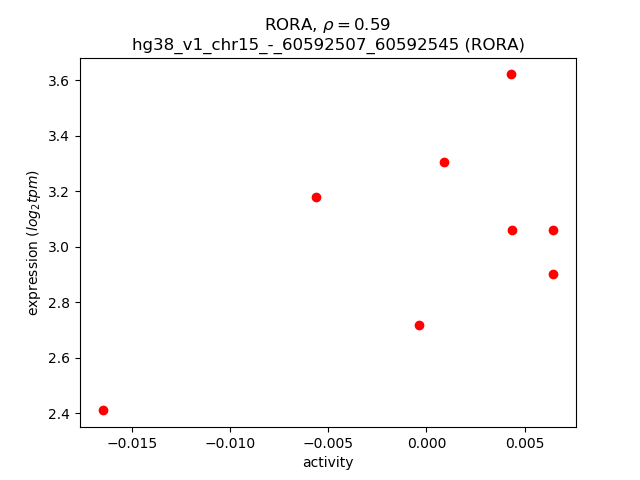
Activity-expression correlation:
| Gene | Promoter | Pearson corr. coef. | P-value | Plot |
|---|---|---|---|---|
| RORA | hg38_v1_chr15_-_60592507_60592545 | 0.59 | 1.3e-01 | Click! |
Activity profile of RORA motif
Sorted Z-values of RORA motif
| Promoter | Log-likelihood | Transcript | Gene | Gene Info |
|---|---|---|---|---|
| chr19_+_1248553 | 0.11 |
ENST00000586757.5
ENST00000300952.6 ENST00000682408.1 |
MIDN
|
midnolin |
| chr10_-_101818405 | 0.10 |
ENST00000357797.9
ENST00000370094.7 |
OGA
|
O-GlcNAcase |
| chr10_-_63269057 | 0.09 |
ENST00000542921.5
|
JMJD1C
|
jumonji domain containing 1C |
| chr3_-_123620571 | 0.09 |
ENST00000583087.5
|
MYLK
|
myosin light chain kinase |
| chr3_+_10026409 | 0.09 |
ENST00000287647.7
ENST00000676013.1 ENST00000675286.1 ENST00000419585.5 |
FANCD2
|
FA complementation group D2 |
| chr5_+_40679907 | 0.09 |
ENST00000302472.4
|
PTGER4
|
prostaglandin E receptor 4 |
| chr3_-_123620496 | 0.09 |
ENST00000578202.1
|
MYLK
|
myosin light chain kinase |
| chr17_-_4555371 | 0.09 |
ENST00000254718.9
ENST00000381556.6 |
MYBBP1A
|
MYB binding protein 1a |
| chr18_-_21704763 | 0.09 |
ENST00000580981.5
ENST00000289119.7 |
ABHD3
|
abhydrolase domain containing 3, phospholipase |
| chr12_+_18242955 | 0.08 |
ENST00000676171.1
|
PIK3C2G
|
phosphatidylinositol-4-phosphate 3-kinase catalytic subunit type 2 gamma |
| chrX_-_21758097 | 0.08 |
ENST00000379494.4
|
SMPX
|
small muscle protein X-linked |
| chr16_+_31355215 | 0.08 |
ENST00000562522.2
|
ITGAX
|
integrin subunit alpha X |
| chr16_+_31355165 | 0.08 |
ENST00000562918.5
ENST00000268296.9 |
ITGAX
|
integrin subunit alpha X |
| chr18_-_58629084 | 0.08 |
ENST00000361673.4
|
ALPK2
|
alpha kinase 2 |
| chr5_-_88268801 | 0.07 |
ENST00000506536.5
ENST00000512429.5 ENST00000514135.5 ENST00000296595.11 ENST00000509387.5 |
TMEM161B
|
transmembrane protein 161B |
| chr3_-_27456743 | 0.07 |
ENST00000295736.9
ENST00000428386.5 ENST00000428179.1 |
SLC4A7
|
solute carrier family 4 member 7 |
| chr20_-_13990609 | 0.07 |
ENST00000284951.10
ENST00000378072.5 |
SEL1L2
|
SEL1L2 adaptor subunit of ERAD E3 ligase |
| chr7_+_112423137 | 0.07 |
ENST00000005558.8
ENST00000621379.4 |
IFRD1
|
interferon related developmental regulator 1 |
| chr6_+_106629594 | 0.07 |
ENST00000369044.1
|
QRSL1
|
glutaminyl-tRNA amidotransferase subunit QRSL1 |
| chr17_-_676348 | 0.07 |
ENST00000681510.1
ENST00000679680.1 |
VPS53
|
VPS53 subunit of GARP complex |
| chr7_-_101180215 | 0.07 |
ENST00000455377.5
ENST00000443096.1 ENST00000300303.7 |
NAT16
|
N-acetyltransferase 16 (putative) |
| chr5_+_73813518 | 0.06 |
ENST00000296799.8
|
ARHGEF28
|
Rho guanine nucleotide exchange factor 28 |
| chr3_+_141386393 | 0.06 |
ENST00000503809.5
|
ZBTB38
|
zinc finger and BTB domain containing 38 |
| chr19_-_15125659 | 0.06 |
ENST00000533747.1
ENST00000598709.1 ENST00000534378.5 |
ILVBL
|
ilvB acetolactate synthase like |
| chr22_-_38302990 | 0.06 |
ENST00000612795.2
ENST00000451964.5 |
CSNK1E
|
casein kinase 1 epsilon |
| chr10_+_70815889 | 0.06 |
ENST00000373202.8
|
SGPL1
|
sphingosine-1-phosphate lyase 1 |
| chr11_-_111871271 | 0.06 |
ENST00000398006.6
|
ALG9
|
ALG9 alpha-1,2-mannosyltransferase |
| chr19_-_15125751 | 0.05 |
ENST00000263383.8
|
ILVBL
|
ilvB acetolactate synthase like |
| chr15_-_74725370 | 0.05 |
ENST00000567032.5
ENST00000564596.5 ENST00000566503.1 ENST00000395049.8 ENST00000379727.8 ENST00000617691.4 ENST00000395048.6 |
CYP1A1
|
cytochrome P450 family 1 subfamily A member 1 |
| chr1_+_36224410 | 0.05 |
ENST00000469141.6
ENST00000648638.1 ENST00000354618.10 |
THRAP3
|
thyroid hormone receptor associated protein 3 |
| chr7_-_128343823 | 0.05 |
ENST00000415472.6
ENST00000478061.5 ENST00000223073.6 ENST00000459726.1 |
RBM28
|
RNA binding motif protein 28 |
| chr18_-_12377200 | 0.05 |
ENST00000269143.8
|
AFG3L2
|
AFG3 like matrix AAA peptidase subunit 2 |
| chr9_+_128552558 | 0.05 |
ENST00000372731.8
ENST00000630804.2 ENST00000372739.7 ENST00000627441.2 ENST00000358161.9 ENST00000636257.1 |
SPTAN1
|
spectrin alpha, non-erythrocytic 1 |
| chr11_-_7963646 | 0.05 |
ENST00000328600.3
|
NLRP10
|
NLR family pyrin domain containing 10 |
| chr7_+_128758947 | 0.05 |
ENST00000493278.1
|
CALU
|
calumenin |
| chr10_-_101818425 | 0.05 |
ENST00000361464.8
ENST00000439817.5 |
OGA
|
O-GlcNAcase |
| chr5_+_96936071 | 0.05 |
ENST00000231368.10
|
LNPEP
|
leucyl and cystinyl aminopeptidase |
| chr19_-_5622768 | 0.05 |
ENST00000252542.9
|
SAFB2
|
scaffold attachment factor B2 |
| chr11_-_33717409 | 0.05 |
ENST00000651485.1
|
CD59
|
CD59 molecule (CD59 blood group) |
| chr9_-_39239174 | 0.05 |
ENST00000358144.6
|
CNTNAP3
|
contactin associated protein family member 3 |
| chr19_-_3546306 | 0.05 |
ENST00000398558.8
|
MFSD12
|
major facilitator superfamily domain containing 12 |
| chr9_+_131228109 | 0.05 |
ENST00000498010.2
ENST00000476004.5 ENST00000528406.1 |
NUP214
|
nucleoporin 214 |
| chr5_+_38258551 | 0.05 |
ENST00000322350.10
|
EGFLAM
|
EGF like, fibronectin type III and laminin G domains |
| chr5_+_38258373 | 0.05 |
ENST00000354891.7
|
EGFLAM
|
EGF like, fibronectin type III and laminin G domains |
| chr12_-_6606642 | 0.05 |
ENST00000545584.2
ENST00000545942.6 |
CHD4
|
chromodomain helicase DNA binding protein 4 |
| chr1_-_157138474 | 0.05 |
ENST00000326786.4
|
ETV3
|
ETS variant transcription factor 3 |
| chr5_-_88785493 | 0.04 |
ENST00000503554.4
|
MEF2C
|
myocyte enhancer factor 2C |
| chr7_+_123601815 | 0.04 |
ENST00000451215.6
|
ASB15
|
ankyrin repeat and SOCS box containing 15 |
| chr7_+_123601836 | 0.04 |
ENST00000434204.5
|
ASB15
|
ankyrin repeat and SOCS box containing 15 |
| chr1_-_150234668 | 0.04 |
ENST00000616917.4
|
ANP32E
|
acidic nuclear phosphoprotein 32 family member E |
| chrX_+_10156960 | 0.04 |
ENST00000380833.9
|
CLCN4
|
chloride voltage-gated channel 4 |
| chr4_-_6070162 | 0.04 |
ENST00000636216.1
ENST00000637373.2 |
ENSG00000284684.1
JAKMIP1
|
novel protein janus kinase and microtubule interacting protein 1 |
| chr2_-_206159410 | 0.04 |
ENST00000457011.5
ENST00000440274.5 ENST00000432169.5 ENST00000233190.11 |
NDUFS1
|
NADH:ubiquinone oxidoreductase core subunit S1 |
| chr12_+_93569814 | 0.04 |
ENST00000340600.6
|
SOCS2
|
suppressor of cytokine signaling 2 |
| chr6_+_106629560 | 0.04 |
ENST00000369046.8
|
QRSL1
|
glutaminyl-tRNA amidotransferase subunit QRSL1 |
| chr17_-_2711633 | 0.04 |
ENST00000435359.5
|
CLUH
|
clustered mitochondria homolog |
| chr3_-_113746218 | 0.04 |
ENST00000497255.1
ENST00000240922.8 ENST00000478020.1 ENST00000493900.5 |
NAA50
|
N-alpha-acetyltransferase 50, NatE catalytic subunit |
| chrX_-_30309387 | 0.04 |
ENST00000378970.5
|
NR0B1
|
nuclear receptor subfamily 0 group B member 1 |
| chr1_-_168137430 | 0.04 |
ENST00000546300.5
ENST00000271357.9 ENST00000367835.1 ENST00000537209.5 |
GPR161
|
G protein-coupled receptor 161 |
| chr13_-_113864062 | 0.04 |
ENST00000327773.7
|
GAS6
|
growth arrest specific 6 |
| chr3_-_50322733 | 0.04 |
ENST00000428028.1
ENST00000357750.9 |
HYAL2
|
hyaluronidase 2 |
| chr17_+_76079182 | 0.04 |
ENST00000334586.10
|
ZACN
|
zinc activated ion channel |
| chr7_-_45111673 | 0.04 |
ENST00000461363.1
ENST00000258770.8 ENST00000495078.1 ENST00000494076.5 ENST00000478532.5 ENST00000361278.7 |
TBRG4
|
transforming growth factor beta regulator 4 |
| chr1_+_160177386 | 0.04 |
ENST00000470705.1
|
ATP1A4
|
ATPase Na+/K+ transporting subunit alpha 4 |
| chr14_+_69484722 | 0.04 |
ENST00000322564.9
|
PLEKHD1
|
pleckstrin homology and coiled-coil domain containing D1 |
| chr12_+_93570381 | 0.04 |
ENST00000549206.5
|
SOCS2
|
suppressor of cytokine signaling 2 |
| chr16_+_82056423 | 0.04 |
ENST00000568090.5
|
HSD17B2
|
hydroxysteroid 17-beta dehydrogenase 2 |
| chr11_+_73950985 | 0.03 |
ENST00000339764.6
|
DNAJB13
|
DnaJ heat shock protein family (Hsp40) member B13 |
| chr6_-_106629472 | 0.03 |
ENST00000369063.8
|
RTN4IP1
|
reticulon 4 interacting protein 1 |
| chr8_-_133060347 | 0.03 |
ENST00000427060.6
|
SLA
|
Src like adaptor |
| chr3_-_50322759 | 0.03 |
ENST00000442581.1
ENST00000447092.5 |
HYAL2
|
hyaluronidase 2 |
| chr3_+_46407558 | 0.03 |
ENST00000357392.4
ENST00000400880.3 ENST00000433848.1 |
CCRL2
|
C-C motif chemokine receptor like 2 |
| chr17_-_51120855 | 0.03 |
ENST00000618113.4
ENST00000357122.8 ENST00000262013.12 |
SPAG9
|
sperm associated antigen 9 |
| chr8_+_119208322 | 0.03 |
ENST00000614891.5
|
MAL2
|
mal, T cell differentiation protein 2 |
| chrX_-_150898779 | 0.03 |
ENST00000613030.4
ENST00000437787.6 |
CD99L2
|
CD99 molecule like 2 |
| chr3_-_113746185 | 0.03 |
ENST00000616174.1
|
NAA50
|
N-alpha-acetyltransferase 50, NatE catalytic subunit |
| chr3_-_9986682 | 0.03 |
ENST00000429759.5
|
EMC3
|
ER membrane protein complex subunit 3 |
| chr15_+_76059973 | 0.03 |
ENST00000388942.8
|
TMEM266
|
transmembrane protein 266 |
| chr17_-_50707855 | 0.03 |
ENST00000285243.7
|
ANKRD40
|
ankyrin repeat domain 40 |
| chrX_-_150898592 | 0.03 |
ENST00000355149.8
ENST00000466436.5 ENST00000370377.8 |
CD99L2
|
CD99 molecule like 2 |
| chr17_-_2025289 | 0.03 |
ENST00000331238.7
|
RTN4RL1
|
reticulon 4 receptor like 1 |
| chr6_+_39048765 | 0.03 |
ENST00000373256.5
|
GLP1R
|
glucagon like peptide 1 receptor |
| chr15_+_43517590 | 0.03 |
ENST00000300231.6
|
MAP1A
|
microtubule associated protein 1A |
| chr11_+_7513966 | 0.03 |
ENST00000299492.9
|
PPFIBP2
|
PPFIA binding protein 2 |
| chr6_+_36871841 | 0.03 |
ENST00000359359.6
|
C6orf89
|
chromosome 6 open reading frame 89 |
| chr2_-_208254232 | 0.03 |
ENST00000415913.5
ENST00000415282.5 ENST00000446179.5 |
IDH1
|
isocitrate dehydrogenase (NADP(+)) 1 |
| chr20_+_3796288 | 0.03 |
ENST00000439880.6
ENST00000245960.10 |
CDC25B
|
cell division cycle 25B |
| chr2_-_206159509 | 0.03 |
ENST00000423725.5
|
NDUFS1
|
NADH:ubiquinone oxidoreductase core subunit S1 |
| chr9_-_128204218 | 0.03 |
ENST00000634901.1
ENST00000372948.7 |
CIZ1
|
CDKN1A interacting zinc finger protein 1 |
| chr19_-_15125095 | 0.03 |
ENST00000600984.5
|
ILVBL
|
ilvB acetolactate synthase like |
| chr5_-_137735997 | 0.03 |
ENST00000505853.1
|
KLHL3
|
kelch like family member 3 |
| chr6_+_52186373 | 0.03 |
ENST00000648244.1
|
IL17A
|
interleukin 17A |
| chr19_-_41994079 | 0.03 |
ENST00000602133.5
|
ATP1A3
|
ATPase Na+/K+ transporting subunit alpha 3 |
| chr5_+_170353480 | 0.03 |
ENST00000377360.8
|
KCNIP1
|
potassium voltage-gated channel interacting protein 1 |
| chr15_-_45129857 | 0.03 |
ENST00000267803.8
ENST00000613425.4 ENST00000559014.5 ENST00000558851.1 ENST00000559988.5 ENST00000558996.5 ENST00000558422.5 ENST00000559226.5 ENST00000560572.6 ENST00000558326.5 ENST00000558377.5 ENST00000559644.5 |
DUOXA1
|
dual oxidase maturation factor 1 |
| chr15_-_77696142 | 0.03 |
ENST00000561030.5
|
LINGO1
|
leucine rich repeat and Ig domain containing 1 |
| chr1_+_180912876 | 0.03 |
ENST00000367588.9
|
KIAA1614
|
KIAA1614 |
| chr19_-_41994217 | 0.03 |
ENST00000648268.1
ENST00000545399.6 |
ATP1A3
|
ATPase Na+/K+ transporting subunit alpha 3 |
| chr3_+_46407251 | 0.03 |
ENST00000399036.4
|
CCRL2
|
C-C motif chemokine receptor like 2 |
| chr7_-_105679089 | 0.03 |
ENST00000477775.5
|
ATXN7L1
|
ataxin 7 like 1 |
| chr3_-_126517764 | 0.02 |
ENST00000290868.7
|
UROC1
|
urocanate hydratase 1 |
| chr17_+_41837817 | 0.02 |
ENST00000438813.1
ENST00000293303.5 |
KLHL10
|
kelch like family member 10 |
| chr15_-_51971740 | 0.02 |
ENST00000315141.5
ENST00000299601.10 |
LEO1
|
LEO1 homolog, Paf1/RNA polymerase II complex component |
| chr16_+_56865202 | 0.02 |
ENST00000566786.5
ENST00000438926.6 ENST00000563236.6 ENST00000262502.5 |
SLC12A3
|
solute carrier family 12 member 3 |
| chr3_+_130431463 | 0.02 |
ENST00000512836.5
|
COL6A5
|
collagen type VI alpha 5 chain |
| chr3_-_49120785 | 0.02 |
ENST00000417901.5
ENST00000306026.5 ENST00000434032.6 |
USP19
|
ubiquitin specific peptidase 19 |
| chr11_+_83156988 | 0.02 |
ENST00000298281.8
ENST00000530660.5 |
PCF11
|
PCF11 cleavage and polyadenylation factor subunit |
| chr3_-_49120887 | 0.02 |
ENST00000453664.5
ENST00000398888.6 |
USP19
|
ubiquitin specific peptidase 19 |
| chr16_+_2026834 | 0.02 |
ENST00000424542.7
ENST00000432365.6 |
SLC9A3R2
|
SLC9A3 regulator 2 |
| chr10_+_73998104 | 0.02 |
ENST00000372755.7
ENST00000211998.10 |
VCL
|
vinculin |
| chr4_+_165873231 | 0.02 |
ENST00000061240.7
|
TLL1
|
tolloid like 1 |
| chr14_-_58427134 | 0.02 |
ENST00000555930.6
|
TIMM9
|
translocase of inner mitochondrial membrane 9 |
| chr16_-_47143934 | 0.02 |
ENST00000562435.6
|
NETO2
|
neuropilin and tolloid like 2 |
| chr8_-_143572748 | 0.02 |
ENST00000529971.1
ENST00000398882.8 |
MROH6
|
maestro heat like repeat family member 6 |
| chr9_-_83707889 | 0.02 |
ENST00000257468.11
ENST00000376395.9 |
UBQLN1
|
ubiquilin 1 |
| chr12_-_39443390 | 0.02 |
ENST00000361961.7
|
KIF21A
|
kinesin family member 21A |
| chr17_-_29176752 | 0.02 |
ENST00000533112.5
|
MYO18A
|
myosin XVIIIA |
| chr1_+_45913647 | 0.02 |
ENST00000674079.1
|
MAST2
|
microtubule associated serine/threonine kinase 2 |
| chr3_+_113747022 | 0.02 |
ENST00000273398.8
ENST00000496747.5 ENST00000475322.1 |
ATP6V1A
|
ATPase H+ transporting V1 subunit A |
| chr2_-_197499826 | 0.02 |
ENST00000439605.2
ENST00000388968.8 ENST00000418022.2 |
HSPD1
|
heat shock protein family D (Hsp60) member 1 |
| chr2_+_219627394 | 0.02 |
ENST00000373760.6
|
SLC4A3
|
solute carrier family 4 member 3 |
| chr19_-_55624563 | 0.02 |
ENST00000325351.5
ENST00000591479.1 |
ZNF784
|
zinc finger protein 784 |
| chr2_-_197499857 | 0.02 |
ENST00000428204.6
ENST00000678170.1 ENST00000676933.1 ENST00000678621.1 |
HSPD1
|
heat shock protein family D (Hsp60) member 1 |
| chr17_+_62370218 | 0.02 |
ENST00000450662.7
|
EFCAB3
|
EF-hand calcium binding domain 3 |
| chr20_+_34977625 | 0.02 |
ENST00000618182.6
|
MYH7B
|
myosin heavy chain 7B |
| chr3_+_50279080 | 0.02 |
ENST00000316436.4
|
LSMEM2
|
leucine rich single-pass membrane protein 2 |
| chr1_+_20070156 | 0.02 |
ENST00000375108.4
|
PLA2G5
|
phospholipase A2 group V |
| chr21_+_46001300 | 0.02 |
ENST00000612273.2
ENST00000682634.1 |
COL6A1
|
collagen type VI alpha 1 chain |
| chr8_+_37695774 | 0.02 |
ENST00000331569.6
|
ZNF703
|
zinc finger protein 703 |
| chr15_+_78149354 | 0.01 |
ENST00000558554.5
ENST00000557826.5 ENST00000561279.5 ENST00000299518.7 ENST00000559186.5 ENST00000560770.5 ENST00000559881.5 ENST00000559205.1 ENST00000629769.2 |
IDH3A
|
isocitrate dehydrogenase (NAD(+)) 3 catalytic subunit alpha |
| chrX_-_130165699 | 0.01 |
ENST00000676328.1
ENST00000675857.1 ENST00000675427.1 ENST00000675092.1 |
AIFM1
|
apoptosis inducing factor mitochondria associated 1 |
| chr20_-_37527862 | 0.01 |
ENST00000373537.7
ENST00000445723.5 ENST00000414080.1 |
BLCAP
|
BLCAP apoptosis inducing factor |
| chr12_+_71686473 | 0.01 |
ENST00000549735.5
|
TMEM19
|
transmembrane protein 19 |
| chr20_+_38962299 | 0.01 |
ENST00000373325.6
ENST00000373323.8 ENST00000252011.8 ENST00000615559.1 |
DHX35
ENSG00000277581.1
|
DEAH-box helicase 35 novel transcript, sense intronic to DHX35 |
| chr16_-_30029429 | 0.01 |
ENST00000564806.1
|
TLCD3B
|
TLC domain containing 3B |
| chr3_+_155870623 | 0.01 |
ENST00000295920.7
ENST00000496455.7 |
GMPS
|
guanine monophosphate synthase |
| chr1_+_69567906 | 0.01 |
ENST00000651989.2
|
LRRC7
|
leucine rich repeat containing 7 |
| chr11_-_119729158 | 0.01 |
ENST00000264025.8
|
NECTIN1
|
nectin cell adhesion molecule 1 |
| chr3_-_113746059 | 0.01 |
ENST00000477813.5
|
NAA50
|
N-alpha-acetyltransferase 50, NatE catalytic subunit |
| chr8_+_144095054 | 0.01 |
ENST00000318911.5
|
CYC1
|
cytochrome c1 |
| chr21_-_42396043 | 0.01 |
ENST00000433957.7
ENST00000644384.2 ENST00000652415.1 ENST00000398397.3 |
TMPRSS3
|
transmembrane serine protease 3 |
| chr1_-_33036840 | 0.01 |
ENST00000548033.5
ENST00000487289.1 ENST00000626911.1 ENST00000673291.1 ENST00000480134.5 ENST00000373449.7 ENST00000672715.1 ENST00000467905.5 ENST00000629371.2 |
AK2
|
adenylate kinase 2 |
| chr9_-_137221323 | 0.01 |
ENST00000391553.2
ENST00000392827.2 |
RNF208
|
ring finger protein 208 |
| chr6_-_88963573 | 0.01 |
ENST00000369485.9
|
RNGTT
|
RNA guanylyltransferase and 5'-phosphatase |
| chr1_-_84574407 | 0.01 |
ENST00000370630.6
|
CTBS
|
chitobiase |
| chr1_-_91021996 | 0.01 |
ENST00000337393.10
|
ZNF644
|
zinc finger protein 644 |
| chr6_+_167111789 | 0.01 |
ENST00000400926.5
|
CCR6
|
C-C motif chemokine receptor 6 |
| chrX_-_130165664 | 0.01 |
ENST00000535724.6
ENST00000346424.6 ENST00000676436.1 |
AIFM1
|
apoptosis inducing factor mitochondria associated 1 |
| chr2_-_99255107 | 0.01 |
ENST00000333017.6
ENST00000626374.2 ENST00000409679.5 ENST00000423306.1 |
LYG2
|
lysozyme g2 |
| chr2_+_197500371 | 0.01 |
ENST00000409468.1
ENST00000233893.10 |
HSPE1
|
heat shock protein family E (Hsp10) member 1 |
| chr5_+_140647802 | 0.01 |
ENST00000417647.7
ENST00000507593.5 ENST00000508301.5 |
IK
|
IK cytokine |
| chr1_-_31938302 | 0.01 |
ENST00000647444.2
|
PTP4A2
|
protein tyrosine phosphatase 4A2 |
| chr19_-_50837213 | 0.01 |
ENST00000326856.8
|
KLK15
|
kallikrein related peptidase 15 |
| chr10_+_92291155 | 0.01 |
ENST00000358935.3
|
MARCHF5
|
membrane associated ring-CH-type finger 5 |
| chr1_-_154192058 | 0.01 |
ENST00000271850.11
ENST00000368530.7 ENST00000651641.1 |
TPM3
|
tropomyosin 3 |
| chr12_-_120265719 | 0.01 |
ENST00000637617.2
ENST00000267257.11 ENST00000228307.11 ENST00000424649.6 |
PXN
|
paxillin |
| chr7_+_45574358 | 0.01 |
ENST00000297323.12
|
ADCY1
|
adenylate cyclase 1 |
| chr6_-_70303070 | 0.01 |
ENST00000370496.3
ENST00000357250.11 |
COL9A1
|
collagen type IX alpha 1 chain |
| chr19_+_49043837 | 0.01 |
ENST00000301408.7
|
CGB5
|
chorionic gonadotropin subunit beta 5 |
| chr5_-_132011794 | 0.01 |
ENST00000650697.1
|
ACSL6
|
acyl-CoA synthetase long chain family member 6 |
| chr2_+_70087468 | 0.01 |
ENST00000303577.7
|
PCBP1
|
poly(rC) binding protein 1 |
| chr1_+_161202147 | 0.01 |
ENST00000392179.5
ENST00000678511.1 ENST00000677453.1 ENST00000678783.1 ENST00000679218.1 ENST00000676972.1 |
NDUFS2
|
NADH:ubiquinone oxidoreductase core subunit S2 |
| chr20_+_50510321 | 0.01 |
ENST00000541713.5
ENST00000371621.5 |
PTPN1
|
protein tyrosine phosphatase non-receptor type 1 |
| chr12_-_16608073 | 0.01 |
ENST00000441439.6
|
LMO3
|
LIM domain only 3 |
| chr2_-_86194972 | 0.01 |
ENST00000254636.9
|
IMMT
|
inner membrane mitochondrial protein |
| chr6_-_96897853 | 0.01 |
ENST00000316149.8
|
NDUFAF4
|
NADH:ubiquinone oxidoreductase complex assembly factor 4 |
| chr12_+_120438107 | 0.01 |
ENST00000229379.3
ENST00000551806.1 |
COX6A1
ENSG00000111780.8
|
cytochrome c oxidase subunit 6A1 novel protein |
| chr2_-_148020689 | 0.01 |
ENST00000457954.5
ENST00000392857.10 ENST00000540442.5 ENST00000535373.5 |
ORC4
|
origin recognition complex subunit 4 |
| chr3_-_179604628 | 0.00 |
ENST00000476781.6
ENST00000259038.6 |
MRPL47
|
mitochondrial ribosomal protein L47 |
| chr5_-_141958174 | 0.00 |
ENST00000231484.4
|
PCDH12
|
protocadherin 12 |
| chr20_+_54475647 | 0.00 |
ENST00000395939.5
|
DOK5
|
docking protein 5 |
| chr2_+_10420021 | 0.00 |
ENST00000422133.1
|
HPCAL1
|
hippocalcin like 1 |
| chr21_-_42395943 | 0.00 |
ENST00000398405.5
|
TMPRSS3
|
transmembrane serine protease 3 |
| chr10_-_50885656 | 0.00 |
ENST00000374001.6
ENST00000395489.6 ENST00000282641.6 ENST00000395495.5 ENST00000373995.7 ENST00000414883.1 |
A1CF
|
APOBEC1 complementation factor |
| chr16_-_49664225 | 0.00 |
ENST00000535559.5
|
ZNF423
|
zinc finger protein 423 |
| chr3_-_179604648 | 0.00 |
ENST00000392659.2
|
MRPL47
|
mitochondrial ribosomal protein L47 |
| chr14_-_58427158 | 0.00 |
ENST00000555097.1
ENST00000556367.6 ENST00000555404.5 |
TIMM9
|
translocase of inner mitochondrial membrane 9 |
| chr11_+_67605488 | 0.00 |
ENST00000533876.1
ENST00000647561.1 |
ENSG00000255119.1
NDUFV1
|
novel transcript NADH:ubiquinone oxidoreductase core subunit V1 |
| chr17_+_42844573 | 0.00 |
ENST00000253799.8
ENST00000452774.2 |
AOC2
|
amine oxidase copper containing 2 |
| chr10_-_50885619 | 0.00 |
ENST00000373997.8
|
A1CF
|
APOBEC1 complementation factor |
| chr6_-_88963409 | 0.00 |
ENST00000369475.7
ENST00000538899.2 |
RNGTT
|
RNA guanylyltransferase and 5'-phosphatase |
| chr12_+_109139397 | 0.00 |
ENST00000377854.9
ENST00000377848.7 |
ACACB
|
acetyl-CoA carboxylase beta |
| chr1_-_33036927 | 0.00 |
ENST00000354858.11
|
AK2
|
adenylate kinase 2 |
| chr6_-_41735557 | 0.00 |
ENST00000373033.6
|
TFEB
|
transcription factor EB |
| chr14_-_58427114 | 0.00 |
ENST00000556007.6
|
TIMM9
|
translocase of inner mitochondrial membrane 9 |
| chrX_-_130165825 | 0.00 |
ENST00000675240.1
ENST00000319908.8 ENST00000674546.1 ENST00000287295.8 |
AIFM1
|
apoptosis inducing factor mitochondria associated 1 |
| chr2_+_108621260 | 0.00 |
ENST00000409441.5
|
LIMS1
|
LIM zinc finger domain containing 1 |
| chr2_+_74206384 | 0.00 |
ENST00000678623.1
ENST00000678731.1 |
MTHFD2
|
methylenetetrahydrofolate dehydrogenase (NADP+ dependent) 2, methenyltetrahydrofolate cyclohydrolase |
| chr3_-_184017863 | 0.00 |
ENST00000427120.6
ENST00000334444.11 ENST00000392579.6 ENST00000382494.6 ENST00000265586.10 ENST00000446941.2 |
ABCC5
|
ATP binding cassette subfamily C member 5 |
| chr12_-_57742120 | 0.00 |
ENST00000257897.7
|
AGAP2
|
ArfGAP with GTPase domain, ankyrin repeat and PH domain 2 |
| chr12_-_56645955 | 0.00 |
ENST00000552959.5
ENST00000551020.5 ENST00000553007.2 ENST00000262030.8 |
ATP5F1B
|
ATP synthase F1 subunit beta |
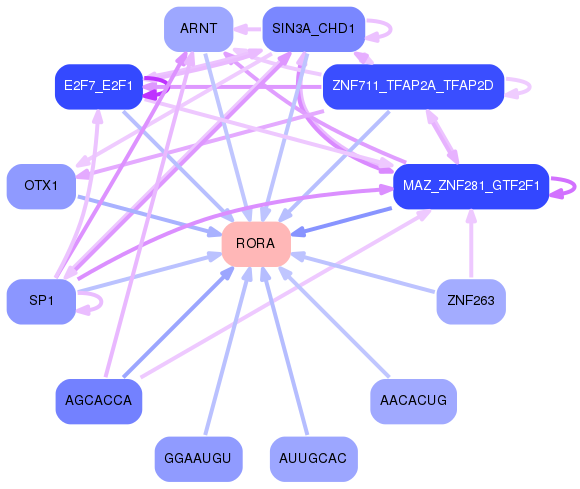
Network of associatons between targets according to the STRING database.

First level regulatory network of RORA
Gene Ontology Analysis
Gene overrepresentation in biological process category:
| Log-likelihood per target | Total log-likelihood | Term | Description |
|---|---|---|---|
| 0.0 | 0.1 | GO:2000417 | negative regulation of eosinophil migration(GO:2000417) |
| 0.0 | 0.1 | GO:0071962 | mitotic sister chromatid cohesion, centromeric(GO:0071962) |
| 0.0 | 0.2 | GO:0060414 | aorta smooth muscle tissue morphogenesis(GO:0060414) |
| 0.0 | 0.1 | GO:0070681 | glutaminyl-tRNAGln biosynthesis via transamidation(GO:0070681) |
| 0.0 | 0.1 | GO:0007518 | myoblast fate determination(GO:0007518) |
| 0.0 | 0.1 | GO:0043449 | cellular alkene metabolic process(GO:0043449) |
| 0.0 | 0.1 | GO:0070295 | transformation of host cell by virus(GO:0019087) renal water absorption(GO:0070295) |
| 0.0 | 0.1 | GO:0033132 | negative regulation of glucokinase activity(GO:0033132) negative regulation of hexokinase activity(GO:1903300) |
| 0.0 | 0.0 | GO:0097252 | oligodendrocyte apoptotic process(GO:0097252) |
| 0.0 | 0.0 | GO:0045041 | B cell cytokine production(GO:0002368) protein import into mitochondrial intermembrane space(GO:0045041) |
| 0.0 | 0.0 | GO:1904158 | axonemal central apparatus assembly(GO:1904158) |
Gene overrepresentation in cellular component category:
| Log-likelihood per target | Total log-likelihood | Term | Description |
|---|---|---|---|
| 0.0 | 0.1 | GO:0030956 | glutamyl-tRNA(Gln) amidotransferase complex(GO:0030956) |
| 0.0 | 0.1 | GO:0031074 | nucleocytoplasmic shuttling complex(GO:0031074) |
| 0.0 | 0.1 | GO:0005745 | m-AAA complex(GO:0005745) |
| 0.0 | 0.1 | GO:0005927 | muscle tendon junction(GO:0005927) |
| 0.0 | 0.1 | GO:0045272 | plasma membrane respiratory chain complex I(GO:0045272) |
| 0.0 | 0.0 | GO:1990876 | cytoplasmic side of nuclear pore(GO:1990876) |
| 0.0 | 0.1 | GO:0031415 | NatA complex(GO:0031415) |
Gene overrepresentation in molecular function category:
| Log-likelihood per target | Total log-likelihood | Term | Description |
|---|---|---|---|
| 0.0 | 0.1 | GO:0052739 | phosphatidylserine 1-acylhydrolase activity(GO:0052739) |
| 0.0 | 0.1 | GO:0052858 | peptidyl-lysine N-acetyltransferase activity, acting on acetyl phosphate as donor(GO:0052858) |
| 0.0 | 0.1 | GO:0050567 | amidase activity(GO:0004040) glutaminyl-tRNA synthase (glutamine-hydrolyzing) activity(GO:0050567) |
| 0.0 | 0.2 | GO:0004687 | myosin light chain kinase activity(GO:0004687) |
| 0.0 | 0.1 | GO:0033906 | hyaluronoglucuronidase activity(GO:0033906) |
| 0.0 | 0.1 | GO:0000026 | alpha-1,2-mannosyltransferase activity(GO:0000026) |
| 0.0 | 0.1 | GO:0030976 | thiamine pyrophosphate binding(GO:0030976) |
| 0.0 | 0.0 | GO:0047006 | 17-alpha,20-alpha-dihydroxypregn-4-en-3-one dehydrogenase activity(GO:0047006) |
| 0.0 | 0.1 | GO:0070576 | vitamin D 24-hydroxylase activity(GO:0070576) |