Project
Epithelial-Mesenchymal Transition, human (Scheel, 2011)
Navigation
Downloads
Results for SIX1_SIX3_SIX2
Z-value: 0.74
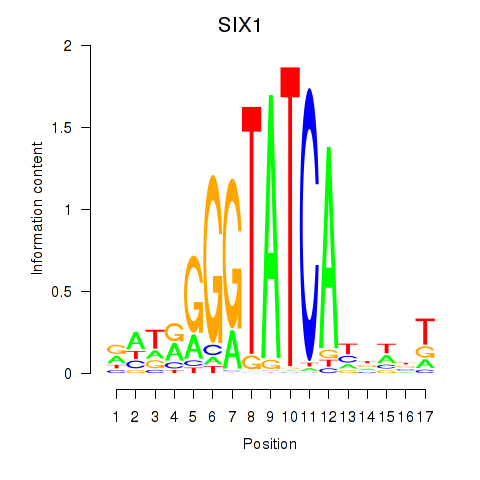
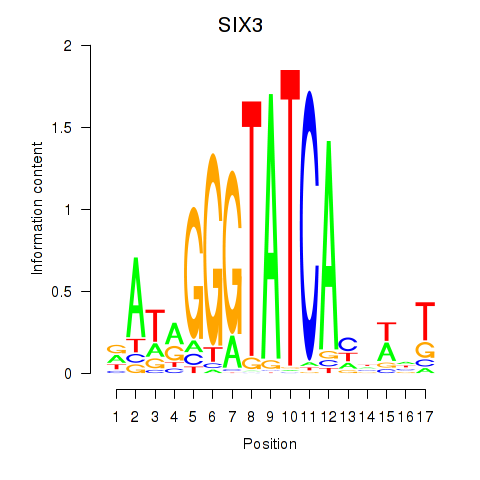
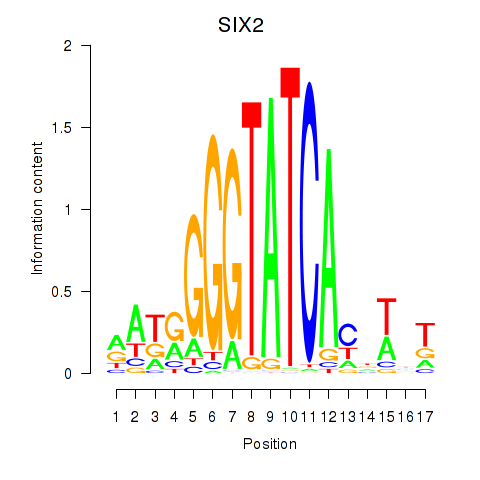
Motif logo
Transcription factors associated with SIX1_SIX3_SIX2
| Gene Symbol | Gene ID | Gene Info |
|---|---|---|
|
SIX1
|
ENSG00000126778.12 | SIX homeobox 1 |
|
SIX3
|
ENSG00000138083.5 | SIX homeobox 3 |
|
SIX2
|
ENSG00000170577.8 | SIX homeobox 2 |
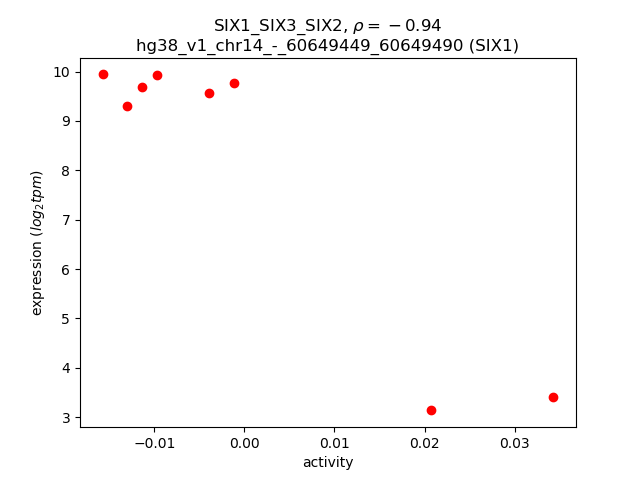
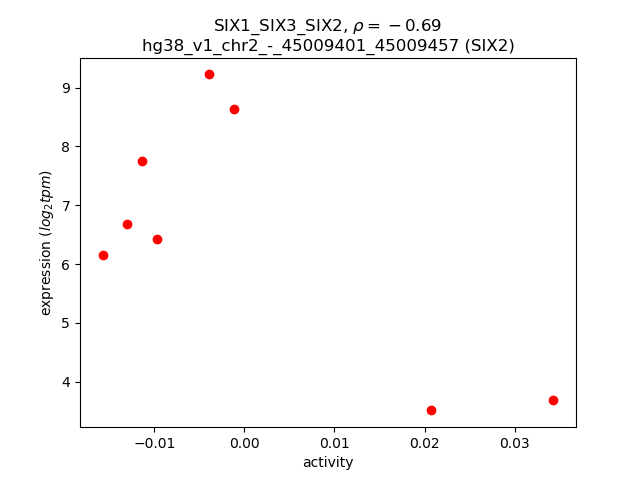
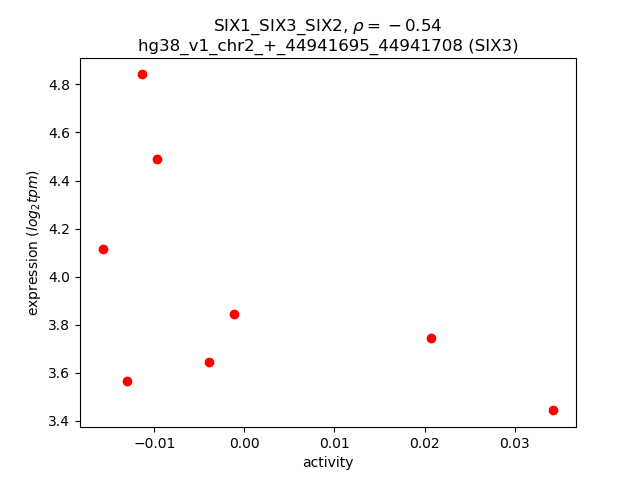
Activity-expression correlation:
| Gene | Promoter | Pearson corr. coef. | P-value | Plot |
|---|---|---|---|---|
| SIX1 | hg38_v1_chr14_-_60649449_60649490 | -0.94 | 5.7e-04 | Click! |
| SIX2 | hg38_v1_chr2_-_45009401_45009457 | -0.69 | 5.7e-02 | Click! |
| SIX3 | hg38_v1_chr2_+_44941695_44941708 | -0.54 | 1.7e-01 | Click! |
Activity profile of SIX1_SIX3_SIX2 motif
Sorted Z-values of SIX1_SIX3_SIX2 motif
| Promoter | Log-likelihood | Transcript | Gene | Gene Info |
|---|---|---|---|---|
| chr6_-_136526177 | 2.50 |
ENST00000617204.4
|
MAP7
|
microtubule associated protein 7 |
| chr6_-_136525961 | 2.08 |
ENST00000438100.6
|
MAP7
|
microtubule associated protein 7 |
| chr6_-_136526472 | 1.87 |
ENST00000454590.5
ENST00000432797.6 |
MAP7
|
microtubule associated protein 7 |
| chr6_-_136526654 | 1.72 |
ENST00000611373.1
|
MAP7
|
microtubule associated protein 7 |
| chr11_-_118264445 | 1.22 |
ENST00000438295.2
|
MPZL2
|
myelin protein zero like 2 |
| chr1_+_14929734 | 1.08 |
ENST00000376028.8
ENST00000400798.6 |
KAZN
|
kazrin, periplakin interacting protein |
| chr11_-_118264282 | 0.94 |
ENST00000278937.7
|
MPZL2
|
myelin protein zero like 2 |
| chr9_+_12693327 | 0.56 |
ENST00000388918.10
|
TYRP1
|
tyrosinase related protein 1 |
| chr20_+_46008900 | 0.50 |
ENST00000372330.3
|
MMP9
|
matrix metallopeptidase 9 |
| chr3_-_111595339 | 0.43 |
ENST00000317012.5
|
ZBED2
|
zinc finger BED-type containing 2 |
| chr12_-_57826295 | 0.38 |
ENST00000549039.5
|
CTDSP2
|
CTD small phosphatase 2 |
| chr2_-_112836702 | 0.37 |
ENST00000416750.1
ENST00000263341.7 ENST00000418817.5 |
IL1B
|
interleukin 1 beta |
| chr3_+_111999189 | 0.36 |
ENST00000455401.6
|
TAGLN3
|
transgelin 3 |
| chr10_+_46375721 | 0.35 |
ENST00000616785.1
ENST00000611655.1 ENST00000619162.5 |
ENSG00000285402.1
ANXA8L1
|
novel transcript annexin A8 like 1 |
| chr3_+_111999326 | 0.35 |
ENST00000494932.1
|
TAGLN3
|
transgelin 3 |
| chr3_+_111998915 | 0.35 |
ENST00000478951.6
|
TAGLN3
|
transgelin 3 |
| chr11_+_34632464 | 0.34 |
ENST00000531794.5
|
EHF
|
ETS homologous factor |
| chr1_-_99766620 | 0.33 |
ENST00000646001.2
|
FRRS1
|
ferric chelate reductase 1 |
| chr6_-_138107412 | 0.32 |
ENST00000421351.4
|
PERP
|
p53 apoptosis effector related to PMP22 |
| chr3_+_42809439 | 0.32 |
ENST00000422265.6
ENST00000487368.4 |
ACKR2
ENSG00000273328.5
|
atypical chemokine receptor 2 novel transcript |
| chr3_+_111998739 | 0.31 |
ENST00000393917.6
ENST00000273368.8 |
TAGLN3
|
transgelin 3 |
| chr11_-_34511710 | 0.30 |
ENST00000620316.4
ENST00000312319.6 |
ELF5
|
E74 like ETS transcription factor 5 |
| chr11_-_104898670 | 0.29 |
ENST00000422698.6
|
CASP12
|
caspase 12 (gene/pseudogene) |
| chr16_-_75495396 | 0.28 |
ENST00000332272.9
|
CHST6
|
carbohydrate sulfotransferase 6 |
| chr8_+_18391276 | 0.28 |
ENST00000286479.4
ENST00000520116.1 |
NAT2
|
N-acetyltransferase 2 |
| chr3_-_11643871 | 0.27 |
ENST00000430365.7
|
VGLL4
|
vestigial like family member 4 |
| chr1_+_160739286 | 0.27 |
ENST00000359331.8
ENST00000495334.1 |
SLAMF7
|
SLAM family member 7 |
| chr4_-_121381007 | 0.26 |
ENST00000394427.3
|
QRFPR
|
pyroglutamylated RFamide peptide receptor |
| chr12_-_14951106 | 0.26 |
ENST00000541644.5
ENST00000545895.5 |
ARHGDIB
|
Rho GDP dissociation inhibitor beta |
| chr10_+_5196831 | 0.25 |
ENST00000263126.3
|
AKR1C4
|
aldo-keto reductase family 1 member C4 |
| chr1_+_45500287 | 0.25 |
ENST00000401061.9
ENST00000616135.1 |
MMACHC
|
metabolism of cobalamin associated C |
| chr18_+_58149314 | 0.25 |
ENST00000435432.6
ENST00000357895.9 ENST00000586263.5 |
NEDD4L
|
NEDD4 like E3 ubiquitin protein ligase |
| chr11_+_70398404 | 0.24 |
ENST00000346329.7
ENST00000301843.13 ENST00000376561.7 |
CTTN
|
cortactin |
| chr2_+_233195433 | 0.23 |
ENST00000417661.1
|
INPP5D
|
inositol polyphosphate-5-phosphatase D |
| chr12_-_10674013 | 0.22 |
ENST00000535345.5
ENST00000542562.5 ENST00000075503.8 |
STYK1
|
serine/threonine/tyrosine kinase 1 |
| chr4_+_88378733 | 0.22 |
ENST00000273960.7
ENST00000380265.9 |
HERC6
|
HECT and RLD domain containing E3 ubiquitin protein ligase family member 6 |
| chr2_-_73269483 | 0.21 |
ENST00000295133.9
|
FBXO41
|
F-box protein 41 |
| chr1_+_160739265 | 0.21 |
ENST00000368042.7
|
SLAMF7
|
SLAM family member 7 |
| chr14_+_22271921 | 0.21 |
ENST00000390464.2
|
TRAV38-1
|
T cell receptor alpha variable 38-1 |
| chr1_+_160739239 | 0.20 |
ENST00000368043.8
|
SLAMF7
|
SLAM family member 7 |
| chr11_+_121576760 | 0.20 |
ENST00000532694.5
ENST00000534286.5 |
SORL1
|
sortilin related receptor 1 |
| chr11_-_58575846 | 0.19 |
ENST00000395074.7
|
LPXN
|
leupaxin |
| chr9_-_114806031 | 0.18 |
ENST00000374045.5
|
TNFSF15
|
TNF superfamily member 15 |
| chrX_+_139530730 | 0.18 |
ENST00000218099.7
|
F9
|
coagulation factor IX |
| chr4_+_88378842 | 0.18 |
ENST00000264346.12
|
HERC6
|
HECT and RLD domain containing E3 ubiquitin protein ligase family member 6 |
| chr11_-_44950867 | 0.18 |
ENST00000528290.5
ENST00000525680.6 ENST00000530035.5 ENST00000527685.5 |
TP53I11
|
tumor protein p53 inducible protein 11 |
| chr11_+_55827219 | 0.17 |
ENST00000378397.1
|
OR5L2
|
olfactory receptor family 5 subfamily L member 2 |
| chr6_+_112054075 | 0.17 |
ENST00000230529.9
ENST00000604763.5 ENST00000368666.7 ENST00000674325.1 ENST00000483439.1 ENST00000409166.5 |
CCN6
|
cellular communication network factor 6 |
| chr8_-_24956604 | 0.17 |
ENST00000610854.2
|
NEFL
|
neurofilament light |
| chr5_+_140821598 | 0.16 |
ENST00000614258.1
ENST00000529859.2 ENST00000529619.5 |
PCDHA5
|
protocadherin alpha 5 |
| chr11_-_44950839 | 0.15 |
ENST00000395648.7
ENST00000531928.6 |
TP53I11
|
tumor protein p53 inducible protein 11 |
| chr1_+_161707205 | 0.15 |
ENST00000367957.7
|
FCRLA
|
Fc receptor like A |
| chr19_+_55947832 | 0.15 |
ENST00000291971.7
ENST00000590542.1 |
NLRP8
|
NLR family pyrin domain containing 8 |
| chr19_+_15793951 | 0.15 |
ENST00000308940.8
|
OR10H5
|
olfactory receptor family 10 subfamily H member 5 |
| chr20_-_32657362 | 0.15 |
ENST00000360785.6
|
C20orf203
|
chromosome 20 open reading frame 203 |
| chr1_+_161707244 | 0.15 |
ENST00000349527.8
ENST00000294796.8 ENST00000309691.10 ENST00000367953.7 ENST00000367950.2 |
FCRLA
|
Fc receptor like A |
| chr1_+_161707222 | 0.15 |
ENST00000236938.12
|
FCRLA
|
Fc receptor like A |
| chr6_-_2841853 | 0.15 |
ENST00000380739.6
|
SERPINB1
|
serpin family B member 1 |
| chr1_+_26410809 | 0.14 |
ENST00000254231.4
ENST00000326279.11 |
LIN28A
|
lin-28 homolog A |
| chr7_-_141841473 | 0.14 |
ENST00000350549.8
ENST00000438520.1 |
PRSS37
|
serine protease 37 |
| chr4_-_152411734 | 0.14 |
ENST00000603841.1
|
FBXW7
|
F-box and WD repeat domain containing 7 |
| chr1_+_154321107 | 0.13 |
ENST00000484864.1
|
AQP10
|
aquaporin 10 |
| chr7_-_72447061 | 0.13 |
ENST00000395276.6
ENST00000431984.5 |
CALN1
|
calneuron 1 |
| chr7_+_134565098 | 0.12 |
ENST00000652743.1
|
AKR1B15
|
aldo-keto reductase family 1 member B15 |
| chr12_-_48852153 | 0.12 |
ENST00000308025.8
|
DDX23
|
DEAD-box helicase 23 |
| chrX_+_153642473 | 0.12 |
ENST00000370167.8
|
DUSP9
|
dual specificity phosphatase 9 |
| chr19_+_1524068 | 0.12 |
ENST00000642079.2
ENST00000454744.7 ENST00000588430.3 |
PLK5
|
polo like kinase 5 (inactive) |
| chr19_-_10928512 | 0.12 |
ENST00000588347.5
|
YIPF2
|
Yip1 domain family member 2 |
| chr1_+_209686173 | 0.12 |
ENST00000615289.4
ENST00000367028.6 ENST00000261465.5 |
HSD11B1
|
hydroxysteroid 11-beta dehydrogenase 1 |
| chr1_-_44788168 | 0.11 |
ENST00000372207.4
|
BEST4
|
bestrophin 4 |
| chr12_+_19205294 | 0.11 |
ENST00000424268.5
|
PLEKHA5
|
pleckstrin homology domain containing A5 |
| chr6_-_24358036 | 0.11 |
ENST00000378454.8
|
DCDC2
|
doublecortin domain containing 2 |
| chr6_-_31541937 | 0.11 |
ENST00000456662.5
ENST00000431908.5 ENST00000456976.5 ENST00000428450.5 ENST00000418897.5 ENST00000396172.6 ENST00000419020.1 ENST00000428098.5 |
DDX39B
|
DExD-box helicase 39B |
| chr2_-_55269038 | 0.11 |
ENST00000417363.5
ENST00000412530.1 ENST00000366137.6 ENST00000420637.5 |
MTIF2
|
mitochondrial translational initiation factor 2 |
| chr1_+_154321076 | 0.11 |
ENST00000324978.8
|
AQP10
|
aquaporin 10 |
| chr10_-_67665642 | 0.11 |
ENST00000682945.1
ENST00000330298.6 ENST00000682758.1 |
CTNNA3
|
catenin alpha 3 |
| chr6_+_33075952 | 0.10 |
ENST00000418931.7
|
HLA-DPB1
|
major histocompatibility complex, class II, DP beta 1 |
| chr15_-_42920638 | 0.10 |
ENST00000566931.1
ENST00000564431.5 ENST00000567274.5 ENST00000267890.11 |
TTBK2
|
tau tubulin kinase 2 |
| chr19_+_17751467 | 0.10 |
ENST00000596536.5
ENST00000593870.5 ENST00000598086.5 ENST00000598932.5 ENST00000595023.5 ENST00000594068.5 ENST00000596507.5 ENST00000595033.5 ENST00000597718.5 |
FCHO1
|
FCH and mu domain containing endocytic adaptor 1 |
| chr19_-_55738374 | 0.10 |
ENST00000590200.1
ENST00000332836.7 |
NLRP9
|
NLR family pyrin domain containing 9 |
| chr12_+_20695553 | 0.10 |
ENST00000545102.1
|
SLCO1C1
|
solute carrier organic anion transporter family member 1C1 |
| chr11_+_55262152 | 0.10 |
ENST00000417545.5
|
TRIM48
|
tripartite motif containing 48 |
| chr3_+_178536205 | 0.10 |
ENST00000420517.6
|
KCNMB2
|
potassium calcium-activated channel subfamily M regulatory beta subunit 2 |
| chr2_+_90038848 | 0.10 |
ENST00000390270.2
|
IGKV3D-20
|
immunoglobulin kappa variable 3D-20 |
| chr1_+_234373439 | 0.10 |
ENST00000366615.10
ENST00000619305.1 |
COA6
|
cytochrome c oxidase assembly factor 6 |
| chr14_+_58244821 | 0.09 |
ENST00000216455.9
ENST00000412908.6 ENST00000557508.5 |
PSMA3
|
proteasome 20S subunit alpha 3 |
| chr4_-_155376935 | 0.09 |
ENST00000311277.9
|
MAP9
|
microtubule associated protein 9 |
| chr11_-_32430811 | 0.09 |
ENST00000379079.8
ENST00000530998.5 |
WT1
|
WT1 transcription factor |
| chr16_-_138629 | 0.09 |
ENST00000468260.5
ENST00000611875.5 |
NPRL3
|
NPR3 like, GATOR1 complex subunit |
| chr11_-_58731936 | 0.09 |
ENST00000344743.8
|
GLYAT
|
glycine-N-acyltransferase |
| chr2_-_72825982 | 0.09 |
ENST00000634650.1
ENST00000272427.11 ENST00000410104.1 |
EXOC6B
|
exocyst complex component 6B |
| chr6_+_26172013 | 0.09 |
ENST00000634910.1
|
H2BC6
|
H2B clustered histone 6 |
| chr14_+_22304051 | 0.09 |
ENST00000390466.1
|
TRAV39
|
T cell receptor alpha variable 39 |
| chr15_+_75198866 | 0.09 |
ENST00000562637.1
ENST00000360639.6 |
C15orf39
|
chromosome 15 open reading frame 39 |
| chr2_+_233917371 | 0.08 |
ENST00000324695.9
ENST00000433712.6 |
TRPM8
|
transient receptor potential cation channel subfamily M member 8 |
| chr5_+_70025534 | 0.08 |
ENST00000515588.1
|
SERF1B
|
small EDRK-rich factor 1B |
| chr16_+_57976435 | 0.08 |
ENST00000290871.10
ENST00000441824.4 |
TEPP
|
testis, prostate and placenta expressed |
| chr4_-_155376797 | 0.08 |
ENST00000650955.1
ENST00000515654.5 |
MAP9
|
microtubule associated protein 9 |
| chr3_+_196942638 | 0.08 |
ENST00000602845.2
|
NCBP2AS2
|
NCBP2 antisense 2 (head to head) |
| chr6_+_26272923 | 0.08 |
ENST00000377733.4
|
H2BC10
|
H2B clustered histone 10 |
| chr6_+_150368997 | 0.08 |
ENST00000392255.7
ENST00000500320.7 ENST00000344419.8 |
IYD
|
iodotyrosine deiodinase |
| chr8_+_42338454 | 0.08 |
ENST00000532157.5
ENST00000520008.5 |
POLB
|
DNA polymerase beta |
| chr2_-_18589536 | 0.08 |
ENST00000416783.1
ENST00000359846.6 ENST00000304081.8 ENST00000532967.5 ENST00000444297.2 |
NT5C1B
NT5C1B-RDH14
|
5'-nucleotidase, cytosolic IB NT5C1B-RDH14 readthrough |
| chr9_+_105700953 | 0.08 |
ENST00000374688.5
|
TMEM38B
|
transmembrane protein 38B |
| chr2_+_89884740 | 0.08 |
ENST00000509129.1
|
IGKV1D-37
|
immunoglobulin kappa variable 1D-37 (non-functional) |
| chr22_+_20967243 | 0.08 |
ENST00000683034.1
ENST00000440238.4 ENST00000405089.5 |
AIFM3
|
apoptosis inducing factor mitochondria associated 3 |
| chr8_-_123737378 | 0.08 |
ENST00000419625.6
ENST00000262219.10 |
ANXA13
|
annexin A13 |
| chr10_+_18659382 | 0.08 |
ENST00000377275.4
|
ARL5B
|
ADP ribosylation factor like GTPase 5B |
| chr4_+_158210479 | 0.08 |
ENST00000504569.5
ENST00000509278.5 ENST00000514558.5 ENST00000503200.5 ENST00000296529.11 |
TMEM144
|
transmembrane protein 144 |
| chr16_+_84768246 | 0.08 |
ENST00000569925.1
ENST00000567526.1 |
USP10
|
ubiquitin specific peptidase 10 |
| chr12_-_109021015 | 0.07 |
ENST00000546618.2
ENST00000610966.5 |
SVOP
|
SV2 related protein |
| chr15_-_42920798 | 0.07 |
ENST00000622375.4
ENST00000567840.5 |
TTBK2
|
tau tubulin kinase 2 |
| chr2_-_89297785 | 0.07 |
ENST00000465170.1
|
IGKV1-37
|
immunoglobulin kappa variable 1-37 (non-functional) |
| chr6_+_4706133 | 0.07 |
ENST00000328908.9
|
CDYL
|
chromodomain Y like |
| chr12_-_118359639 | 0.07 |
ENST00000541786.5
ENST00000419821.6 ENST00000541878.5 |
TAOK3
|
TAO kinase 3 |
| chr19_-_1848452 | 0.07 |
ENST00000170168.9
|
REXO1
|
RNA exonuclease 1 homolog |
| chr8_+_42338477 | 0.07 |
ENST00000518925.5
ENST00000265421.9 |
POLB
|
DNA polymerase beta |
| chr12_+_57230086 | 0.07 |
ENST00000414700.7
ENST00000557703.5 |
SHMT2
|
serine hydroxymethyltransferase 2 |
| chr2_+_167187364 | 0.07 |
ENST00000672671.1
|
XIRP2
|
xin actin binding repeat containing 2 |
| chr9_+_100442271 | 0.07 |
ENST00000502978.1
|
MSANTD3-TMEFF1
|
MSANTD3-TMEFF1 readthrough |
| chr19_+_15086980 | 0.07 |
ENST00000209540.2
|
OR1I1
|
olfactory receptor family 1 subfamily I member 1 |
| chr19_+_10928777 | 0.07 |
ENST00000270502.7
|
TIMM29
|
translocase of inner mitochondrial membrane 29 |
| chr11_-_47767275 | 0.07 |
ENST00000263773.10
|
FNBP4
|
formin binding protein 4 |
| chr5_-_35195236 | 0.07 |
ENST00000509839.5
|
PRLR
|
prolactin receptor |
| chr2_+_234050732 | 0.07 |
ENST00000425558.1
|
SPP2
|
secreted phosphoprotein 2 |
| chr1_+_169367934 | 0.06 |
ENST00000367807.7
ENST00000329281.6 ENST00000420531.1 |
BLZF1
|
basic leucine zipper nuclear factor 1 |
| chr10_-_101843920 | 0.06 |
ENST00000358038.7
|
KCNIP2
|
potassium voltage-gated channel interacting protein 2 |
| chr14_+_22207502 | 0.06 |
ENST00000390461.2
|
TRAV34
|
T cell receptor alpha variable 34 |
| chr2_+_233693659 | 0.06 |
ENST00000406651.1
|
UGT1A6
|
UDP glucuronosyltransferase family 1 member A6 |
| chr1_+_220094086 | 0.06 |
ENST00000366922.3
|
IARS2
|
isoleucyl-tRNA synthetase 2, mitochondrial |
| chr1_-_13201409 | 0.06 |
ENST00000625019.3
|
PRAMEF13
|
PRAME family member 13 |
| chr6_+_150368892 | 0.06 |
ENST00000229447.9
ENST00000392256.6 |
IYD
|
iodotyrosine deiodinase |
| chr22_+_20967212 | 0.06 |
ENST00000434714.6
|
AIFM3
|
apoptosis inducing factor mitochondria associated 3 |
| chr20_-_46684467 | 0.06 |
ENST00000372121.5
|
SLC13A3
|
solute carrier family 13 member 3 |
| chr9_-_122159742 | 0.06 |
ENST00000373768.4
|
NDUFA8
|
NADH:ubiquinone oxidoreductase subunit A8 |
| chr7_+_75882044 | 0.06 |
ENST00000428119.1
|
RHBDD2
|
rhomboid domain containing 2 |
| chr19_-_42412347 | 0.06 |
ENST00000601189.1
ENST00000599211.1 |
LIPE
|
lipase E, hormone sensitive type |
| chr11_+_64555956 | 0.06 |
ENST00000377581.7
|
SLC22A11
|
solute carrier family 22 member 11 |
| chr5_-_113488415 | 0.06 |
ENST00000408903.7
|
MCC
|
MCC regulator of WNT signaling pathway |
| chr1_-_51325924 | 0.06 |
ENST00000532836.5
ENST00000422925.6 |
TTC39A
|
tetratricopeptide repeat domain 39A |
| chr12_+_69359673 | 0.06 |
ENST00000548020.5
ENST00000549685.5 ENST00000247843.7 ENST00000552955.1 |
YEATS4
|
YEATS domain containing 4 |
| chr1_+_43300971 | 0.06 |
ENST00000372476.8
ENST00000538015.1 |
TIE1
|
tyrosine kinase with immunoglobulin like and EGF like domains 1 |
| chr17_+_7561899 | 0.06 |
ENST00000321337.12
|
SENP3
|
SUMO specific peptidase 3 |
| chr5_+_40841308 | 0.06 |
ENST00000381677.4
ENST00000254691.10 |
CARD6
|
caspase recruitment domain family member 6 |
| chr19_-_10928585 | 0.06 |
ENST00000590329.5
ENST00000587943.5 ENST00000586748.6 ENST00000585858.1 ENST00000586575.5 ENST00000253031.6 |
YIPF2
|
Yip1 domain family member 2 |
| chr6_-_43687774 | 0.06 |
ENST00000372133.8
ENST00000372116.5 ENST00000427312.1 |
MRPS18A
|
mitochondrial ribosomal protein S18A |
| chr12_-_96035571 | 0.06 |
ENST00000228740.7
|
LTA4H
|
leukotriene A4 hydrolase |
| chr19_-_38735405 | 0.06 |
ENST00000597987.5
ENST00000595177.1 |
CAPN12
|
calpain 12 |
| chr3_-_48188356 | 0.06 |
ENST00000351231.7
ENST00000437972.1 ENST00000302506.8 |
CDC25A
|
cell division cycle 25A |
| chr22_-_38317423 | 0.06 |
ENST00000396832.6
ENST00000403904.5 ENST00000405675.7 |
CSNK1E
|
casein kinase 1 epsilon |
| chr19_-_45643688 | 0.06 |
ENST00000536630.5
|
EML2
|
EMAP like 2 |
| chr22_+_30409097 | 0.06 |
ENST00000439838.5
ENST00000439023.3 |
ENSG00000249590.7
|
novel SEC14-like 2 (S. cerevisiae) (SEC14L2) and mitochondrial protein 18 kDa (MTP18) protein |
| chr2_+_167187283 | 0.06 |
ENST00000409605.1
ENST00000409273.6 |
XIRP2
|
xin actin binding repeat containing 2 |
| chr19_-_54063905 | 0.06 |
ENST00000645936.1
ENST00000376626.5 ENST00000366170.6 ENST00000425006.3 |
VSTM1
|
V-set and transmembrane domain containing 1 |
| chr10_+_78035506 | 0.06 |
ENST00000645195.1
|
RPS24
|
ribosomal protein S24 |
| chr5_+_151259793 | 0.06 |
ENST00000523004.1
|
GM2A
|
GM2 ganglioside activator |
| chr17_-_58692032 | 0.06 |
ENST00000349033.10
ENST00000389934.7 |
TEX14
|
testis expressed 14, intercellular bridge forming factor |
| chr2_+_48617798 | 0.06 |
ENST00000448460.5
ENST00000437125.5 ENST00000430487.6 |
GTF2A1L
|
general transcription factor IIA subunit 1 like |
| chr8_+_103298433 | 0.06 |
ENST00000522566.5
|
FZD6
|
frizzled class receptor 6 |
| chr14_-_24271503 | 0.06 |
ENST00000216840.11
ENST00000399409.7 |
RABGGTA
|
Rab geranylgeranyltransferase subunit alpha |
| chr13_-_41263484 | 0.05 |
ENST00000379477.5
ENST00000452359.5 ENST00000379480.9 ENST00000430347.3 |
MTRF1
|
mitochondrial translation release factor 1 |
| chr9_+_32552305 | 0.05 |
ENST00000451672.2
ENST00000644531.1 |
SMIM27
|
small integral membrane protein 27 |
| chr15_-_73368951 | 0.05 |
ENST00000261917.4
|
HCN4
|
hyperpolarization activated cyclic nucleotide gated potassium channel 4 |
| chr12_-_103957122 | 0.05 |
ENST00000552940.1
ENST00000547975.5 ENST00000549478.1 ENST00000546540.1 ENST00000378090.9 ENST00000546819.1 ENST00000547945.5 |
C12orf73
|
chromosome 12 open reading frame 73 |
| chr17_-_58692021 | 0.05 |
ENST00000240361.12
|
TEX14
|
testis expressed 14, intercellular bridge forming factor |
| chr5_+_126423176 | 0.05 |
ENST00000542322.5
ENST00000544396.5 |
GRAMD2B
|
GRAM domain containing 2B |
| chr20_+_19758245 | 0.05 |
ENST00000255006.12
|
RIN2
|
Ras and Rab interactor 2 |
| chr22_+_40678750 | 0.05 |
ENST00000249016.4
|
MCHR1
|
melanin concentrating hormone receptor 1 |
| chr11_+_85628573 | 0.05 |
ENST00000393375.5
ENST00000358867.11 ENST00000534341.1 ENST00000531274.1 |
TMEM126B
|
transmembrane protein 126B |
| chrX_+_1615158 | 0.05 |
ENST00000381229.9
ENST00000381233.8 |
ASMT
|
acetylserotonin O-methyltransferase |
| chr5_+_126423122 | 0.05 |
ENST00000515200.5
|
GRAMD2B
|
GRAM domain containing 2B |
| chr6_-_169701586 | 0.05 |
ENST00000423258.5
|
WDR27
|
WD repeat domain 27 |
| chr3_-_130746760 | 0.05 |
ENST00000356763.8
|
PIK3R4
|
phosphoinositide-3-kinase regulatory subunit 4 |
| chr17_+_39628496 | 0.05 |
ENST00000394265.5
ENST00000394267.2 |
PPP1R1B
|
protein phosphatase 1 regulatory inhibitor subunit 1B |
| chr6_+_167999092 | 0.05 |
ENST00000443060.6
|
KIF25
|
kinesin family member 25 |
| chr6_-_149896059 | 0.05 |
ENST00000532335.5
|
RAET1E
|
retinoic acid early transcript 1E |
| chrX_+_1615049 | 0.05 |
ENST00000381241.9
|
ASMT
|
acetylserotonin O-methyltransferase |
| chr6_-_31795627 | 0.05 |
ENST00000375663.8
|
VARS1
|
valyl-tRNA synthetase 1 |
| chr12_-_50396601 | 0.05 |
ENST00000327337.6
ENST00000543111.5 |
FAM186A
|
family with sequence similarity 186 member A |
| chr6_-_49636832 | 0.05 |
ENST00000371175.10
ENST00000646272.1 ENST00000646939.1 ENST00000618248.3 ENST00000229810.9 ENST00000646963.1 |
RHAG
|
Rh associated glycoprotein |
| chr2_-_180007254 | 0.05 |
ENST00000410053.8
|
CWC22
|
CWC22 spliceosome associated protein homolog |
| chr17_+_7627963 | 0.05 |
ENST00000575729.5
ENST00000340624.9 |
SHBG
|
sex hormone binding globulin |
| chr10_-_94362925 | 0.05 |
ENST00000371361.3
|
NOC3L
|
NOC3 like DNA replication regulator |
| chr2_-_2324323 | 0.05 |
ENST00000648339.1
ENST00000647694.1 |
MYT1L
|
myelin transcription factor 1 like |
| chr9_-_34895722 | 0.05 |
ENST00000603640.6
ENST00000603592.1 ENST00000340783.11 |
FAM205C
|
family with sequence similarity 205 member C |
| chr11_+_89924064 | 0.05 |
ENST00000623787.3
|
TRIM49D2
|
tripartite motif containing 49D2 |
| chr4_-_155376876 | 0.05 |
ENST00000433024.5
ENST00000379248.6 |
MAP9
|
microtubule associated protein 9 |
| chr15_+_58987652 | 0.04 |
ENST00000348370.9
ENST00000559160.1 |
RNF111
|
ring finger protein 111 |
| chr11_+_36296281 | 0.04 |
ENST00000530639.6
|
PRR5L
|
proline rich 5 like |
| chr3_+_25790076 | 0.04 |
ENST00000280701.8
ENST00000420173.2 |
OXSM
|
3-oxoacyl-ACP synthase, mitochondrial |
| chr2_-_74465162 | 0.04 |
ENST00000649854.1
ENST00000650523.1 ENST00000649601.1 ENST00000448666.7 ENST00000409065.5 ENST00000414701.1 ENST00000452063.7 ENST00000649075.1 ENST00000648810.1 ENST00000462443.2 |
MOGS
|
mannosyl-oligosaccharide glucosidase |
| chr14_+_63761836 | 0.04 |
ENST00000674003.1
|
SYNE2
|
spectrin repeat containing nuclear envelope protein 2 |
| chr9_-_72364504 | 0.04 |
ENST00000237937.7
ENST00000343431.6 ENST00000376956.3 |
ZFAND5
|
zinc finger AN1-type containing 5 |
| chr3_+_42091316 | 0.04 |
ENST00000327628.10
|
TRAK1
|
trafficking kinesin protein 1 |
| chr2_+_48617841 | 0.04 |
ENST00000403751.8
|
GTF2A1L
|
general transcription factor IIA subunit 1 like |
| chr1_-_110963897 | 0.04 |
ENST00000369763.5
|
LRIF1
|
ligand dependent nuclear receptor interacting factor 1 |
| chr1_-_12848720 | 0.04 |
ENST00000317869.7
|
HNRNPCL1
|
heterogeneous nuclear ribonucleoprotein C like 1 |
| chr3_+_35680994 | 0.04 |
ENST00000441454.5
|
ARPP21
|
cAMP regulated phosphoprotein 21 |
| chr6_-_32192845 | 0.04 |
ENST00000487761.5
|
GPSM3
|
G protein signaling modulator 3 |
| chr12_-_6689450 | 0.04 |
ENST00000355772.8
ENST00000417772.7 ENST00000319770.7 ENST00000396801.7 |
ZNF384
|
zinc finger protein 384 |
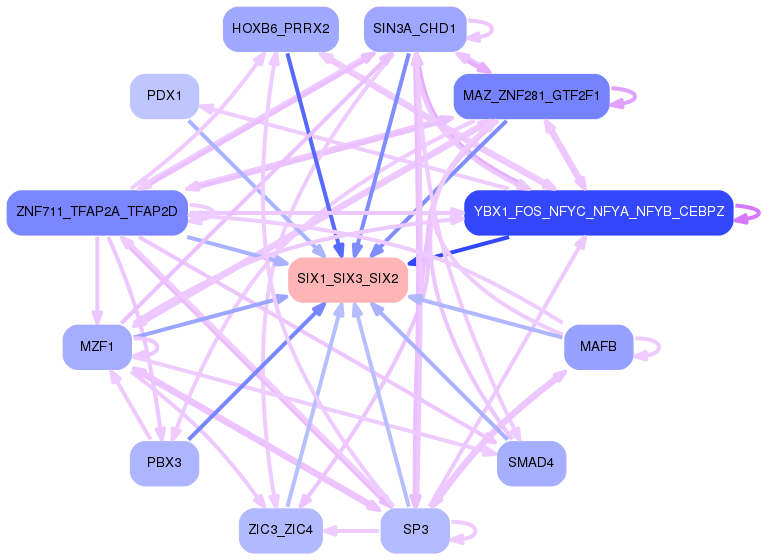
Network of associatons between targets according to the STRING database.

First level regulatory network of SIX1_SIX3_SIX2
Gene Ontology Analysis
Gene overrepresentation in biological process category:
| Log-likelihood per target | Total log-likelihood | Term | Description |
|---|---|---|---|
| 0.1 | 0.4 | GO:0060559 | positive regulation of vitamin metabolic process(GO:0046136) positive regulation of vitamin D biosynthetic process(GO:0060557) positive regulation of calcidiol 1-monooxygenase activity(GO:0060559) |
| 0.1 | 0.2 | GO:1902948 | regulation of choline O-acetyltransferase activity(GO:1902769) positive regulation of choline O-acetyltransferase activity(GO:1902771) negative regulation of tau-protein kinase activity(GO:1902948) positive regulation of early endosome to recycling endosome transport(GO:1902955) negative regulation of aspartic-type endopeptidase activity involved in amyloid precursor protein catabolic process(GO:1902960) negative regulation of neurofibrillary tangle assembly(GO:1902997) negative regulation of aspartic-type peptidase activity(GO:1905246) |
| 0.1 | 0.5 | GO:2001268 | negative regulation of cysteine-type endopeptidase activity involved in apoptotic signaling pathway(GO:2001268) |
| 0.1 | 0.2 | GO:0009236 | cobalamin biosynthetic process(GO:0009236) |
| 0.1 | 0.4 | GO:0071395 | response to jasmonic acid(GO:0009753) cellular response to jasmonic acid stimulus(GO:0071395) |
| 0.1 | 0.2 | GO:0045659 | regulation of neutrophil differentiation(GO:0045658) negative regulation of neutrophil differentiation(GO:0045659) |
| 0.1 | 7.8 | GO:0006970 | response to osmotic stress(GO:0006970) |
| 0.1 | 0.2 | GO:1903937 | response to acrylamide(GO:1903937) |
| 0.0 | 0.1 | GO:0070124 | mitochondrial translational initiation(GO:0070124) |
| 0.0 | 0.2 | GO:0071918 | urea transmembrane transport(GO:0071918) |
| 0.0 | 0.3 | GO:0071461 | cellular response to redox state(GO:0071461) |
| 0.0 | 0.6 | GO:1900378 | positive regulation of melanin biosynthetic process(GO:0048023) positive regulation of secondary metabolite biosynthetic process(GO:1900378) |
| 0.0 | 0.3 | GO:0001712 | ectoderm formation(GO:0001705) ectodermal cell fate commitment(GO:0001712) |
| 0.0 | 0.1 | GO:0006288 | base-excision repair, DNA ligation(GO:0006288) |
| 0.0 | 0.1 | GO:0010587 | miRNA catabolic process(GO:0010587) |
| 0.0 | 0.1 | GO:2000638 | regulation of SREBP signaling pathway(GO:2000638) negative regulation of SREBP signaling pathway(GO:2000639) |
| 0.0 | 0.1 | GO:0086073 | bundle of His cell-Purkinje myocyte adhesion involved in cell communication(GO:0086073) |
| 0.0 | 0.1 | GO:0030186 | melatonin metabolic process(GO:0030186) melatonin biosynthetic process(GO:0030187) |
| 0.0 | 0.3 | GO:0002934 | desmosome organization(GO:0002934) |
| 0.0 | 0.3 | GO:0097264 | self proteolysis(GO:0097264) |
| 0.0 | 0.2 | GO:1902412 | regulation of mitotic cytokinesis(GO:1902412) |
| 0.0 | 0.2 | GO:0050859 | negative regulation of B cell receptor signaling pathway(GO:0050859) |
| 0.0 | 0.1 | GO:0002357 | defense response to tumor cell(GO:0002357) |
| 0.0 | 0.1 | GO:0072299 | posterior mesonephric tubule development(GO:0072166) negative regulation of metanephric glomerulus development(GO:0072299) negative regulation of metanephric glomerular mesangial cell proliferation(GO:0072302) |
| 0.0 | 0.2 | GO:2001288 | positive regulation of caveolin-mediated endocytosis(GO:2001288) |
| 0.0 | 0.1 | GO:0038161 | prolactin signaling pathway(GO:0038161) |
| 0.0 | 0.1 | GO:0019264 | glycine biosynthetic process from serine(GO:0019264) |
| 0.0 | 0.2 | GO:0007598 | blood coagulation, extrinsic pathway(GO:0007598) |
| 0.0 | 0.0 | GO:0046603 | negative regulation of mitotic centrosome separation(GO:0046603) |
| 0.0 | 0.1 | GO:0015744 | succinate transport(GO:0015744) succinate transmembrane transport(GO:0071422) |
| 0.0 | 0.2 | GO:0006930 | substrate-dependent cell migration, cell extension(GO:0006930) |
| 0.0 | 0.0 | GO:0015670 | carbon dioxide transport(GO:0015670) |
| 0.0 | 0.2 | GO:2000002 | negative regulation of DNA damage checkpoint(GO:2000002) |
| 0.0 | 0.1 | GO:0035880 | embryonic nail plate morphogenesis(GO:0035880) |
| 0.0 | 0.1 | GO:0050955 | thermoception(GO:0050955) |
| 0.0 | 0.3 | GO:0006044 | N-acetylglucosamine metabolic process(GO:0006044) |
| 0.0 | 2.2 | GO:0007156 | homophilic cell adhesion via plasma membrane adhesion molecules(GO:0007156) |
| 0.0 | 0.1 | GO:0006570 | tyrosine metabolic process(GO:0006570) |
| 0.0 | 0.0 | GO:0098957 | anterograde axonal transport of mitochondrion(GO:0098957) |
| 0.0 | 0.1 | GO:0015747 | urate transport(GO:0015747) |
| 0.0 | 0.1 | GO:0046340 | diacylglycerol catabolic process(GO:0046340) |
| 0.0 | 0.1 | GO:0032466 | negative regulation of cytokinesis(GO:0032466) |
Gene overrepresentation in cellular component category:
| Log-likelihood per target | Total log-likelihood | Term | Description |
|---|---|---|---|
| 0.0 | 0.3 | GO:0072557 | IPAF inflammasome complex(GO:0072557) |
| 0.0 | 0.4 | GO:1990023 | mitotic spindle midzone(GO:1990023) |
| 0.0 | 0.2 | GO:0033596 | TSC1-TSC2 complex(GO:0033596) |
| 0.0 | 1.4 | GO:0030057 | desmosome(GO:0030057) |
| 0.0 | 8.0 | GO:0005875 | microtubule associated complex(GO:0005875) |
| 0.0 | 0.5 | GO:0045009 | melanosome membrane(GO:0033162) chitosome(GO:0045009) |
| 0.0 | 0.1 | GO:1990452 | Parkin-FBXW7-Cul1 ubiquitin ligase complex(GO:1990452) |
| 0.0 | 0.1 | GO:0098855 | HCN channel complex(GO:0098855) |
| 0.0 | 0.0 | GO:0034272 | phosphatidylinositol 3-kinase complex, class III, type I(GO:0034271) phosphatidylinositol 3-kinase complex, class III, type II(GO:0034272) |
| 0.0 | 0.0 | GO:0071006 | U2-type catalytic step 1 spliceosome(GO:0071006) |
| 0.0 | 0.1 | GO:0005889 | hydrogen:potassium-exchanging ATPase complex(GO:0005889) |
| 0.0 | 0.1 | GO:0005968 | Rab-protein geranylgeranyltransferase complex(GO:0005968) |
| 0.0 | 0.2 | GO:0005688 | U6 snRNP(GO:0005688) |
| 0.0 | 0.1 | GO:0070552 | BRISC complex(GO:0070552) |
| 0.0 | 0.1 | GO:1990130 | Iml1 complex(GO:1990130) |
| 0.0 | 0.1 | GO:0005672 | transcription factor TFIIA complex(GO:0005672) |
| 0.0 | 0.0 | GO:0031251 | PAN complex(GO:0031251) |
| 0.0 | 0.2 | GO:0005641 | nuclear envelope lumen(GO:0005641) |
Gene overrepresentation in molecular function category:
| Log-likelihood per target | Total log-likelihood | Term | Description |
|---|---|---|---|
| 0.1 | 0.3 | GO:0004060 | arylamine N-acetyltransferase activity(GO:0004060) |
| 0.1 | 0.3 | GO:0047023 | androsterone dehydrogenase activity(GO:0047023) |
| 0.1 | 0.3 | GO:0015265 | urea channel activity(GO:0015265) |
| 0.0 | 0.3 | GO:0000293 | ferric-chelate reductase activity(GO:0000293) |
| 0.0 | 0.3 | GO:0001517 | N-acetylglucosamine 6-O-sulfotransferase activity(GO:0001517) |
| 0.0 | 0.2 | GO:0016314 | phosphatidylinositol-3,4,5-trisphosphate 3-phosphatase activity(GO:0016314) |
| 0.0 | 0.1 | GO:0003845 | 11-beta-hydroxysteroid dehydrogenase [NAD(P)] activity(GO:0003845) |
| 0.0 | 0.4 | GO:0008420 | CTD phosphatase activity(GO:0008420) |
| 0.0 | 0.2 | GO:0016723 | oxidoreductase activity, oxidizing metal ions, NAD or NADP as acceptor(GO:0016723) |
| 0.0 | 0.3 | GO:0004983 | neuropeptide Y receptor activity(GO:0004983) |
| 0.0 | 0.1 | GO:0004447 | iodide peroxidase activity(GO:0004447) |
| 0.0 | 0.3 | GO:0005094 | Rho GDP-dissociation inhibitor activity(GO:0005094) |
| 0.0 | 0.1 | GO:0004925 | prolactin receptor activity(GO:0004925) |
| 0.0 | 0.1 | GO:0070180 | large ribosomal subunit rRNA binding(GO:0070180) |
| 0.0 | 0.0 | GO:0018636 | phenanthrene 9,10-monooxygenase activity(GO:0018636) ketosteroid monooxygenase activity(GO:0047086) |
| 0.0 | 0.1 | GO:0033878 | hormone-sensitive lipase activity(GO:0033878) |
| 0.0 | 0.1 | GO:0004372 | glycine hydroxymethyltransferase activity(GO:0004372) threonine aldolase activity(GO:0004793) L-allo-threonine aldolase activity(GO:0008732) |
| 0.0 | 0.1 | GO:0032428 | sphingolipid activator protein activity(GO:0030290) beta-N-acetylgalactosaminidase activity(GO:0032428) |
| 0.0 | 0.4 | GO:0005149 | interleukin-1 receptor binding(GO:0005149) |
| 0.0 | 0.1 | GO:0050816 | phosphothreonine binding(GO:0050816) |
| 0.0 | 0.0 | GO:0070905 | serine binding(GO:0070905) |
| 0.0 | 0.0 | GO:0031751 | D4 dopamine receptor binding(GO:0031751) |
| 0.0 | 0.1 | GO:0015141 | succinate transmembrane transporter activity(GO:0015141) |
| 0.0 | 0.1 | GO:0044729 | hemi-methylated DNA-binding(GO:0044729) |
| 0.0 | 0.0 | GO:0004315 | 3-oxoacyl-[acyl-carrier-protein] synthase activity(GO:0004315) |
| 0.0 | 0.2 | GO:0030621 | U4 snRNA binding(GO:0030621) |
| 0.0 | 0.1 | GO:0086083 | cell adhesive protein binding involved in bundle of His cell-Purkinje myocyte communication(GO:0086083) |
| 0.0 | 0.2 | GO:0005522 | profilin binding(GO:0005522) |
| 0.0 | 0.1 | GO:0015349 | thyroid hormone transmembrane transporter activity(GO:0015349) |
| 0.0 | 0.1 | GO:0008172 | S-methyltransferase activity(GO:0008172) |
| 0.0 | 0.2 | GO:0030306 | ADP-ribosylation factor binding(GO:0030306) |
| 0.0 | 0.1 | GO:1990825 | sequence-specific mRNA binding(GO:1990825) |
| 0.0 | 0.1 | GO:0004663 | Rab geranylgeranyltransferase activity(GO:0004663) |
| 0.0 | 0.1 | GO:0005222 | intracellular cAMP activated cation channel activity(GO:0005222) |
| 0.0 | 0.1 | GO:0005250 | A-type (transient outward) potassium channel activity(GO:0005250) |
| 0.0 | 0.2 | GO:0019870 | potassium channel inhibitor activity(GO:0019870) |
| 0.0 | 0.1 | GO:0015143 | urate transmembrane transporter activity(GO:0015143) salt transmembrane transporter activity(GO:1901702) |
Gene overrepresentation in curated gene sets: canonical pathways category:
| Log-likelihood per target | Total log-likelihood | Term | Description |
|---|---|---|---|
| 0.0 | 0.4 | PID ANTHRAX PATHWAY | Cellular roles of Anthrax toxin |
| 0.0 | 0.4 | PID SMAD2 3PATHWAY | Regulation of cytoplasmic and nuclear SMAD2/3 signaling |
Gene overrepresentation in curated gene sets: REACTOME pathways category:
| Log-likelihood per target | Total log-likelihood | Term | Description |
|---|---|---|---|
| 0.0 | 0.3 | REACTOME PASSIVE TRANSPORT BY AQUAPORINS | Genes involved in Passive Transport by Aquaporins |
| 0.0 | 0.2 | REACTOME SYNTHESIS OF BILE ACIDS AND BILE SALTS VIA 24 HYDROXYCHOLESTEROL | Genes involved in Synthesis of bile acids and bile salts via 24-hydroxycholesterol |
| 0.0 | 0.4 | REACTOME DEGRADATION OF THE EXTRACELLULAR MATRIX | Genes involved in Degradation of the extracellular matrix |
| 0.0 | 0.2 | REACTOME GAMMA CARBOXYLATION TRANSPORT AND AMINO TERMINAL CLEAVAGE OF PROTEINS | Genes involved in Gamma-carboxylation, transport, and amino-terminal cleavage of proteins |