| 1.8 |
11.0 |
GO:0002225 |
positive regulation of antimicrobial peptide production(GO:0002225) positive regulation of antibacterial peptide production(GO:0002803) |
| 1.5 |
6.0 |
GO:0032690 |
negative regulation of interleukin-1 alpha production(GO:0032690) negative regulation of interleukin-1 alpha secretion(GO:0050712) |
| 0.7 |
2.9 |
GO:0042361 |
menaquinone catabolic process(GO:0042361) vitamin K catabolic process(GO:0042377) |
| 0.6 |
2.5 |
GO:0032600 |
B cell receptor transport within lipid bilayer(GO:0032595) B cell receptor transport into membrane raft(GO:0032597) protein transport out of membrane raft(GO:0032599) chemokine receptor transport out of membrane raft(GO:0032600) negative regulation of transforming growth factor beta3 production(GO:0032913) chemokine receptor transport within lipid bilayer(GO:0033606) |
| 0.5 |
1.0 |
GO:0060557 |
positive regulation of vitamin metabolic process(GO:0046136) positive regulation of vitamin D biosynthetic process(GO:0060557) positive regulation of calcidiol 1-monooxygenase activity(GO:0060559) |
| 0.5 |
1.4 |
GO:0002588 |
positive regulation of antigen processing and presentation of peptide or polysaccharide antigen via MHC class II(GO:0002582) positive regulation of antigen processing and presentation of peptide antigen(GO:0002585) positive regulation of antigen processing and presentation of peptide antigen via MHC class II(GO:0002588) |
| 0.5 |
1.4 |
GO:2000309 |
positive regulation of tumor necrosis factor (ligand) superfamily member 11 production(GO:2000309) |
| 0.4 |
1.2 |
GO:1902948 |
regulation of choline O-acetyltransferase activity(GO:1902769) positive regulation of choline O-acetyltransferase activity(GO:1902771) negative regulation of tau-protein kinase activity(GO:1902948) positive regulation of early endosome to recycling endosome transport(GO:1902955) negative regulation of aspartic-type endopeptidase activity involved in amyloid precursor protein catabolic process(GO:1902960) negative regulation of neurofibrillary tangle assembly(GO:1902997) negative regulation of aspartic-type peptidase activity(GO:1905246) |
| 0.4 |
1.6 |
GO:1903575 |
cornified envelope assembly(GO:1903575) |
| 0.3 |
0.7 |
GO:0002586 |
regulation of antigen processing and presentation of peptide antigen via MHC class II(GO:0002586) |
| 0.3 |
1.5 |
GO:0098904 |
regulation of AV node cell action potential(GO:0098904) |
| 0.3 |
1.5 |
GO:2001181 |
positive regulation of interleukin-10 secretion(GO:2001181) |
| 0.3 |
1.2 |
GO:0010900 |
negative regulation of phosphatidylcholine catabolic process(GO:0010900) |
| 0.3 |
1.1 |
GO:0045659 |
regulation of neutrophil differentiation(GO:0045658) negative regulation of neutrophil differentiation(GO:0045659) |
| 0.3 |
1.1 |
GO:0051710 |
regulation of cytolysis in other organism(GO:0051710) |
| 0.3 |
2.8 |
GO:0038044 |
transforming growth factor-beta secretion(GO:0038044) |
| 0.3 |
1.5 |
GO:0006021 |
inositol biosynthetic process(GO:0006021) |
| 0.2 |
1.0 |
GO:0034224 |
cellular response to zinc ion starvation(GO:0034224) |
| 0.2 |
1.0 |
GO:0060708 |
spongiotrophoblast differentiation(GO:0060708) |
| 0.2 |
0.7 |
GO:0002415 |
immunoglobulin transcytosis in epithelial cells mediated by polymeric immunoglobulin receptor(GO:0002415) |
| 0.2 |
1.2 |
GO:0090362 |
positive regulation of platelet-derived growth factor production(GO:0090362) |
| 0.2 |
1.2 |
GO:0097021 |
Peyer's patch morphogenesis(GO:0061146) lymphocyte migration into lymphoid organs(GO:0097021) |
| 0.2 |
1.0 |
GO:0000738 |
DNA catabolic process, exonucleolytic(GO:0000738) |
| 0.2 |
0.5 |
GO:0048817 |
negative regulation of hair follicle maturation(GO:0048817) |
| 0.2 |
2.0 |
GO:1901731 |
positive regulation of platelet aggregation(GO:1901731) |
| 0.2 |
0.6 |
GO:2000752 |
regulation of phospholipid scramblase activity(GO:1900161) positive regulation of phospholipid scramblase activity(GO:1900163) regulation of glucosylceramide catabolic process(GO:2000752) positive regulation of glucosylceramide catabolic process(GO:2000753) regulation of sphingomyelin catabolic process(GO:2000754) positive regulation of sphingomyelin catabolic process(GO:2000755) |
| 0.2 |
0.8 |
GO:0035627 |
ceramide transport(GO:0035627) |
| 0.2 |
0.6 |
GO:0070318 |
positive regulation of G0 to G1 transition(GO:0070318) |
| 0.2 |
0.9 |
GO:0071109 |
superior temporal gyrus development(GO:0071109) |
| 0.2 |
0.9 |
GO:1902943 |
regulation of voltage-gated chloride channel activity(GO:1902941) positive regulation of voltage-gated chloride channel activity(GO:1902943) |
| 0.2 |
0.5 |
GO:0018057 |
peptidyl-lysine oxidation(GO:0018057) |
| 0.2 |
0.5 |
GO:0061589 |
calcium activated phosphatidylserine scrambling(GO:0061589) |
| 0.2 |
0.3 |
GO:1903937 |
response to acrylamide(GO:1903937) |
| 0.2 |
4.7 |
GO:0090026 |
positive regulation of monocyte chemotaxis(GO:0090026) |
| 0.2 |
0.5 |
GO:0035425 |
autocrine signaling(GO:0035425) |
| 0.2 |
0.7 |
GO:0036515 |
serotonergic neuron axon guidance(GO:0036515) |
| 0.2 |
0.8 |
GO:2000721 |
positive regulation of transcription from RNA polymerase II promoter involved in smooth muscle cell differentiation(GO:2000721) |
| 0.2 |
0.5 |
GO:1903028 |
positive regulation of opsonization(GO:1903028) |
| 0.2 |
1.0 |
GO:0003011 |
involuntary skeletal muscle contraction(GO:0003011) |
| 0.2 |
0.6 |
GO:0060448 |
dichotomous subdivision of terminal units involved in lung branching(GO:0060448) |
| 0.2 |
0.6 |
GO:2000660 |
negative regulation of interleukin-1-mediated signaling pathway(GO:2000660) |
| 0.2 |
0.3 |
GO:2000646 |
positive regulation of receptor catabolic process(GO:2000646) |
| 0.2 |
1.1 |
GO:0031133 |
regulation of axon diameter(GO:0031133) |
| 0.2 |
0.9 |
GO:0033277 |
abortive mitotic cell cycle(GO:0033277) |
| 0.2 |
0.2 |
GO:0002428 |
antigen processing and presentation of peptide antigen via MHC class Ib(GO:0002428) |
| 0.1 |
0.3 |
GO:0071284 |
cellular response to lead ion(GO:0071284) |
| 0.1 |
1.0 |
GO:1903237 |
negative regulation of leukocyte tethering or rolling(GO:1903237) |
| 0.1 |
0.4 |
GO:0044537 |
regulation of circulating fibrinogen levels(GO:0044537) |
| 0.1 |
1.3 |
GO:0031444 |
slow-twitch skeletal muscle fiber contraction(GO:0031444) |
| 0.1 |
1.8 |
GO:0045743 |
positive regulation of fibroblast growth factor receptor signaling pathway(GO:0045743) |
| 0.1 |
0.1 |
GO:0032827 |
natural killer cell differentiation involved in immune response(GO:0002325) negative regulation of natural killer cell differentiation(GO:0032824) regulation of natural killer cell differentiation involved in immune response(GO:0032826) negative regulation of natural killer cell differentiation involved in immune response(GO:0032827) |
| 0.1 |
0.3 |
GO:0033023 |
mast cell homeostasis(GO:0033023) mast cell apoptotic process(GO:0033024) regulation of mast cell apoptotic process(GO:0033025) |
| 0.1 |
0.6 |
GO:1902162 |
regulation of DNA damage response, signal transduction by p53 class mediator resulting in transcription of p21 class mediator(GO:1902162) positive regulation of DNA damage response, signal transduction by p53 class mediator resulting in transcription of p21 class mediator(GO:1902164) |
| 0.1 |
0.4 |
GO:0001869 |
regulation of complement activation, lectin pathway(GO:0001868) negative regulation of complement activation, lectin pathway(GO:0001869) |
| 0.1 |
1.0 |
GO:0015888 |
thiamine transport(GO:0015888) |
| 0.1 |
0.4 |
GO:0035793 |
positive regulation of metanephric mesenchymal cell migration by platelet-derived growth factor receptor-beta signaling pathway(GO:0035793) metanephric mesangial cell differentiation(GO:0072209) metanephric glomerular mesangial cell differentiation(GO:0072254) regulation of metanephric mesenchymal cell migration by platelet-derived growth factor receptor-beta signaling pathway(GO:1900238) positive regulation of metanephric mesenchymal cell migration(GO:2000591) |
| 0.1 |
2.2 |
GO:1900029 |
positive regulation of ruffle assembly(GO:1900029) |
| 0.1 |
0.7 |
GO:0010760 |
negative regulation of macrophage chemotaxis(GO:0010760) |
| 0.1 |
0.3 |
GO:0032499 |
detection of peptidoglycan(GO:0032499) |
| 0.1 |
0.5 |
GO:0016119 |
carotene metabolic process(GO:0016119) |
| 0.1 |
0.5 |
GO:0010046 |
response to mycotoxin(GO:0010046) |
| 0.1 |
0.4 |
GO:0050705 |
regulation of interleukin-1 alpha secretion(GO:0050705) |
| 0.1 |
0.4 |
GO:0050976 |
detection of mechanical stimulus involved in sensory perception of touch(GO:0050976) |
| 0.1 |
0.8 |
GO:1904220 |
regulation of serine C-palmitoyltransferase activity(GO:1904220) |
| 0.1 |
0.4 |
GO:0001794 |
type IIa hypersensitivity(GO:0001794) regulation of type IIa hypersensitivity(GO:0001796) type II hypersensitivity(GO:0002445) regulation of type II hypersensitivity(GO:0002892) |
| 0.1 |
0.4 |
GO:0002668 |
negative regulation of T cell tolerance induction(GO:0002665) negative regulation of T cell anergy(GO:0002668) negative regulation of lymphocyte anergy(GO:0002912) regulation of lymphotoxin A production(GO:0032681) positive regulation of lymphotoxin A production(GO:0032761) regulation of lymphotoxin A biosynthetic process(GO:0043016) positive regulation of lymphotoxin A biosynthetic process(GO:0043017) |
| 0.1 |
1.0 |
GO:0070995 |
NADPH oxidation(GO:0070995) |
| 0.1 |
0.4 |
GO:0072608 |
interleukin-10 secretion(GO:0072608) |
| 0.1 |
1.6 |
GO:0032782 |
bile acid secretion(GO:0032782) |
| 0.1 |
0.1 |
GO:1903244 |
positive regulation of cardiac muscle adaptation(GO:0010615) positive regulation of cardiac muscle hypertrophy in response to stress(GO:1903244) |
| 0.1 |
1.9 |
GO:0035878 |
nail development(GO:0035878) |
| 0.1 |
0.6 |
GO:0032929 |
negative regulation of superoxide anion generation(GO:0032929) |
| 0.1 |
0.9 |
GO:1902219 |
negative regulation of intrinsic apoptotic signaling pathway in response to osmotic stress(GO:1902219) |
| 0.1 |
0.4 |
GO:0042360 |
vitamin E metabolic process(GO:0042360) |
| 0.1 |
1.1 |
GO:0002480 |
antigen processing and presentation of exogenous peptide antigen via MHC class I, TAP-independent(GO:0002480) |
| 0.1 |
0.3 |
GO:0030037 |
actin filament reorganization involved in cell cycle(GO:0030037) |
| 0.1 |
0.2 |
GO:0046271 |
phenylpropanoid catabolic process(GO:0046271) |
| 0.1 |
0.4 |
GO:0060671 |
epithelial cell differentiation involved in embryonic placenta development(GO:0060671) epithelial cell morphogenesis involved in placental branching(GO:0060672) |
| 0.1 |
0.3 |
GO:0098971 |
anterograde dendritic transport of neurotransmitter receptor complex(GO:0098971) |
| 0.1 |
0.3 |
GO:0045553 |
TRAIL production(GO:0032639) regulation of TRAIL production(GO:0032679) positive regulation of TRAIL production(GO:0032759) TRAIL biosynthetic process(GO:0045553) regulation of TRAIL biosynthetic process(GO:0045554) positive regulation of TRAIL biosynthetic process(GO:0045556) |
| 0.1 |
0.4 |
GO:1900738 |
positive regulation of phospholipase C-activating G-protein coupled receptor signaling pathway(GO:1900738) |
| 0.1 |
0.7 |
GO:0089712 |
L-aspartate transport(GO:0070778) L-aspartate transmembrane transport(GO:0089712) |
| 0.1 |
2.0 |
GO:0016540 |
protein autoprocessing(GO:0016540) |
| 0.1 |
0.3 |
GO:0070650 |
endoplasmic reticulum polarization(GO:0061163) actin filament bundle retrograde transport(GO:0061573) actin filament bundle distribution(GO:0070650) |
| 0.1 |
0.4 |
GO:0035606 |
peptidyl-cysteine S-trans-nitrosylation(GO:0035606) |
| 0.1 |
0.3 |
GO:0060003 |
copper ion export(GO:0060003) |
| 0.1 |
0.4 |
GO:0061073 |
ciliary body morphogenesis(GO:0061073) |
| 0.1 |
1.3 |
GO:0070305 |
response to cGMP(GO:0070305) |
| 0.1 |
0.9 |
GO:0061302 |
smooth muscle cell-matrix adhesion(GO:0061302) |
| 0.1 |
0.3 |
GO:2000007 |
apoptotic process involved in endocardial cushion morphogenesis(GO:0003277) intermediate mesoderm morphogenesis(GO:0048390) intermediate mesoderm formation(GO:0048391) intermediate mesodermal cell differentiation(GO:0048392) regulation of cardiac muscle fiber development(GO:0055018) positive regulation of cardiac muscle fiber development(GO:0055020) bud dilation involved in lung branching(GO:0060503) BMP signaling pathway involved in ureter morphogenesis(GO:0061149) renal system segmentation(GO:0061150) BMP signaling pathway involved in renal system segmentation(GO:0061151) pulmonary artery endothelial tube morphogenesis(GO:0061155) regulation of transcription from RNA polymerase II promoter involved in mesonephros development(GO:0061216) BMP signaling pathway involved in nephric duct formation(GO:0071893) negative regulation of branch elongation involved in ureteric bud branching(GO:0072096) negative regulation of branch elongation involved in ureteric bud branching by BMP signaling pathway(GO:0072097) anterior/posterior pattern specification involved in ureteric bud development(GO:0072099) specification of ureteric bud anterior/posterior symmetry(GO:0072100) specification of ureteric bud anterior/posterior symmetry by BMP signaling pathway(GO:0072101) ureter epithelial cell differentiation(GO:0072192) negative regulation of mesenchymal cell proliferation involved in ureter development(GO:0072200) regulation of cell proliferation involved in outflow tract morphogenesis(GO:1901963) positive regulation of cell proliferation involved in outflow tract morphogenesis(GO:1901964) cardiac jelly development(GO:1905072) regulation of metanephric S-shaped body morphogenesis(GO:2000004) negative regulation of metanephric S-shaped body morphogenesis(GO:2000005) regulation of metanephric comma-shaped body morphogenesis(GO:2000006) negative regulation of metanephric comma-shaped body morphogenesis(GO:2000007) |
| 0.1 |
0.3 |
GO:0061727 |
methylglyoxal catabolic process to D-lactate via S-lactoyl-glutathione(GO:0019243) methylglyoxal catabolic process(GO:0051596) methylglyoxal catabolic process to lactate(GO:0061727) |
| 0.1 |
0.4 |
GO:1990523 |
bone regeneration(GO:1990523) |
| 0.1 |
0.4 |
GO:0038018 |
Wnt receptor catabolic process(GO:0038018) |
| 0.1 |
0.4 |
GO:0001915 |
negative regulation of T cell mediated cytotoxicity(GO:0001915) |
| 0.1 |
0.5 |
GO:0016480 |
negative regulation of transcription from RNA polymerase III promoter(GO:0016480) |
| 0.1 |
0.3 |
GO:0002528 |
regulation of vascular permeability involved in acute inflammatory response(GO:0002528) |
| 0.1 |
0.3 |
GO:0033499 |
galactose catabolic process via UDP-galactose(GO:0033499) |
| 0.1 |
0.4 |
GO:0007499 |
ectoderm and mesoderm interaction(GO:0007499) |
| 0.1 |
0.7 |
GO:0070244 |
negative regulation of thymocyte apoptotic process(GO:0070244) |
| 0.1 |
0.3 |
GO:0055099 |
detection of hormone stimulus(GO:0009720) response to high density lipoprotein particle(GO:0055099) |
| 0.1 |
0.2 |
GO:0032641 |
lymphotoxin A production(GO:0032641) lymphotoxin A biosynthetic process(GO:0042109) |
| 0.1 |
0.3 |
GO:1901899 |
positive regulation of relaxation of cardiac muscle(GO:1901899) |
| 0.1 |
0.2 |
GO:0014016 |
neuroblast differentiation(GO:0014016) |
| 0.1 |
1.7 |
GO:0046415 |
urate metabolic process(GO:0046415) |
| 0.1 |
0.3 |
GO:0006478 |
peptidyl-tyrosine sulfation(GO:0006478) |
| 0.1 |
1.1 |
GO:0019344 |
cysteine biosynthetic process(GO:0019344) |
| 0.1 |
1.2 |
GO:0048672 |
positive regulation of collateral sprouting(GO:0048672) |
| 0.1 |
0.5 |
GO:0071460 |
cellular response to cell-matrix adhesion(GO:0071460) |
| 0.1 |
0.5 |
GO:0003431 |
growth plate cartilage chondrocyte development(GO:0003431) |
| 0.1 |
0.3 |
GO:0051795 |
catagen(GO:0042637) regulation of catagen(GO:0051794) positive regulation of catagen(GO:0051795) |
| 0.1 |
0.8 |
GO:0051122 |
hepoxilin metabolic process(GO:0051121) hepoxilin biosynthetic process(GO:0051122) |
| 0.1 |
0.3 |
GO:0098976 |
excitatory chemical synaptic transmission(GO:0098976) regulation of AMPA glutamate receptor clustering(GO:1904717) positive regulation of AMPA glutamate receptor clustering(GO:1904719) |
| 0.1 |
0.3 |
GO:0030573 |
bile acid catabolic process(GO:0030573) |
| 0.1 |
0.2 |
GO:0002408 |
myeloid dendritic cell chemotaxis(GO:0002408) |
| 0.1 |
0.1 |
GO:0016487 |
sesquiterpenoid metabolic process(GO:0006714) sesquiterpenoid catabolic process(GO:0016107) farnesol metabolic process(GO:0016487) farnesol catabolic process(GO:0016488) |
| 0.1 |
0.3 |
GO:0090156 |
cellular sphingolipid homeostasis(GO:0090156) |
| 0.1 |
0.4 |
GO:0001306 |
age-dependent response to oxidative stress(GO:0001306) age-dependent response to reactive oxygen species(GO:0001315) regulation of systemic arterial blood pressure by acetylcholine(GO:0003068) vasodilation by acetylcholine involved in regulation of systemic arterial blood pressure(GO:0003069) regulation of systemic arterial blood pressure by neurotransmitter(GO:0003070) age-dependent general metabolic decline(GO:0007571) |
| 0.1 |
0.4 |
GO:0036102 |
leukotriene catabolic process(GO:0036100) leukotriene B4 catabolic process(GO:0036101) leukotriene B4 metabolic process(GO:0036102) icosanoid catabolic process(GO:1901523) fatty acid derivative catabolic process(GO:1901569) |
| 0.1 |
0.2 |
GO:0042270 |
protection from natural killer cell mediated cytotoxicity(GO:0042270) |
| 0.1 |
0.5 |
GO:0010025 |
wax biosynthetic process(GO:0010025) wax metabolic process(GO:0010166) |
| 0.1 |
0.2 |
GO:2000777 |
positive regulation of proteasomal ubiquitin-dependent protein catabolic process involved in cellular response to hypoxia(GO:2000777) |
| 0.1 |
0.2 |
GO:0035634 |
response to stilbenoid(GO:0035634) |
| 0.1 |
0.2 |
GO:1904580 |
regulation of intracellular mRNA localization(GO:1904580) positive regulation of intracellular mRNA localization(GO:1904582) |
| 0.1 |
0.3 |
GO:0010157 |
response to chlorate(GO:0010157) |
| 0.1 |
0.2 |
GO:0021658 |
rhombomere morphogenesis(GO:0021593) rhombomere 3 morphogenesis(GO:0021658) |
| 0.1 |
0.5 |
GO:1901552 |
positive regulation of endothelial cell development(GO:1901552) positive regulation of establishment of endothelial barrier(GO:1903142) |
| 0.1 |
0.1 |
GO:1901074 |
regulation of engulfment of apoptotic cell(GO:1901074) |
| 0.1 |
0.6 |
GO:0015705 |
iodide transport(GO:0015705) |
| 0.1 |
0.2 |
GO:0003221 |
right ventricular cardiac muscle tissue morphogenesis(GO:0003221) |
| 0.1 |
0.2 |
GO:0007181 |
transforming growth factor beta receptor complex assembly(GO:0007181) |
| 0.1 |
0.4 |
GO:1903412 |
response to bile acid(GO:1903412) |
| 0.1 |
0.2 |
GO:0032747 |
positive regulation of interleukin-23 production(GO:0032747) |
| 0.1 |
0.4 |
GO:0090611 |
ubiquitin-independent protein catabolic process via the multivesicular body sorting pathway(GO:0090611) |
| 0.1 |
0.3 |
GO:1990834 |
response to odorant(GO:1990834) |
| 0.1 |
0.1 |
GO:0002741 |
positive regulation of cytokine secretion involved in immune response(GO:0002741) |
| 0.1 |
0.2 |
GO:0033634 |
positive regulation of cell-cell adhesion mediated by integrin(GO:0033634) |
| 0.1 |
0.4 |
GO:0030035 |
microspike assembly(GO:0030035) |
| 0.1 |
0.3 |
GO:0002266 |
follicular dendritic cell activation(GO:0002266) follicular dendritic cell differentiation(GO:0002268) |
| 0.1 |
0.1 |
GO:0060164 |
regulation of timing of neuron differentiation(GO:0060164) |
| 0.1 |
0.3 |
GO:0015770 |
disaccharide transport(GO:0015766) sucrose transport(GO:0015770) oligosaccharide transport(GO:0015772) |
| 0.1 |
0.3 |
GO:0007538 |
primary sex determination(GO:0007538) |
| 0.1 |
0.3 |
GO:0045401 |
positive regulation of interleukin-3 production(GO:0032752) interleukin-3 biosynthetic process(GO:0042223) regulation of interleukin-3 biosynthetic process(GO:0045399) positive regulation of interleukin-3 biosynthetic process(GO:0045401) |
| 0.1 |
0.3 |
GO:0002934 |
desmosome organization(GO:0002934) |
| 0.1 |
1.0 |
GO:0030948 |
negative regulation of vascular endothelial growth factor receptor signaling pathway(GO:0030948) |
| 0.1 |
0.2 |
GO:0060167 |
regulation of adenosine receptor signaling pathway(GO:0060167) |
| 0.1 |
0.4 |
GO:0030311 |
poly-N-acetyllactosamine biosynthetic process(GO:0030311) |
| 0.1 |
0.2 |
GO:0030997 |
regulation of centriole-centriole cohesion(GO:0030997) |
| 0.1 |
0.3 |
GO:0090096 |
regulation of metanephric cap mesenchymal cell proliferation(GO:0090095) positive regulation of metanephric cap mesenchymal cell proliferation(GO:0090096) |
| 0.1 |
0.2 |
GO:0019858 |
cytosine metabolic process(GO:0019858) |
| 0.1 |
0.1 |
GO:1903774 |
positive regulation of viral budding via host ESCRT complex(GO:1903774) |
| 0.1 |
0.5 |
GO:0034350 |
regulation of glial cell apoptotic process(GO:0034350) negative regulation of glial cell apoptotic process(GO:0034351) |
| 0.1 |
0.1 |
GO:0071910 |
determination of pancreatic left/right asymmetry(GO:0035469) determination of liver left/right asymmetry(GO:0071910) |
| 0.1 |
0.1 |
GO:0010820 |
regulation of T cell chemotaxis(GO:0010819) positive regulation of T cell chemotaxis(GO:0010820) |
| 0.1 |
0.2 |
GO:1904761 |
myofibroblast differentiation(GO:0036446) regulation of myofibroblast differentiation(GO:1904760) negative regulation of myofibroblast differentiation(GO:1904761) |
| 0.1 |
1.1 |
GO:0007021 |
tubulin complex assembly(GO:0007021) |
| 0.1 |
0.3 |
GO:0002879 |
positive regulation of acute inflammatory response to non-antigenic stimulus(GO:0002879) |
| 0.1 |
1.1 |
GO:0021796 |
cerebral cortex regionalization(GO:0021796) |
| 0.1 |
0.3 |
GO:0038016 |
insulin receptor internalization(GO:0038016) |
| 0.1 |
0.2 |
GO:0001546 |
preantral ovarian follicle growth(GO:0001546) multi-layer follicle stage(GO:0048162) |
| 0.1 |
0.3 |
GO:0014050 |
negative regulation of glutamate secretion(GO:0014050) |
| 0.1 |
0.1 |
GO:0097477 |
lateral motor column neuron migration(GO:0097477) |
| 0.1 |
0.1 |
GO:0021966 |
corticospinal neuron axon guidance(GO:0021966) |
| 0.1 |
0.5 |
GO:0002943 |
tRNA dihydrouridine synthesis(GO:0002943) |
| 0.1 |
8.6 |
GO:0070268 |
cornification(GO:0070268) |
| 0.1 |
0.3 |
GO:0051005 |
negative regulation of lipoprotein lipase activity(GO:0051005) |
| 0.1 |
0.3 |
GO:0009698 |
phenylpropanoid metabolic process(GO:0009698) |
| 0.1 |
0.1 |
GO:0050975 |
sensory perception of touch(GO:0050975) |
| 0.1 |
0.1 |
GO:0030185 |
nitric oxide transport(GO:0030185) |
| 0.1 |
0.2 |
GO:0002317 |
plasma cell differentiation(GO:0002317) |
| 0.1 |
0.2 |
GO:0090310 |
negative regulation of methylation-dependent chromatin silencing(GO:0090310) |
| 0.1 |
0.4 |
GO:2000857 |
positive regulation of mineralocorticoid secretion(GO:2000857) positive regulation of aldosterone secretion(GO:2000860) |
| 0.1 |
0.2 |
GO:0035915 |
pore formation in membrane of other organism(GO:0035915) |
| 0.1 |
0.5 |
GO:0061709 |
reticulophagy(GO:0061709) |
| 0.1 |
0.2 |
GO:1904732 |
regulation of electron carrier activity(GO:1904732) |
| 0.1 |
4.2 |
GO:0006953 |
acute-phase response(GO:0006953) |
| 0.1 |
0.3 |
GO:0030259 |
lipid glycosylation(GO:0030259) |
| 0.1 |
0.9 |
GO:0042574 |
retinal metabolic process(GO:0042574) |
| 0.1 |
0.2 |
GO:0060018 |
astrocyte fate commitment(GO:0060018) |
| 0.1 |
0.7 |
GO:2001288 |
positive regulation of caveolin-mediated endocytosis(GO:2001288) |
| 0.1 |
0.2 |
GO:0046108 |
uridine metabolic process(GO:0046108) |
| 0.1 |
0.4 |
GO:0033629 |
negative regulation of cell adhesion mediated by integrin(GO:0033629) |
| 0.1 |
0.9 |
GO:0006069 |
ethanol oxidation(GO:0006069) |
| 0.1 |
0.2 |
GO:0061536 |
glycine secretion(GO:0061536) glycine secretion, neurotransmission(GO:0061537) |
| 0.1 |
0.7 |
GO:0015803 |
branched-chain amino acid transport(GO:0015803) leucine transport(GO:0015820) |
| 0.1 |
0.6 |
GO:0016553 |
base conversion or substitution editing(GO:0016553) |
| 0.1 |
0.1 |
GO:0002644 |
negative regulation of tolerance induction(GO:0002644) |
| 0.1 |
0.6 |
GO:0021853 |
cerebral cortex GABAergic interneuron migration(GO:0021853) interneuron migration(GO:1904936) |
| 0.1 |
1.1 |
GO:0002070 |
epithelial cell maturation(GO:0002070) |
| 0.1 |
0.3 |
GO:0072603 |
interleukin-5 secretion(GO:0072603) regulation of interleukin-5 secretion(GO:2000662) |
| 0.1 |
0.2 |
GO:1904744 |
positive regulation of telomeric DNA binding(GO:1904744) |
| 0.1 |
0.2 |
GO:0003404 |
optic vesicle morphogenesis(GO:0003404) optic cup structural organization(GO:0003409) |
| 0.1 |
0.7 |
GO:0038129 |
ERBB3 signaling pathway(GO:0038129) |
| 0.1 |
0.2 |
GO:0043615 |
astrocyte cell migration(GO:0043615) |
| 0.1 |
0.7 |
GO:0090196 |
regulation of chemokine secretion(GO:0090196) positive regulation of chemokine secretion(GO:0090197) |
| 0.1 |
0.4 |
GO:0007406 |
negative regulation of neuroblast proliferation(GO:0007406) |
| 0.1 |
0.2 |
GO:0015680 |
intracellular copper ion transport(GO:0015680) |
| 0.1 |
0.6 |
GO:0006685 |
sphingomyelin catabolic process(GO:0006685) |
| 0.1 |
0.6 |
GO:0002475 |
antigen processing and presentation via MHC class Ib(GO:0002475) antigen processing and presentation of lipid antigen via MHC class Ib(GO:0048003) antigen processing and presentation, exogenous lipid antigen via MHC class Ib(GO:0048007) |
| 0.1 |
0.4 |
GO:2000490 |
negative regulation of hepatic stellate cell activation(GO:2000490) |
| 0.1 |
0.1 |
GO:2000724 |
positive regulation of cardiac vascular smooth muscle cell differentiation(GO:2000724) |
| 0.1 |
0.2 |
GO:0038172 |
interleukin-33-mediated signaling pathway(GO:0038172) |
| 0.1 |
0.4 |
GO:0032439 |
endosome localization(GO:0032439) |
| 0.1 |
0.8 |
GO:0038203 |
TORC2 signaling(GO:0038203) |
| 0.1 |
0.1 |
GO:0070242 |
thymocyte apoptotic process(GO:0070242) |
| 0.1 |
0.1 |
GO:0032425 |
positive regulation of mismatch repair(GO:0032425) |
| 0.1 |
0.2 |
GO:0072709 |
cellular response to sorbitol(GO:0072709) |
| 0.1 |
0.2 |
GO:0070429 |
B-1 B cell homeostasis(GO:0001922) regulation of toll-like receptor 5 signaling pathway(GO:0034147) negative regulation of toll-like receptor 5 signaling pathway(GO:0034148) negative regulation of nucleotide-binding oligomerization domain containing 1 signaling pathway(GO:0070429) |
| 0.1 |
0.3 |
GO:2000503 |
positive regulation of natural killer cell chemotaxis(GO:2000503) |
| 0.1 |
0.2 |
GO:0007518 |
myoblast fate determination(GO:0007518) |
| 0.1 |
0.2 |
GO:0043335 |
protein unfolding(GO:0043335) |
| 0.1 |
0.5 |
GO:0009449 |
gamma-aminobutyric acid biosynthetic process(GO:0009449) |
| 0.1 |
0.2 |
GO:0042137 |
sequestering of neurotransmitter(GO:0042137) |
| 0.1 |
0.4 |
GO:0015793 |
glycerol transport(GO:0015793) |
| 0.1 |
2.4 |
GO:0060216 |
definitive hemopoiesis(GO:0060216) |
| 0.1 |
0.4 |
GO:0015760 |
hexose phosphate transport(GO:0015712) glucose-6-phosphate transport(GO:0015760) |
| 0.1 |
0.1 |
GO:0042335 |
cuticle development(GO:0042335) |
| 0.1 |
0.1 |
GO:0042214 |
terpene metabolic process(GO:0042214) |
| 0.0 |
0.2 |
GO:0010982 |
regulation of high-density lipoprotein particle clearance(GO:0010982) |
| 0.0 |
0.1 |
GO:0060584 |
regulation of prostaglandin-endoperoxide synthase activity(GO:0060584) positive regulation of prostaglandin-endoperoxide synthase activity(GO:0060585) |
| 0.0 |
0.1 |
GO:0032364 |
oxygen homeostasis(GO:0032364) |
| 0.0 |
0.5 |
GO:0010908 |
regulation of heparan sulfate proteoglycan biosynthetic process(GO:0010908) positive regulation of heparan sulfate proteoglycan biosynthetic process(GO:0010909) positive regulation of proteoglycan biosynthetic process(GO:1902730) |
| 0.0 |
0.2 |
GO:1905224 |
clathrin-coated pit assembly(GO:1905224) |
| 0.0 |
0.2 |
GO:0030886 |
negative regulation of myeloid dendritic cell activation(GO:0030886) |
| 0.0 |
0.1 |
GO:0002357 |
defense response to tumor cell(GO:0002357) |
| 0.0 |
0.1 |
GO:0003064 |
regulation of heart rate by hormone(GO:0003064) negative regulation of potassium ion export(GO:1902303) |
| 0.0 |
1.0 |
GO:0051639 |
actin filament network formation(GO:0051639) |
| 0.0 |
0.1 |
GO:0044533 |
induction of programmed cell death(GO:0012502) positive regulation of apoptotic process in other organism(GO:0044533) positive regulation by symbiont of host programmed cell death(GO:0052042) positive regulation by symbiont of host apoptotic process(GO:0052151) positive regulation by organism of programmed cell death in other organism involved in symbiotic interaction(GO:0052330) positive regulation by organism of apoptotic process in other organism involved in symbiotic interaction(GO:0052501) positive regulation of apoptotic process by virus(GO:0060139) |
| 0.0 |
0.3 |
GO:1903659 |
regulation of complement-dependent cytotoxicity(GO:1903659) |
| 0.0 |
0.4 |
GO:0002084 |
protein depalmitoylation(GO:0002084) |
| 0.0 |
0.7 |
GO:0001573 |
ganglioside metabolic process(GO:0001573) |
| 0.0 |
0.1 |
GO:0071395 |
response to jasmonic acid(GO:0009753) cellular response to jasmonic acid stimulus(GO:0071395) |
| 0.0 |
0.1 |
GO:0044240 |
multicellular organism lipid catabolic process(GO:0044240) |
| 0.0 |
0.8 |
GO:0097264 |
self proteolysis(GO:0097264) |
| 0.0 |
0.1 |
GO:0051884 |
anagen(GO:0042640) regulation of anagen(GO:0051884) positive regulation of anagen(GO:0051885) |
| 0.0 |
0.8 |
GO:0045741 |
positive regulation of epidermal growth factor-activated receptor activity(GO:0045741) |
| 0.0 |
0.1 |
GO:0050902 |
leukocyte adhesive activation(GO:0050902) |
| 0.0 |
0.3 |
GO:0035803 |
egg coat formation(GO:0035803) |
| 0.0 |
0.2 |
GO:0021898 |
commitment of multipotent stem cells to neuronal lineage in forebrain(GO:0021898) |
| 0.0 |
0.4 |
GO:0086068 |
Purkinje myocyte to ventricular cardiac muscle cell signaling(GO:0086029) Purkinje myocyte to ventricular cardiac muscle cell communication(GO:0086068) |
| 0.0 |
0.4 |
GO:2000510 |
regulation of dendritic cell chemotaxis(GO:2000508) positive regulation of dendritic cell chemotaxis(GO:2000510) |
| 0.0 |
0.2 |
GO:0016256 |
N-glycan processing to lysosome(GO:0016256) |
| 0.0 |
1.6 |
GO:0090200 |
positive regulation of release of cytochrome c from mitochondria(GO:0090200) |
| 0.0 |
1.8 |
GO:0097503 |
sialylation(GO:0097503) |
| 0.0 |
0.3 |
GO:2000491 |
positive regulation of hepatic stellate cell activation(GO:2000491) |
| 0.0 |
0.2 |
GO:0019064 |
fusion of virus membrane with host plasma membrane(GO:0019064) membrane fusion involved in viral entry into host cell(GO:0039663) multi-organism membrane fusion(GO:0044800) |
| 0.0 |
0.4 |
GO:0098887 |
neurotransmitter receptor transport, endosome to postsynaptic membrane(GO:0098887) |
| 0.0 |
0.1 |
GO:0098734 |
macromolecule depalmitoylation(GO:0098734) |
| 0.0 |
0.1 |
GO:0006421 |
asparaginyl-tRNA aminoacylation(GO:0006421) |
| 0.0 |
1.5 |
GO:0016338 |
calcium-independent cell-cell adhesion via plasma membrane cell-adhesion molecules(GO:0016338) |
| 0.0 |
0.1 |
GO:2000439 |
positive regulation of monocyte extravasation(GO:2000439) |
| 0.0 |
0.5 |
GO:1902902 |
negative regulation of autophagosome assembly(GO:1902902) |
| 0.0 |
0.2 |
GO:1901093 |
regulation of protein tetramerization(GO:1901090) negative regulation of protein tetramerization(GO:1901091) regulation of protein homotetramerization(GO:1901093) negative regulation of protein homotetramerization(GO:1901094) |
| 0.0 |
0.2 |
GO:0034553 |
respiratory chain complex II assembly(GO:0034552) mitochondrial respiratory chain complex II assembly(GO:0034553) mitochondrial respiratory chain complex II biogenesis(GO:0097032) |
| 0.0 |
0.1 |
GO:0015847 |
putrescine transport(GO:0015847) |
| 0.0 |
0.3 |
GO:0060011 |
Sertoli cell proliferation(GO:0060011) |
| 0.0 |
0.2 |
GO:0002881 |
negative regulation of chronic inflammatory response to non-antigenic stimulus(GO:0002881) |
| 0.0 |
0.1 |
GO:0006742 |
NADP catabolic process(GO:0006742) pyridine nucleotide catabolic process(GO:0019364) |
| 0.0 |
0.2 |
GO:0060298 |
positive regulation of sarcomere organization(GO:0060298) |
| 0.0 |
0.2 |
GO:0035995 |
detection of muscle stretch(GO:0035995) |
| 0.0 |
0.5 |
GO:0070327 |
thyroid hormone transport(GO:0070327) |
| 0.0 |
0.1 |
GO:0060313 |
negative regulation of blood vessel remodeling(GO:0060313) |
| 0.0 |
0.0 |
GO:1904674 |
positive regulation of somatic stem cell population maintenance(GO:1904674) |
| 0.0 |
0.2 |
GO:0051622 |
negative regulation of dopamine uptake involved in synaptic transmission(GO:0051585) norepinephrine uptake(GO:0051620) regulation of norepinephrine uptake(GO:0051621) negative regulation of norepinephrine uptake(GO:0051622) negative regulation of catecholamine uptake involved in synaptic transmission(GO:0051945) regulation of glutathione peroxidase activity(GO:1903282) positive regulation of glutathione peroxidase activity(GO:1903284) positive regulation of hydrogen peroxide catabolic process(GO:1903285) regulation of peroxidase activity(GO:2000468) positive regulation of peroxidase activity(GO:2000470) |
| 0.0 |
0.2 |
GO:2000271 |
positive regulation of fibroblast apoptotic process(GO:2000271) |
| 0.0 |
0.4 |
GO:0035376 |
sterol import(GO:0035376) cholesterol import(GO:0070508) |
| 0.0 |
0.2 |
GO:0019470 |
4-hydroxyproline catabolic process(GO:0019470) |
| 0.0 |
0.2 |
GO:0043313 |
regulation of neutrophil degranulation(GO:0043313) |
| 0.0 |
0.1 |
GO:0072344 |
rescue of stalled ribosome(GO:0072344) |
| 0.0 |
0.1 |
GO:0060373 |
regulation of ventricular cardiac muscle cell membrane depolarization(GO:0060373) |
| 0.0 |
0.2 |
GO:0000711 |
meiotic DNA repair synthesis(GO:0000711) |
| 0.0 |
0.6 |
GO:0045109 |
intermediate filament organization(GO:0045109) |
| 0.0 |
0.1 |
GO:2000077 |
negative regulation of type B pancreatic cell development(GO:2000077) |
| 0.0 |
0.2 |
GO:0003219 |
cardiac right ventricle formation(GO:0003219) |
| 0.0 |
0.5 |
GO:0060670 |
branching involved in labyrinthine layer morphogenesis(GO:0060670) |
| 0.0 |
0.1 |
GO:0071421 |
manganese ion transmembrane transport(GO:0071421) |
| 0.0 |
0.1 |
GO:0061428 |
negative regulation of transcription from RNA polymerase II promoter in response to hypoxia(GO:0061428) |
| 0.0 |
0.1 |
GO:0051673 |
membrane disruption in other organism(GO:0051673) |
| 0.0 |
0.2 |
GO:1904526 |
regulation of microtubule binding(GO:1904526) |
| 0.0 |
0.1 |
GO:0002826 |
negative regulation of T-helper 1 type immune response(GO:0002826) |
| 0.0 |
0.1 |
GO:0015993 |
molecular hydrogen transport(GO:0015993) |
| 0.0 |
0.5 |
GO:0050711 |
negative regulation of interleukin-1 secretion(GO:0050711) |
| 0.0 |
0.1 |
GO:0014724 |
regulation of twitch skeletal muscle contraction(GO:0014724) |
| 0.0 |
0.1 |
GO:0009822 |
alkaloid catabolic process(GO:0009822) |
| 0.0 |
0.1 |
GO:0090038 |
negative regulation of protein kinase C signaling(GO:0090038) |
| 0.0 |
0.4 |
GO:0018401 |
peptidyl-proline hydroxylation to 4-hydroxy-L-proline(GO:0018401) |
| 0.0 |
0.5 |
GO:1902074 |
response to salt(GO:1902074) |
| 0.0 |
0.1 |
GO:0009183 |
purine deoxyribonucleoside diphosphate biosynthetic process(GO:0009183) |
| 0.0 |
0.5 |
GO:1903690 |
negative regulation of wound healing, spreading of epidermal cells(GO:1903690) |
| 0.0 |
0.3 |
GO:0061669 |
spontaneous neurotransmitter secretion(GO:0061669) spontaneous synaptic transmission(GO:0098814) |
| 0.0 |
0.3 |
GO:0001661 |
conditioned taste aversion(GO:0001661) |
| 0.0 |
0.2 |
GO:0015865 |
purine nucleotide transport(GO:0015865) |
| 0.0 |
0.4 |
GO:1900028 |
negative regulation of ruffle assembly(GO:1900028) |
| 0.0 |
1.8 |
GO:0051602 |
response to electrical stimulus(GO:0051602) |
| 0.0 |
0.1 |
GO:0010637 |
negative regulation of mitochondrial fusion(GO:0010637) |
| 0.0 |
0.5 |
GO:0030854 |
positive regulation of granulocyte differentiation(GO:0030854) |
| 0.0 |
0.1 |
GO:0006533 |
aspartate catabolic process(GO:0006533) |
| 0.0 |
0.2 |
GO:2000211 |
regulation of glutamate metabolic process(GO:2000211) |
| 0.0 |
0.3 |
GO:0032482 |
Rab protein signal transduction(GO:0032482) |
| 0.0 |
0.2 |
GO:0002281 |
macrophage activation involved in immune response(GO:0002281) |
| 0.0 |
0.1 |
GO:0021530 |
spinal cord oligodendrocyte cell differentiation(GO:0021529) spinal cord oligodendrocyte cell fate specification(GO:0021530) |
| 0.0 |
0.0 |
GO:0000960 |
mitochondrial RNA catabolic process(GO:0000957) regulation of mitochondrial RNA catabolic process(GO:0000960) |
| 0.0 |
0.1 |
GO:0043415 |
positive regulation of skeletal muscle tissue regeneration(GO:0043415) |
| 0.0 |
0.7 |
GO:0014733 |
regulation of skeletal muscle adaptation(GO:0014733) |
| 0.0 |
0.1 |
GO:0031117 |
positive regulation of microtubule depolymerization(GO:0031117) |
| 0.0 |
0.0 |
GO:1902309 |
negative regulation of peptidyl-serine dephosphorylation(GO:1902309) |
| 0.0 |
2.1 |
GO:0048791 |
calcium ion-regulated exocytosis of neurotransmitter(GO:0048791) |
| 0.0 |
0.4 |
GO:0006089 |
lactate metabolic process(GO:0006089) |
| 0.0 |
0.1 |
GO:0038156 |
interleukin-3-mediated signaling pathway(GO:0038156) |
| 0.0 |
0.1 |
GO:0061370 |
testosterone biosynthetic process(GO:0061370) |
| 0.0 |
0.7 |
GO:0002230 |
positive regulation of defense response to virus by host(GO:0002230) |
| 0.0 |
0.0 |
GO:0003342 |
proepicardium development(GO:0003342) septum transversum development(GO:0003343) |
| 0.0 |
0.3 |
GO:0015691 |
cadmium ion transport(GO:0015691) cadmium ion transmembrane transport(GO:0070574) |
| 0.0 |
0.2 |
GO:0060482 |
lobar bronchus epithelium development(GO:0060481) lobar bronchus development(GO:0060482) |
| 0.0 |
0.4 |
GO:0060700 |
regulation of ribonuclease activity(GO:0060700) |
| 0.0 |
0.3 |
GO:0007256 |
activation of JNKK activity(GO:0007256) |
| 0.0 |
1.7 |
GO:0031424 |
keratinization(GO:0031424) |
| 0.0 |
0.0 |
GO:0009826 |
unidimensional cell growth(GO:0009826) |
| 0.0 |
0.1 |
GO:0060697 |
positive regulation of phospholipid catabolic process(GO:0060697) |
| 0.0 |
0.2 |
GO:0046618 |
drug export(GO:0046618) |
| 0.0 |
0.3 |
GO:2000210 |
positive regulation of anoikis(GO:2000210) |
| 0.0 |
0.1 |
GO:1903751 |
regulation of intrinsic apoptotic signaling pathway in response to hydrogen peroxide(GO:1903750) negative regulation of intrinsic apoptotic signaling pathway in response to hydrogen peroxide(GO:1903751) |
| 0.0 |
0.1 |
GO:1903803 |
glutamine secretion(GO:0010585) L-glutamine import(GO:0036229) L-glutamine import into cell(GO:1903803) |
| 0.0 |
0.2 |
GO:0002074 |
extraocular skeletal muscle development(GO:0002074) |
| 0.0 |
0.2 |
GO:0006828 |
manganese ion transport(GO:0006828) |
| 0.0 |
0.2 |
GO:0015860 |
purine nucleoside transmembrane transport(GO:0015860) |
| 0.0 |
0.0 |
GO:0072720 |
response to dithiothreitol(GO:0072720) |
| 0.0 |
0.1 |
GO:0002818 |
intracellular defense response(GO:0002818) |
| 0.0 |
0.0 |
GO:0035696 |
monocyte extravasation(GO:0035696) |
| 0.0 |
0.2 |
GO:0032494 |
response to peptidoglycan(GO:0032494) |
| 0.0 |
0.1 |
GO:0033326 |
cerebrospinal fluid secretion(GO:0033326) |
| 0.0 |
0.1 |
GO:0072278 |
metanephric comma-shaped body morphogenesis(GO:0072278) |
| 0.0 |
0.1 |
GO:0001951 |
intestinal D-glucose absorption(GO:0001951) |
| 0.0 |
0.1 |
GO:0032485 |
Ral protein signal transduction(GO:0032484) regulation of Ral protein signal transduction(GO:0032485) |
| 0.0 |
0.1 |
GO:1903595 |
positive regulation of histamine secretion by mast cell(GO:1903595) |
| 0.0 |
0.2 |
GO:0010818 |
T cell chemotaxis(GO:0010818) |
| 0.0 |
0.2 |
GO:0015811 |
L-cystine transport(GO:0015811) |
| 0.0 |
0.3 |
GO:0097646 |
dimeric G-protein coupled receptor signaling pathway(GO:0038042) calcitonin family receptor signaling pathway(GO:0097646) amylin receptor signaling pathway(GO:0097647) |
| 0.0 |
0.1 |
GO:0009051 |
pentose-phosphate shunt, oxidative branch(GO:0009051) |
| 0.0 |
0.1 |
GO:0051941 |
regulation of amino acid uptake involved in synaptic transmission(GO:0051941) regulation of glutamate uptake involved in transmission of nerve impulse(GO:0051946) regulation of L-glutamate import(GO:1900920) |
| 0.0 |
0.2 |
GO:0044375 |
regulation of peroxisome size(GO:0044375) |
| 0.0 |
0.1 |
GO:1902462 |
transforming growth factor beta activation(GO:0036363) regulation of mesenchymal stem cell proliferation(GO:1902460) positive regulation of mesenchymal stem cell proliferation(GO:1902462) |
| 0.0 |
0.3 |
GO:0050957 |
equilibrioception(GO:0050957) |
| 0.0 |
0.5 |
GO:0003334 |
keratinocyte development(GO:0003334) |
| 0.0 |
0.2 |
GO:0097428 |
protein maturation by iron-sulfur cluster transfer(GO:0097428) |
| 0.0 |
0.1 |
GO:0046208 |
spermine catabolic process(GO:0046208) |
| 0.0 |
0.3 |
GO:2000291 |
regulation of myoblast proliferation(GO:2000291) |
| 0.0 |
0.2 |
GO:0007000 |
nucleolus organization(GO:0007000) |
| 0.0 |
0.4 |
GO:0006570 |
tyrosine metabolic process(GO:0006570) |
| 0.0 |
0.1 |
GO:0019747 |
regulation of isoprenoid metabolic process(GO:0019747) |
| 0.0 |
0.1 |
GO:0015862 |
uridine transport(GO:0015862) |
| 0.0 |
0.3 |
GO:0002862 |
negative regulation of inflammatory response to antigenic stimulus(GO:0002862) |
| 0.0 |
0.4 |
GO:0034196 |
acylglycerol transport(GO:0034196) triglyceride transport(GO:0034197) |
| 0.0 |
0.1 |
GO:0071344 |
diphosphate metabolic process(GO:0071344) |
| 0.0 |
0.3 |
GO:1900745 |
positive regulation of p38MAPK cascade(GO:1900745) |
| 0.0 |
0.1 |
GO:0000961 |
negative regulation of mitochondrial RNA catabolic process(GO:0000961) |
| 0.0 |
0.3 |
GO:0038065 |
collagen-activated signaling pathway(GO:0038065) |
| 0.0 |
0.1 |
GO:0046521 |
sphingoid catabolic process(GO:0046521) |
| 0.0 |
0.1 |
GO:0090271 |
positive regulation of fibroblast growth factor production(GO:0090271) |
| 0.0 |
0.1 |
GO:0072537 |
fibroblast activation(GO:0072537) |
| 0.0 |
0.2 |
GO:0006686 |
sphingomyelin biosynthetic process(GO:0006686) |
| 0.0 |
0.1 |
GO:0071955 |
recycling endosome to Golgi transport(GO:0071955) |
| 0.0 |
0.1 |
GO:0046368 |
GDP-L-fucose metabolic process(GO:0046368) |
| 0.0 |
0.2 |
GO:0098967 |
exocytic insertion of neurotransmitter receptor to plasma membrane(GO:0098881) exocytic insertion of neurotransmitter receptor to postsynaptic membrane(GO:0098967) |
| 0.0 |
0.1 |
GO:2000182 |
regulation of progesterone biosynthetic process(GO:2000182) |
| 0.0 |
0.1 |
GO:0034721 |
histone H3-K4 demethylation, trimethyl-H3-K4-specific(GO:0034721) |
| 0.0 |
0.1 |
GO:0002025 |
vasodilation by norepinephrine-epinephrine involved in regulation of systemic arterial blood pressure(GO:0002025) |
| 0.0 |
0.0 |
GO:0030309 |
poly-N-acetyllactosamine metabolic process(GO:0030309) |
| 0.0 |
0.2 |
GO:0090315 |
negative regulation of protein targeting to membrane(GO:0090315) |
| 0.0 |
0.1 |
GO:0060087 |
relaxation of vascular smooth muscle(GO:0060087) |
| 0.0 |
0.5 |
GO:0006704 |
glucocorticoid biosynthetic process(GO:0006704) |
| 0.0 |
0.1 |
GO:0002774 |
Fc receptor mediated inhibitory signaling pathway(GO:0002774) |
| 0.0 |
0.4 |
GO:0015866 |
ADP transport(GO:0015866) |
| 0.0 |
0.1 |
GO:0006627 |
protein processing involved in protein targeting to mitochondrion(GO:0006627) |
| 0.0 |
0.3 |
GO:0045176 |
apical protein localization(GO:0045176) |
| 0.0 |
0.1 |
GO:0038161 |
prolactin signaling pathway(GO:0038161) |
| 0.0 |
0.1 |
GO:1904154 |
positive regulation of retrograde protein transport, ER to cytosol(GO:1904154) |
| 0.0 |
0.1 |
GO:2000418 |
positive regulation of eosinophil migration(GO:2000418) |
| 0.0 |
0.0 |
GO:1902445 |
regulation of mitochondrial membrane permeability involved in programmed necrotic cell death(GO:1902445) |
| 0.0 |
0.3 |
GO:0010579 |
regulation of adenylate cyclase activity involved in G-protein coupled receptor signaling pathway(GO:0010578) positive regulation of adenylate cyclase activity involved in G-protein coupled receptor signaling pathway(GO:0010579) |
| 0.0 |
0.1 |
GO:2000400 |
positive regulation of T cell differentiation in thymus(GO:0033089) positive regulation of thymocyte aggregation(GO:2000400) |
| 0.0 |
0.1 |
GO:0046689 |
response to mercury ion(GO:0046689) |
| 0.0 |
0.2 |
GO:0031120 |
snRNA pseudouridine synthesis(GO:0031120) |
| 0.0 |
0.4 |
GO:0007258 |
JUN phosphorylation(GO:0007258) |
| 0.0 |
0.2 |
GO:0032218 |
riboflavin transport(GO:0032218) |
| 0.0 |
0.2 |
GO:0018343 |
protein farnesylation(GO:0018343) |
| 0.0 |
0.5 |
GO:0033617 |
mitochondrial respiratory chain complex IV assembly(GO:0033617) |
| 0.0 |
0.3 |
GO:0032525 |
somite rostral/caudal axis specification(GO:0032525) |
| 0.0 |
0.1 |
GO:0043324 |
eye pigment biosynthetic process(GO:0006726) eye pigment metabolic process(GO:0042441) pigment metabolic process involved in developmental pigmentation(GO:0043324) pigment metabolic process involved in pigmentation(GO:0043474) |
| 0.0 |
0.2 |
GO:0006543 |
glutamine catabolic process(GO:0006543) |
| 0.0 |
0.4 |
GO:0031284 |
positive regulation of guanylate cyclase activity(GO:0031284) |
| 0.0 |
0.0 |
GO:0032899 |
regulation of neurotrophin production(GO:0032899) |
| 0.0 |
0.1 |
GO:1903984 |
regulation of transcription from RNA polymerase II promoter in response to arsenic-containing substance(GO:0061394) regulation of TRAIL-activated apoptotic signaling pathway(GO:1903121) positive regulation of TRAIL-activated apoptotic signaling pathway(GO:1903984) |
| 0.0 |
0.0 |
GO:0002361 |
CD4-positive, CD25-positive, alpha-beta regulatory T cell differentiation(GO:0002361) |
| 0.0 |
0.1 |
GO:0045953 |
negative regulation of natural killer cell mediated cytotoxicity(GO:0045953) |
| 0.0 |
0.1 |
GO:0019276 |
UDP-N-acetylgalactosamine metabolic process(GO:0019276) |
| 0.0 |
0.0 |
GO:0031587 |
positive regulation of inositol 1,4,5-trisphosphate-sensitive calcium-release channel activity(GO:0031587) |
| 0.0 |
0.1 |
GO:0038169 |
somatostatin receptor signaling pathway(GO:0038169) somatostatin signaling pathway(GO:0038170) |
| 0.0 |
0.0 |
GO:1902499 |
positive regulation of protein autoubiquitination(GO:1902499) |
| 0.0 |
0.0 |
GO:0070245 |
positive regulation of thymocyte apoptotic process(GO:0070245) |
| 0.0 |
0.1 |
GO:0006121 |
mitochondrial electron transport, succinate to ubiquinone(GO:0006121) |
| 0.0 |
0.1 |
GO:0018106 |
peptidyl-histidine phosphorylation(GO:0018106) |
| 0.0 |
0.3 |
GO:2000786 |
positive regulation of autophagosome assembly(GO:2000786) |
| 0.0 |
0.1 |
GO:0000964 |
mitochondrial RNA 5'-end processing(GO:0000964) |
| 0.0 |
0.2 |
GO:0042448 |
progesterone metabolic process(GO:0042448) |
| 0.0 |
0.1 |
GO:0046078 |
dUMP metabolic process(GO:0046078) |
| 0.0 |
0.1 |
GO:0071918 |
urea transmembrane transport(GO:0071918) |
| 0.0 |
0.5 |
GO:0050930 |
induction of positive chemotaxis(GO:0050930) |
| 0.0 |
0.6 |
GO:0006123 |
mitochondrial electron transport, cytochrome c to oxygen(GO:0006123) |
| 0.0 |
0.1 |
GO:0060052 |
neurofilament cytoskeleton organization(GO:0060052) |
| 0.0 |
0.6 |
GO:0045746 |
negative regulation of Notch signaling pathway(GO:0045746) |
| 0.0 |
0.1 |
GO:0051708 |
intracellular transport of viral protein in host cell(GO:0019060) symbiont intracellular protein transport in host(GO:0030581) intracellular protein transport in other organism involved in symbiotic interaction(GO:0051708) |
| 0.0 |
0.1 |
GO:0051533 |
positive regulation of NFAT protein import into nucleus(GO:0051533) |
| 0.0 |
1.6 |
GO:0006968 |
cellular defense response(GO:0006968) |
| 0.0 |
0.4 |
GO:2000052 |
positive regulation of non-canonical Wnt signaling pathway(GO:2000052) |
| 0.0 |
0.1 |
GO:0002318 |
myeloid progenitor cell differentiation(GO:0002318) |
| 0.0 |
0.1 |
GO:0061760 |
antifungal innate immune response(GO:0061760) |
| 0.0 |
0.0 |
GO:0043382 |
positive regulation of memory T cell differentiation(GO:0043382) |
| 0.0 |
0.2 |
GO:0019375 |
galactosylceramide biosynthetic process(GO:0006682) galactolipid biosynthetic process(GO:0019375) |
| 0.0 |
0.3 |
GO:0015074 |
DNA integration(GO:0015074) |
| 0.0 |
0.1 |
GO:2000980 |
regulation of auditory receptor cell differentiation(GO:0045607) regulation of mechanoreceptor differentiation(GO:0045631) regulation of inner ear receptor cell differentiation(GO:2000980) |
| 0.0 |
0.0 |
GO:0003218 |
cardiac left ventricle formation(GO:0003218) |
| 0.0 |
0.2 |
GO:0030903 |
notochord development(GO:0030903) |
| 0.0 |
0.1 |
GO:0035694 |
mitochondrial protein catabolic process(GO:0035694) |
| 0.0 |
0.1 |
GO:0097114 |
NMDA glutamate receptor clustering(GO:0097114) |
| 0.0 |
0.1 |
GO:0038110 |
interleukin-2-mediated signaling pathway(GO:0038110) |
| 0.0 |
0.1 |
GO:0046952 |
ketone body catabolic process(GO:0046952) |
| 0.0 |
0.1 |
GO:0060332 |
positive regulation of response to interferon-gamma(GO:0060332) positive regulation of interferon-gamma-mediated signaling pathway(GO:0060335) |
| 0.0 |
0.1 |
GO:1903006 |
regulation of protein K63-linked deubiquitination(GO:1903004) positive regulation of protein K63-linked deubiquitination(GO:1903006) |
| 0.0 |
0.1 |
GO:0032713 |
negative regulation of interleukin-4 production(GO:0032713) |
| 0.0 |
0.2 |
GO:0006552 |
leucine catabolic process(GO:0006552) |
| 0.0 |
0.2 |
GO:0042985 |
negative regulation of amyloid precursor protein biosynthetic process(GO:0042985) |
| 0.0 |
0.2 |
GO:0044341 |
sodium-dependent phosphate transport(GO:0044341) |
| 0.0 |
0.0 |
GO:0035552 |
oxidative single-stranded DNA demethylation(GO:0035552) |
| 0.0 |
0.1 |
GO:0006864 |
pyrimidine nucleotide transport(GO:0006864) mitochondrial pyrimidine nucleotide import(GO:1990519) |
| 0.0 |
0.2 |
GO:1902455 |
negative regulation of stem cell population maintenance(GO:1902455) |
| 0.0 |
0.3 |
GO:0045078 |
positive regulation of interferon-gamma biosynthetic process(GO:0045078) |
| 0.0 |
0.1 |
GO:0071461 |
cellular response to redox state(GO:0071461) |
| 0.0 |
0.1 |
GO:1904158 |
axonemal central apparatus assembly(GO:1904158) |
| 0.0 |
0.2 |
GO:0032495 |
response to muramyl dipeptide(GO:0032495) |
| 0.0 |
0.0 |
GO:0044828 |
negative regulation by host of viral genome replication(GO:0044828) |
| 0.0 |
0.1 |
GO:0072272 |
proximal/distal pattern formation involved in metanephric nephron development(GO:0072272) |
| 0.0 |
0.2 |
GO:0060033 |
anatomical structure regression(GO:0060033) |
| 0.0 |
0.3 |
GO:0060287 |
epithelial cilium movement involved in determination of left/right asymmetry(GO:0060287) |
| 0.0 |
0.0 |
GO:1902714 |
negative regulation of interferon-gamma secretion(GO:1902714) |
| 0.0 |
0.1 |
GO:0002337 |
B-1a B cell differentiation(GO:0002337) |
| 0.0 |
0.1 |
GO:0060988 |
lipid tube assembly(GO:0060988) |
| 0.0 |
0.4 |
GO:0036148 |
phosphatidylglycerol acyl-chain remodeling(GO:0036148) |
| 0.0 |
0.1 |
GO:0045218 |
zonula adherens maintenance(GO:0045218) |
| 0.0 |
0.2 |
GO:0010792 |
DNA double-strand break processing involved in repair via single-strand annealing(GO:0010792) |
| 0.0 |
0.6 |
GO:0070286 |
axonemal dynein complex assembly(GO:0070286) |
| 0.0 |
0.0 |
GO:0032972 |
regulation of muscle filament sliding speed(GO:0032972) |
| 0.0 |
0.1 |
GO:1905244 |
fasciculation of motor neuron axon(GO:0097156) regulation of modification of synaptic structure(GO:1905244) |
| 0.0 |
0.1 |
GO:0003406 |
retinal pigment epithelium development(GO:0003406) |
| 0.0 |
0.4 |
GO:0046548 |
retinal rod cell development(GO:0046548) |
| 0.0 |
0.3 |
GO:1902373 |
negative regulation of mRNA catabolic process(GO:1902373) |
| 0.0 |
0.3 |
GO:0060397 |
JAK-STAT cascade involved in growth hormone signaling pathway(GO:0060397) |
| 0.0 |
0.1 |
GO:0035582 |
sequestering of BMP in extracellular matrix(GO:0035582) |
| 0.0 |
0.1 |
GO:0036378 |
calcitriol biosynthetic process from calciol(GO:0036378) |
| 0.0 |
0.0 |
GO:0038043 |
interleukin-5-mediated signaling pathway(GO:0038043) |
| 0.0 |
0.4 |
GO:0030322 |
stabilization of membrane potential(GO:0030322) |
| 0.0 |
0.1 |
GO:0003032 |
detection of oxygen(GO:0003032) |
| 0.0 |
0.1 |
GO:0045903 |
positive regulation of translational fidelity(GO:0045903) |
| 0.0 |
0.2 |
GO:0050862 |
positive regulation of T cell receptor signaling pathway(GO:0050862) |
| 0.0 |
0.1 |
GO:0001550 |
ovarian cumulus expansion(GO:0001550) fused antrum stage(GO:0048165) |
| 0.0 |
0.2 |
GO:0014870 |
response to muscle inactivity(GO:0014870) |
| 0.0 |
0.0 |
GO:0045964 |
positive regulation of catecholamine metabolic process(GO:0045915) positive regulation of dopamine metabolic process(GO:0045964) |
| 0.0 |
0.3 |
GO:0034975 |
protein folding in endoplasmic reticulum(GO:0034975) |
| 0.0 |
0.4 |
GO:0034587 |
piRNA metabolic process(GO:0034587) |
| 0.0 |
0.2 |
GO:0044829 |
modulation by host of viral genome replication(GO:0044827) positive regulation by host of viral genome replication(GO:0044829) |
| 0.0 |
0.1 |
GO:0051562 |
negative regulation of mitochondrial calcium ion concentration(GO:0051562) |
| 0.0 |
0.2 |
GO:0046604 |
positive regulation of mitotic centrosome separation(GO:0046604) |
| 0.0 |
0.8 |
GO:0006506 |
GPI anchor metabolic process(GO:0006505) GPI anchor biosynthetic process(GO:0006506) |
| 0.0 |
0.0 |
GO:1904938 |
dopaminergic neuron axon guidance(GO:0036514) chemorepulsion of dopaminergic neuron axon(GO:0036518) planar cell polarity pathway involved in axon guidance(GO:1904938) |
| 0.0 |
1.4 |
GO:0035722 |
interleukin-12-mediated signaling pathway(GO:0035722) cellular response to interleukin-12(GO:0071349) |
| 0.0 |
0.1 |
GO:0035482 |
gastric motility(GO:0035482) gastric emptying(GO:0035483) |
| 0.0 |
0.3 |
GO:0003376 |
sphingosine-1-phosphate signaling pathway(GO:0003376) |
| 0.0 |
0.1 |
GO:0070079 |
peptidyl-lysine hydroxylation to 5-hydroxy-L-lysine(GO:0018395) histone arginine demethylation(GO:0070077) histone H3-R2 demethylation(GO:0070078) histone H4-R3 demethylation(GO:0070079) |
| 0.0 |
0.1 |
GO:0021798 |
forebrain dorsal/ventral pattern formation(GO:0021798) |
| 0.0 |
0.1 |
GO:0007056 |
spindle assembly involved in female meiosis(GO:0007056) |
| 0.0 |
0.0 |
GO:0097051 |
establishment of protein localization to endoplasmic reticulum membrane(GO:0097051) |
| 0.0 |
0.1 |
GO:0061763 |
multivesicular body-lysosome fusion(GO:0061763) |
| 0.0 |
0.1 |
GO:0030916 |
otic vesicle formation(GO:0030916) |
| 0.0 |
0.1 |
GO:1901315 |
negative regulation of histone ubiquitination(GO:0033183) regulation of histone H2A K63-linked ubiquitination(GO:1901314) negative regulation of histone H2A K63-linked ubiquitination(GO:1901315) |
| 0.0 |
0.6 |
GO:0019835 |
cytolysis(GO:0019835) |
| 0.0 |
0.1 |
GO:1902310 |
regulation of peptidyl-serine dephosphorylation(GO:1902308) positive regulation of peptidyl-serine dephosphorylation(GO:1902310) |
| 0.0 |
0.0 |
GO:0002215 |
defense response to nematode(GO:0002215) |
| 0.0 |
0.1 |
GO:0035574 |
histone H4-K20 demethylation(GO:0035574) |
| 0.0 |
0.1 |
GO:0036462 |
TRAIL-activated apoptotic signaling pathway(GO:0036462) |
| 0.0 |
0.2 |
GO:0051601 |
exocyst localization(GO:0051601) |
| 0.0 |
0.0 |
GO:0060024 |
rhythmic synaptic transmission(GO:0060024) |
| 0.0 |
0.3 |
GO:0009812 |
flavonoid metabolic process(GO:0009812) |
| 0.0 |
0.1 |
GO:0002933 |
lipid hydroxylation(GO:0002933) |
| 0.0 |
1.1 |
GO:0033275 |
muscle filament sliding(GO:0030049) actin-myosin filament sliding(GO:0033275) |
| 0.0 |
0.3 |
GO:0031268 |
pseudopodium organization(GO:0031268) |
| 0.0 |
0.1 |
GO:0002023 |
reduction of food intake in response to dietary excess(GO:0002023) |
| 0.0 |
0.3 |
GO:1904355 |
positive regulation of telomere capping(GO:1904355) |
| 0.0 |
0.5 |
GO:0048268 |
clathrin coat assembly(GO:0048268) |
| 0.0 |
0.1 |
GO:0046416 |
D-amino acid metabolic process(GO:0046416) |
| 0.0 |
0.1 |
GO:1902416 |
positive regulation of mRNA binding(GO:1902416) |
| 0.0 |
0.4 |
GO:0034389 |
lipid particle organization(GO:0034389) |
| 0.0 |
0.2 |
GO:2000353 |
positive regulation of endothelial cell apoptotic process(GO:2000353) |
| 0.0 |
0.1 |
GO:2000298 |
regulation of Rho-dependent protein serine/threonine kinase activity(GO:2000298) |
| 0.0 |
0.0 |
GO:0043418 |
homocysteine catabolic process(GO:0043418) |
| 0.0 |
0.2 |
GO:0010764 |
negative regulation of fibroblast migration(GO:0010764) |
| 0.0 |
0.3 |
GO:0042420 |
dopamine catabolic process(GO:0042420) |
| 0.0 |
0.1 |
GO:1900121 |
negative regulation of receptor binding(GO:1900121) |
| 0.0 |
0.1 |
GO:2001206 |
positive regulation of osteoclast development(GO:2001206) |
| 0.0 |
0.1 |
GO:0043117 |
positive regulation of vascular permeability(GO:0043117) |
| 0.0 |
0.1 |
GO:0060681 |
branch elongation involved in ureteric bud branching(GO:0060681) |
| 0.0 |
0.1 |
GO:0086069 |
bundle of His cell to Purkinje myocyte communication(GO:0086069) |
| 0.0 |
0.0 |
GO:0060734 |
regulation of endoplasmic reticulum stress-induced eIF2 alpha phosphorylation(GO:0060734) |
| 0.0 |
1.6 |
GO:1900181 |
negative regulation of protein localization to nucleus(GO:1900181) |
| 0.0 |
0.1 |
GO:0045591 |
positive regulation of regulatory T cell differentiation(GO:0045591) |
| 0.0 |
0.6 |
GO:2000249 |
regulation of actin cytoskeleton reorganization(GO:2000249) |
| 0.0 |
0.0 |
GO:0046707 |
IDP metabolic process(GO:0046707) IDP catabolic process(GO:0046709) |
| 0.0 |
0.2 |
GO:0006703 |
estrogen biosynthetic process(GO:0006703) |
| 0.0 |
0.1 |
GO:0060591 |
chondroblast differentiation(GO:0060591) |
| 0.0 |
0.4 |
GO:0006465 |
signal peptide processing(GO:0006465) |
| 0.0 |
0.1 |
GO:0002329 |
pre-B cell differentiation(GO:0002329) |
| 0.0 |
0.2 |
GO:0061469 |
regulation of type B pancreatic cell proliferation(GO:0061469) |
| 0.0 |
0.1 |
GO:0043387 |
mycotoxin catabolic process(GO:0043387) aflatoxin catabolic process(GO:0046223) organic heteropentacyclic compound catabolic process(GO:1901377) regulation of glutathione biosynthetic process(GO:1903786) positive regulation of glutathione biosynthetic process(GO:1903788) |
| 0.0 |
0.1 |
GO:0009149 |
pyrimidine nucleoside triphosphate catabolic process(GO:0009149) pyrimidine deoxyribonucleoside triphosphate catabolic process(GO:0009213) |
| 0.0 |
0.3 |
GO:0043536 |
positive regulation of blood vessel endothelial cell migration(GO:0043536) |
| 0.0 |
0.2 |
GO:0016998 |
cell wall macromolecule catabolic process(GO:0016998) |
| 0.0 |
0.1 |
GO:0006014 |
D-ribose metabolic process(GO:0006014) |
| 0.0 |
0.3 |
GO:1904262 |
negative regulation of TORC1 signaling(GO:1904262) |
| 0.0 |
0.3 |
GO:1903830 |
magnesium ion transmembrane transport(GO:1903830) |
| 0.0 |
0.1 |
GO:0002291 |
T cell activation via T cell receptor contact with antigen bound to MHC molecule on antigen presenting cell(GO:0002291) |
| 0.0 |
0.1 |
GO:0021633 |
optic nerve structural organization(GO:0021633) |
| 0.0 |
0.0 |
GO:0090133 |
mesendoderm migration(GO:0090133) cell migration involved in mesendoderm migration(GO:0090134) |
| 0.0 |
0.0 |
GO:1904798 |
positive regulation of core promoter binding(GO:1904798) |
| 0.0 |
0.4 |
GO:0050873 |
brown fat cell differentiation(GO:0050873) |
| 0.0 |
0.1 |
GO:0019072 |
viral genome packaging(GO:0019072) viral RNA genome packaging(GO:0019074) |
| 0.0 |
0.1 |
GO:0060770 |
negative regulation of epithelial cell proliferation involved in prostate gland development(GO:0060770) |
| 0.0 |
0.2 |
GO:1903753 |
negative regulation of p38MAPK cascade(GO:1903753) |
| 0.0 |
0.2 |
GO:0043517 |
positive regulation of DNA damage response, signal transduction by p53 class mediator(GO:0043517) |
| 0.0 |
0.1 |
GO:1990918 |
double-strand break repair involved in meiotic recombination(GO:1990918) |
| 0.0 |
0.5 |
GO:0060338 |
regulation of type I interferon-mediated signaling pathway(GO:0060338) |
| 0.0 |
0.2 |
GO:0043970 |
histone H3-K9 acetylation(GO:0043970) |
| 0.0 |
0.0 |
GO:0044034 |
negative stranded viral RNA replication(GO:0039689) multi-organism biosynthetic process(GO:0044034) |
| 0.0 |
0.1 |
GO:0017121 |
phospholipid scrambling(GO:0017121) |
| 0.0 |
0.3 |
GO:0021692 |
cerebellar Purkinje cell layer morphogenesis(GO:0021692) |
| 0.0 |
0.1 |
GO:0044339 |
canonical Wnt signaling pathway involved in osteoblast differentiation(GO:0044339) |
| 0.0 |
0.1 |
GO:1903350 |
response to dopamine(GO:1903350) cellular response to dopamine(GO:1903351) |
| 0.0 |
0.1 |
GO:1904352 |
positive regulation of protein catabolic process in the vacuole(GO:1904352) |
| 0.0 |
0.3 |
GO:0007342 |
fusion of sperm to egg plasma membrane(GO:0007342) |
| 0.0 |
0.1 |
GO:1901533 |
negative regulation of hematopoietic progenitor cell differentiation(GO:1901533) |
| 0.0 |
0.2 |
GO:0006032 |
chitin metabolic process(GO:0006030) chitin catabolic process(GO:0006032) |
| 0.0 |
0.4 |
GO:0051898 |
negative regulation of protein kinase B signaling(GO:0051898) |
| 0.0 |
0.1 |
GO:0070966 |
nuclear-transcribed mRNA catabolic process, no-go decay(GO:0070966) |
| 0.0 |
0.1 |
GO:0051918 |
negative regulation of fibrinolysis(GO:0051918) |
| 0.0 |
0.0 |
GO:0006540 |
glutamate decarboxylation to succinate(GO:0006540) |
| 0.0 |
0.0 |
GO:1904245 |
regulation of polynucleotide adenylyltransferase activity(GO:1904245) |
| 0.0 |
0.1 |
GO:1904321 |
response to forskolin(GO:1904321) cellular response to forskolin(GO:1904322) |
| 0.0 |
0.0 |
GO:0090341 |
negative regulation of secretion of lysosomal enzymes(GO:0090341) |
| 0.0 |
0.0 |
GO:1900042 |
positive regulation of interleukin-2 secretion(GO:1900042) |
| 0.0 |
0.1 |
GO:0070269 |
pyroptosis(GO:0070269) |
| 0.0 |
0.4 |
GO:0010765 |
positive regulation of sodium ion transport(GO:0010765) |
| 0.0 |
0.1 |
GO:0033353 |
S-adenosylmethionine cycle(GO:0033353) |
| 0.0 |
0.1 |
GO:0042737 |
drug catabolic process(GO:0042737) |
| 0.0 |
0.1 |
GO:0018377 |
protein myristoylation(GO:0018377) |
| 0.0 |
0.1 |
GO:1904378 |
maintenance of unfolded protein(GO:0036506) maintenance of unfolded protein involved in ERAD pathway(GO:1904378) |
| 0.0 |
0.1 |
GO:0070131 |
positive regulation of mitochondrial translation(GO:0070131) |
| 0.0 |
0.1 |
GO:0034551 |
respiratory chain complex III assembly(GO:0017062) mitochondrial respiratory chain complex III assembly(GO:0034551) |
| 0.0 |
0.3 |
GO:0090218 |
positive regulation of lipid kinase activity(GO:0090218) |
| 0.0 |
0.0 |
GO:0035927 |
RNA import into mitochondrion(GO:0035927) |
| 0.0 |
0.2 |
GO:0031915 |
positive regulation of synaptic plasticity(GO:0031915) |
| 0.0 |
0.1 |
GO:0006287 |
base-excision repair, gap-filling(GO:0006287) |
| 0.0 |
0.0 |
GO:0071502 |
cellular response to temperature stimulus(GO:0071502) |
| 0.0 |
0.0 |
GO:0072717 |
response to actinomycin D(GO:0072716) cellular response to actinomycin D(GO:0072717) |
| 0.0 |
0.3 |
GO:0050892 |
intestinal absorption(GO:0050892) |
| 0.0 |
0.0 |
GO:0006565 |
L-serine catabolic process(GO:0006565) |
| 0.0 |
0.1 |
GO:0060763 |
mammary duct terminal end bud growth(GO:0060763) |
| 0.0 |
0.1 |
GO:0017196 |
N-terminal peptidyl-methionine acetylation(GO:0017196) |
| 0.0 |
0.0 |
GO:0045053 |
protein retention in Golgi apparatus(GO:0045053) |
| 0.0 |
0.0 |
GO:0090400 |
stress-induced premature senescence(GO:0090400) |
| 0.0 |
0.2 |
GO:0019371 |
cyclooxygenase pathway(GO:0019371) |
| 0.0 |
0.0 |
GO:0060800 |
regulation of cell differentiation involved in embryonic placenta development(GO:0060800) |
| 0.0 |
0.1 |
GO:0043031 |
negative regulation of macrophage activation(GO:0043031) |
| 0.0 |
0.1 |
GO:0008218 |
bioluminescence(GO:0008218) |
| 0.0 |
0.1 |
GO:0090037 |
positive regulation of protein kinase C signaling(GO:0090037) |
| 0.0 |
0.7 |
GO:0060337 |
type I interferon signaling pathway(GO:0060337) cellular response to type I interferon(GO:0071357) |
| 0.0 |
0.0 |
GO:1904569 |
regulation of selenocysteine incorporation(GO:1904569) |
| 0.0 |
0.1 |
GO:0019919 |
peptidyl-arginine methylation, to asymmetrical-dimethyl arginine(GO:0019919) |
| 0.0 |
0.1 |
GO:0044565 |
dendritic cell proliferation(GO:0044565) |
| 0.0 |
0.0 |
GO:0045041 |
protein import into mitochondrial intermembrane space(GO:0045041) |
| 0.0 |
0.1 |
GO:0072513 |
positive regulation of secondary heart field cardioblast proliferation(GO:0072513) |
| 0.0 |
0.0 |
GO:1990569 |
UDP-N-acetylglucosamine transport(GO:0015788) UDP-N-acetylglucosamine transmembrane transport(GO:1990569) |
| 0.0 |
0.0 |
GO:0035964 |
COPI-coated vesicle budding(GO:0035964) Golgi transport vesicle coating(GO:0048200) COPI coating of Golgi vesicle(GO:0048205) |
| 0.0 |
0.1 |
GO:0009111 |
vitamin catabolic process(GO:0009111) |
| 0.0 |
0.2 |
GO:0006450 |
regulation of translational fidelity(GO:0006450) |
| 0.0 |
0.1 |
GO:0007352 |
zygotic specification of dorsal/ventral axis(GO:0007352) |
| 0.0 |
0.0 |
GO:0046968 |
peptide antigen transport(GO:0046968) |
| 0.0 |
0.1 |
GO:0003360 |
brainstem development(GO:0003360) |
| 0.0 |
0.0 |
GO:0046909 |
intermembrane transport(GO:0046909) protein transport from ciliary membrane to plasma membrane(GO:1903445) |
| 0.0 |
0.1 |
GO:0033504 |
floor plate development(GO:0033504) |
| 0.0 |
0.1 |
GO:0035860 |
glial cell-derived neurotrophic factor receptor signaling pathway(GO:0035860) |
| 0.0 |
0.1 |
GO:0060742 |
epithelial cell differentiation involved in prostate gland development(GO:0060742) |
| 0.0 |
0.1 |
GO:0035162 |
embryonic hemopoiesis(GO:0035162) |
| 0.0 |
0.0 |
GO:0010607 |
negative regulation of cytoplasmic mRNA processing body assembly(GO:0010607) |
| 0.0 |
0.1 |
GO:0035522 |
monoubiquitinated histone deubiquitination(GO:0035521) monoubiquitinated histone H2A deubiquitination(GO:0035522) |
| 0.0 |
0.1 |
GO:0045950 |
negative regulation of mitotic recombination(GO:0045950) |
| 0.0 |
0.2 |
GO:0045063 |
T-helper 1 cell differentiation(GO:0045063) |
| 0.0 |
0.1 |
GO:0035617 |
stress granule disassembly(GO:0035617) |
| 0.0 |
0.2 |
GO:0006995 |
cellular response to nitrogen starvation(GO:0006995) cellular response to nitrogen levels(GO:0043562) |
| 0.0 |
0.0 |
GO:1902490 |
regulation of sperm capacitation(GO:1902490) |
| 0.0 |
0.1 |
GO:0060677 |
ureteric bud elongation(GO:0060677) ureteric bud invasion(GO:0072092) |
| 0.0 |
0.0 |
GO:1904259 |
regulation of basement membrane assembly involved in embryonic body morphogenesis(GO:1904259) positive regulation of basement membrane assembly involved in embryonic body morphogenesis(GO:1904261) basement membrane assembly involved in embryonic body morphogenesis(GO:2001197) |
| 0.0 |
0.1 |
GO:0072757 |
cellular response to camptothecin(GO:0072757) |
| 0.0 |
0.3 |
GO:0022400 |
regulation of rhodopsin mediated signaling pathway(GO:0022400) |
| 0.0 |
0.1 |
GO:1901223 |
negative regulation of NIK/NF-kappaB signaling(GO:1901223) |
| 0.0 |
0.1 |
GO:1990416 |
cellular response to brain-derived neurotrophic factor stimulus(GO:1990416) |
| 0.0 |
0.1 |
GO:0007506 |
gonadal mesoderm development(GO:0007506) |
| 0.0 |
0.0 |
GO:1901079 |
positive regulation of relaxation of muscle(GO:1901079) |
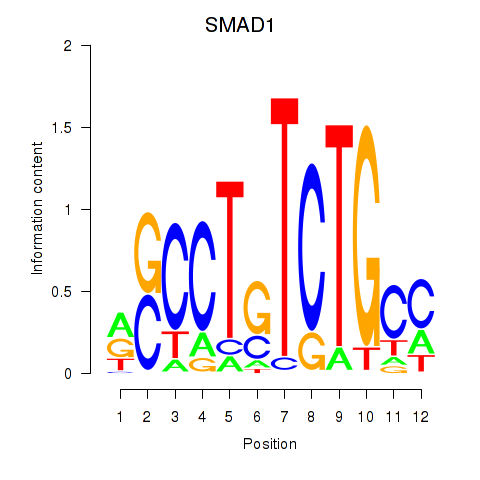
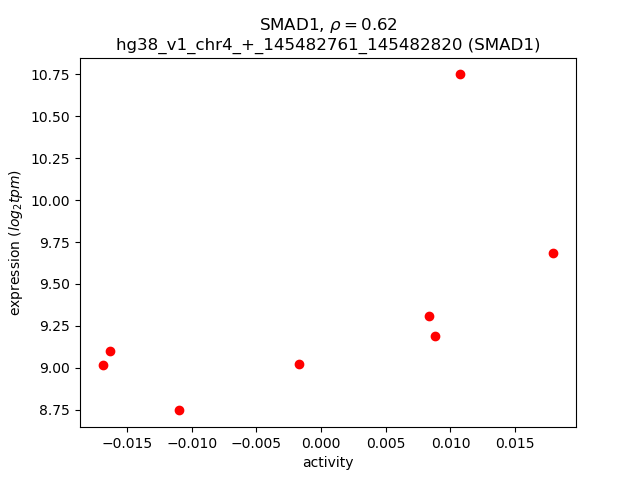

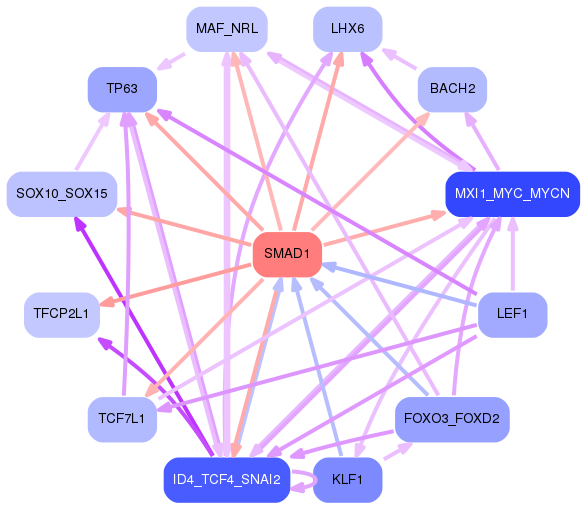