Project
Epithelial-Mesenchymal Transition, human (Scheel, 2011)
Navigation
Downloads
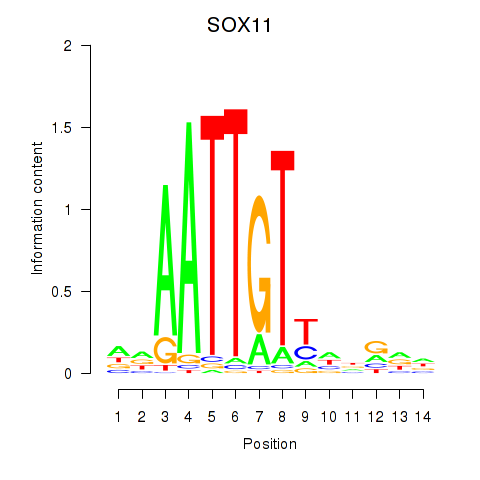
Results for SOX11
Z-value: 0.34
Motif logo
Transcription factors associated with SOX11
| Gene Symbol | Gene ID | Gene Info |
|---|---|---|
|
SOX11
|
ENSG00000176887.7 | SRY-box transcription factor 11 |
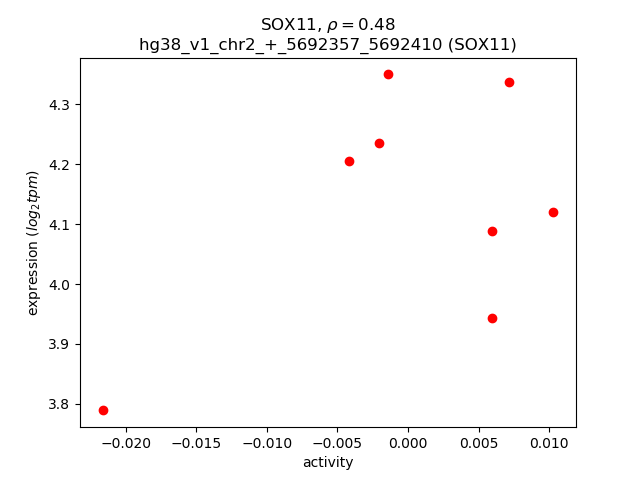
Activity-expression correlation:
| Gene | Promoter | Pearson corr. coef. | P-value | Plot |
|---|---|---|---|---|
| SOX11 | hg38_v1_chr2_+_5692357_5692410 | 0.48 | 2.3e-01 | Click! |
Activity profile of SOX11 motif
Sorted Z-values of SOX11 motif
| Promoter | Log-likelihood | Transcript | Gene | Gene Info |
|---|---|---|---|---|
| chr5_+_72107453 | 0.32 |
ENST00000296755.12
ENST00000511641.2 |
MAP1B
|
microtubule associated protein 1B |
| chr17_-_68955332 | 0.31 |
ENST00000269080.6
ENST00000615593.4 ENST00000586539.6 ENST00000430352.6 |
ABCA8
|
ATP binding cassette subfamily A member 8 |
| chr14_-_52069039 | 0.26 |
ENST00000216286.10
|
NID2
|
nidogen 2 |
| chr22_-_33572227 | 0.26 |
ENST00000674780.1
|
LARGE1
|
LARGE xylosyl- and glucuronyltransferase 1 |
| chr12_+_55681711 | 0.18 |
ENST00000394252.4
|
METTL7B
|
methyltransferase like 7B |
| chr12_+_55681647 | 0.18 |
ENST00000614691.1
|
METTL7B
|
methyltransferase like 7B |
| chr2_-_224402097 | 0.17 |
ENST00000409685.4
|
FAM124B
|
family with sequence similarity 124 member B |
| chr8_-_13276491 | 0.17 |
ENST00000512044.6
|
DLC1
|
DLC1 Rho GTPase activating protein |
| chr11_-_58844484 | 0.16 |
ENST00000532258.1
|
GLYATL2
|
glycine-N-acyltransferase like 2 |
| chr10_+_68109433 | 0.16 |
ENST00000613327.4
ENST00000358913.10 ENST00000373675.3 |
MYPN
|
myopalladin |
| chr2_-_224401994 | 0.16 |
ENST00000389874.3
|
FAM124B
|
family with sequence similarity 124 member B |
| chr22_-_28306645 | 0.15 |
ENST00000612946.4
|
TTC28
|
tetratricopeptide repeat domain 28 |
| chr5_+_148202771 | 0.15 |
ENST00000514389.5
ENST00000621437.4 |
SPINK6
|
serine peptidase inhibitor Kazal type 6 |
| chr11_-_58844695 | 0.15 |
ENST00000287275.6
|
GLYATL2
|
glycine-N-acyltransferase like 2 |
| chr2_-_189179754 | 0.14 |
ENST00000374866.9
ENST00000618828.1 |
COL5A2
|
collagen type V alpha 2 chain |
| chr10_+_68106109 | 0.14 |
ENST00000540630.5
ENST00000354393.6 |
MYPN
|
myopalladin |
| chr7_-_83162899 | 0.13 |
ENST00000423517.6
|
PCLO
|
piccolo presynaptic cytomatrix protein |
| chr3_-_132684685 | 0.12 |
ENST00000512094.5
ENST00000632629.1 |
NPHP3
NPHP3-ACAD11
|
nephrocystin 3 NPHP3-ACAD11 readthrough (NMD candidate) |
| chr7_-_93890160 | 0.11 |
ENST00000451238.1
|
TFPI2
|
tissue factor pathway inhibitor 2 |
| chr5_+_148203024 | 0.10 |
ENST00000325630.3
|
SPINK6
|
serine peptidase inhibitor Kazal type 6 |
| chr4_+_87832917 | 0.10 |
ENST00000395102.8
ENST00000497649.6 ENST00000540395.1 ENST00000560249.5 ENST00000511670.5 ENST00000361056.3 |
MEPE
|
matrix extracellular phosphoglycoprotein |
| chr9_-_92404559 | 0.10 |
ENST00000262551.8
ENST00000375561.10 |
OGN
|
osteoglycin |
| chr2_+_69013379 | 0.10 |
ENST00000409349.7
|
ANTXR1
|
ANTXR cell adhesion molecule 1 |
| chr4_+_158521937 | 0.09 |
ENST00000343542.9
ENST00000470033.2 |
RXFP1
|
relaxin family peptide receptor 1 |
| chr1_+_205042960 | 0.09 |
ENST00000638378.1
|
CNTN2
|
contactin 2 |
| chr12_-_11134644 | 0.09 |
ENST00000539585.1
|
TAS2R30
|
taste 2 receptor member 30 |
| chrX_-_133097095 | 0.09 |
ENST00000511190.5
|
USP26
|
ubiquitin specific peptidase 26 |
| chr3_-_18424533 | 0.09 |
ENST00000417717.6
|
SATB1
|
SATB homeobox 1 |
| chr6_-_136289824 | 0.09 |
ENST00000527536.5
ENST00000529826.5 ENST00000531224.6 ENST00000353331.8 ENST00000628517.2 |
BCLAF1
|
BCL2 associated transcription factor 1 |
| chr20_-_13990609 | 0.08 |
ENST00000284951.10
ENST00000378072.5 |
SEL1L2
|
SEL1L2 adaptor subunit of ERAD E3 ligase |
| chr5_+_40841308 | 0.08 |
ENST00000381677.4
ENST00000254691.10 |
CARD6
|
caspase recruitment domain family member 6 |
| chr1_+_196652022 | 0.08 |
ENST00000367429.9
ENST00000630130.2 ENST00000359637.2 |
CFH
|
complement factor H |
| chr8_+_41529212 | 0.08 |
ENST00000520710.5
ENST00000518671.5 |
GINS4
|
GINS complex subunit 4 |
| chr8_-_25424260 | 0.08 |
ENST00000421054.7
|
GNRH1
|
gonadotropin releasing hormone 1 |
| chr14_+_20688756 | 0.08 |
ENST00000397990.5
ENST00000555597.1 |
ANG
RNASE4
|
angiogenin ribonuclease A family member 4 |
| chr2_+_69013414 | 0.07 |
ENST00000681816.1
ENST00000482235.2 |
ANTXR1
|
ANTXR cell adhesion molecule 1 |
| chr1_+_93179883 | 0.07 |
ENST00000343253.11
|
CCDC18
|
coiled-coil domain containing 18 |
| chr1_+_121087343 | 0.07 |
ENST00000616817.4
ENST00000623603.3 ENST00000369384.9 ENST00000369383.8 ENST00000369178.5 |
FCGR1B
|
Fc fragment of IgG receptor Ib |
| chr7_-_93226449 | 0.07 |
ENST00000394468.7
ENST00000453812.2 |
HEPACAM2
|
HEPACAM family member 2 |
| chr12_+_18242955 | 0.07 |
ENST00000676171.1
|
PIK3C2G
|
phosphatidylinositol-4-phosphate 3-kinase catalytic subunit type 2 gamma |
| chrX_+_30243715 | 0.07 |
ENST00000378981.8
ENST00000397550.6 |
MAGEB1
|
MAGE family member B1 |
| chr22_-_30246739 | 0.07 |
ENST00000403987.3
ENST00000249075.4 |
LIF
|
LIF interleukin 6 family cytokine |
| chr20_+_33237712 | 0.07 |
ENST00000618484.1
|
BPIFA1
|
BPI fold containing family A member 1 |
| chr11_+_22666604 | 0.06 |
ENST00000454584.6
|
GAS2
|
growth arrest specific 2 |
| chr6_-_136289778 | 0.06 |
ENST00000530767.5
ENST00000527759.5 |
BCLAF1
|
BCL2 associated transcription factor 1 |
| chr6_-_99425269 | 0.06 |
ENST00000647811.1
ENST00000481229.2 ENST00000369239.10 ENST00000681611.1 ENST00000681615.1 ENST00000438806.5 |
PNISR
|
PNN interacting serine and arginine rich protein |
| chr2_+_102311502 | 0.06 |
ENST00000404917.6
ENST00000410040.5 |
IL1RL1
IL18R1
|
interleukin 1 receptor like 1 interleukin 18 receptor 1 |
| chr2_+_137964279 | 0.06 |
ENST00000329366.8
|
HNMT
|
histamine N-methyltransferase |
| chr2_-_181680490 | 0.06 |
ENST00000684145.1
ENST00000295108.4 ENST00000684079.1 ENST00000683430.1 |
CERKL
NEUROD1
|
ceramide kinase like neuronal differentiation 1 |
| chr18_+_7754959 | 0.06 |
ENST00000400053.8
|
PTPRM
|
protein tyrosine phosphatase receptor type M |
| chr9_+_12775012 | 0.06 |
ENST00000319264.4
|
LURAP1L
|
leucine rich adaptor protein 1 like |
| chr18_+_24460630 | 0.05 |
ENST00000256906.5
|
HRH4
|
histamine receptor H4 |
| chr2_+_108621260 | 0.05 |
ENST00000409441.5
|
LIMS1
|
LIM zinc finger domain containing 1 |
| chr5_+_170353480 | 0.05 |
ENST00000377360.8
|
KCNIP1
|
potassium voltage-gated channel interacting protein 1 |
| chr5_-_160852200 | 0.05 |
ENST00000327245.10
|
ATP10B
|
ATPase phospholipid transporting 10B (putative) |
| chr12_+_59664677 | 0.05 |
ENST00000548610.5
|
SLC16A7
|
solute carrier family 16 member 7 |
| chr16_+_67227105 | 0.05 |
ENST00000563953.5
ENST00000304800.14 ENST00000565201.1 |
TMEM208
|
transmembrane protein 208 |
| chrX_-_15601077 | 0.05 |
ENST00000680121.1
|
ACE2
|
angiotensin I converting enzyme 2 |
| chr4_+_71339037 | 0.05 |
ENST00000512686.5
|
SLC4A4
|
solute carrier family 4 member 4 |
| chr18_+_24460655 | 0.05 |
ENST00000426880.2
|
HRH4
|
histamine receptor H4 |
| chr1_-_110519175 | 0.05 |
ENST00000369771.4
|
KCNA10
|
potassium voltage-gated channel subfamily A member 10 |
| chr12_+_32502114 | 0.05 |
ENST00000682739.1
ENST00000427716.7 ENST00000583694.2 |
FGD4
|
FYVE, RhoGEF and PH domain containing 4 |
| chr2_-_177263522 | 0.05 |
ENST00000448782.5
ENST00000446151.6 |
NFE2L2
|
nuclear factor, erythroid 2 like 2 |
| chr6_+_52423680 | 0.05 |
ENST00000538167.2
|
EFHC1
|
EF-hand domain containing 1 |
| chr20_+_37179109 | 0.04 |
ENST00000373622.9
|
RPN2
|
ribophorin II |
| chr1_+_206865620 | 0.04 |
ENST00000367098.6
|
IL20
|
interleukin 20 |
| chrX_+_27807990 | 0.04 |
ENST00000356790.2
|
MAGEB10
|
MAGE family member B10 |
| chr8_-_56211257 | 0.04 |
ENST00000316981.8
ENST00000423799.6 ENST00000429357.2 |
PLAG1
|
PLAG1 zinc finger |
| chr3_-_108058361 | 0.04 |
ENST00000398258.7
|
CD47
|
CD47 molecule |
| chr13_-_110242694 | 0.04 |
ENST00000648989.1
ENST00000647797.1 ENST00000648966.1 ENST00000649484.1 ENST00000648695.1 ENST00000650115.1 ENST00000650566.1 |
COL4A1
|
collagen type IV alpha 1 chain |
| chr16_+_482507 | 0.04 |
ENST00000412256.1
|
RAB11FIP3
|
RAB11 family interacting protein 3 |
| chr5_-_55173173 | 0.04 |
ENST00000296733.5
ENST00000322374.10 ENST00000381375.7 |
CDC20B
|
cell division cycle 20B |
| chr17_+_37375974 | 0.04 |
ENST00000615133.2
ENST00000611038.4 |
C17orf78
|
chromosome 17 open reading frame 78 |
| chr8_-_71362054 | 0.04 |
ENST00000340726.8
|
EYA1
|
EYA transcriptional coactivator and phosphatase 1 |
| chr3_-_133661896 | 0.04 |
ENST00000260810.10
|
TOPBP1
|
DNA topoisomerase II binding protein 1 |
| chr15_+_83447411 | 0.03 |
ENST00000324537.5
|
SH3GL3
|
SH3 domain containing GRB2 like 3, endophilin A3 |
| chr11_+_121102666 | 0.03 |
ENST00000264037.2
|
TECTA
|
tectorin alpha |
| chr16_+_71808439 | 0.03 |
ENST00000683775.1
|
ATXN1L
|
ataxin 1 like |
| chr15_+_83447328 | 0.03 |
ENST00000427482.7
|
SH3GL3
|
SH3 domain containing GRB2 like 3, endophilin A3 |
| chr11_-_82900406 | 0.03 |
ENST00000313010.8
ENST00000393399.6 ENST00000680437.1 |
PRCP
|
prolylcarboxypeptidase |
| chr8_-_71361860 | 0.03 |
ENST00000303824.11
ENST00000645451.1 |
EYA1
|
EYA transcriptional coactivator and phosphatase 1 |
| chr7_-_7535863 | 0.03 |
ENST00000399429.8
|
COL28A1
|
collagen type XXVIII alpha 1 chain |
| chr4_-_158159657 | 0.03 |
ENST00000590648.5
|
GASK1B
|
golgi associated kinase 1B |
| chr5_+_76875177 | 0.03 |
ENST00000613039.1
|
S100Z
|
S100 calcium binding protein Z |
| chr4_+_70226116 | 0.03 |
ENST00000317987.6
|
FDCSP
|
follicular dendritic cell secreted protein |
| chr20_+_33662310 | 0.03 |
ENST00000375222.4
|
C20orf144
|
chromosome 20 open reading frame 144 |
| chr17_-_10114546 | 0.03 |
ENST00000323816.8
|
GAS7
|
growth arrest specific 7 |
| chr2_+_168802610 | 0.03 |
ENST00000397206.6
ENST00000317647.12 ENST00000397209.6 |
NOSTRIN
|
nitric oxide synthase trafficking |
| chr7_+_142111739 | 0.03 |
ENST00000550469.6
ENST00000477922.3 |
MGAM2
|
maltase-glucoamylase 2 (putative) |
| chr6_-_75363003 | 0.03 |
ENST00000370020.1
|
FILIP1
|
filamin A interacting protein 1 |
| chr6_-_30617232 | 0.03 |
ENST00000376511.7
|
PPP1R10
|
protein phosphatase 1 regulatory subunit 10 |
| chr2_+_168802563 | 0.03 |
ENST00000445023.6
|
NOSTRIN
|
nitric oxide synthase trafficking |
| chr13_-_102759059 | 0.03 |
ENST00000322527.4
|
CCDC168
|
coiled-coil domain containing 168 |
| chr1_+_65264694 | 0.03 |
ENST00000263441.11
ENST00000395325.7 |
DNAJC6
|
DnaJ heat shock protein family (Hsp40) member C6 |
| chr3_-_71493500 | 0.03 |
ENST00000648380.1
ENST00000650295.1 |
FOXP1
|
forkhead box P1 |
| chrM_+_7586 | 0.03 |
ENST00000361739.1
|
MT-CO2
|
mitochondrially encoded cytochrome c oxidase II |
| chr17_+_4788926 | 0.03 |
ENST00000331264.8
|
GLTPD2
|
glycolipid transfer protein domain containing 2 |
| chr8_-_85341659 | 0.02 |
ENST00000522389.5
|
CA1
|
carbonic anhydrase 1 |
| chr14_+_39233884 | 0.02 |
ENST00000553728.1
|
MIA2
|
MIA SH3 domain ER export factor 2 |
| chr17_-_74776323 | 0.02 |
ENST00000582870.5
ENST00000581136.5 ENST00000579218.5 ENST00000583476.5 ENST00000580301.5 ENST00000583757.5 ENST00000357814.8 ENST00000582524.5 |
NAT9
|
N-acetyltransferase 9 (putative) |
| chr5_+_149141817 | 0.02 |
ENST00000504238.5
|
ABLIM3
|
actin binding LIM protein family member 3 |
| chr1_+_149782671 | 0.02 |
ENST00000444948.5
ENST00000369168.5 |
FCGR1A
|
Fc fragment of IgG receptor Ia |
| chrX_-_13817027 | 0.02 |
ENST00000493677.5
ENST00000355135.6 ENST00000316715.9 |
GPM6B
|
glycoprotein M6B |
| chr5_-_143400716 | 0.02 |
ENST00000424646.6
ENST00000652686.1 |
NR3C1
|
nuclear receptor subfamily 3 group C member 1 |
| chr4_-_104494882 | 0.02 |
ENST00000394767.3
|
CXXC4
|
CXXC finger protein 4 |
| chr11_+_57657736 | 0.02 |
ENST00000529773.2
ENST00000533905.1 ENST00000525602.1 ENST00000533682.2 ENST00000302731.4 |
CLP1
|
cleavage factor polyribonucleotide kinase subunit 1 |
| chr4_+_158521872 | 0.02 |
ENST00000307765.10
|
RXFP1
|
relaxin family peptide receptor 1 |
| chr13_-_44474296 | 0.02 |
ENST00000611198.4
|
TSC22D1
|
TSC22 domain family member 1 |
| chr2_+_137964446 | 0.02 |
ENST00000280096.5
ENST00000280097.5 |
HNMT
|
histamine N-methyltransferase |
| chr4_-_70666492 | 0.02 |
ENST00000254801.9
ENST00000391614.7 |
JCHAIN
|
joining chain of multimeric IgA and IgM |
| chr14_+_102362931 | 0.02 |
ENST00000359520.12
|
TECPR2
|
tectonin beta-propeller repeat containing 2 |
| chrX_-_15600953 | 0.02 |
ENST00000679212.1
ENST00000679278.1 ENST00000678046.1 ENST00000252519.8 |
ACE2
|
angiotensin I converting enzyme 2 |
| chr6_-_31158073 | 0.02 |
ENST00000507751.5
ENST00000448162.6 ENST00000502557.5 ENST00000503420.5 ENST00000507892.1 ENST00000507226.1 ENST00000513222.1 ENST00000503934.5 ENST00000396263.6 ENST00000508683.5 ENST00000428174.1 ENST00000448141.6 ENST00000507829.5 ENST00000455279.6 ENST00000376266.9 |
CCHCR1
|
coiled-coil alpha-helical rod protein 1 |
| chr1_+_198638968 | 0.02 |
ENST00000348564.11
ENST00000530727.5 ENST00000442510.8 ENST00000645247.1 ENST00000367367.8 ENST00000367364.5 ENST00000413409.6 |
PTPRC
|
protein tyrosine phosphatase receptor type C |
| chr8_+_9555900 | 0.02 |
ENST00000310430.11
ENST00000520408.5 ENST00000522110.1 |
TNKS
|
tankyrase |
| chr1_-_145910031 | 0.02 |
ENST00000369304.8
|
ITGA10
|
integrin subunit alpha 10 |
| chr4_+_158521714 | 0.02 |
ENST00000613319.4
ENST00000423548.5 ENST00000448688.6 |
RXFP1
|
relaxin family peptide receptor 1 |
| chr9_-_4666347 | 0.02 |
ENST00000381890.9
ENST00000682582.1 |
SPATA6L
|
spermatogenesis associated 6 like |
| chr20_-_33720221 | 0.02 |
ENST00000409299.8
ENST00000217398.3 ENST00000344022.7 |
PXMP4
|
peroxisomal membrane protein 4 |
| chr7_+_144074182 | 0.02 |
ENST00000408898.2
|
OR2A25
|
olfactory receptor family 2 subfamily A member 25 |
| chr18_-_72865680 | 0.02 |
ENST00000397929.5
|
NETO1
|
neuropilin and tolloid like 1 |
| chr1_-_145910066 | 0.02 |
ENST00000539363.2
|
ITGA10
|
integrin subunit alpha 10 |
| chr15_+_57219411 | 0.02 |
ENST00000543579.5
ENST00000537840.5 ENST00000343827.7 |
TCF12
|
transcription factor 12 |
| chrX_+_102937272 | 0.02 |
ENST00000218249.7
|
RAB40AL
|
RAB40A like |
| chr13_-_29850605 | 0.02 |
ENST00000380680.5
|
UBL3
|
ubiquitin like 3 |
| chr4_-_109703408 | 0.02 |
ENST00000352981.7
ENST00000265164.7 ENST00000505486.1 |
CASP6
|
caspase 6 |
| chr15_-_64381431 | 0.02 |
ENST00000558008.3
ENST00000300035.9 ENST00000559519.5 ENST00000380258.6 |
PCLAF
|
PCNA clamp associated factor |
| chr2_-_2324323 | 0.02 |
ENST00000648339.1
ENST00000647694.1 |
MYT1L
|
myelin transcription factor 1 like |
| chr11_+_62208665 | 0.01 |
ENST00000244930.6
|
SCGB2A1
|
secretoglobin family 2A member 1 |
| chr3_+_178536407 | 0.01 |
ENST00000452583.6
|
KCNMB2
|
potassium calcium-activated channel subfamily M regulatory beta subunit 2 |
| chr11_+_7088991 | 0.01 |
ENST00000306904.7
|
RBMXL2
|
RBMX like 2 |
| chrX_-_101293057 | 0.01 |
ENST00000372907.7
|
TAF7L
|
TATA-box binding protein associated factor 7 like |
| chr4_+_71339014 | 0.01 |
ENST00000340595.4
|
SLC4A4
|
solute carrier family 4 member 4 |
| chr15_+_44736522 | 0.01 |
ENST00000329464.9
ENST00000558329.5 ENST00000560442.5 ENST00000561043.5 |
TRIM69
|
tripartite motif containing 69 |
| chrX_+_26138343 | 0.01 |
ENST00000325250.2
|
MAGEB18
|
MAGE family member B18 |
| chr1_-_153150884 | 0.01 |
ENST00000368748.5
|
SPRR2G
|
small proline rich protein 2G |
| chr15_+_44736556 | 0.01 |
ENST00000338264.8
|
TRIM69
|
tripartite motif containing 69 |
| chr2_+_102311546 | 0.01 |
ENST00000233954.6
ENST00000447231.5 |
IL1RL1
|
interleukin 1 receptor like 1 |
| chr11_-_64917200 | 0.01 |
ENST00000377264.8
ENST00000421419.3 |
ATG2A
|
autophagy related 2A |
| chr5_+_55853314 | 0.01 |
ENST00000354961.8
ENST00000297015.7 |
IL31RA
|
interleukin 31 receptor A |
| chr1_+_35268663 | 0.01 |
ENST00000314607.11
|
ZMYM4
|
zinc finger MYM-type containing 4 |
| chr18_+_59220149 | 0.01 |
ENST00000256857.7
ENST00000529320.2 ENST00000420468.6 |
GRP
|
gastrin releasing peptide |
| chr12_-_121802886 | 0.01 |
ENST00000545885.5
ENST00000542933.5 ENST00000428029.6 ENST00000541694.5 ENST00000536662.5 ENST00000535643.5 ENST00000541657.5 |
LINC01089
RHOF
|
long intergenic non-protein coding RNA 1089 ras homolog family member F, filopodia associated |
| chr12_-_9869345 | 0.01 |
ENST00000228438.3
|
CLEC2B
|
C-type lectin domain family 2 member B |
| chr10_+_116591010 | 0.01 |
ENST00000530319.5
ENST00000527980.5 ENST00000471549.5 ENST00000534537.5 |
PNLIPRP1
|
pancreatic lipase related protein 1 |
| chr13_+_77741160 | 0.01 |
ENST00000314070.9
ENST00000351546.7 |
SLAIN1
|
SLAIN motif family member 1 |
| chr17_-_41168219 | 0.01 |
ENST00000391356.4
|
KRTAP4-3
|
keratin associated protein 4-3 |
| chr11_-_5343524 | 0.01 |
ENST00000300773.3
|
OR51B5
|
olfactory receptor family 51 subfamily B member 5 |
| chr17_-_36001549 | 0.01 |
ENST00000617897.2
|
CCL15
|
C-C motif chemokine ligand 15 |
| chr6_-_47309898 | 0.01 |
ENST00000296861.2
|
TNFRSF21
|
TNF receptor superfamily member 21 |
| chr3_-_125520165 | 0.01 |
ENST00000251775.9
|
SNX4
|
sorting nexin 4 |
| chrM_+_8489 | 0.01 |
ENST00000361899.2
|
MT-ATP6
|
mitochondrially encoded ATP synthase membrane subunit 6 |
| chr5_+_179732811 | 0.01 |
ENST00000292599.4
|
MAML1
|
mastermind like transcriptional coactivator 1 |
| chr10_-_93482326 | 0.01 |
ENST00000359263.9
|
MYOF
|
myoferlin |
| chr1_+_204870831 | 0.00 |
ENST00000404076.5
ENST00000539706.6 |
NFASC
|
neurofascin |
| chr4_+_95051671 | 0.00 |
ENST00000440890.7
|
BMPR1B
|
bone morphogenetic protein receptor type 1B |
| chr15_+_80441229 | 0.00 |
ENST00000533983.5
ENST00000527771.5 ENST00000525103.1 |
ARNT2
|
aryl hydrocarbon receptor nuclear translocator 2 |
| chr15_+_43792839 | 0.00 |
ENST00000409614.1
|
SERF2
|
small EDRK-rich factor 2 |
| chr19_+_15728024 | 0.00 |
ENST00000305899.5
|
OR10H2
|
olfactory receptor family 10 subfamily H member 2 |
| chr10_-_93482194 | 0.00 |
ENST00000358334.9
ENST00000371488.3 |
MYOF
|
myoferlin |
| chr6_-_48111132 | 0.00 |
ENST00000398738.3
ENST00000679966.1 ENST00000339488.9 |
PTCHD4
|
patched domain containing 4 |
| chr1_+_152970646 | 0.00 |
ENST00000328051.3
|
SPRR4
|
small proline rich protein 4 |
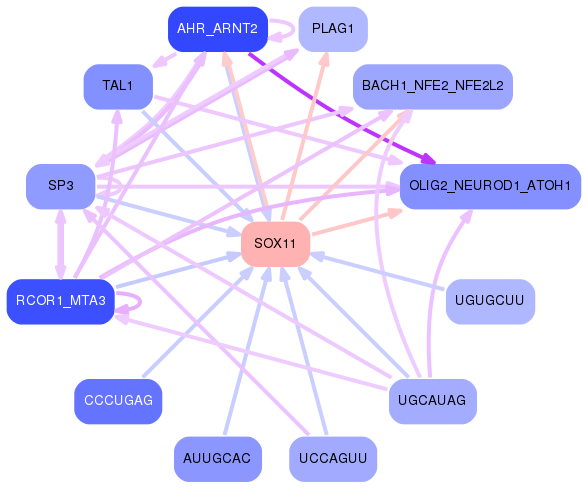
Network of associatons between targets according to the STRING database.

First level regulatory network of SOX11
Gene Ontology Analysis
Gene overrepresentation in biological process category:
| Log-likelihood per target | Total log-likelihood | Term | Description |
|---|---|---|---|
| 0.0 | 0.1 | GO:1903225 | negative regulation of endodermal cell differentiation(GO:1903225) |
| 0.0 | 0.2 | GO:1901202 | negative regulation of extracellular matrix assembly(GO:1901202) |
| 0.0 | 0.1 | GO:0071206 | establishment of protein localization to juxtaparanode region of axon(GO:0071206) |
| 0.0 | 0.1 | GO:0048496 | maintenance of organ identity(GO:0048496) |
| 0.0 | 0.3 | GO:0042908 | xenobiotic transport(GO:0042908) |
| 0.0 | 0.1 | GO:1990637 | response to prolactin(GO:1990637) |
| 0.0 | 0.1 | GO:0060708 | spongiotrophoblast differentiation(GO:0060708) |
| 0.0 | 0.1 | GO:0044010 | biofilm formation(GO:0042710) single-species biofilm formation(GO:0044010) single-species biofilm formation in or on host organism(GO:0044407) regulation of single-species biofilm formation(GO:1900190) negative regulation of single-species biofilm formation(GO:1900191) regulation of single-species biofilm formation in or on host organism(GO:1900228) negative regulation of single-species biofilm formation in or on host organism(GO:1900229) |
| 0.0 | 0.3 | GO:0061162 | establishment of monopolar cell polarity(GO:0061162) |
| 0.0 | 0.3 | GO:0048739 | cardiac muscle fiber development(GO:0048739) |
| 0.0 | 0.3 | GO:0035269 | protein O-linked mannosylation(GO:0035269) |
| 0.0 | 0.1 | GO:0001692 | histamine metabolic process(GO:0001692) |
| 0.0 | 0.1 | GO:0002005 | angiotensin catabolic process in blood(GO:0002005) angiotensin-mediated drinking behavior(GO:0003051) |
| 0.0 | 0.0 | GO:1903786 | mycotoxin catabolic process(GO:0043387) aflatoxin catabolic process(GO:0046223) organic heteropentacyclic compound catabolic process(GO:1901377) regulation of glutathione biosynthetic process(GO:1903786) positive regulation of glutathione biosynthetic process(GO:1903788) |
| 0.0 | 0.1 | GO:0032431 | diacylglycerol biosynthetic process(GO:0006651) activation of phospholipase A2 activity(GO:0032431) |
| 0.0 | 0.1 | GO:0038172 | interleukin-33-mediated signaling pathway(GO:0038172) |
| 0.0 | 0.2 | GO:1900119 | positive regulation of execution phase of apoptosis(GO:1900119) |
Gene overrepresentation in cellular component category:
| Log-likelihood per target | Total log-likelihood | Term | Description |
|---|---|---|---|
| 0.0 | 0.1 | GO:0005588 | collagen type V trimer(GO:0005588) |
| 0.0 | 0.1 | GO:0097543 | ciliary inversin compartment(GO:0097543) |
| 0.0 | 0.1 | GO:0000811 | GINS complex(GO:0000811) |
| 0.0 | 0.1 | GO:0032311 | angiogenin-PRI complex(GO:0032311) |
Gene overrepresentation in molecular function category:
| Log-likelihood per target | Total log-likelihood | Term | Description |
|---|---|---|---|
| 0.1 | 0.3 | GO:0047961 | glycine N-acyltransferase activity(GO:0047961) |
| 0.0 | 0.3 | GO:0042285 | UDP-xylosyltransferase activity(GO:0035252) xylosyltransferase activity(GO:0042285) |
| 0.0 | 0.3 | GO:0008559 | xenobiotic-transporting ATPase activity(GO:0008559) |
| 0.0 | 0.1 | GO:0002113 | interleukin-33 binding(GO:0002113) |
| 0.0 | 0.1 | GO:1990430 | extracellular matrix protein binding(GO:1990430) |
| 0.0 | 0.1 | GO:0005477 | pyruvate secondary active transmembrane transporter activity(GO:0005477) |
| 0.0 | 0.1 | GO:0008241 | peptidyl-dipeptidase activity(GO:0008241) |
| 0.0 | 0.1 | GO:0004522 | ribonuclease A activity(GO:0004522) |
| 0.0 | 0.1 | GO:0004969 | histamine receptor activity(GO:0004969) |