Project
Epithelial-Mesenchymal Transition, human (Scheel, 2011)
Navigation
Downloads
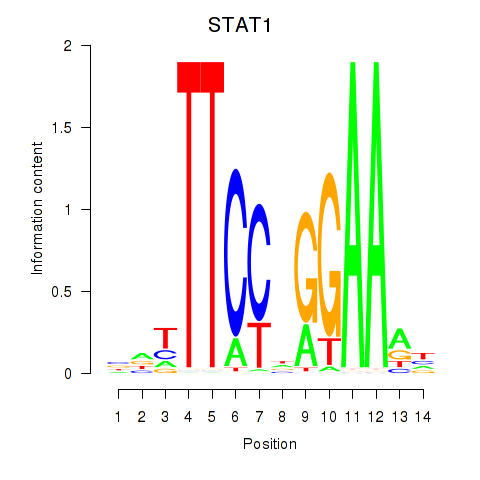
Results for STAT1_STAT3_BCL6
Z-value: 1.01
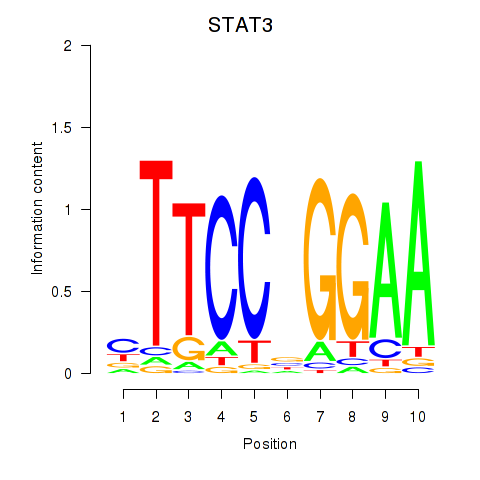
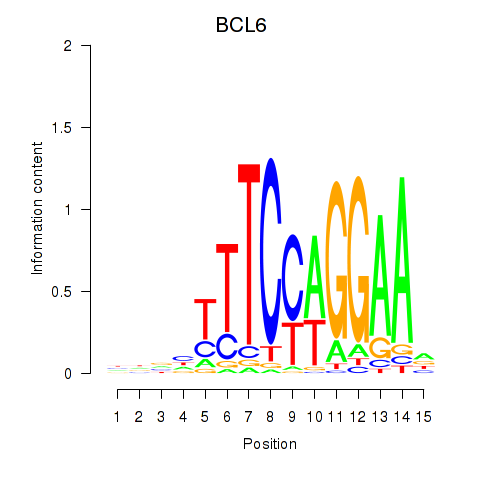
Motif logo
Transcription factors associated with STAT1_STAT3_BCL6
| Gene Symbol | Gene ID | Gene Info |
|---|---|---|
|
STAT1
|
ENSG00000115415.20 | signal transducer and activator of transcription 1 |
|
STAT3
|
ENSG00000168610.16 | signal transducer and activator of transcription 3 |
|
BCL6
|
ENSG00000113916.18 | BCL6 transcription repressor |
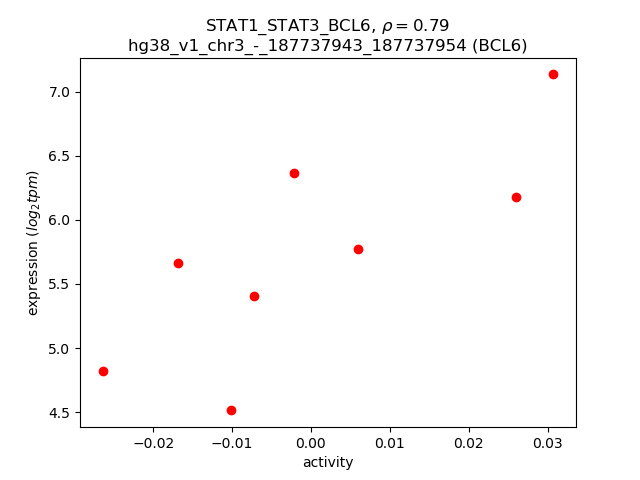
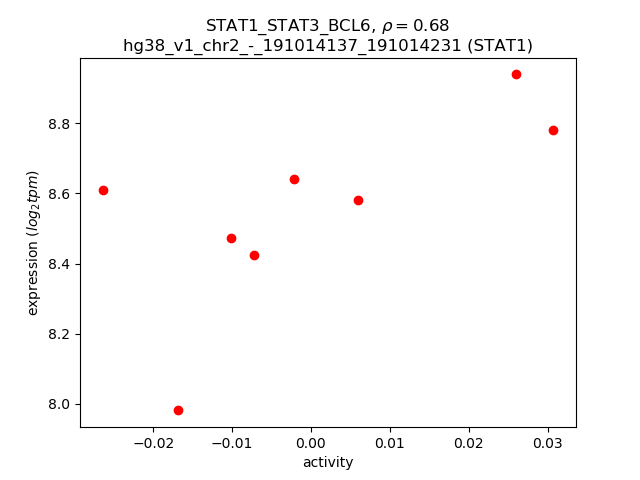
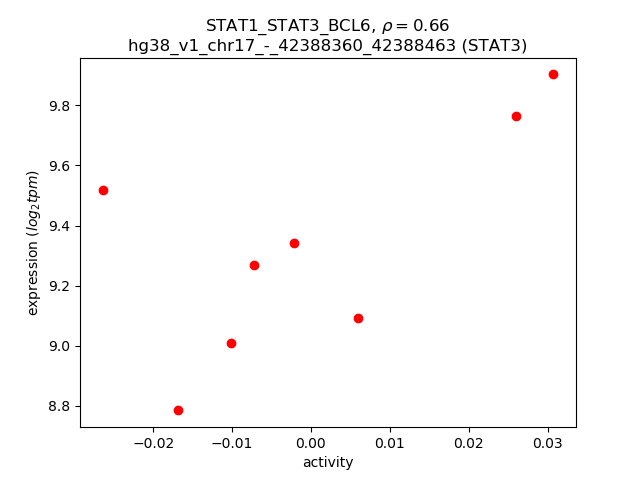
Activity-expression correlation:
| Gene | Promoter | Pearson corr. coef. | P-value | Plot |
|---|---|---|---|---|
| BCL6 | hg38_v1_chr3_-_187737943_187737954 | 0.79 | 1.9e-02 | Click! |
| STAT1 | hg38_v1_chr2_-_191014137_191014231 | 0.68 | 6.4e-02 | Click! |
| STAT3 | hg38_v1_chr17_-_42388360_42388463 | 0.66 | 7.2e-02 | Click! |
Activity profile of STAT1_STAT3_BCL6 motif
Sorted Z-values of STAT1_STAT3_BCL6 motif
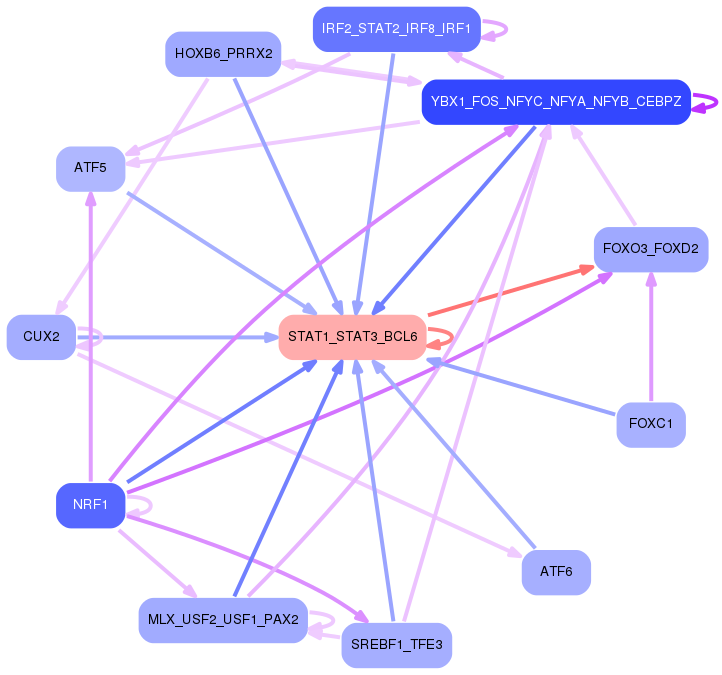
Network of associatons between targets according to the STRING database.

First level regulatory network of STAT1_STAT3_BCL6
Gene Ontology Analysis
Gene overrepresentation in biological process category:
| Log-likelihood per target | Total log-likelihood | Term | Description |
|---|---|---|---|
| 0.3 | 1.5 | GO:1902998 | macrophage proliferation(GO:0061517) microglial cell proliferation(GO:0061518) regulation of neuronal signal transduction(GO:1902847) positive regulation of neurofibrillary tangle assembly(GO:1902998) |
| 0.3 | 0.8 | GO:0001544 | initiation of primordial ovarian follicle growth(GO:0001544) |
| 0.2 | 0.7 | GO:0002769 | natural killer cell inhibitory signaling pathway(GO:0002769) |
| 0.2 | 0.8 | GO:0051892 | negative regulation of cardioblast differentiation(GO:0051892) regulation of cardiac muscle cell myoblast differentiation(GO:2000690) negative regulation of cardiac muscle cell myoblast differentiation(GO:2000691) |
| 0.1 | 0.4 | GO:0002305 | gamma-delta intraepithelial T cell differentiation(GO:0002304) CD8-positive, gamma-delta intraepithelial T cell differentiation(GO:0002305) |
| 0.1 | 0.7 | GO:0048294 | negative regulation of mast cell cytokine production(GO:0032764) negative regulation of isotype switching to IgE isotypes(GO:0048294) |
| 0.1 | 0.4 | GO:1903225 | negative regulation of endodermal cell differentiation(GO:1903225) |
| 0.1 | 0.9 | GO:0006651 | diacylglycerol biosynthetic process(GO:0006651) |
| 0.1 | 0.4 | GO:0002436 | immune complex clearance(GO:0002434) immune complex clearance by monocytes and macrophages(GO:0002436) regulation of immune complex clearance by monocytes and macrophages(GO:0090264) |
| 0.1 | 0.3 | GO:0072277 | metanephric glomerulus morphogenesis(GO:0072275) metanephric glomerulus vasculature morphogenesis(GO:0072276) metanephric glomerular capillary formation(GO:0072277) |
| 0.1 | 1.8 | GO:0034638 | phosphatidylcholine catabolic process(GO:0034638) |
| 0.1 | 1.9 | GO:0018214 | peptidyl-glutamic acid carboxylation(GO:0017187) protein carboxylation(GO:0018214) |
| 0.1 | 0.3 | GO:0090290 | positive regulation of osteoclast proliferation(GO:0090290) |
| 0.1 | 0.9 | GO:0010756 | positive regulation of plasminogen activation(GO:0010756) |
| 0.1 | 0.6 | GO:0000720 | pyrimidine dimer repair by nucleotide-excision repair(GO:0000720) |
| 0.1 | 0.3 | GO:1902824 | positive regulation of late endosome to lysosome transport(GO:1902824) |
| 0.1 | 0.5 | GO:2001245 | regulation of phosphatidylcholine biosynthetic process(GO:2001245) |
| 0.1 | 0.3 | GO:0060708 | spongiotrophoblast differentiation(GO:0060708) |
| 0.1 | 0.2 | GO:0050720 | interleukin-1 beta biosynthetic process(GO:0050720) |
| 0.1 | 0.2 | GO:0070662 | mast cell homeostasis(GO:0033023) mast cell apoptotic process(GO:0033024) regulation of mast cell apoptotic process(GO:0033025) mast cell proliferation(GO:0070662) |
| 0.1 | 0.3 | GO:1901165 | positive regulation of trophoblast cell migration(GO:1901165) |
| 0.1 | 1.1 | GO:1900747 | negative regulation of vascular endothelial growth factor signaling pathway(GO:1900747) |
| 0.1 | 0.6 | GO:0010269 | response to selenium ion(GO:0010269) |
| 0.1 | 0.2 | GO:1902161 | positive regulation of cyclic nucleotide-gated ion channel activity(GO:1902161) |
| 0.1 | 2.2 | GO:0014850 | response to muscle activity(GO:0014850) |
| 0.1 | 0.2 | GO:0048850 | hypophysis morphogenesis(GO:0048850) |
| 0.1 | 0.2 | GO:0006174 | dADP phosphorylation(GO:0006174) dGDP phosphorylation(GO:0006186) AMP phosphorylation(GO:0006756) CDP phosphorylation(GO:0061508) dAMP phosphorylation(GO:0061565) CMP phosphorylation(GO:0061566) dCMP phosphorylation(GO:0061567) GDP phosphorylation(GO:0061568) UDP phosphorylation(GO:0061569) dCDP phosphorylation(GO:0061570) TDP phosphorylation(GO:0061571) |
| 0.1 | 0.4 | GO:0043932 | ossification involved in bone remodeling(GO:0043932) |
| 0.1 | 0.8 | GO:1904424 | regulation of GTP binding(GO:1904424) |
| 0.1 | 0.3 | GO:0035359 | negative regulation of peroxisome proliferator activated receptor signaling pathway(GO:0035359) |
| 0.1 | 0.2 | GO:0097032 | mitochondrial electron transport, succinate to ubiquinone(GO:0006121) respiratory chain complex II assembly(GO:0034552) mitochondrial respiratory chain complex II assembly(GO:0034553) mitochondrial respiratory chain complex II biogenesis(GO:0097032) |
| 0.1 | 0.2 | GO:1900169 | regulation of glucocorticoid mediated signaling pathway(GO:1900169) |
| 0.1 | 0.2 | GO:0072683 | T cell extravasation(GO:0072683) |
| 0.1 | 0.3 | GO:1902766 | skeletal muscle satellite cell migration(GO:1902766) |
| 0.0 | 0.4 | GO:0097324 | melanocyte migration(GO:0097324) positive regulation of lens fiber cell differentiation(GO:1902748) |
| 0.0 | 0.6 | GO:0048251 | elastic fiber assembly(GO:0048251) |
| 0.0 | 0.1 | GO:1904017 | cellular response to Thyroglobulin triiodothyronine(GO:1904017) |
| 0.0 | 2.3 | GO:0000188 | inactivation of MAPK activity(GO:0000188) |
| 0.0 | 0.3 | GO:0035995 | detection of muscle stretch(GO:0035995) |
| 0.0 | 0.4 | GO:2000346 | negative regulation of hepatocyte proliferation(GO:2000346) |
| 0.0 | 0.1 | GO:0060164 | regulation of timing of neuron differentiation(GO:0060164) |
| 0.0 | 0.1 | GO:0035262 | gonad morphogenesis(GO:0035262) |
| 0.0 | 0.5 | GO:2001300 | lipoxin metabolic process(GO:2001300) |
| 0.0 | 0.2 | GO:0014835 | myoblast differentiation involved in skeletal muscle regeneration(GO:0014835) positive regulation of interleukin-12 secretion(GO:2001184) |
| 0.0 | 0.2 | GO:0010499 | proteasomal ubiquitin-independent protein catabolic process(GO:0010499) |
| 0.0 | 0.2 | GO:0060574 | intestinal epithelial cell maturation(GO:0060574) |
| 0.0 | 0.1 | GO:0035744 | T-helper 1 cell cytokine production(GO:0035744) |
| 0.0 | 0.2 | GO:0003065 | positive regulation of heart rate by epinephrine(GO:0003065) |
| 0.0 | 0.2 | GO:0010760 | negative regulation of macrophage chemotaxis(GO:0010760) |
| 0.0 | 0.2 | GO:0051643 | endoplasmic reticulum localization(GO:0051643) |
| 0.0 | 0.1 | GO:0001868 | regulation of complement activation, lectin pathway(GO:0001868) negative regulation of complement activation, lectin pathway(GO:0001869) |
| 0.0 | 0.3 | GO:1902037 | negative regulation of hematopoietic stem cell differentiation(GO:1902037) |
| 0.0 | 0.2 | GO:2000467 | positive regulation of glycogen (starch) synthase activity(GO:2000467) |
| 0.0 | 0.1 | GO:0050976 | detection of mechanical stimulus involved in sensory perception of touch(GO:0050976) cellular response to alkaline pH(GO:0071469) |
| 0.0 | 0.3 | GO:0035754 | B cell chemotaxis(GO:0035754) |
| 0.0 | 0.2 | GO:1903300 | negative regulation of glucokinase activity(GO:0033132) negative regulation of hexokinase activity(GO:1903300) |
| 0.0 | 0.1 | GO:0060355 | positive regulation of cell adhesion molecule production(GO:0060355) |
| 0.0 | 0.1 | GO:0035166 | post-embryonic hemopoiesis(GO:0035166) |
| 0.0 | 0.4 | GO:0051967 | negative regulation of synaptic transmission, glutamatergic(GO:0051967) |
| 0.0 | 0.2 | GO:1904304 | regulation of gastro-intestinal system smooth muscle contraction(GO:1904304) positive regulation of gastro-intestinal system smooth muscle contraction(GO:1904306) |
| 0.0 | 0.2 | GO:2000332 | response to linoleic acid(GO:0070543) blood microparticle formation(GO:0072564) regulation of blood microparticle formation(GO:2000332) positive regulation of blood microparticle formation(GO:2000334) |
| 0.0 | 0.2 | GO:2000860 | positive regulation of mineralocorticoid secretion(GO:2000857) positive regulation of aldosterone secretion(GO:2000860) |
| 0.0 | 0.1 | GO:0018343 | protein farnesylation(GO:0018343) |
| 0.0 | 0.4 | GO:0002315 | marginal zone B cell differentiation(GO:0002315) |
| 0.0 | 0.3 | GO:0017062 | respiratory chain complex III assembly(GO:0017062) mitochondrial respiratory chain complex III assembly(GO:0034551) |
| 0.0 | 0.3 | GO:0048245 | eosinophil chemotaxis(GO:0048245) |
| 0.0 | 0.4 | GO:0043374 | CD8-positive, alpha-beta T cell differentiation(GO:0043374) |
| 0.0 | 0.1 | GO:0031445 | regulation of heterochromatin assembly(GO:0031445) positive regulation of heterochromatin assembly(GO:0031453) |
| 0.0 | 0.3 | GO:0035826 | rubidium ion transport(GO:0035826) regulation of rubidium ion transport(GO:2000680) |
| 0.0 | 0.3 | GO:0006975 | DNA damage induced protein phosphorylation(GO:0006975) |
| 0.0 | 0.1 | GO:0031161 | phosphatidylinositol catabolic process(GO:0031161) |
| 0.0 | 0.1 | GO:0097338 | response to clozapine(GO:0097338) |
| 0.0 | 0.1 | GO:0042421 | norepinephrine biosynthetic process(GO:0042421) |
| 0.0 | 0.1 | GO:0044278 | cell wall disruption in other organism(GO:0044278) |
| 0.0 | 0.1 | GO:0030070 | insulin processing(GO:0030070) |
| 0.0 | 0.3 | GO:0060628 | regulation of ER to Golgi vesicle-mediated transport(GO:0060628) |
| 0.0 | 0.3 | GO:0042759 | long-chain fatty acid biosynthetic process(GO:0042759) |
| 0.0 | 0.1 | GO:0051684 | maintenance of Golgi location(GO:0051684) |
| 0.0 | 0.2 | GO:0097647 | calcitonin family receptor signaling pathway(GO:0097646) amylin receptor signaling pathway(GO:0097647) |
| 0.0 | 0.1 | GO:0007341 | penetration of zona pellucida(GO:0007341) |
| 0.0 | 0.0 | GO:0002876 | positive regulation of chronic inflammatory response to antigenic stimulus(GO:0002876) |
| 0.0 | 0.1 | GO:0032417 | positive regulation of sodium:proton antiporter activity(GO:0032417) |
| 0.0 | 0.3 | GO:0099612 | protein localization to axon(GO:0099612) |
| 0.0 | 0.1 | GO:0044111 | development involved in symbiotic interaction(GO:0044111) |
| 0.0 | 0.2 | GO:0072513 | positive regulation of secondary heart field cardioblast proliferation(GO:0072513) |
| 0.0 | 0.2 | GO:0046600 | negative regulation of centriole replication(GO:0046600) |
| 0.0 | 0.2 | GO:1901409 | positive regulation of phosphorylation of RNA polymerase II C-terminal domain(GO:1901409) |
| 0.0 | 0.1 | GO:0019075 | virus maturation(GO:0019075) |
| 0.0 | 0.3 | GO:0008090 | retrograde axonal transport(GO:0008090) |
| 0.0 | 0.1 | GO:0070213 | protein auto-ADP-ribosylation(GO:0070213) |
| 0.0 | 0.0 | GO:0021529 | spinal cord oligodendrocyte cell differentiation(GO:0021529) spinal cord oligodendrocyte cell fate specification(GO:0021530) |
| 0.0 | 0.2 | GO:0090091 | positive regulation of extracellular matrix disassembly(GO:0090091) |
| 0.0 | 0.0 | GO:1900365 | positive regulation of mRNA polyadenylation(GO:1900365) |
| 0.0 | 0.4 | GO:0048266 | behavioral response to pain(GO:0048266) |
| 0.0 | 0.2 | GO:0045162 | neuronal action potential propagation(GO:0019227) clustering of voltage-gated sodium channels(GO:0045162) action potential propagation(GO:0098870) |
| 0.0 | 0.0 | GO:0048769 | sarcomerogenesis(GO:0048769) |
| 0.0 | 0.2 | GO:0021562 | vestibulocochlear nerve development(GO:0021562) |
| 0.0 | 0.1 | GO:0001957 | intramembranous ossification(GO:0001957) direct ossification(GO:0036072) |
| 0.0 | 0.1 | GO:0035234 | ectopic germ cell programmed cell death(GO:0035234) |
| 0.0 | 0.1 | GO:0097461 | ferric iron import into cell(GO:0097461) ferric iron import across plasma membrane(GO:0098706) |
| 0.0 | 0.1 | GO:0000727 | double-strand break repair via break-induced replication(GO:0000727) |
| 0.0 | 0.1 | GO:0010739 | positive regulation of protein kinase A signaling(GO:0010739) |
| 0.0 | 0.0 | GO:2000296 | negative regulation of hydrogen peroxide catabolic process(GO:2000296) |
| 0.0 | 0.4 | GO:0060716 | labyrinthine layer blood vessel development(GO:0060716) |
| 0.0 | 0.2 | GO:0048681 | negative regulation of axon regeneration(GO:0048681) |
| 0.0 | 0.1 | GO:0019344 | cysteine biosynthetic process(GO:0019344) |
| 0.0 | 0.0 | GO:0072365 | regulation of cellular ketone metabolic process by negative regulation of transcription from RNA polymerase II promoter(GO:0072365) |
| 0.0 | 0.1 | GO:0016191 | synaptic vesicle uncoating(GO:0016191) |
| 0.0 | 0.0 | GO:0002378 | immunoglobulin biosynthetic process(GO:0002378) |
| 0.0 | 0.0 | GO:1900229 | biofilm formation(GO:0042710) single-species biofilm formation(GO:0044010) single-species biofilm formation in or on host organism(GO:0044407) tumor necrosis factor (ligand) superfamily member 11 production(GO:0072535) regulation of single-species biofilm formation(GO:1900190) negative regulation of single-species biofilm formation(GO:1900191) regulation of single-species biofilm formation in or on host organism(GO:1900228) negative regulation of single-species biofilm formation in or on host organism(GO:1900229) positive regulation of chondrocyte proliferation(GO:1902732) regulation of tumor necrosis factor (ligand) superfamily member 11 production(GO:2000307) |
| 0.0 | 0.1 | GO:0015014 | heparan sulfate proteoglycan biosynthetic process, polysaccharide chain biosynthetic process(GO:0015014) |
| 0.0 | 0.3 | GO:0032802 | low-density lipoprotein particle receptor catabolic process(GO:0032802) |
| 0.0 | 0.1 | GO:0031642 | negative regulation of myelination(GO:0031642) |
| 0.0 | 0.1 | GO:0021888 | hypothalamus gonadotrophin-releasing hormone neuron differentiation(GO:0021886) hypothalamus gonadotrophin-releasing hormone neuron development(GO:0021888) |
| 0.0 | 0.0 | GO:2000196 | positive regulation of phosphatidylinositol biosynthetic process(GO:0010513) positive regulation of female gonad development(GO:2000196) negative regulation of binding of sperm to zona pellucida(GO:2000360) |
| 0.0 | 0.1 | GO:0032696 | negative regulation of interleukin-13 production(GO:0032696) |
| 0.0 | 0.1 | GO:0033383 | geranyl diphosphate metabolic process(GO:0033383) geranyl diphosphate biosynthetic process(GO:0033384) farnesyl diphosphate biosynthetic process(GO:0045337) |
| 0.0 | 0.2 | GO:0019321 | pentose metabolic process(GO:0019321) |
| 0.0 | 0.1 | GO:1904715 | negative regulation of chaperone-mediated autophagy(GO:1904715) |
| 0.0 | 0.4 | GO:0016339 | calcium-dependent cell-cell adhesion via plasma membrane cell adhesion molecules(GO:0016339) |
| 0.0 | 0.0 | GO:0038178 | complement component C5a signaling pathway(GO:0038178) |
| 0.0 | 0.1 | GO:0045617 | negative regulation of keratinocyte differentiation(GO:0045617) |
| 0.0 | 0.0 | GO:0045636 | positive regulation of melanocyte differentiation(GO:0045636) |
Gene overrepresentation in cellular component category:
| Log-likelihood per target | Total log-likelihood | Term | Description |
|---|---|---|---|
| 0.2 | 0.6 | GO:0005606 | laminin-1 complex(GO:0005606) |
| 0.2 | 0.9 | GO:0001652 | granular component(GO:0001652) |
| 0.1 | 0.4 | GO:0005588 | collagen type V trimer(GO:0005588) |
| 0.1 | 1.5 | GO:0097418 | neurofibrillary tangle(GO:0097418) |
| 0.1 | 1.1 | GO:0005589 | collagen type VI trimer(GO:0005589) collagen beaded filament(GO:0098647) |
| 0.1 | 0.6 | GO:0000110 | nucleotide-excision repair factor 1 complex(GO:0000110) |
| 0.1 | 0.3 | GO:0035517 | PR-DUB complex(GO:0035517) |
| 0.1 | 0.6 | GO:0071953 | elastic fiber(GO:0071953) |
| 0.1 | 0.5 | GO:1990111 | spermatoproteasome complex(GO:1990111) |
| 0.0 | 0.3 | GO:0031673 | H zone(GO:0031673) |
| 0.0 | 0.2 | GO:0070557 | PCNA-p21 complex(GO:0070557) |
| 0.0 | 0.2 | GO:0031205 | endoplasmic reticulum Sec complex(GO:0031205) |
| 0.0 | 0.1 | GO:0005965 | protein farnesyltransferase complex(GO:0005965) |
| 0.0 | 0.1 | GO:0070435 | Shc-EGFR complex(GO:0070435) |
| 0.0 | 0.2 | GO:1990769 | proximal neuron projection(GO:1990769) |
| 0.0 | 0.1 | GO:0032002 | interleukin-28 receptor complex(GO:0032002) |
| 0.0 | 0.1 | GO:1990667 | PCSK9-AnxA2 complex(GO:1990667) |
| 0.0 | 0.1 | GO:0008537 | proteasome activator complex(GO:0008537) |
| 0.0 | 0.4 | GO:0030478 | actin cap(GO:0030478) |
| 0.0 | 0.3 | GO:0097487 | multivesicular body, internal vesicle(GO:0097487) |
| 0.0 | 0.6 | GO:0001518 | voltage-gated sodium channel complex(GO:0001518) |
| 0.0 | 0.2 | GO:0030891 | VCB complex(GO:0030891) |
| 0.0 | 0.4 | GO:0031045 | dense core granule(GO:0031045) |
| 0.0 | 0.2 | GO:1903439 | calcitonin family receptor complex(GO:1903439) amylin receptor complex(GO:1903440) |
| 0.0 | 0.3 | GO:0008385 | IkappaB kinase complex(GO:0008385) |
| 0.0 | 2.2 | GO:0031093 | platelet alpha granule lumen(GO:0031093) |
| 0.0 | 0.1 | GO:0005602 | complement component C1 complex(GO:0005602) |
| 0.0 | 0.3 | GO:0000177 | cytoplasmic exosome (RNase complex)(GO:0000177) |
| 0.0 | 0.2 | GO:0097512 | cardiac myofibril(GO:0097512) |
| 0.0 | 0.0 | GO:0031251 | PAN complex(GO:0031251) |
| 0.0 | 0.1 | GO:0000836 | ER ubiquitin ligase complex(GO:0000835) Hrd1p ubiquitin ligase complex(GO:0000836) |
| 0.0 | 0.1 | GO:0098575 | lumenal side of lysosomal membrane(GO:0098575) |
| 0.0 | 0.2 | GO:0016593 | Cdc73/Paf1 complex(GO:0016593) |
| 0.0 | 0.3 | GO:0030122 | AP-2 adaptor complex(GO:0030122) |
| 0.0 | 0.1 | GO:0044305 | calyx of Held(GO:0044305) |
| 0.0 | 0.2 | GO:0005862 | muscle thin filament tropomyosin(GO:0005862) |
| 0.0 | 0.2 | GO:0045275 | mitochondrial respiratory chain complex III(GO:0005750) respiratory chain complex III(GO:0045275) |
| 0.0 | 0.0 | GO:0070939 | Dsl1p complex(GO:0070939) |
| 0.0 | 0.1 | GO:0005579 | membrane attack complex(GO:0005579) |
| 0.0 | 0.3 | GO:0031254 | uropod(GO:0001931) cell trailing edge(GO:0031254) |
| 0.0 | 0.1 | GO:0071598 | neuronal ribonucleoprotein granule(GO:0071598) |
| 0.0 | 0.1 | GO:0036021 | endolysosome lumen(GO:0036021) |
| 0.0 | 0.1 | GO:0030991 | intraciliary transport particle A(GO:0030991) |
Gene overrepresentation in molecular function category:
| Log-likelihood per target | Total log-likelihood | Term | Description |
|---|---|---|---|
| 0.5 | 1.9 | GO:0047391 | alkylglycerophosphoethanolamine phosphodiesterase activity(GO:0047391) |
| 0.2 | 0.5 | GO:0070538 | oleic acid binding(GO:0070538) |
| 0.1 | 0.3 | GO:0005017 | platelet-derived growth factor-activated receptor activity(GO:0005017) |
| 0.1 | 0.5 | GO:0016404 | 15-hydroxyprostaglandin dehydrogenase (NAD+) activity(GO:0016404) |
| 0.1 | 0.3 | GO:0031727 | CCR2 chemokine receptor binding(GO:0031727) |
| 0.1 | 0.6 | GO:1990599 | 3' overhang single-stranded DNA endodeoxyribonuclease activity(GO:1990599) |
| 0.1 | 2.2 | GO:0001965 | G-protein alpha-subunit binding(GO:0001965) |
| 0.1 | 0.2 | GO:0019150 | D-ribulokinase activity(GO:0019150) |
| 0.1 | 1.5 | GO:0051787 | misfolded protein binding(GO:0051787) |
| 0.1 | 0.2 | GO:0005260 | channel-conductance-controlling ATPase activity(GO:0005260) |
| 0.1 | 0.2 | GO:0005163 | nerve growth factor receptor binding(GO:0005163) |
| 0.1 | 0.2 | GO:0005173 | stem cell factor receptor binding(GO:0005173) |
| 0.0 | 0.4 | GO:0015277 | kainate selective glutamate receptor activity(GO:0015277) |
| 0.0 | 0.1 | GO:0033142 | progesterone receptor binding(GO:0033142) |
| 0.0 | 0.0 | GO:0046899 | nucleoside triphosphate adenylate kinase activity(GO:0046899) |
| 0.0 | 0.5 | GO:0035374 | chondroitin sulfate binding(GO:0035374) |
| 0.0 | 0.7 | GO:0001161 | intronic transcription regulatory region sequence-specific DNA binding(GO:0001161) intronic transcription regulatory region DNA binding(GO:0044213) |
| 0.0 | 0.2 | GO:0019912 | cyclin-dependent protein kinase activating kinase activity(GO:0019912) |
| 0.0 | 0.3 | GO:0003854 | 3-beta-hydroxy-delta5-steroid dehydrogenase activity(GO:0003854) |
| 0.0 | 0.1 | GO:0004660 | protein farnesyltransferase activity(GO:0004660) |
| 0.0 | 0.2 | GO:0038062 | protein tyrosine kinase collagen receptor activity(GO:0038062) |
| 0.0 | 0.2 | GO:0070892 | lipoteichoic acid receptor activity(GO:0070892) |
| 0.0 | 0.1 | GO:0097604 | temperature-gated cation channel activity(GO:0097604) |
| 0.0 | 0.2 | GO:0004614 | phosphoglucomutase activity(GO:0004614) |
| 0.0 | 0.1 | GO:0050119 | N-acetylglucosamine deacetylase activity(GO:0050119) |
| 0.0 | 0.1 | GO:0019770 | IgG receptor activity(GO:0019770) |
| 0.0 | 0.1 | GO:0042007 | interleukin-18 binding(GO:0042007) |
| 0.0 | 0.3 | GO:0031433 | telethonin binding(GO:0031433) |
| 0.0 | 0.3 | GO:0042975 | peroxisome proliferator activated receptor binding(GO:0042975) |
| 0.0 | 0.2 | GO:0097643 | amylin receptor activity(GO:0097643) |
| 0.0 | 0.2 | GO:0051525 | NFAT protein binding(GO:0051525) |
| 0.0 | 0.9 | GO:0004435 | phosphatidylinositol phospholipase C activity(GO:0004435) |
| 0.0 | 0.1 | GO:0044713 | GTP diphosphatase activity(GO:0036219) 2-hydroxy-adenosine triphosphate pyrophosphatase activity(GO:0044713) 2-hydroxy-(deoxy)adenosine-triphosphate pyrophosphatase activity(GO:0044714) ATP diphosphatase activity(GO:0047693) |
| 0.0 | 0.1 | GO:0001515 | opioid peptide activity(GO:0001515) |
| 0.0 | 0.6 | GO:0031402 | sodium ion binding(GO:0031402) |
| 0.0 | 0.2 | GO:0016681 | ubiquinol-cytochrome-c reductase activity(GO:0008121) oxidoreductase activity, acting on diphenols and related substances as donors, cytochrome as acceptor(GO:0016681) |
| 0.0 | 0.3 | GO:0019911 | structural constituent of myelin sheath(GO:0019911) |
| 0.0 | 0.1 | GO:0016715 | oxidoreductase activity, acting on paired donors, with incorporation or reduction of molecular oxygen, reduced ascorbate as one donor, and incorporation of one atom of oxygen(GO:0016715) |
| 0.0 | 0.1 | GO:0045029 | UDP-activated nucleotide receptor activity(GO:0045029) |
| 0.0 | 0.1 | GO:0004507 | steroid 11-beta-monooxygenase activity(GO:0004507) corticosterone 18-monooxygenase activity(GO:0047783) |
| 0.0 | 1.4 | GO:0050840 | extracellular matrix binding(GO:0050840) |
| 0.0 | 0.3 | GO:0005522 | profilin binding(GO:0005522) |
| 0.0 | 0.1 | GO:0019834 | phospholipase A2 inhibitor activity(GO:0019834) |
| 0.0 | 0.7 | GO:0001968 | fibronectin binding(GO:0001968) |
| 0.0 | 0.0 | GO:1904455 | ubiquitin-specific protease activity involved in negative regulation of ERAD pathway(GO:1904455) |
| 0.0 | 1.1 | GO:0016504 | peptidase activator activity(GO:0016504) |
| 0.0 | 0.1 | GO:0004704 | NF-kappaB-inducing kinase activity(GO:0004704) |
| 0.0 | 0.1 | GO:0052851 | cupric reductase activity(GO:0008823) ferric-chelate reductase (NADPH) activity(GO:0052851) |
| 0.0 | 0.2 | GO:0001206 | transcriptional repressor activity, RNA polymerase II distal enhancer sequence-specific binding(GO:0001206) |
| 0.0 | 0.9 | GO:0001221 | transcription cofactor binding(GO:0001221) |
| 0.0 | 0.4 | GO:0070003 | threonine-type endopeptidase activity(GO:0004298) threonine-type peptidase activity(GO:0070003) |
| 0.0 | 0.0 | GO:0005477 | pyruvate secondary active transmembrane transporter activity(GO:0005477) |
| 0.0 | 0.2 | GO:0042301 | phosphate ion binding(GO:0042301) |
| 0.0 | 0.2 | GO:1990459 | transferrin receptor binding(GO:1990459) |
| 0.0 | 0.2 | GO:0050145 | nucleoside phosphate kinase activity(GO:0050145) |
| 0.0 | 0.1 | GO:0008158 | hedgehog receptor activity(GO:0008158) |
| 0.0 | 0.2 | GO:0008140 | cAMP response element binding protein binding(GO:0008140) |
| 0.0 | 0.1 | GO:0043812 | phosphatidylinositol-4-phosphate phosphatase activity(GO:0043812) |
| 0.0 | 0.1 | GO:0031728 | CCR3 chemokine receptor binding(GO:0031728) |
| 0.0 | 0.3 | GO:0098748 | clathrin adaptor activity(GO:0035615) endocytic adaptor activity(GO:0098748) |
| 0.0 | 0.1 | GO:0004534 | 5'-3' exoribonuclease activity(GO:0004534) |
| 0.0 | 0.1 | GO:0003720 | telomerase activity(GO:0003720) RNA-directed DNA polymerase activity(GO:0003964) |
| 0.0 | 0.0 | GO:0004616 | phosphogluconate dehydrogenase (decarboxylating) activity(GO:0004616) |
| 0.0 | 0.1 | GO:0004308 | exo-alpha-sialidase activity(GO:0004308) alpha-sialidase activity(GO:0016997) |
| 0.0 | 0.3 | GO:0004707 | MAP kinase activity(GO:0004707) |
| 0.0 | 0.1 | GO:0004337 | dimethylallyltranstransferase activity(GO:0004161) geranyltranstransferase activity(GO:0004337) |
| 0.0 | 0.4 | GO:0017147 | Wnt-protein binding(GO:0017147) |
| 0.0 | 0.1 | GO:0052832 | inositol monophosphate 1-phosphatase activity(GO:0008934) inositol monophosphate 3-phosphatase activity(GO:0052832) inositol monophosphate 4-phosphatase activity(GO:0052833) inositol monophosphate phosphatase activity(GO:0052834) |
| 0.0 | 0.0 | GO:0004878 | complement component C5a receptor activity(GO:0004878) |
| 0.0 | 0.0 | GO:0008192 | RNA guanylyltransferase activity(GO:0008192) |
Gene overrepresentation in curated gene sets: canonical pathways category:
| Log-likelihood per target | Total log-likelihood | Term | Description |
|---|---|---|---|
| 0.0 | 0.6 | PID INTEGRIN4 PATHWAY | Alpha6 beta4 integrin-ligand interactions |
| 0.0 | 1.0 | PID HDAC CLASSIII PATHWAY | Signaling events mediated by HDAC Class III |
| 0.0 | 1.1 | NABA PROTEOGLYCANS | Genes encoding proteoglycans |
| 0.0 | 0.3 | PID P38 GAMMA DELTA PATHWAY | Signaling mediated by p38-gamma and p38-delta |
| 0.0 | 0.4 | PID PDGFRA PATHWAY | PDGFR-alpha signaling pathway |
| 0.0 | 0.9 | PID RAS PATHWAY | Regulation of Ras family activation |
| 0.0 | 1.4 | PID IL4 2PATHWAY | IL4-mediated signaling events |
| 0.0 | 0.4 | PID WNT SIGNALING PATHWAY | Wnt signaling network |
| 0.0 | 0.3 | PID ARF 3PATHWAY | Arf1 pathway |
| 0.0 | 1.3 | PID MYC REPRESS PATHWAY | Validated targets of C-MYC transcriptional repression |
Gene overrepresentation in curated gene sets: REACTOME pathways category:
| Log-likelihood per target | Total log-likelihood | Term | Description |
|---|---|---|---|
| 0.1 | 1.9 | REACTOME GAMMA CARBOXYLATION TRANSPORT AND AMINO TERMINAL CLEAVAGE OF PROTEINS | Genes involved in Gamma-carboxylation, transport, and amino-terminal cleavage of proteins |
| 0.0 | 1.1 | REACTOME CS DS DEGRADATION | Genes involved in CS/DS degradation |
| 0.0 | 2.2 | REACTOME G ALPHA Z SIGNALLING EVENTS | Genes involved in G alpha (z) signalling events |
| 0.0 | 0.8 | REACTOME SIGNALING BY NODAL | Genes involved in Signaling by NODAL |
| 0.0 | 0.6 | REACTOME DSCAM INTERACTIONS | Genes involved in DSCAM interactions |
| 0.0 | 0.2 | REACTOME SYNTHESIS OF BILE ACIDS AND BILE SALTS VIA 24 HYDROXYCHOLESTEROL | Genes involved in Synthesis of bile acids and bile salts via 24-hydroxycholesterol |
| 0.0 | 0.5 | REACTOME CRMPS IN SEMA3A SIGNALING | Genes involved in CRMPs in Sema3A signaling |
| 0.0 | 0.6 | REACTOME FORMATION OF INCISION COMPLEX IN GG NER | Genes involved in Formation of incision complex in GG-NER |
| 0.0 | 0.3 | REACTOME IL 6 SIGNALING | Genes involved in Interleukin-6 signaling |
| 0.0 | 0.3 | REACTOME DOWNSTREAM SIGNAL TRANSDUCTION | Genes involved in Downstream signal transduction |
| 0.0 | 1.2 | REACTOME COLLAGEN FORMATION | Genes involved in Collagen formation |
| 0.0 | 0.3 | REACTOME GAP JUNCTION DEGRADATION | Genes involved in Gap junction degradation |
| 0.0 | 0.4 | REACTOME IONOTROPIC ACTIVITY OF KAINATE RECEPTORS | Genes involved in Ionotropic activity of Kainate Receptors |
| 0.0 | 0.6 | REACTOME SMOOTH MUSCLE CONTRACTION | Genes involved in Smooth Muscle Contraction |