|
chr17_-_19745369
Show fit
|
0.16 |
ENST00000573368.5
ENST00000457500.6
|
ALDH3A1
|
aldehyde dehydrogenase 3 family member A1
|
|
chr12_-_10453330
Show fit
|
0.15 |
ENST00000347831.9
ENST00000359151.8
|
KLRC1
|
killer cell lectin like receptor C1
|
|
chr15_-_93073111
Show fit
|
0.14 |
ENST00000557420.1
ENST00000542321.6
|
RGMA
|
repulsive guidance molecule BMP co-receptor a
|
|
chr1_+_78620432
Show fit
|
0.14 |
ENST00000370751.10
ENST00000459784.6
ENST00000680110.1
ENST00000680295.1
|
IFI44L
|
interferon induced protein 44 like
|
|
chr1_+_78620722
Show fit
|
0.13 |
ENST00000679848.1
|
IFI44L
|
interferon induced protein 44 like
|
|
chr7_-_38354517
Show fit
|
0.12 |
ENST00000390345.2
|
TRGV4
|
T cell receptor gamma variable 4
|
|
chr8_-_19682576
Show fit
|
0.12 |
ENST00000332246.10
|
CSGALNACT1
|
chondroitin sulfate N-acetylgalactosaminyltransferase 1
|
|
chr15_-_93073706
Show fit
|
0.11 |
ENST00000425933.6
|
RGMA
|
repulsive guidance molecule BMP co-receptor a
|
|
chr19_-_34677157
Show fit
|
0.09 |
ENST00000601241.6
|
SCGB2B2
|
secretoglobin family 2B member 2
|
|
chr17_-_19745602
Show fit
|
0.09 |
ENST00000444455.5
ENST00000439102.6
|
ALDH3A1
|
aldehyde dehydrogenase 3 family member A1
|
|
chrX_+_136205982
Show fit
|
0.09 |
ENST00000628568.1
|
FHL1
|
four and a half LIM domains 1
|
|
chr14_+_104745960
Show fit
|
0.09 |
ENST00000556623.1
ENST00000555674.1
|
ADSS1
|
adenylosuccinate synthase 1
|
|
chr10_+_5094405
Show fit
|
0.09 |
ENST00000380554.5
|
AKR1C3
|
aldo-keto reductase family 1 member C3
|
|
chr4_+_122732652
Show fit
|
0.09 |
ENST00000542236.5
ENST00000314218.8
|
BBS12
|
Bardet-Biedl syndrome 12
|
|
chr4_+_70050431
Show fit
|
0.08 |
ENST00000511674.5
ENST00000246896.8
|
HTN1
|
histatin 1
|
|
chrX_+_12906639
Show fit
|
0.08 |
ENST00000311912.5
|
TLR8
|
toll like receptor 8
|
|
chr1_+_89524871
Show fit
|
0.08 |
ENST00000639264.1
|
LRRC8B
|
leucine rich repeat containing 8 VRAC subunit B
|
|
chr1_+_89524819
Show fit
|
0.07 |
ENST00000439853.6
ENST00000330947.7
ENST00000449440.5
ENST00000640258.1
|
LRRC8B
|
leucine rich repeat containing 8 VRAC subunit B
|
|
chr3_-_49429252
Show fit
|
0.07 |
ENST00000615713.4
|
NICN1
|
nicolin 1
|
|
chr11_-_120123026
Show fit
|
0.06 |
ENST00000533302.5
|
TRIM29
|
tripartite motif containing 29
|
|
chr7_-_138755892
Show fit
|
0.06 |
ENST00000644341.1
ENST00000478480.2
|
ATP6V0A4
|
ATPase H+ transporting V0 subunit a4
|
|
chr19_-_44304968
Show fit
|
0.06 |
ENST00000591609.1
ENST00000589799.5
ENST00000291182.9
ENST00000650576.1
ENST00000589248.5
|
ZNF235
|
zinc finger protein 235
|
|
chr19_+_48019726
Show fit
|
0.06 |
ENST00000593413.1
|
ELSPBP1
|
epididymal sperm binding protein 1
|
|
chr12_-_53727428
Show fit
|
0.06 |
ENST00000548263.5
ENST00000430117.6
ENST00000549173.5
ENST00000550804.6
ENST00000551900.5
ENST00000546619.5
ENST00000548177.5
ENST00000549349.5
|
CALCOCO1
|
calcium binding and coiled-coil domain 1
|
|
chr3_-_49429304
Show fit
|
0.06 |
ENST00000636166.1
ENST00000273598.8
ENST00000436744.2
|
ENSG00000283189.2
NICN1
|
novel protein
nicolin 1
|
|
chr4_-_68951763
Show fit
|
0.06 |
ENST00000251566.9
|
UGT2A3
|
UDP glucuronosyltransferase family 2 member A3
|
|
chr16_-_66549839
Show fit
|
0.06 |
ENST00000527800.6
ENST00000677555.1
ENST00000563369.6
|
TK2
|
thymidine kinase 2
|
|
chr4_-_119300546
Show fit
|
0.06 |
ENST00000504110.2
|
C4orf3
|
chromosome 4 open reading frame 3
|
|
chr19_-_2292024
Show fit
|
0.06 |
ENST00000585527.1
|
LINGO3
|
leucine rich repeat and Ig domain containing 3
|
|
chr7_+_77122609
Show fit
|
0.06 |
ENST00000285871.5
|
CCDC146
|
coiled-coil domain containing 146
|
|
chr11_+_119121559
Show fit
|
0.06 |
ENST00000350777.7
ENST00000529988.5
ENST00000527410.3
|
HINFP
|
histone H4 transcription factor
|
|
chr17_+_6756035
Show fit
|
0.06 |
ENST00000361842.8
ENST00000574907.5
|
XAF1
|
XIAP associated factor 1
|
|
chr12_-_53727476
Show fit
|
0.06 |
ENST00000549784.5
ENST00000262059.8
|
CALCOCO1
|
calcium binding and coiled-coil domain 1
|
|
chr19_-_40090921
Show fit
|
0.05 |
ENST00000595508.1
ENST00000414720.6
ENST00000455521.5
ENST00000595773.5
ENST00000683561.1
|
ENSG00000269749.1
ZNF780A
|
novel transcript
zinc finger protein 780A
|
|
chr1_+_19596960
Show fit
|
0.05 |
ENST00000617872.4
ENST00000322753.7
ENST00000602662.1
|
MICOS10
NBL1
|
mitochondrial contact site and cristae organizing system subunit 10
NBL1, DAN family BMP antagonist
|
|
chr3_+_46577778
Show fit
|
0.05 |
ENST00000296145.6
|
TDGF1
|
teratocarcinoma-derived growth factor 1
|
|
chr4_-_8127650
Show fit
|
0.05 |
ENST00000545242.6
ENST00000676532.1
|
ABLIM2
|
actin binding LIM protein family member 2
|
|
chr3_+_148730100
Show fit
|
0.05 |
ENST00000474935.5
ENST00000475347.5
ENST00000461609.1
|
AGTR1
|
angiotensin II receptor type 1
|
|
chr16_-_66550005
Show fit
|
0.05 |
ENST00000527284.6
|
TK2
|
thymidine kinase 2
|
|
chr5_+_96875978
Show fit
|
0.05 |
ENST00000510373.5
|
ERAP2
|
endoplasmic reticulum aminopeptidase 2
|
|
chr13_+_100089015
Show fit
|
0.04 |
ENST00000376286.8
ENST00000376279.7
ENST00000376285.6
|
PCCA
|
propionyl-CoA carboxylase subunit alpha
|
|
chr1_-_161069666
Show fit
|
0.04 |
ENST00000368016.7
|
ARHGAP30
|
Rho GTPase activating protein 30
|
|
chr17_-_78874038
Show fit
|
0.04 |
ENST00000586057.5
|
TIMP2
|
TIMP metallopeptidase inhibitor 2
|
|
chr7_+_48455063
Show fit
|
0.04 |
ENST00000411975.5
|
ABCA13
|
ATP binding cassette subfamily A member 13
|
|
chr8_-_93017656
Show fit
|
0.04 |
ENST00000520686.5
|
TRIQK
|
triple QxxK/R motif containing
|
|
chr5_-_178232759
Show fit
|
0.04 |
ENST00000308158.10
|
PHYKPL
|
5-phosphohydroxy-L-lysine phospho-lyase
|
|
chr20_+_45207025
Show fit
|
0.04 |
ENST00000372781.4
|
SEMG1
|
semenogelin 1
|
|
chr7_-_141014939
Show fit
|
0.04 |
ENST00000324787.10
ENST00000467334.1
|
MRPS33
|
mitochondrial ribosomal protein S33
|
|
chr3_-_142225556
Show fit
|
0.04 |
ENST00000392993.7
|
GK5
|
glycerol kinase 5
|
|
chr7_-_76626127
Show fit
|
0.04 |
ENST00000454397.1
|
POMZP3
|
POM121 and ZP3 fusion
|
|
chr10_-_119536533
Show fit
|
0.04 |
ENST00000392865.5
|
RGS10
|
regulator of G protein signaling 10
|
|
chr2_-_85409805
Show fit
|
0.04 |
ENST00000449030.5
|
CAPG
|
capping actin protein, gelsolin like
|
|
chr7_-_138627444
Show fit
|
0.03 |
ENST00000463557.1
|
SVOPL
|
SVOP like
|
|
chr14_-_106185387
Show fit
|
0.03 |
ENST00000390605.2
|
IGHV1-18
|
immunoglobulin heavy variable 1-18
|
|
chr6_+_52420107
Show fit
|
0.03 |
ENST00000636489.1
ENST00000637089.1
ENST00000637353.1
ENST00000637263.1
|
EFHC1
|
EF-hand domain containing 1
|
|
chr19_+_9247344
Show fit
|
0.03 |
ENST00000641946.1
|
OR7E24
|
olfactory receptor family 7 subfamily E member 24
|
|
chr11_-_132943092
Show fit
|
0.03 |
ENST00000612177.4
ENST00000541867.5
|
OPCML
|
opioid binding protein/cell adhesion molecule like
|
|
chr1_-_160647037
Show fit
|
0.03 |
ENST00000302035.11
|
SLAMF1
|
signaling lymphocytic activation molecule family member 1
|
|
chr2_-_216860042
Show fit
|
0.03 |
ENST00000236979.2
|
TNP1
|
transition protein 1
|
|
chr15_+_75347030
Show fit
|
0.03 |
ENST00000566313.5
ENST00000355059.9
ENST00000568059.1
ENST00000568881.1
|
NEIL1
|
nei like DNA glycosylase 1
|
|
chr2_-_73642413
Show fit
|
0.03 |
ENST00000272425.4
|
NAT8
|
N-acetyltransferase 8 (putative)
|
|
chr12_-_9208388
Show fit
|
0.03 |
ENST00000261336.7
|
PZP
|
PZP alpha-2-macroglobulin like
|
|
chr12_+_8123609
Show fit
|
0.03 |
ENST00000229332.12
|
CLEC4A
|
C-type lectin domain family 4 member A
|
|
chr6_-_36547400
Show fit
|
0.03 |
ENST00000229812.8
|
STK38
|
serine/threonine kinase 38
|
|
chr6_+_52420332
Show fit
|
0.03 |
ENST00000636107.1
ENST00000371068.11
ENST00000636702.1
ENST00000635996.1
ENST00000636379.1
|
EFHC1
|
EF-hand domain containing 1
|
|
chr1_-_161069857
Show fit
|
0.03 |
ENST00000368013.8
|
ARHGAP30
|
Rho GTPase activating protein 30
|
|
chr5_-_178232537
Show fit
|
0.03 |
ENST00000476170.2
ENST00000323594.8
|
PHYKPL
|
5-phosphohydroxy-L-lysine phospho-lyase
|
|
chr10_+_22345445
Show fit
|
0.03 |
ENST00000376603.6
ENST00000456231.6
ENST00000376624.8
ENST00000313311.10
ENST00000435326.5
|
SPAG6
|
sperm associated antigen 6
|
|
chr12_-_110689751
Show fit
|
0.03 |
ENST00000439744.6
ENST00000549442.5
|
HVCN1
|
hydrogen voltage gated channel 1
|
|
chr19_+_49487510
Show fit
|
0.03 |
ENST00000679106.1
ENST00000621674.4
ENST00000391857.9
ENST00000678510.1
ENST00000467825.2
|
RPL13A
|
ribosomal protein L13a
|
|
chr1_-_161069962
Show fit
|
0.03 |
ENST00000368015.1
|
ARHGAP30
|
Rho GTPase activating protein 30
|
|
chr1_-_167935987
Show fit
|
0.03 |
ENST00000367846.8
|
MPC2
|
mitochondrial pyruvate carrier 2
|
|
chr15_+_67125707
Show fit
|
0.03 |
ENST00000540846.6
|
SMAD3
|
SMAD family member 3
|
|
chr5_+_35856883
Show fit
|
0.03 |
ENST00000506850.5
ENST00000303115.8
ENST00000511982.1
|
IL7R
|
interleukin 7 receptor
|
|
chr6_+_110958680
Show fit
|
0.03 |
ENST00000329970.8
|
GTF3C6
|
general transcription factor IIIC subunit 6
|
|
chr9_-_16727980
Show fit
|
0.03 |
ENST00000418777.5
ENST00000468187.6
|
BNC2
|
basonuclin 2
|
|
chr2_-_26641363
Show fit
|
0.03 |
ENST00000288861.5
|
CIB4
|
calcium and integrin binding family member 4
|
|
chr1_+_196774813
Show fit
|
0.03 |
ENST00000471440.6
ENST00000391985.7
ENST00000617219.1
ENST00000367425.9
|
CFHR3
|
complement factor H related 3
|
|
chr2_-_27323006
Show fit
|
0.02 |
ENST00000402310.5
ENST00000405983.5
ENST00000403262.6
|
MPV17
|
mitochondrial inner membrane protein MPV17
|
|
chr19_-_40090860
Show fit
|
0.02 |
ENST00000599972.1
ENST00000450241.6
ENST00000595687.6
ENST00000340963.9
|
ZNF780A
|
zinc finger protein 780A
|
|
chr8_+_49072335
Show fit
|
0.02 |
ENST00000399653.8
ENST00000522267.6
ENST00000303202.8
|
PPDPFL
|
pancreatic progenitor cell differentiation and proliferation factor like
|
|
chr2_-_200889266
Show fit
|
0.02 |
ENST00000443398.5
ENST00000286175.12
ENST00000409449.5
|
PPIL3
|
peptidylprolyl isomerase like 3
|
|
chr2_-_200888993
Show fit
|
0.02 |
ENST00000409264.6
ENST00000392283.9
|
PPIL3
|
peptidylprolyl isomerase like 3
|
|
chr11_-_65121780
Show fit
|
0.02 |
ENST00000525297.5
ENST00000529259.1
|
FAU
|
FAU ubiquitin like and ribosomal protein S30 fusion
|
|
chr10_-_12195821
Show fit
|
0.02 |
ENST00000378937.7
ENST00000378927.7
|
NUDT5
|
nudix hydrolase 5
|
|
chr1_+_25616780
Show fit
|
0.02 |
ENST00000374332.9
|
MAN1C1
|
mannosidase alpha class 1C member 1
|
|
chr12_+_120302316
Show fit
|
0.02 |
ENST00000536460.1
ENST00000202967.4
|
SIRT4
|
sirtuin 4
|
|
chr6_-_125301900
Show fit
|
0.02 |
ENST00000608295.5
ENST00000398153.7
ENST00000608284.1
|
HDDC2
|
HD domain containing 2
|
|
chr13_-_44474296
Show fit
|
0.02 |
ENST00000611198.4
|
TSC22D1
|
TSC22 domain family member 1
|
|
chr19_+_852295
Show fit
|
0.02 |
ENST00000263621.2
|
ELANE
|
elastase, neutrophil expressed
|
|
chr17_+_50274447
Show fit
|
0.02 |
ENST00000507382.2
|
TMEM92
|
transmembrane protein 92
|
|
chr8_-_139654330
Show fit
|
0.02 |
ENST00000647605.1
|
KCNK9
|
potassium two pore domain channel subfamily K member 9
|
|
chr2_+_71453538
Show fit
|
0.02 |
ENST00000258104.8
|
DYSF
|
dysferlin
|
|
chr3_+_2892199
Show fit
|
0.02 |
ENST00000397459.6
|
CNTN4
|
contactin 4
|
|
chr19_-_46023046
Show fit
|
0.02 |
ENST00000008938.5
|
PGLYRP1
|
peptidoglycan recognition protein 1
|
|
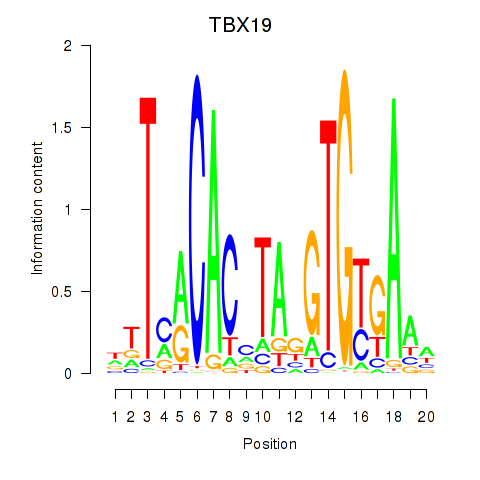
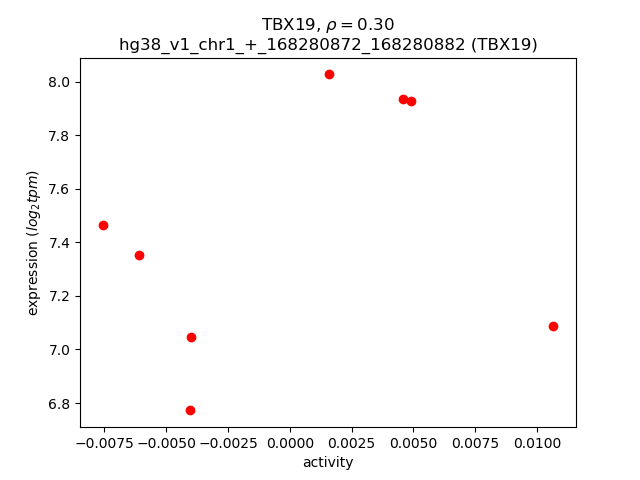
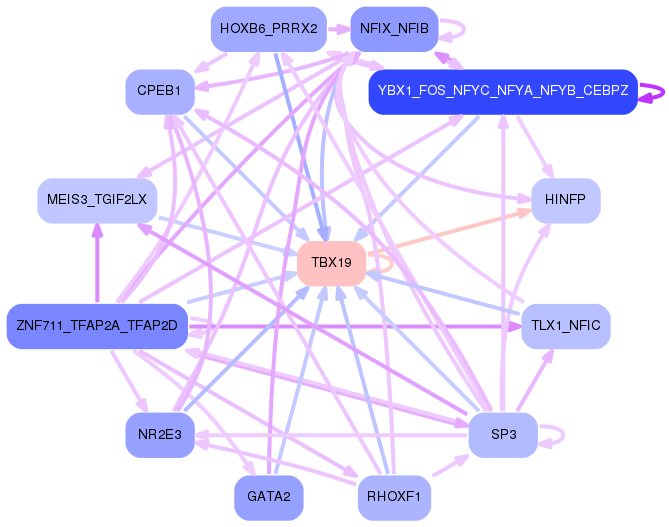
chr1_+_168280872
Show fit
|
0.02 |
ENST00000367821.8
|
TBX19
|
T-box transcription factor 19
|
|
chr17_-_64505357
Show fit
|
0.02 |
ENST00000583212.2
ENST00000578190.5
ENST00000579091.5
ENST00000583239.6
|
DDX5
|
DEAD-box helicase 5
|
|
chr2_-_213151590
Show fit
|
0.02 |
ENST00000374319.8
ENST00000457361.5
ENST00000451136.6
ENST00000434687.6
|
IKZF2
|
IKAROS family zinc finger 2
|
|
chr2_-_200889136
Show fit
|
0.02 |
ENST00000409361.5
|
PPIL3
|
peptidylprolyl isomerase like 3
|
|
chr11_+_30323077
Show fit
|
0.02 |
ENST00000282032.4
|
ARL14EP
|
ADP ribosylation factor like GTPase 14 effector protein
|
|
chr12_-_11062294
Show fit
|
0.02 |
ENST00000533467.1
|
TAS2R46
|
taste 2 receptor member 46
|
|
chr1_-_160646958
Show fit
|
0.02 |
ENST00000538290.2
|
SLAMF1
|
signaling lymphocytic activation molecule family member 1
|
|
chr1_-_100249815
Show fit
|
0.02 |
ENST00000370131.3
ENST00000681617.1
ENST00000681780.1
ENST00000370132.8
|
DBT
|
dihydrolipoamide branched chain transacylase E2
|
|
chr12_+_8123837
Show fit
|
0.02 |
ENST00000345999.9
ENST00000352620.9
ENST00000360500.5
|
CLEC4A
|
C-type lectin domain family 4 member A
|
|
chr1_-_160647287
Show fit
|
0.02 |
ENST00000235739.6
|
SLAMF1
|
signaling lymphocytic activation molecule family member 1
|
|
chr10_-_12195837
Show fit
|
0.02 |
ENST00000444732.1
ENST00000378940.7
ENST00000491614.6
|
NUDT5
|
nudix hydrolase 5
|
|
chr11_-_59668981
Show fit
|
0.02 |
ENST00000300146.10
|
PATL1
|
PAT1 homolog 1, processing body mRNA decay factor
|
|
chr12_-_10810168
Show fit
|
0.02 |
ENST00000240691.4
|
TAS2R9
|
taste 2 receptor member 9
|
|
chr19_-_58002761
Show fit
|
0.02 |
ENST00000552184.1
ENST00000546715.5
ENST00000547828.5
ENST00000547121.5
ENST00000551380.6
|
ZNF606
|
zinc finger protein 606
|
|
chr3_+_15601969
Show fit
|
0.02 |
ENST00000436193.5
ENST00000383778.5
|
BTD
|
biotinidase
|
|
chr5_+_141421064
Show fit
|
0.02 |
ENST00000518882.2
|
PCDHGA11
|
protocadherin gamma subfamily A, 11
|
|
chr4_+_26319636
Show fit
|
0.02 |
ENST00000342295.6
ENST00000506956.5
ENST00000512671.6
ENST00000345843.8
|
RBPJ
|
recombination signal binding protein for immunoglobulin kappa J region
|
|
chr18_-_21600645
Show fit
|
0.02 |
ENST00000269214.10
|
ESCO1
|
establishment of sister chromatid cohesion N-acetyltransferase 1
|
|
chr5_+_141370236
Show fit
|
0.02 |
ENST00000576222.2
ENST00000618934.1
|
PCDHGB3
|
protocadherin gamma subfamily B, 3
|
|
chr1_+_153990749
Show fit
|
0.02 |
ENST00000651669.1
|
RPS27
|
ribosomal protein S27
|
|
chr19_+_37346283
Show fit
|
0.02 |
ENST00000541583.6
|
ZNF875
|
zinc finger protein 875
|
|
chr1_+_100345018
Show fit
|
0.02 |
ENST00000635056.2
ENST00000647005.1
|
CDC14A
|
cell division cycle 14A
|
|
chr13_-_102759059
Show fit
|
0.02 |
ENST00000322527.4
|
CCDC168
|
coiled-coil domain containing 168
|
|
chr3_+_69936629
Show fit
|
0.02 |
ENST00000394348.2
ENST00000531774.1
|
MITF
|
melanocyte inducing transcription factor
|
|
chr14_+_20781139
Show fit
|
0.01 |
ENST00000304677.3
|
RNASE6
|
ribonuclease A family member k6
|
|
chrX_-_48356688
Show fit
|
0.01 |
ENST00000298396.7
ENST00000376893.7
|
SSX3
|
SSX family member 3
|
|
chr1_-_157598080
Show fit
|
0.01 |
ENST00000271532.2
|
FCRL4
|
Fc receptor like 4
|
|
chr17_-_6651427
Show fit
|
0.01 |
ENST00000574128.1
|
MED31
|
mediator complex subunit 31
|
|
chr7_+_149147422
Show fit
|
0.01 |
ENST00000475153.6
|
ZNF398
|
zinc finger protein 398
|
|
chrX_-_19970298
Show fit
|
0.01 |
ENST00000379687.7
ENST00000379682.8
|
BCLAF3
|
BCLAF1 and THRAP3 family member 3
|
|
chr12_+_6873561
Show fit
|
0.01 |
ENST00000433346.5
|
LRRC23
|
leucine rich repeat containing 23
|
|
chr7_-_150302980
Show fit
|
0.01 |
ENST00000252071.8
|
ACTR3C
|
actin related protein 3C
|
|
chr17_+_7219857
Show fit
|
0.01 |
ENST00000583312.5
ENST00000350303.9
ENST00000584103.5
ENST00000356839.10
ENST00000579886.2
|
ACADVL
|
acyl-CoA dehydrogenase very long chain
|
|
chr5_+_96876480
Show fit
|
0.01 |
ENST00000437043.8
ENST00000379904.8
|
ERAP2
|
endoplasmic reticulum aminopeptidase 2
|
|
chr14_+_23988914
Show fit
|
0.01 |
ENST00000335125.11
|
DHRS4L2
|
dehydrogenase/reductase 4 like 2
|
|
chr16_-_86555021
Show fit
|
0.01 |
ENST00000565482.1
ENST00000564364.5
ENST00000561989.5
ENST00000568037.5
ENST00000634347.1
ENST00000543303.6
ENST00000381214.9
ENST00000360900.11
ENST00000546093.5
ENST00000569000.5
ENST00000562994.5
ENST00000561522.1
|
MTHFSD
|
methenyltetrahydrofolate synthetase domain containing
|
|
chr19_-_57457140
Show fit
|
0.01 |
ENST00000321039.5
|
VN1R1
|
vomeronasal 1 receptor 1
|
|
chr1_+_205042960
Show fit
|
0.01 |
ENST00000638378.1
|
CNTN2
|
contactin 2
|
|
chr2_-_210476687
Show fit
|
0.01 |
ENST00000233714.8
ENST00000443314.5
ENST00000441020.7
ENST00000450366.7
ENST00000431941.6
|
LANCL1
|
LanC like 1
|
|
chr3_+_44338452
Show fit
|
0.01 |
ENST00000396078.7
|
TCAIM
|
T cell activation inhibitor, mitochondrial
|
|
chr6_-_38639898
Show fit
|
0.01 |
ENST00000481247.6
|
BTBD9
|
BTB domain containing 9
|
|
chr18_-_49487216
Show fit
|
0.01 |
ENST00000318240.8
ENST00000613385.4
|
C18orf32
|
chromosome 18 open reading frame 32
|
|
chr1_-_176207220
Show fit
|
0.01 |
ENST00000367669.8
|
COP1
|
COP1 E3 ubiquitin ligase
|
|
chr12_-_11022620
Show fit
|
0.01 |
ENST00000390673.2
|
TAS2R19
|
taste 2 receptor member 19
|
|
chr15_+_67542668
Show fit
|
0.01 |
ENST00000178640.10
|
MAP2K5
|
mitogen-activated protein kinase kinase 5
|
|
chr7_+_117611617
Show fit
|
0.01 |
ENST00000468795.1
|
CFTR
|
CF transmembrane conductance regulator
|
|
chr2_-_9423340
Show fit
|
0.01 |
ENST00000484735.5
ENST00000456913.6
|
ITGB1BP1
|
integrin subunit beta 1 binding protein 1
|
|
chr14_+_23988884
Show fit
|
0.01 |
ENST00000558753.5
ENST00000537912.5
|
DHRS4L2
|
dehydrogenase/reductase 4 like 2
|
|
chr13_-_96994350
Show fit
|
0.01 |
ENST00000298440.5
ENST00000543457.6
ENST00000541038.2
|
OXGR1
|
oxoglutarate receptor 1
|
|
chr6_+_22569554
Show fit
|
0.01 |
ENST00000510882.4
|
HDGFL1
|
HDGF like 1
|
|
chr2_-_9423190
Show fit
|
0.01 |
ENST00000497105.1
ENST00000360635.7
ENST00000359712.7
|
ITGB1BP1
|
integrin subunit beta 1 binding protein 1
|
|
chr5_-_160419059
Show fit
|
0.01 |
ENST00000297151.9
ENST00000519349.5
ENST00000520664.1
|
SLU7
|
SLU7 homolog, splicing factor
|
|
chr19_+_19528901
Show fit
|
0.01 |
ENST00000514277.6
|
YJEFN3
|
YjeF N-terminal domain containing 3
|
|
chr16_+_83971451
Show fit
|
0.01 |
ENST00000565691.5
|
NECAB2
|
N-terminal EF-hand calcium binding protein 2
|
|
chr20_-_462485
Show fit
|
0.01 |
ENST00000681414.1
ENST00000680050.1
ENST00000681129.1
ENST00000354200.5
ENST00000679895.1
ENST00000681551.1
ENST00000681539.1
|
TBC1D20
|
TBC1 domain family member 20
|
|
chr1_-_193105373
Show fit
|
0.01 |
ENST00000367439.8
|
GLRX2
|
glutaredoxin 2
|
|
chr2_-_9423444
Show fit
|
0.01 |
ENST00000488451.5
ENST00000238091.8
ENST00000355346.9
|
ITGB1BP1
|
integrin subunit beta 1 binding protein 1
|
|
chr20_-_5113032
Show fit
|
0.01 |
ENST00000379299.6
ENST00000379286.6
ENST00000379279.6
ENST00000379283.6
|
TMEM230
|
transmembrane protein 230
|
|
chr9_-_4666347
Show fit
|
0.01 |
ENST00000381890.9
ENST00000682582.1
|
SPATA6L
|
spermatogenesis associated 6 like
|
|
chr7_+_93906557
Show fit
|
0.01 |
ENST00000248572.10
ENST00000429473.1
ENST00000430875.1
ENST00000428834.1
|
GNGT1
|
G protein subunit gamma transducin 1
|
|
chr15_+_40351026
Show fit
|
0.01 |
ENST00000448599.2
|
PHGR1
|
proline, histidine and glycine rich 1
|
|
chr20_-_5113067
Show fit
|
0.01 |
ENST00000342308.10
ENST00000612323.4
ENST00000202834.11
|
TMEM230
|
transmembrane protein 230
|
|
chr7_+_152074292
Show fit
|
0.01 |
ENST00000434507.5
|
GALNT11
|
polypeptide N-acetylgalactosaminyltransferase 11
|
|
chr17_+_46511511
Show fit
|
0.01 |
ENST00000576629.5
|
LRRC37A2
|
leucine rich repeat containing 37 member A2
|
|
chr8_+_13566854
Show fit
|
0.01 |
ENST00000297324.5
|
C8orf48
|
chromosome 8 open reading frame 48
|
|
chr15_-_55289756
Show fit
|
0.01 |
ENST00000336787.6
|
RAB27A
|
RAB27A, member RAS oncogene family
|
|
chr17_+_38717424
Show fit
|
0.01 |
ENST00000615858.1
|
MLLT6
|
MLLT6, PHD finger containing
|
|
chr11_-_18939493
Show fit
|
0.01 |
ENST00000526914.1
|
MRGPRX1
|
MAS related GPR family member X1
|
|
chr6_+_122789049
Show fit
|
0.01 |
ENST00000539041.5
|
SMPDL3A
|
sphingomyelin phosphodiesterase acid like 3A
|
|
chrX_+_76173010
Show fit
|
0.01 |
ENST00000373357.3
ENST00000373358.8
|
PBDC1
|
polysaccharide biosynthesis domain containing 1
|
|
chr1_-_150697128
Show fit
|
0.01 |
ENST00000427665.1
ENST00000271732.8
|
GOLPH3L
|
golgi phosphoprotein 3 like
|
|
chr16_-_20327801
Show fit
|
0.01 |
ENST00000381360.9
|
GP2
|
glycoprotein 2
|
|
chr13_+_50909745
Show fit
|
0.01 |
ENST00000422660.6
ENST00000645188.1
ENST00000646731.1
ENST00000643774.1
ENST00000646960.1
ENST00000637648.2
ENST00000336617.8
|
RNASEH2B
|
ribonuclease H2 subunit B
|
|
chrX_+_120604199
Show fit
|
0.01 |
ENST00000371315.3
|
MCTS1
|
MCTS1 re-initiation and release factor
|
|
chr1_-_19979607
Show fit
|
0.01 |
ENST00000400520.8
ENST00000482011.2
ENST00000649436.1
|
PLA2G2A
|
phospholipase A2 group IIA
|
|
chr1_-_247172002
Show fit
|
0.01 |
ENST00000491356.5
ENST00000472531.5
ENST00000340684.10
ENST00000543802.3
|
ZNF124
|
zinc finger protein 124
|
|
chr7_-_72412333
Show fit
|
0.01 |
ENST00000395275.7
|
CALN1
|
calneuron 1
|
|
chr17_-_41047267
Show fit
|
0.01 |
ENST00000542137.1
ENST00000391419.3
|
KRTAP2-1
|
keratin associated protein 2-1
|
|
chr1_+_158930778
Show fit
|
0.01 |
ENST00000458222.5
|
PYHIN1
|
pyrin and HIN domain family member 1
|
|
chrX_+_130401962
Show fit
|
0.01 |
ENST00000305536.11
ENST00000370947.1
|
RBMX2
|
RNA binding motif protein X-linked 2
|
|
chr3_+_119186716
Show fit
|
0.01 |
ENST00000460625.1
|
UPK1B
|
uroplakin 1B
|
|
chr14_-_106875069
Show fit
|
0.00 |
ENST00000390639.2
|
IGHV7-81
|
immunoglobulin heavy variable 7-81 (non-functional)
|
|
chr16_-_55833085
Show fit
|
0.00 |
ENST00000360526.8
|
CES1
|
carboxylesterase 1
|
|
chr11_+_118527463
Show fit
|
0.00 |
ENST00000302783.10
|
TTC36
|
tetratricopeptide repeat domain 36
|
|
chr1_+_212285383
Show fit
|
0.00 |
ENST00000261461.7
|
PPP2R5A
|
protein phosphatase 2 regulatory subunit B'alpha
|
|
chr7_+_66114814
Show fit
|
0.00 |
ENST00000431089.6
ENST00000398684.6
ENST00000395326.8
ENST00000338592.5
|
CRCP
|
CGRP receptor component
|
|
chr5_+_161850597
Show fit
|
0.00 |
ENST00000634335.1
ENST00000635880.1
|
GABRA1
|
gamma-aminobutyric acid type A receptor subunit alpha1
|
|
chr3_-_101320558
Show fit
|
0.00 |
ENST00000193391.8
|
IMPG2
|
interphotoreceptor matrix proteoglycan 2
|
|
chr11_+_72227881
Show fit
|
0.00 |
ENST00000538751.5
ENST00000541756.5
|
INPPL1
|
inositol polyphosphate phosphatase like 1
|
|
chr3_-_47513677
Show fit
|
0.00 |
ENST00000296149.9
|
ELP6
|
elongator acetyltransferase complex subunit 6
|
|
chr6_-_10694533
Show fit
|
0.00 |
ENST00000460742.6
ENST00000379586.5
ENST00000259983.8
|
C6orf52
|
chromosome 6 open reading frame 52
|
|
chr5_-_100903214
Show fit
|
0.00 |
ENST00000451528.2
|
ST8SIA4
|
ST8 alpha-N-acetyl-neuraminide alpha-2,8-sialyltransferase 4
|
|
chr19_-_54313074
Show fit
|
0.00 |
ENST00000486742.2
ENST00000432233.8
|
LILRA5
|
leukocyte immunoglobulin like receptor A5
|
|
chr12_+_52069967
Show fit
|
0.00 |
ENST00000336854.9
ENST00000550604.1
ENST00000553049.5
ENST00000548915.1
|
ATG101
|
autophagy related 101
|
|
chr2_+_3575250
Show fit
|
0.00 |
ENST00000645674.2
|
RPS7
|
ribosomal protein S7
|
|
chr1_-_36440873
Show fit
|
0.00 |
ENST00000433045.6
|
OSCP1
|
organic solute carrier partner 1
|
|
chr5_-_150700910
Show fit
|
0.00 |
ENST00000521464.1
ENST00000518917.5
ENST00000447771.6
ENST00000199814.9
|
RBM22
|
RNA binding motif protein 22
|
|
chr3_+_35681352
Show fit
|
0.00 |
ENST00000436702.5
ENST00000438071.1
|
ARPP21
|
cAMP regulated phosphoprotein 21
|
|
chr3_+_132597260
Show fit
|
0.00 |
ENST00000249887.3
|
ACKR4
|
atypical chemokine receptor 4
|
|
chr1_-_154859841
Show fit
|
0.00 |
ENST00000361147.8
|
KCNN3
|
potassium calcium-activated channel subfamily N member 3
|
|
chr14_+_55271344
Show fit
|
0.00 |
ENST00000681400.1
ENST00000679934.1
ENST00000681904.1
ENST00000313833.5
|
FBXO34
|
F-box protein 34
|
|
chr19_-_344786
Show fit
|
0.00 |
ENST00000264819.7
|
MIER2
|
MIER family member 2
|
|
chr2_+_72916183
Show fit
|
0.00 |
ENST00000394111.6
|
EMX1
|
empty spiracles homeobox 1
|
|
chrX_-_120575783
Show fit
|
0.00 |
ENST00000680673.1
|
CUL4B
|
cullin 4B
|
|
chr5_-_100903252
Show fit
|
0.00 |
ENST00000231461.10
|
ST8SIA4
|
ST8 alpha-N-acetyl-neuraminide alpha-2,8-sialyltransferase 4
|
