Project
Epithelial-Mesenchymal Transition, human (Scheel, 2011)
Navigation
Downloads
Results for UCACAUU
Z-value: 0.45
Motif logo

miRNA associated with seed UCACAUU
| Name | miRBASE accession |
|---|---|
|
hsa-miR-130a-5p
|
MIMAT0004593 |
|
hsa-miR-23a-3p
|
MIMAT0000078 |
|
hsa-miR-23b-3p
|
MIMAT0000418 |
|
hsa-miR-23c
|
MIMAT0018000 |
Activity profile of UCACAUU motif
Sorted Z-values of UCACAUU motif
| Promoter | Log-likelihood | Transcript | Gene | Gene Info |
|---|---|---|---|---|
| chr15_+_32717994 | 0.65 |
ENST00000560677.5
ENST00000560830.1 ENST00000651154.1 |
GREM1
|
gremlin 1, DAN family BMP antagonist |
| chr5_+_83471736 | 0.43 |
ENST00000265077.8
|
VCAN
|
versican |
| chr5_-_137499293 | 0.40 |
ENST00000510689.5
ENST00000394945.6 |
SPOCK1
|
SPARC (osteonectin), cwcv and kazal like domains proteoglycan 1 |
| chr8_-_121641424 | 0.38 |
ENST00000303924.5
|
HAS2
|
hyaluronan synthase 2 |
| chr11_+_114059702 | 0.37 |
ENST00000335953.9
ENST00000684612.1 ENST00000682810.1 ENST00000544220.1 |
ZBTB16
|
zinc finger and BTB domain containing 16 |
| chr1_-_91886144 | 0.37 |
ENST00000212355.9
|
TGFBR3
|
transforming growth factor beta receptor 3 |
| chr5_+_40679907 | 0.34 |
ENST00000302472.4
|
PTGER4
|
prostaglandin E receptor 4 |
| chr4_+_144646145 | 0.29 |
ENST00000296575.8
ENST00000434550.2 |
HHIP
|
hedgehog interacting protein |
| chr8_-_59119121 | 0.24 |
ENST00000361421.2
|
TOX
|
thymocyte selection associated high mobility group box |
| chr6_+_151239951 | 0.24 |
ENST00000402676.7
|
AKAP12
|
A-kinase anchoring protein 12 |
| chr1_+_159171607 | 0.23 |
ENST00000368124.8
ENST00000368125.9 ENST00000416746.1 |
CADM3
|
cell adhesion molecule 3 |
| chr5_-_157575767 | 0.21 |
ENST00000257527.9
|
ADAM19
|
ADAM metallopeptidase domain 19 |
| chr5_-_41510554 | 0.20 |
ENST00000377801.8
|
PLCXD3
|
phosphatidylinositol specific phospholipase C X domain containing 3 |
| chr4_+_122826679 | 0.19 |
ENST00000264498.8
|
FGF2
|
fibroblast growth factor 2 |
| chrX_+_16946650 | 0.18 |
ENST00000357277.8
|
REPS2
|
RALBP1 associated Eps domain containing 2 |
| chrX_-_19122559 | 0.18 |
ENST00000357544.7
ENST00000360279.8 ENST00000379873.6 ENST00000379876.5 ENST00000379878.7 ENST00000354791.7 |
ADGRG2
|
adhesion G protein-coupled receptor G2 |
| chr1_+_78490966 | 0.17 |
ENST00000370757.8
ENST00000370756.3 |
PTGFR
|
prostaglandin F receptor |
| chr1_-_72282457 | 0.17 |
ENST00000357731.10
|
NEGR1
|
neuronal growth regulator 1 |
| chr9_-_111038037 | 0.16 |
ENST00000374431.7
|
LPAR1
|
lysophosphatidic acid receptor 1 |
| chr12_+_32502114 | 0.16 |
ENST00000682739.1
ENST00000427716.7 ENST00000583694.2 |
FGD4
|
FYVE, RhoGEF and PH domain containing 4 |
| chr5_+_119071358 | 0.15 |
ENST00000311085.8
|
DMXL1
|
Dmx like 1 |
| chr5_+_134874345 | 0.15 |
ENST00000358387.9
ENST00000506916.1 |
TXNDC15
|
thioredoxin domain containing 15 |
| chr2_-_199457931 | 0.15 |
ENST00000417098.6
|
SATB2
|
SATB homeobox 2 |
| chr9_-_71768386 | 0.15 |
ENST00000377066.9
ENST00000377044.9 |
CEMIP2
|
cell migration inducing hyaluronidase 2 |
| chrX_+_9786420 | 0.15 |
ENST00000380913.8
|
SHROOM2
|
shroom family member 2 |
| chr4_+_15002443 | 0.15 |
ENST00000538197.7
|
CPEB2
|
cytoplasmic polyadenylation element binding protein 2 |
| chr5_+_72107453 | 0.14 |
ENST00000296755.12
ENST00000511641.2 |
MAP1B
|
microtubule associated protein 1B |
| chr8_+_17027230 | 0.14 |
ENST00000318063.10
|
MICU3
|
mitochondrial calcium uptake family member 3 |
| chr5_-_128538230 | 0.14 |
ENST00000262464.9
|
FBN2
|
fibrillin 2 |
| chr11_-_96343170 | 0.14 |
ENST00000524717.6
|
MAML2
|
mastermind like transcriptional coactivator 2 |
| chr9_-_136050502 | 0.13 |
ENST00000371753.5
|
NACC2
|
NACC family member 2 |
| chr10_+_1049476 | 0.13 |
ENST00000358220.5
|
WDR37
|
WD repeat domain 37 |
| chr16_-_73048104 | 0.13 |
ENST00000268489.10
|
ZFHX3
|
zinc finger homeobox 3 |
| chr2_+_148021001 | 0.12 |
ENST00000407073.5
|
MBD5
|
methyl-CpG binding domain protein 5 |
| chrX_-_84502442 | 0.12 |
ENST00000297977.9
ENST00000506585.6 ENST00000373177.3 ENST00000449553.2 |
HDX
|
highly divergent homeobox |
| chr15_-_48645701 | 0.12 |
ENST00000316623.10
ENST00000560355.1 |
FBN1
|
fibrillin 1 |
| chr8_+_78516329 | 0.12 |
ENST00000396418.7
ENST00000352966.9 |
PKIA
|
cAMP-dependent protein kinase inhibitor alpha |
| chr4_-_141133436 | 0.11 |
ENST00000306799.7
ENST00000515673.7 |
RNF150
|
ring finger protein 150 |
| chr20_+_41028814 | 0.11 |
ENST00000361337.3
|
TOP1
|
DNA topoisomerase I |
| chr5_-_74640719 | 0.11 |
ENST00000302351.9
ENST00000509127.2 |
ENC1
|
ectodermal-neural cortex 1 |
| chr10_+_102226293 | 0.11 |
ENST00000370005.4
|
ELOVL3
|
ELOVL fatty acid elongase 3 |
| chr9_+_4490388 | 0.11 |
ENST00000262352.8
|
SLC1A1
|
solute carrier family 1 member 1 |
| chr20_-_49482645 | 0.10 |
ENST00000371741.6
|
KCNB1
|
potassium voltage-gated channel subfamily B member 1 |
| chr3_-_66500973 | 0.10 |
ENST00000383703.3
ENST00000273261.8 |
LRIG1
|
leucine rich repeats and immunoglobulin like domains 1 |
| chr2_-_100417608 | 0.10 |
ENST00000264249.8
|
CHST10
|
carbohydrate sulfotransferase 10 |
| chr1_-_46132616 | 0.10 |
ENST00000423209.5
ENST00000262741.10 |
PIK3R3
|
phosphoinositide-3-kinase regulatory subunit 3 |
| chr2_-_36966503 | 0.10 |
ENST00000263918.9
|
STRN
|
striatin |
| chr11_+_134069060 | 0.10 |
ENST00000534549.5
ENST00000441717.3 ENST00000299106.9 |
JAM3
|
junctional adhesion molecule 3 |
| chr10_+_71964373 | 0.09 |
ENST00000373115.5
|
CHST3
|
carbohydrate sulfotransferase 3 |
| chr5_+_150508110 | 0.09 |
ENST00000261797.7
|
NDST1
|
N-deacetylase and N-sulfotransferase 1 |
| chrX_-_155264471 | 0.09 |
ENST00000369454.4
|
RAB39B
|
RAB39B, member RAS oncogene family |
| chr4_-_128287785 | 0.09 |
ENST00000296425.10
|
PGRMC2
|
progesterone receptor membrane component 2 |
| chr2_-_178478541 | 0.09 |
ENST00000424785.7
|
FKBP7
|
FKBP prolyl isomerase 7 |
| chr1_+_65264694 | 0.08 |
ENST00000263441.11
ENST00000395325.7 |
DNAJC6
|
DnaJ heat shock protein family (Hsp40) member C6 |
| chr8_+_22599586 | 0.08 |
ENST00000289989.10
ENST00000409586.7 ENST00000614574.4 |
C8orf58
|
chromosome 8 open reading frame 58 |
| chr2_-_86337654 | 0.08 |
ENST00000165698.9
|
REEP1
|
receptor accessory protein 1 |
| chr4_-_124712721 | 0.08 |
ENST00000504087.6
ENST00000515641.1 |
ANKRD50
|
ankyrin repeat domain 50 |
| chr21_+_45981736 | 0.08 |
ENST00000361866.8
|
COL6A1
|
collagen type VI alpha 1 chain |
| chr8_-_90646074 | 0.08 |
ENST00000458549.7
|
TMEM64
|
transmembrane protein 64 |
| chr6_+_11537738 | 0.08 |
ENST00000379426.2
|
TMEM170B
|
transmembrane protein 170B |
| chr15_-_37098281 | 0.08 |
ENST00000559085.5
ENST00000397624.7 |
MEIS2
|
Meis homeobox 2 |
| chr4_+_159267737 | 0.08 |
ENST00000264431.8
|
RAPGEF2
|
Rap guanine nucleotide exchange factor 2 |
| chr5_-_132490750 | 0.08 |
ENST00000437654.6
ENST00000245414.9 ENST00000680139.1 ENST00000680352.1 ENST00000679440.1 ENST00000680903.1 |
IRF1
|
interferon regulatory factor 1 |
| chr5_+_173888335 | 0.08 |
ENST00000265085.10
|
CPEB4
|
cytoplasmic polyadenylation element binding protein 4 |
| chr1_-_83999097 | 0.08 |
ENST00000260505.13
ENST00000610996.1 |
TTLL7
|
tubulin tyrosine ligase like 7 |
| chrX_+_74421450 | 0.08 |
ENST00000587091.6
|
SLC16A2
|
solute carrier family 16 member 2 |
| chr8_-_70403786 | 0.08 |
ENST00000452400.7
|
NCOA2
|
nuclear receptor coactivator 2 |
| chr16_-_17470953 | 0.07 |
ENST00000261381.7
|
XYLT1
|
xylosyltransferase 1 |
| chr16_+_24729641 | 0.07 |
ENST00000395799.8
|
TNRC6A
|
trinucleotide repeat containing adaptor 6A |
| chr20_+_5126988 | 0.07 |
ENST00000460006.6
|
CDS2
|
CDP-diacylglycerol synthase 2 |
| chr2_-_46941760 | 0.07 |
ENST00000444761.6
ENST00000409147.1 |
MCFD2
|
multiple coagulation factor deficiency 2, ER cargo receptor complex subunit |
| chr2_+_151357583 | 0.07 |
ENST00000243347.5
|
TNFAIP6
|
TNF alpha induced protein 6 |
| chr7_+_65873068 | 0.07 |
ENST00000360768.5
|
VKORC1L1
|
vitamin K epoxide reductase complex subunit 1 like 1 |
| chr4_-_88697810 | 0.07 |
ENST00000323061.7
|
NAP1L5
|
nucleosome assembly protein 1 like 5 |
| chr7_-_98252117 | 0.07 |
ENST00000420697.1
ENST00000415086.5 ENST00000447648.7 |
TECPR1
|
tectonin beta-propeller repeat containing 1 |
| chr2_+_24491860 | 0.07 |
ENST00000406961.5
ENST00000405141.5 |
NCOA1
|
nuclear receptor coactivator 1 |
| chr19_-_46471484 | 0.07 |
ENST00000313683.15
ENST00000602246.1 |
PNMA8A
|
PNMA family member 8A |
| chr1_-_23868279 | 0.07 |
ENST00000374479.4
|
FUCA1
|
alpha-L-fucosidase 1 |
| chr1_+_154405193 | 0.07 |
ENST00000622330.4
ENST00000344086.8 |
IL6R
|
interleukin 6 receptor |
| chr21_+_42974510 | 0.07 |
ENST00000432907.6
ENST00000291547.10 |
PKNOX1
|
PBX/knotted 1 homeobox 1 |
| chr7_-_93890744 | 0.07 |
ENST00000650573.1
ENST00000222543.11 ENST00000649913.1 ENST00000647793.1 |
TFPI2
|
tissue factor pathway inhibitor 2 |
| chr2_-_40452046 | 0.06 |
ENST00000406785.6
|
SLC8A1
|
solute carrier family 8 member A1 |
| chr4_+_123399488 | 0.06 |
ENST00000394339.2
|
SPRY1
|
sprouty RTK signaling antagonist 1 |
| chr2_-_157628852 | 0.06 |
ENST00000243349.13
|
ACVR1C
|
activin A receptor type 1C |
| chr6_-_24719146 | 0.06 |
ENST00000378119.9
|
C6orf62
|
chromosome 6 open reading frame 62 |
| chr1_+_218345326 | 0.06 |
ENST00000366930.9
|
TGFB2
|
transforming growth factor beta 2 |
| chr3_+_155870623 | 0.06 |
ENST00000295920.7
ENST00000496455.7 |
GMPS
|
guanine monophosphate synthase |
| chr17_+_62627628 | 0.06 |
ENST00000303375.10
|
MRC2
|
mannose receptor C type 2 |
| chr10_+_88990621 | 0.06 |
ENST00000352159.8
|
FAS
|
Fas cell surface death receptor |
| chr10_+_91923762 | 0.06 |
ENST00000265990.11
|
BTAF1
|
B-TFIID TATA-box binding protein associated factor 1 |
| chr11_+_34051722 | 0.06 |
ENST00000341394.9
ENST00000389645.7 |
CAPRIN1
|
cell cycle associated protein 1 |
| chr3_-_52679713 | 0.06 |
ENST00000296302.11
ENST00000356770.8 ENST00000337303.8 ENST00000409057.5 ENST00000410007.5 ENST00000409114.7 ENST00000409767.5 ENST00000423351.5 |
PBRM1
|
polybromo 1 |
| chr16_-_19884828 | 0.06 |
ENST00000300571.7
ENST00000570142.5 ENST00000562469.5 |
GPRC5B
|
G protein-coupled receptor class C group 5 member B |
| chr18_-_72867945 | 0.06 |
ENST00000327305.11
|
NETO1
|
neuropilin and tolloid like 1 |
| chr15_-_61229297 | 0.06 |
ENST00000335670.11
|
RORA
|
RAR related orphan receptor A |
| chr16_+_2537997 | 0.06 |
ENST00000441549.7
ENST00000268673.11 ENST00000342085.9 ENST00000389224.7 |
PDPK1
|
3-phosphoinositide dependent protein kinase 1 |
| chr5_+_32711313 | 0.06 |
ENST00000265074.13
|
NPR3
|
natriuretic peptide receptor 3 |
| chr1_-_1390943 | 0.06 |
ENST00000408952.8
|
CCNL2
|
cyclin L2 |
| chr5_-_159099909 | 0.06 |
ENST00000313708.11
|
EBF1
|
EBF transcription factor 1 |
| chr12_-_103841210 | 0.06 |
ENST00000392876.8
|
NT5DC3
|
5'-nucleotidase domain containing 3 |
| chr7_+_116672187 | 0.06 |
ENST00000318493.11
ENST00000397752.8 |
MET
|
MET proto-oncogene, receptor tyrosine kinase |
| chr5_+_32710630 | 0.06 |
ENST00000326958.5
|
NPR3
|
natriuretic peptide receptor 3 |
| chr2_-_160062589 | 0.05 |
ENST00000392771.1
ENST00000283243.13 |
PLA2R1
|
phospholipase A2 receptor 1 |
| chr2_-_45009401 | 0.05 |
ENST00000303077.7
|
SIX2
|
SIX homeobox 2 |
| chr4_+_153466324 | 0.05 |
ENST00000409663.7
ENST00000409959.8 |
TMEM131L
|
transmembrane 131 like |
| chr17_-_35433145 | 0.05 |
ENST00000445092.5
ENST00000394562.5 ENST00000447040.6 |
SLFN12
|
schlafen family member 12 |
| chr17_-_64662290 | 0.05 |
ENST00000262435.14
|
SMURF2
|
SMAD specific E3 ubiquitin protein ligase 2 |
| chr15_-_55588937 | 0.05 |
ENST00000302000.10
|
PYGO1
|
pygopus family PHD finger 1 |
| chr18_+_70288991 | 0.05 |
ENST00000397942.4
|
SOCS6
|
suppressor of cytokine signaling 6 |
| chr12_-_10613585 | 0.05 |
ENST00000539554.5
ENST00000625272.1 ENST00000320756.7 |
MAGOHB
|
mago homolog B, exon junction complex subunit |
| chr5_+_128083757 | 0.05 |
ENST00000262461.7
ENST00000628403.2 ENST00000343225.4 |
SLC12A2
|
solute carrier family 12 member 2 |
| chr7_+_90403386 | 0.05 |
ENST00000287916.8
ENST00000394604.5 ENST00000496677.6 ENST00000394605.2 ENST00000480135.1 |
CLDN12
ENSG00000273299.1
|
claudin 12 novel transcript |
| chr6_-_116254063 | 0.05 |
ENST00000420283.3
|
TSPYL4
|
TSPY like 4 |
| chr2_+_112055201 | 0.05 |
ENST00000283206.9
|
TMEM87B
|
transmembrane protein 87B |
| chr17_+_59707636 | 0.05 |
ENST00000262291.9
ENST00000587945.1 ENST00000589823.6 ENST00000592106.5 ENST00000591315.5 |
VMP1
|
vacuole membrane protein 1 |
| chr16_-_49281819 | 0.05 |
ENST00000219197.11
|
CBLN1
|
cerebellin 1 precursor |
| chr15_+_51751587 | 0.05 |
ENST00000539962.6
ENST00000249700.9 |
TMOD2
|
tropomodulin 2 |
| chr9_+_136327526 | 0.05 |
ENST00000440944.6
|
GPSM1
|
G protein signaling modulator 1 |
| chr2_+_219178266 | 0.05 |
ENST00000430297.7
|
RETREG2
|
reticulophagy regulator family member 2 |
| chr2_+_169827432 | 0.05 |
ENST00000272793.11
|
UBR3
|
ubiquitin protein ligase E3 component n-recognin 3 |
| chr1_+_78004930 | 0.05 |
ENST00000370763.6
|
DNAJB4
|
DnaJ heat shock protein family (Hsp40) member B4 |
| chr6_+_87155537 | 0.05 |
ENST00000369577.8
ENST00000518845.1 ENST00000339907.8 ENST00000496806.2 |
ZNF292
|
zinc finger protein 292 |
| chr10_+_91798398 | 0.05 |
ENST00000371627.5
|
TNKS2
|
tankyrase 2 |
| chr16_+_67562514 | 0.04 |
ENST00000264010.10
ENST00000401394.6 ENST00000646771.1 |
CTCF
|
CCCTC-binding factor |
| chr19_-_31349408 | 0.04 |
ENST00000240587.5
|
TSHZ3
|
teashirt zinc finger homeobox 3 |
| chr11_-_66347560 | 0.04 |
ENST00000311181.5
|
B4GAT1
|
beta-1,4-glucuronyltransferase 1 |
| chr8_-_81112055 | 0.04 |
ENST00000220597.4
|
PAG1
|
phosphoprotein membrane anchor with glycosphingolipid microdomains 1 |
| chr6_-_136792466 | 0.04 |
ENST00000359015.5
|
MAP3K5
|
mitogen-activated protein kinase kinase kinase 5 |
| chr21_+_38256698 | 0.04 |
ENST00000613499.4
ENST00000612702.4 ENST00000398925.5 ENST00000398928.5 ENST00000328656.8 ENST00000443341.5 |
KCNJ15
|
potassium inwardly rectifying channel subfamily J member 15 |
| chr8_+_125430333 | 0.04 |
ENST00000311922.4
|
TRIB1
|
tribbles pseudokinase 1 |
| chr7_-_139777986 | 0.04 |
ENST00000406875.8
|
HIPK2
|
homeodomain interacting protein kinase 2 |
| chr11_+_110093372 | 0.04 |
ENST00000278590.8
|
ZC3H12C
|
zinc finger CCCH-type containing 12C |
| chr1_-_31919368 | 0.04 |
ENST00000457805.6
ENST00000602725.5 ENST00000679970.1 |
PTP4A2
ENSG00000288678.1
|
protein tyrosine phosphatase 4A2 novel protein |
| chr1_-_20486197 | 0.04 |
ENST00000375078.4
|
CAMK2N1
|
calcium/calmodulin dependent protein kinase II inhibitor 1 |
| chr1_-_211134135 | 0.04 |
ENST00000638983.1
ENST00000271751.10 ENST00000639952.1 |
ENSG00000284299.1
KCNH1
|
novel protein potassium voltage-gated channel subfamily H member 1 |
| chr9_+_88388356 | 0.04 |
ENST00000375859.4
|
SPIN1
|
spindlin 1 |
| chr1_+_117606040 | 0.04 |
ENST00000369448.4
|
TENT5C
|
terminal nucleotidyltransferase 5C |
| chr1_+_26472405 | 0.04 |
ENST00000361427.6
|
HMGN2
|
high mobility group nucleosomal binding domain 2 |
| chr8_-_123541197 | 0.04 |
ENST00000517956.5
ENST00000443022.2 |
FBXO32
|
F-box protein 32 |
| chr10_-_97185758 | 0.04 |
ENST00000371070.8
|
SLIT1
|
slit guidance ligand 1 |
| chr2_+_199911285 | 0.04 |
ENST00000319974.6
|
C2orf69
|
chromosome 2 open reading frame 69 |
| chr8_+_27311471 | 0.04 |
ENST00000397501.5
|
PTK2B
|
protein tyrosine kinase 2 beta |
| chr20_+_45363114 | 0.04 |
ENST00000426004.5
ENST00000243918.10 |
SYS1
|
SYS1 golgi trafficking protein |
| chr11_+_32893246 | 0.04 |
ENST00000399302.7
ENST00000527250.5 |
QSER1
|
glutamine and serine rich 1 |
| chr5_+_140401808 | 0.04 |
ENST00000616482.4
ENST00000297183.10 ENST00000360839.7 ENST00000421134.5 ENST00000394723.7 ENST00000511151.5 |
ANKHD1
|
ankyrin repeat and KH domain containing 1 |
| chr1_-_112619108 | 0.04 |
ENST00000358039.9
ENST00000360743.8 ENST00000490067.5 ENST00000343210.11 ENST00000369666.5 |
ST7L
|
suppression of tumorigenicity 7 like |
| chr3_-_71785167 | 0.04 |
ENST00000353065.7
|
PROK2
|
prokineticin 2 |
| chr8_-_93741001 | 0.04 |
ENST00000518597.2
ENST00000520560.6 ENST00000399300.7 |
RBM12B
|
RNA binding motif protein 12B |
| chr10_-_100519829 | 0.04 |
ENST00000370345.8
|
SEC31B
|
SEC31 homolog B, COPII coat complex component |
| chr10_+_68721207 | 0.04 |
ENST00000538031.5
ENST00000543719.5 ENST00000539539.5 ENST00000265872.11 ENST00000543225.5 ENST00000536012.5 ENST00000494903.2 |
CCAR1
|
cell division cycle and apoptosis regulator 1 |
| chr19_-_5622768 | 0.04 |
ENST00000252542.9
|
SAFB2
|
scaffold attachment factor B2 |
| chr13_+_43023577 | 0.04 |
ENST00000379221.4
|
DNAJC15
|
DnaJ heat shock protein family (Hsp40) member C15 |
| chr17_-_35487831 | 0.04 |
ENST00000260908.12
|
ENSG00000205045.11
|
schlafen family member 12 like |
| chr17_+_47531052 | 0.04 |
ENST00000532729.6
ENST00000322157.9 |
NPEPPS
|
aminopeptidase puromycin sensitive |
| chr3_+_141051339 | 0.04 |
ENST00000310546.3
|
SPSB4
|
splA/ryanodine receptor domain and SOCS box containing 4 |
| chr9_+_97501622 | 0.03 |
ENST00000259365.9
|
TMOD1
|
tropomodulin 1 |
| chr11_+_94543894 | 0.03 |
ENST00000358752.4
|
FUT4
|
fucosyltransferase 4 |
| chrX_+_118974608 | 0.03 |
ENST00000304778.11
ENST00000371628.8 |
LONRF3
|
LON peptidase N-terminal domain and ring finger 3 |
| chr10_+_43138435 | 0.03 |
ENST00000374466.4
|
CSGALNACT2
|
chondroitin sulfate N-acetylgalactosaminyltransferase 2 |
| chr8_-_26513865 | 0.03 |
ENST00000522362.7
|
PNMA2
|
PNMA family member 2 |
| chr2_-_163735989 | 0.03 |
ENST00000333129.4
ENST00000409634.5 |
FIGN
|
fidgetin, microtubule severing factor |
| chr12_+_96194365 | 0.03 |
ENST00000228741.8
ENST00000547249.1 |
ELK3
|
ETS transcription factor ELK3 |
| chr1_-_27490045 | 0.03 |
ENST00000536657.1
|
WASF2
|
WASP family member 2 |
| chr9_-_16870662 | 0.03 |
ENST00000380672.9
|
BNC2
|
basonuclin 2 |
| chr12_+_65824475 | 0.03 |
ENST00000403681.7
|
HMGA2
|
high mobility group AT-hook 2 |
| chr17_-_35089212 | 0.03 |
ENST00000584655.5
ENST00000447669.6 ENST00000315249.11 |
RFFL
|
ring finger and FYVE like domain containing E3 ubiquitin protein ligase |
| chr16_-_4847265 | 0.03 |
ENST00000591451.5
ENST00000436648.9 ENST00000321919.14 ENST00000588297.5 |
GLYR1
|
glyoxylate reductase 1 homolog |
| chr12_+_22625075 | 0.03 |
ENST00000671733.1
ENST00000335148.8 ENST00000672951.1 ENST00000266517.9 |
ETNK1
|
ethanolamine kinase 1 |
| chr5_+_144205250 | 0.03 |
ENST00000507359.3
|
KCTD16
|
potassium channel tetramerization domain containing 16 |
| chr1_-_93180261 | 0.03 |
ENST00000370280.1
ENST00000479918.5 |
TMED5
|
transmembrane p24 trafficking protein 5 |
| chr5_+_72816643 | 0.03 |
ENST00000337273.10
ENST00000523768.5 |
TNPO1
|
transportin 1 |
| chr8_+_11284789 | 0.03 |
ENST00000221086.8
|
MTMR9
|
myotubularin related protein 9 |
| chr5_+_65926556 | 0.03 |
ENST00000380943.6
ENST00000416865.6 ENST00000380935.5 ENST00000284037.10 |
ERBIN
|
erbb2 interacting protein |
| chr12_-_42144823 | 0.03 |
ENST00000398675.8
|
GXYLT1
|
glucoside xylosyltransferase 1 |
| chr15_-_55917129 | 0.03 |
ENST00000338963.6
ENST00000508342.5 |
NEDD4
|
NEDD4 E3 ubiquitin protein ligase |
| chr7_+_118184156 | 0.03 |
ENST00000422760.1
ENST00000249299.7 ENST00000411938.1 |
LSM8
|
LSM8 homolog, U6 small nuclear RNA associated |
| chr5_-_178627001 | 0.03 |
ENST00000611575.4
ENST00000520957.1 ENST00000316308.9 ENST00000611733.4 |
CLK4
|
CDC like kinase 4 |
| chr22_+_40177917 | 0.03 |
ENST00000454349.7
ENST00000335727.13 |
TNRC6B
|
trinucleotide repeat containing adaptor 6B |
| chr1_+_198156984 | 0.03 |
ENST00000442588.5
ENST00000538004.5 ENST00000367385.9 ENST00000367383.5 |
NEK7
|
NIMA related kinase 7 |
| chr17_+_29390326 | 0.03 |
ENST00000261716.8
|
TAOK1
|
TAO kinase 1 |
| chr14_-_74019255 | 0.03 |
ENST00000334696.11
ENST00000556242.5 |
ENTPD5
|
ectonucleoside triphosphate diphosphohydrolase 5 (inactive) |
| chr2_-_70248598 | 0.03 |
ENST00000445587.5
ENST00000433529.7 ENST00000415783.6 |
TIA1
|
TIA1 cytotoxic granule associated RNA binding protein |
| chr2_-_1744442 | 0.03 |
ENST00000433670.5
ENST00000425171.1 ENST00000252804.9 |
PXDN
|
peroxidasin |
| chr9_-_132354948 | 0.03 |
ENST00000224140.6
|
SETX
|
senataxin |
| chr15_-_70763539 | 0.03 |
ENST00000322954.11
|
UACA
|
uveal autoantigen with coiled-coil domains and ankyrin repeats |
| chr1_+_179954740 | 0.03 |
ENST00000491495.2
ENST00000367607.8 |
CEP350
|
centrosomal protein 350 |
| chr1_+_112396200 | 0.03 |
ENST00000271277.11
|
CTTNBP2NL
|
CTTNBP2 N-terminal like |
| chr13_-_29595670 | 0.03 |
ENST00000380752.10
|
SLC7A1
|
solute carrier family 7 member 1 |
| chr7_-_120858066 | 0.03 |
ENST00000222747.8
|
TSPAN12
|
tetraspanin 12 |
| chr2_+_43637247 | 0.03 |
ENST00000282406.9
|
PLEKHH2
|
pleckstrin homology, MyTH4 and FERM domain containing H2 |
| chr9_+_32384603 | 0.03 |
ENST00000541043.5
ENST00000379923.5 ENST00000309951.8 |
ACO1
|
aconitase 1 |
| chr10_+_86756580 | 0.03 |
ENST00000372037.8
|
BMPR1A
|
bone morphogenetic protein receptor type 1A |
| chr11_+_74949241 | 0.03 |
ENST00000610881.4
ENST00000530257.5 ENST00000526361.1 ENST00000532972.5 ENST00000263672.11 |
SPCS2
|
signal peptidase complex subunit 2 |
| chr20_+_31514410 | 0.03 |
ENST00000335574.10
ENST00000340852.9 ENST00000398174.9 ENST00000466766.2 ENST00000498035.5 ENST00000344042.5 |
HM13
|
histocompatibility minor 13 |
| chrX_+_46573757 | 0.03 |
ENST00000276055.4
|
CHST7
|
carbohydrate sulfotransferase 7 |
| chr2_-_10812706 | 0.03 |
ENST00000272227.8
|
PDIA6
|
protein disulfide isomerase family A member 6 |
| chr3_+_33114007 | 0.03 |
ENST00000320954.11
|
CRTAP
|
cartilage associated protein |
| chr3_+_62319037 | 0.03 |
ENST00000494481.5
|
C3orf14
|
chromosome 3 open reading frame 14 |
| chr20_+_3471003 | 0.03 |
ENST00000262919.10
ENST00000446916.2 |
ATRN
|
attractin |
| chr1_-_165445088 | 0.03 |
ENST00000359842.10
|
RXRG
|
retinoid X receptor gamma |
Network of associatons between targets according to the STRING database.

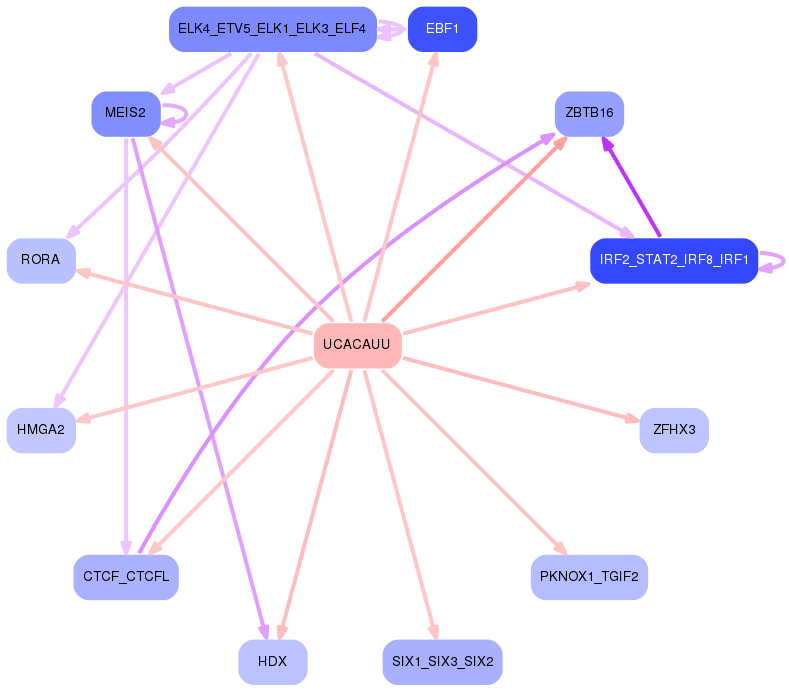
First level regulatory network of UCACAUU
Gene Ontology Analysis
Gene overrepresentation in biological process category:
| Log-likelihood per target | Total log-likelihood | Term | Description |
|---|---|---|---|
| 0.2 | 0.6 | GO:1900155 | regulation of bone trabecula formation(GO:1900154) negative regulation of bone trabecula formation(GO:1900155) |
| 0.1 | 0.3 | GO:2000417 | negative regulation of eosinophil migration(GO:2000417) |
| 0.1 | 0.4 | GO:0046379 | extracellular polysaccharide biosynthetic process(GO:0045226) extracellular polysaccharide metabolic process(GO:0046379) |
| 0.1 | 0.4 | GO:0034699 | transforming growth factor beta receptor complex assembly(GO:0007181) response to luteinizing hormone(GO:0034699) |
| 0.1 | 0.4 | GO:0051138 | positive regulation of NK T cell differentiation(GO:0051138) |
| 0.0 | 0.1 | GO:1904017 | cellular response to Thyroglobulin triiodothyronine(GO:1904017) |
| 0.0 | 0.1 | GO:1900248 | cytoplasmic translational elongation(GO:0002182) regulation of cytoplasmic translational elongation(GO:1900247) negative regulation of cytoplasmic translational elongation(GO:1900248) |
| 0.0 | 0.2 | GO:1904566 | response to 1-oleoyl-sn-glycerol 3-phosphate(GO:1904565) cellular response to 1-oleoyl-sn-glycerol 3-phosphate(GO:1904566) |
| 0.0 | 0.3 | GO:0035583 | sequestering of TGFbeta in extracellular matrix(GO:0035583) |
| 0.0 | 0.0 | GO:0048372 | lateral mesodermal cell fate commitment(GO:0048372) lateral mesodermal cell fate specification(GO:0048377) regulation of lateral mesodermal cell fate specification(GO:0048378) |
| 0.0 | 0.2 | GO:2000546 | positive regulation of cell chemotaxis to fibroblast growth factor(GO:1904849) positive regulation of endothelial cell chemotaxis to fibroblast growth factor(GO:2000546) |
| 0.0 | 0.2 | GO:1900454 | positive regulation of long term synaptic depression(GO:1900454) |
| 0.0 | 0.1 | GO:0032474 | otolith morphogenesis(GO:0032474) |
| 0.0 | 0.1 | GO:1904059 | regulation of locomotor rhythm(GO:1904059) |
| 0.0 | 0.1 | GO:1905006 | negative regulation of epithelial to mesenchymal transition involved in endocardial cushion formation(GO:1905006) |
| 0.0 | 0.2 | GO:0010739 | positive regulation of protein kinase A signaling(GO:0010739) |
| 0.0 | 0.1 | GO:0060399 | positive regulation of growth hormone receptor signaling pathway(GO:0060399) |
| 0.0 | 0.0 | GO:2000537 | regulation of B cell chemotaxis(GO:2000537) positive regulation of B cell chemotaxis(GO:2000538) |
| 0.0 | 0.1 | GO:0035740 | regulation of MyD88-dependent toll-like receptor signaling pathway(GO:0034124) CD8-positive, alpha-beta T cell proliferation(GO:0035740) regulation of CD8-positive, alpha-beta T cell proliferation(GO:2000564) |
| 0.0 | 0.1 | GO:0032304 | negative regulation of icosanoid secretion(GO:0032304) |
| 0.0 | 0.1 | GO:0002384 | hepatic immune response(GO:0002384) |
| 0.0 | 0.2 | GO:0071799 | response to prostaglandin D(GO:0071798) cellular response to prostaglandin D stimulus(GO:0071799) |
| 0.0 | 0.1 | GO:0070634 | transepithelial ammonium transport(GO:0070634) |
| 0.0 | 0.1 | GO:1902231 | positive regulation of intrinsic apoptotic signaling pathway in response to DNA damage(GO:1902231) |
| 0.0 | 0.4 | GO:0030208 | dermatan sulfate biosynthetic process(GO:0030208) |
| 0.0 | 0.1 | GO:2000670 | negative regulation of melanin biosynthetic process(GO:0048022) negative regulation of secondary metabolite biosynthetic process(GO:1900377) positive regulation of dendritic cell apoptotic process(GO:2000670) |
| 0.0 | 0.0 | GO:0045643 | regulation of eosinophil differentiation(GO:0045643) positive regulation of eosinophil differentiation(GO:0045645) |
| 0.0 | 0.2 | GO:0021902 | commitment of neuronal cell to specific neuron type in forebrain(GO:0021902) |
| 0.0 | 0.1 | GO:1902732 | mesenchymal stem cell proliferation(GO:0097168) positive regulation of chondrocyte proliferation(GO:1902732) |
| 0.0 | 0.1 | GO:0044339 | canonical Wnt signaling pathway involved in osteoblast differentiation(GO:0044339) |
| 0.0 | 0.1 | GO:1901165 | positive regulation of trophoblast cell migration(GO:1901165) |
| 0.0 | 0.1 | GO:0051387 | negative regulation of neurotrophin TRK receptor signaling pathway(GO:0051387) |
| 0.0 | 0.1 | GO:0006177 | GMP biosynthetic process(GO:0006177) |
| 0.0 | 0.1 | GO:0002318 | myeloid progenitor cell differentiation(GO:0002318) |
| 0.0 | 0.1 | GO:2000312 | regulation of kainate selective glutamate receptor activity(GO:2000312) |
| 0.0 | 0.0 | GO:0071596 | ubiquitin-dependent protein catabolic process via the N-end rule pathway(GO:0071596) |
| 0.0 | 0.1 | GO:0019368 | fatty acid elongation, saturated fatty acid(GO:0019367) fatty acid elongation, unsaturated fatty acid(GO:0019368) fatty acid elongation, monounsaturated fatty acid(GO:0034625) fatty acid elongation, polyunsaturated fatty acid(GO:0034626) |
| 0.0 | 0.0 | GO:0070213 | protein auto-ADP-ribosylation(GO:0070213) |
| 0.0 | 0.1 | GO:0006477 | protein sulfation(GO:0006477) |
| 0.0 | 0.0 | GO:0050653 | chondroitin sulfate proteoglycan biosynthetic process, polysaccharide chain biosynthetic process(GO:0050653) |
| 0.0 | 0.1 | GO:0000101 | sulfur amino acid transport(GO:0000101) |
| 0.0 | 0.1 | GO:0045176 | apical protein localization(GO:0045176) |
| 0.0 | 0.1 | GO:0051694 | pointed-end actin filament capping(GO:0051694) |
| 0.0 | 0.1 | GO:0044111 | development involved in symbiotic interaction(GO:0044111) |
| 0.0 | 0.1 | GO:0007221 | positive regulation of transcription of Notch receptor target(GO:0007221) |
Gene overrepresentation in cellular component category:
| Log-likelihood per target | Total log-likelihood | Term | Description |
|---|---|---|---|
| 0.1 | 0.4 | GO:0034673 | inhibin-betaglycan-ActRII complex(GO:0034673) |
| 0.0 | 0.2 | GO:0043291 | RAVE complex(GO:0043291) |
| 0.0 | 0.1 | GO:0070545 | PeBoW complex(GO:0070545) |
| 0.0 | 0.1 | GO:0005896 | interleukin-6 receptor complex(GO:0005896) |
| 0.0 | 0.1 | GO:0048179 | activin receptor complex(GO:0048179) |
| 0.0 | 0.3 | GO:0043205 | microfibril(GO:0001527) fibril(GO:0043205) |
Gene overrepresentation in molecular function category:
| Log-likelihood per target | Total log-likelihood | Term | Description |
|---|---|---|---|
| 0.1 | 0.4 | GO:0050501 | hyaluronan synthase activity(GO:0050501) |
| 0.1 | 0.3 | GO:0097108 | hedgehog family protein binding(GO:0097108) |
| 0.1 | 0.2 | GO:0004958 | prostaglandin F receptor activity(GO:0004958) |
| 0.1 | 0.6 | GO:0016015 | morphogen activity(GO:0016015) |
| 0.0 | 0.4 | GO:0005114 | type II transforming growth factor beta receptor binding(GO:0005114) |
| 0.0 | 0.3 | GO:0004957 | prostaglandin E receptor activity(GO:0004957) |
| 0.0 | 0.3 | GO:0030023 | extracellular matrix constituent conferring elasticity(GO:0030023) |
| 0.0 | 0.1 | GO:0030158 | protein xylosyltransferase activity(GO:0030158) |
| 0.0 | 0.1 | GO:0004605 | phosphatidate cytidylyltransferase activity(GO:0004605) |
| 0.0 | 0.1 | GO:0033142 | progesterone receptor binding(GO:0033142) |
| 0.0 | 0.1 | GO:0070119 | ciliary neurotrophic factor binding(GO:0070119) |
| 0.0 | 0.1 | GO:0050119 | N-acetylglucosamine deacetylase activity(GO:0050119) |
| 0.0 | 0.1 | GO:0016941 | natriuretic peptide receptor activity(GO:0016941) |
| 0.0 | 0.3 | GO:0001206 | transcriptional repressor activity, RNA polymerase II distal enhancer sequence-specific binding(GO:0001206) |
| 0.0 | 0.2 | GO:0035727 | lysophosphatidic acid binding(GO:0035727) |
| 0.0 | 0.1 | GO:0003917 | DNA topoisomerase type I activity(GO:0003917) |
| 0.0 | 0.1 | GO:0001517 | N-acetylglucosamine 6-O-sulfotransferase activity(GO:0001517) |
| 0.0 | 0.1 | GO:0008511 | sodium:potassium:chloride symporter activity(GO:0008511) |
| 0.0 | 0.4 | GO:0008191 | metalloendopeptidase inhibitor activity(GO:0008191) |
| 0.0 | 0.0 | GO:0043035 | chromatin insulator sequence binding(GO:0043035) |
| 0.0 | 0.1 | GO:0043023 | ribosomal large subunit binding(GO:0043023) |
| 0.0 | 0.1 | GO:0031849 | olfactory receptor binding(GO:0031849) |
| 0.0 | 0.1 | GO:0010861 | thyroid hormone receptor activator activity(GO:0010861) thyroid hormone receptor coactivator activity(GO:0030375) |
| 0.0 | 0.2 | GO:0008179 | adenylate cyclase binding(GO:0008179) |
| 0.0 | 0.5 | GO:0005540 | hyaluronic acid binding(GO:0005540) |
| 0.0 | 0.1 | GO:0102336 | fatty acid elongase activity(GO:0009922) 3-oxo-arachidoyl-CoA synthase activity(GO:0102336) 3-oxo-cerotoyl-CoA synthase activity(GO:0102337) 3-oxo-lignoceronyl-CoA synthase activity(GO:0102338) |
| 0.0 | 0.1 | GO:0016900 | oxidoreductase activity, acting on the CH-OH group of donors, disulfide as acceptor(GO:0016900) vitamin-K-epoxide reductase (warfarin-sensitive) activity(GO:0047057) |
| 0.0 | 0.1 | GO:0043120 | tumor necrosis factor binding(GO:0043120) |
| 0.0 | 0.0 | GO:0008427 | calcium-dependent protein kinase inhibitor activity(GO:0008427) |
Gene overrepresentation in curated gene sets: canonical pathways category:
| Log-likelihood per target | Total log-likelihood | Term | Description |
|---|---|---|---|
| 0.0 | 0.8 | NABA PROTEOGLYCANS | Genes encoding proteoglycans |
Gene overrepresentation in curated gene sets: REACTOME pathways category:
| Log-likelihood per target | Total log-likelihood | Term | Description |
|---|---|---|---|
| 0.0 | 0.5 | REACTOME PROSTANOID LIGAND RECEPTORS | Genes involved in Prostanoid ligand receptors |
| 0.0 | 0.5 | REACTOME CS DS DEGRADATION | Genes involved in CS/DS degradation |
| 0.0 | 0.4 | REACTOME HYALURONAN METABOLISM | Genes involved in Hyaluronan metabolism |