Project
Epithelial-Mesenchymal Transition, human (Scheel, 2011)
Navigation
Downloads
Results for UUGGCAC
Z-value: 0.42
Motif logo

miRNA associated with seed UUGGCAC
| Name | miRBASE accession |
|---|---|
|
hsa-miR-1271-5p
|
MIMAT0005796 |
|
hsa-miR-96-5p
|
MIMAT0000095 |
Activity profile of UUGGCAC motif
Sorted Z-values of UUGGCAC motif
| Promoter | Log-likelihood | Transcript | Gene | Gene Info |
|---|---|---|---|---|
| chr18_+_22169580 | 0.39 |
ENST00000269216.10
|
GATA6
|
GATA binding protein 6 |
| chr1_+_101237009 | 0.37 |
ENST00000305352.7
|
S1PR1
|
sphingosine-1-phosphate receptor 1 |
| chr12_+_4273751 | 0.35 |
ENST00000675880.1
ENST00000261254.8 |
CCND2
|
cyclin D2 |
| chr11_-_115504389 | 0.33 |
ENST00000545380.5
ENST00000452722.7 ENST00000331581.11 ENST00000537058.5 ENST00000536727.5 ENST00000542447.6 |
CADM1
|
cell adhesion molecule 1 |
| chr19_+_751104 | 0.31 |
ENST00000215582.8
|
MISP
|
mitotic spindle positioning |
| chr8_+_28494190 | 0.30 |
ENST00000537916.2
ENST00000240093.8 ENST00000523546.1 |
FZD3
|
frizzled class receptor 3 |
| chr5_-_140346596 | 0.28 |
ENST00000230990.7
|
HBEGF
|
heparin binding EGF like growth factor |
| chr10_+_93893931 | 0.27 |
ENST00000371408.7
ENST00000427197.2 |
SLC35G1
|
solute carrier family 35 member G1 |
| chr19_+_53867874 | 0.27 |
ENST00000448420.5
ENST00000439000.5 ENST00000391771.1 ENST00000391770.9 |
MYADM
|
myeloid associated differentiation marker |
| chr22_+_39994926 | 0.26 |
ENST00000333407.11
|
FAM83F
|
family with sequence similarity 83 member F |
| chr1_-_209806124 | 0.25 |
ENST00000367021.8
ENST00000542854.5 |
IRF6
|
interferon regulatory factor 6 |
| chr5_+_53480619 | 0.25 |
ENST00000396947.7
ENST00000256759.8 |
FST
|
follistatin |
| chr6_+_1312090 | 0.25 |
ENST00000296839.5
|
FOXQ1
|
forkhead box Q1 |
| chr1_+_109249530 | 0.23 |
ENST00000271332.4
|
CELSR2
|
cadherin EGF LAG seven-pass G-type receptor 2 |
| chr2_+_26346086 | 0.23 |
ENST00000613142.4
ENST00000260585.12 ENST00000447170.1 |
SELENOI
|
selenoprotein I |
| chr8_-_133297092 | 0.22 |
ENST00000522890.5
ENST00000675983.1 ENST00000518176.5 ENST00000323851.13 ENST00000522476.5 ENST00000518066.5 ENST00000521544.5 ENST00000674605.1 ENST00000518480.5 ENST00000523892.5 |
NDRG1
|
N-myc downstream regulated 1 |
| chr9_+_2621766 | 0.22 |
ENST00000382100.8
|
VLDLR
|
very low density lipoprotein receptor |
| chr12_+_12891554 | 0.22 |
ENST00000014914.6
|
GPRC5A
|
G protein-coupled receptor class C group 5 member A |
| chr9_-_23821275 | 0.21 |
ENST00000380110.8
|
ELAVL2
|
ELAV like RNA binding protein 2 |
| chr11_-_79441016 | 0.21 |
ENST00000278550.12
|
TENM4
|
teneurin transmembrane protein 4 |
| chr18_+_49562049 | 0.20 |
ENST00000261292.9
ENST00000427224.6 ENST00000580036.5 |
LIPG
|
lipase G, endothelial type |
| chr5_-_16508990 | 0.20 |
ENST00000399793.6
|
RETREG1
|
reticulophagy regulator 1 |
| chr10_+_80454148 | 0.20 |
ENST00000429989.7
|
TSPAN14
|
tetraspanin 14 |
| chr22_-_46537593 | 0.20 |
ENST00000262738.9
ENST00000674500.2 |
CELSR1
|
cadherin EGF LAG seven-pass G-type receptor 1 |
| chr5_+_145937793 | 0.20 |
ENST00000511217.1
|
SH3RF2
|
SH3 domain containing ring finger 2 |
| chr1_+_160400543 | 0.19 |
ENST00000368061.3
|
VANGL2
|
VANGL planar cell polarity protein 2 |
| chr4_-_80073170 | 0.19 |
ENST00000403729.7
|
ANTXR2
|
ANTXR cell adhesion molecule 2 |
| chr21_-_40847149 | 0.18 |
ENST00000400454.6
|
DSCAM
|
DS cell adhesion molecule |
| chr7_+_98106852 | 0.18 |
ENST00000297293.6
|
LMTK2
|
lemur tyrosine kinase 2 |
| chr13_-_75482151 | 0.17 |
ENST00000377636.8
|
TBC1D4
|
TBC1 domain family member 4 |
| chr1_+_81800368 | 0.16 |
ENST00000674489.1
ENST00000674442.1 ENST00000674419.1 ENST00000674407.1 ENST00000674168.1 ENST00000674307.1 ENST00000674209.1 ENST00000370715.5 ENST00000370713.5 ENST00000319517.10 ENST00000627151.2 ENST00000370717.6 |
ADGRL2
|
adhesion G protein-coupled receptor L2 |
| chr6_-_39229465 | 0.16 |
ENST00000359534.4
|
KCNK5
|
potassium two pore domain channel subfamily K member 5 |
| chr1_+_4654601 | 0.16 |
ENST00000378191.5
|
AJAP1
|
adherens junctions associated protein 1 |
| chr14_-_23183641 | 0.16 |
ENST00000469263.5
ENST00000525062.1 ENST00000316902.12 ENST00000524758.1 |
SLC7A8
|
solute carrier family 7 member 8 |
| chr4_-_11428868 | 0.16 |
ENST00000002596.6
|
HS3ST1
|
heparan sulfate-glucosamine 3-sulfotransferase 1 |
| chr15_-_34336749 | 0.16 |
ENST00000397707.6
ENST00000560611.5 |
SLC12A6
|
solute carrier family 12 member 6 |
| chr10_-_71773513 | 0.15 |
ENST00000394957.8
|
VSIR
|
V-set immunoregulatory receptor |
| chr15_+_69298896 | 0.15 |
ENST00000395407.7
ENST00000558684.5 |
PAQR5
|
progestin and adipoQ receptor family member 5 |
| chr8_+_73294594 | 0.15 |
ENST00000240285.10
|
RDH10
|
retinol dehydrogenase 10 |
| chr18_+_26226417 | 0.15 |
ENST00000269142.10
|
TAF4B
|
TATA-box binding protein associated factor 4b |
| chr1_-_40665654 | 0.15 |
ENST00000372684.8
|
RIMS3
|
regulating synaptic membrane exocytosis 3 |
| chrX_+_17375230 | 0.15 |
ENST00000380060.7
|
NHS
|
NHS actin remodeling regulator |
| chr11_-_119729158 | 0.15 |
ENST00000264025.8
|
NECTIN1
|
nectin cell adhesion molecule 1 |
| chr1_-_116667668 | 0.15 |
ENST00000369486.8
ENST00000369483.5 |
IGSF3
|
immunoglobulin superfamily member 3 |
| chr1_+_205504592 | 0.14 |
ENST00000506784.5
ENST00000360066.6 |
CDK18
|
cyclin dependent kinase 18 |
| chr12_-_106138946 | 0.14 |
ENST00000261402.7
|
NUAK1
|
NUAK family kinase 1 |
| chr9_-_101487091 | 0.14 |
ENST00000374847.5
|
PGAP4
|
post-GPI attachment to proteins GalNAc transferase 4 |
| chrX_-_153886132 | 0.14 |
ENST00000370055.5
ENST00000370060.7 ENST00000420165.5 |
L1CAM
|
L1 cell adhesion molecule |
| chr14_+_103334176 | 0.14 |
ENST00000560338.5
ENST00000560763.5 ENST00000216554.8 |
EIF5
|
eukaryotic translation initiation factor 5 |
| chr1_-_15585015 | 0.14 |
ENST00000375826.4
|
AGMAT
|
agmatinase |
| chr11_+_65787056 | 0.14 |
ENST00000335987.8
|
OVOL1
|
ovo like transcriptional repressor 1 |
| chr2_-_53970985 | 0.14 |
ENST00000404125.6
|
PSME4
|
proteasome activator subunit 4 |
| chr1_-_47997348 | 0.14 |
ENST00000606738.3
|
TRABD2B
|
TraB domain containing 2B |
| chr3_-_56801939 | 0.13 |
ENST00000296315.8
ENST00000495373.5 |
ARHGEF3
|
Rho guanine nucleotide exchange factor 3 |
| chr20_+_380747 | 0.13 |
ENST00000217233.9
|
TRIB3
|
tribbles pseudokinase 3 |
| chr15_-_72197772 | 0.13 |
ENST00000309731.12
|
GRAMD2A
|
GRAM domain containing 2A |
| chr6_-_3457018 | 0.13 |
ENST00000436008.6
ENST00000406686.8 |
SLC22A23
|
solute carrier family 22 member 23 |
| chr7_-_82443766 | 0.13 |
ENST00000356860.8
|
CACNA2D1
|
calcium voltage-gated channel auxiliary subunit alpha2delta 1 |
| chr2_+_102619531 | 0.13 |
ENST00000233969.3
|
SLC9A2
|
solute carrier family 9 member A2 |
| chr2_+_161416273 | 0.13 |
ENST00000389554.8
|
TBR1
|
T-box brain transcription factor 1 |
| chr19_-_33064872 | 0.13 |
ENST00000254260.8
|
RHPN2
|
rhophilin Rho GTPase binding protein 2 |
| chr3_+_5187697 | 0.12 |
ENST00000256497.9
|
EDEM1
|
ER degradation enhancing alpha-mannosidase like protein 1 |
| chr10_+_24466487 | 0.12 |
ENST00000396446.5
ENST00000396445.5 ENST00000376451.4 |
KIAA1217
|
KIAA1217 |
| chr8_-_80171496 | 0.12 |
ENST00000379096.9
ENST00000518937.6 |
TPD52
|
tumor protein D52 |
| chr11_+_45805108 | 0.12 |
ENST00000530471.1
ENST00000314134.4 |
SLC35C1
|
solute carrier family 35 member C1 |
| chr11_+_76783349 | 0.12 |
ENST00000333090.5
|
TSKU
|
tsukushi, small leucine rich proteoglycan |
| chr20_-_51768327 | 0.12 |
ENST00000311637.9
ENST00000338821.6 |
ATP9A
|
ATPase phospholipid transporting 9A (putative) |
| chr8_-_118111806 | 0.11 |
ENST00000378204.7
|
EXT1
|
exostosin glycosyltransferase 1 |
| chr2_+_118088432 | 0.11 |
ENST00000245787.9
|
INSIG2
|
insulin induced gene 2 |
| chr12_-_31326111 | 0.11 |
ENST00000539409.5
|
SINHCAF
|
SIN3-HDAC complex associated factor |
| chr2_-_234497035 | 0.11 |
ENST00000390645.2
ENST00000339728.6 |
ARL4C
|
ADP ribosylation factor like GTPase 4C |
| chr1_+_155127866 | 0.11 |
ENST00000368406.2
ENST00000368407.8 |
EFNA1
|
ephrin A1 |
| chr15_+_66386902 | 0.11 |
ENST00000307102.10
|
MAP2K1
|
mitogen-activated protein kinase kinase 1 |
| chr15_-_72320149 | 0.10 |
ENST00000287202.10
|
CELF6
|
CUGBP Elav-like family member 6 |
| chrX_+_49922605 | 0.10 |
ENST00000376088.7
|
CLCN5
|
chloride voltage-gated channel 5 |
| chr8_+_97644164 | 0.10 |
ENST00000336273.8
|
MTDH
|
metadherin |
| chr6_-_79078247 | 0.10 |
ENST00000275034.5
|
PHIP
|
pleckstrin homology domain interacting protein |
| chr10_-_117375407 | 0.10 |
ENST00000334464.7
|
PDZD8
|
PDZ domain containing 8 |
| chr1_+_212035717 | 0.10 |
ENST00000366991.5
|
DTL
|
denticleless E3 ubiquitin protein ligase homolog |
| chr15_+_91853690 | 0.10 |
ENST00000318445.11
|
SLCO3A1
|
solute carrier organic anion transporter family member 3A1 |
| chr4_+_107824555 | 0.10 |
ENST00000394684.8
|
SGMS2
|
sphingomyelin synthase 2 |
| chr1_-_217089627 | 0.10 |
ENST00000361525.7
|
ESRRG
|
estrogen related receptor gamma |
| chr14_+_51240205 | 0.09 |
ENST00000457354.7
|
TMX1
|
thioredoxin related transmembrane protein 1 |
| chr2_+_32277883 | 0.09 |
ENST00000238831.9
|
YIPF4
|
Yip1 domain family member 4 |
| chr3_-_171460368 | 0.09 |
ENST00000436636.7
ENST00000465393.1 ENST00000341852.10 |
TNIK
|
TRAF2 and NCK interacting kinase |
| chr2_+_219544002 | 0.09 |
ENST00000421791.1
ENST00000373883.4 ENST00000451952.1 |
TMEM198
|
transmembrane protein 198 |
| chr9_+_99105098 | 0.09 |
ENST00000374990.6
ENST00000374994.9 ENST00000552516.5 |
TGFBR1
|
transforming growth factor beta receptor 1 |
| chr11_+_57667974 | 0.09 |
ENST00000528177.5
ENST00000287169.8 |
ZDHHC5
|
zinc finger DHHC-type palmitoyltransferase 5 |
| chr5_-_116574802 | 0.09 |
ENST00000343348.11
|
SEMA6A
|
semaphorin 6A |
| chr15_+_94297939 | 0.09 |
ENST00000357742.9
|
MCTP2
|
multiple C2 and transmembrane domain containing 2 |
| chr8_-_123274255 | 0.09 |
ENST00000622816.2
ENST00000395571.8 |
ZHX1-C8orf76
ZHX1
|
ZHX1-C8orf76 readthrough zinc fingers and homeoboxes 1 |
| chr8_-_56993803 | 0.09 |
ENST00000262644.9
|
BPNT2
|
3'(2'), 5'-bisphosphate nucleotidase 2 |
| chr8_-_121641424 | 0.09 |
ENST00000303924.5
|
HAS2
|
hyaluronan synthase 2 |
| chr5_-_79512794 | 0.09 |
ENST00000282260.10
ENST00000508576.5 ENST00000535690.1 |
HOMER1
|
homer scaffold protein 1 |
| chrX_-_40735476 | 0.09 |
ENST00000324817.6
|
MED14
|
mediator complex subunit 14 |
| chr18_-_55588184 | 0.09 |
ENST00000354452.8
ENST00000565908.6 ENST00000635822.2 |
TCF4
|
transcription factor 4 |
| chr17_+_74326190 | 0.09 |
ENST00000551294.5
ENST00000389916.5 |
KIF19
|
kinesin family member 19 |
| chr2_-_40452046 | 0.08 |
ENST00000406785.6
|
SLC8A1
|
solute carrier family 8 member A1 |
| chr17_+_59155726 | 0.08 |
ENST00000578777.5
ENST00000577457.1 ENST00000582995.5 ENST00000262293.9 ENST00000614081.1 |
PRR11
|
proline rich 11 |
| chr12_+_112791933 | 0.08 |
ENST00000551052.5
ENST00000415485.7 |
RPH3A
|
rabphilin 3A |
| chr15_-_44194407 | 0.08 |
ENST00000484674.5
|
FRMD5
|
FERM domain containing 5 |
| chr2_-_219229571 | 0.08 |
ENST00000436856.5
ENST00000428226.5 ENST00000409422.5 ENST00000361242.9 ENST00000431715.5 ENST00000457841.5 ENST00000439812.5 ENST00000396761.6 |
ATG9A
|
autophagy related 9A |
| chr3_-_50359480 | 0.08 |
ENST00000266025.4
|
TMEM115
|
transmembrane protein 115 |
| chr6_+_135181323 | 0.08 |
ENST00000367814.8
|
MYB
|
MYB proto-oncogene, transcription factor |
| chr13_-_20161038 | 0.08 |
ENST00000241125.4
|
GJA3
|
gap junction protein alpha 3 |
| chr15_+_22786610 | 0.08 |
ENST00000337435.9
|
NIPA1
|
NIPA magnesium transporter 1 |
| chr1_-_177164673 | 0.08 |
ENST00000424564.2
ENST00000361833.7 |
ASTN1
|
astrotactin 1 |
| chr18_-_50195138 | 0.08 |
ENST00000285039.12
|
MYO5B
|
myosin VB |
| chr8_+_124474843 | 0.08 |
ENST00000303545.4
|
RNF139
|
ring finger protein 139 |
| chr6_+_117675448 | 0.08 |
ENST00000368494.4
|
NUS1
|
NUS1 dehydrodolichyl diphosphate synthase subunit |
| chr20_-_51802509 | 0.08 |
ENST00000371539.7
ENST00000217086.9 |
SALL4
|
spalt like transcription factor 4 |
| chr1_-_44031446 | 0.08 |
ENST00000372310.8
ENST00000466926.1 |
SLC6A9
|
solute carrier family 6 member 9 |
| chr5_+_174045673 | 0.07 |
ENST00000303177.8
ENST00000519867.5 |
NSG2
|
neuronal vesicle trafficking associated 2 |
| chr5_-_157575767 | 0.07 |
ENST00000257527.9
|
ADAM19
|
ADAM metallopeptidase domain 19 |
| chr20_-_44810539 | 0.07 |
ENST00000372851.8
|
RIMS4
|
regulating synaptic membrane exocytosis 4 |
| chr3_-_171809770 | 0.07 |
ENST00000331659.2
|
PLD1
|
phospholipase D1 |
| chr9_+_121651594 | 0.07 |
ENST00000408936.7
|
DAB2IP
|
DAB2 interacting protein |
| chr10_-_102114935 | 0.07 |
ENST00000361198.9
|
LDB1
|
LIM domain binding 1 |
| chr1_+_15847698 | 0.07 |
ENST00000375759.8
|
SPEN
|
spen family transcriptional repressor |
| chr4_+_165873231 | 0.07 |
ENST00000061240.7
|
TLL1
|
tolloid like 1 |
| chr12_-_92929236 | 0.07 |
ENST00000322349.13
|
EEA1
|
early endosome antigen 1 |
| chr22_+_23180365 | 0.07 |
ENST00000359540.7
ENST00000305877.13 |
BCR
|
BCR activator of RhoGEF and GTPase |
| chr8_-_8893548 | 0.07 |
ENST00000276282.7
|
MFHAS1
|
malignant fibrous histiocytoma amplified sequence 1 |
| chr14_+_70907450 | 0.07 |
ENST00000304743.7
|
PCNX1
|
pecanex 1 |
| chr2_-_96265942 | 0.07 |
ENST00000432959.1
ENST00000258439.8 |
TMEM127
|
transmembrane protein 127 |
| chr5_+_87268922 | 0.07 |
ENST00000456692.6
ENST00000512763.5 ENST00000506290.1 |
RASA1
|
RAS p21 protein activator 1 |
| chr2_-_73269483 | 0.07 |
ENST00000295133.9
|
FBXO41
|
F-box protein 41 |
| chr4_+_90127555 | 0.07 |
ENST00000509176.5
|
CCSER1
|
coiled-coil serine rich protein 1 |
| chr12_-_12267003 | 0.07 |
ENST00000535731.1
ENST00000261349.9 |
LRP6
|
LDL receptor related protein 6 |
| chr13_+_99981775 | 0.07 |
ENST00000376335.8
|
ZIC2
|
Zic family member 2 |
| chr1_+_25430854 | 0.07 |
ENST00000399766.7
|
MACO1
|
macoilin 1 |
| chr1_-_114670018 | 0.07 |
ENST00000393274.6
ENST00000393276.7 |
DENND2C
|
DENN domain containing 2C |
| chr3_-_113746218 | 0.07 |
ENST00000497255.1
ENST00000240922.8 ENST00000478020.1 ENST00000493900.5 |
NAA50
|
N-alpha-acetyltransferase 50, NatE catalytic subunit |
| chr1_+_64745089 | 0.06 |
ENST00000294428.7
ENST00000371072.8 |
RAVER2
|
ribonucleoprotein, PTB binding 2 |
| chr1_+_203626775 | 0.06 |
ENST00000367218.7
|
ATP2B4
|
ATPase plasma membrane Ca2+ transporting 4 |
| chr21_-_14383125 | 0.06 |
ENST00000285667.4
|
HSPA13
|
heat shock protein family A (Hsp70) member 13 |
| chr21_+_17513119 | 0.06 |
ENST00000356275.10
ENST00000400165.5 ENST00000400169.1 |
CXADR
|
CXADR Ig-like cell adhesion molecule |
| chr7_-_113087720 | 0.06 |
ENST00000297146.7
|
GPR85
|
G protein-coupled receptor 85 |
| chr12_-_57633136 | 0.06 |
ENST00000341156.9
ENST00000550764.5 ENST00000551220.1 |
B4GALNT1
|
beta-1,4-N-acetyl-galactosaminyltransferase 1 |
| chr2_-_157874976 | 0.06 |
ENST00000682025.1
ENST00000683487.1 ENST00000682300.1 ENST00000683441.1 ENST00000684595.1 ENST00000683426.1 ENST00000683820.1 ENST00000263640.7 |
ACVR1
|
activin A receptor type 1 |
| chr5_+_90474879 | 0.06 |
ENST00000504930.5
ENST00000514483.5 |
POLR3G
|
RNA polymerase III subunit G |
| chr4_+_127632926 | 0.06 |
ENST00000335251.11
|
INTU
|
inturned planar cell polarity protein |
| chr8_-_129939694 | 0.06 |
ENST00000522250.5
ENST00000522941.5 ENST00000522746.5 ENST00000520204.5 ENST00000519070.5 ENST00000520254.5 ENST00000519824.6 |
CYRIB
|
CYFIP related Rac1 interactor B |
| chr1_-_115841116 | 0.06 |
ENST00000320238.3
|
NHLH2
|
nescient helix-loop-helix 2 |
| chr5_-_1345084 | 0.06 |
ENST00000320895.10
|
CLPTM1L
|
CLPTM1 like |
| chr7_+_107470050 | 0.06 |
ENST00000304402.6
|
GPR22
|
G protein-coupled receptor 22 |
| chrX_-_80809854 | 0.06 |
ENST00000373275.5
|
BRWD3
|
bromodomain and WD repeat domain containing 3 |
| chr12_+_56128217 | 0.06 |
ENST00000267113.4
ENST00000394048.10 |
ESYT1
|
extended synaptotagmin 1 |
| chr8_+_91070196 | 0.06 |
ENST00000617869.4
ENST00000615618.1 ENST00000285420.8 ENST00000404789.8 |
OTUD6B
|
OTU deubiquitinase 6B |
| chr1_-_54887161 | 0.06 |
ENST00000535035.6
ENST00000371269.9 ENST00000436604.2 |
DHCR24
|
24-dehydrocholesterol reductase |
| chr11_+_842824 | 0.06 |
ENST00000397396.5
ENST00000397397.7 |
TSPAN4
|
tetraspanin 4 |
| chr2_-_29921580 | 0.06 |
ENST00000389048.8
|
ALK
|
ALK receptor tyrosine kinase |
| chr10_-_15371225 | 0.06 |
ENST00000378116.9
|
FAM171A1
|
family with sequence similarity 171 member A1 |
| chr7_-_128031422 | 0.06 |
ENST00000249363.4
|
LRRC4
|
leucine rich repeat containing 4 |
| chr19_-_45405034 | 0.06 |
ENST00000592134.1
ENST00000360957.10 |
PPP1R13L
|
protein phosphatase 1 regulatory subunit 13 like |
| chr19_-_48511793 | 0.06 |
ENST00000600059.6
|
LMTK3
|
lemur tyrosine kinase 3 |
| chr17_+_21284701 | 0.06 |
ENST00000529517.1
ENST00000627447.1 ENST00000342679.9 |
MAP2K3
|
mitogen-activated protein kinase kinase 3 |
| chr6_-_10838467 | 0.06 |
ENST00000313243.6
|
MAK
|
male germ cell associated kinase |
| chr1_+_42380772 | 0.06 |
ENST00000431473.4
ENST00000410070.6 |
RIMKLA
|
ribosomal modification protein rimK like family member A |
| chr10_-_32056376 | 0.06 |
ENST00000302418.5
|
KIF5B
|
kinesin family member 5B |
| chr12_+_49741802 | 0.06 |
ENST00000423828.5
ENST00000550445.5 |
TMBIM6
|
transmembrane BAX inhibitor motif containing 6 |
| chr11_-_17014396 | 0.06 |
ENST00000355661.7
ENST00000532079.1 ENST00000531066.6 |
PLEKHA7
|
pleckstrin homology domain containing A7 |
| chr4_-_16226460 | 0.05 |
ENST00000405303.7
|
TAPT1
|
transmembrane anterior posterior transformation 1 |
| chr2_-_171433950 | 0.05 |
ENST00000375258.9
ENST00000442541.1 ENST00000392599.6 |
METTL8
|
methyltransferase like 8 |
| chr5_+_176448363 | 0.05 |
ENST00000261942.7
|
FAF2
|
Fas associated factor family member 2 |
| chr5_+_58583068 | 0.05 |
ENST00000282878.6
|
RAB3C
|
RAB3C, member RAS oncogene family |
| chr4_+_183905266 | 0.05 |
ENST00000308497.9
|
STOX2
|
storkhead box 2 |
| chr1_+_200739542 | 0.05 |
ENST00000358823.6
|
CAMSAP2
|
calmodulin regulated spectrin associated protein family member 2 |
| chr1_+_230067198 | 0.05 |
ENST00000366672.5
|
GALNT2
|
polypeptide N-acetylgalactosaminyltransferase 2 |
| chr1_+_15617415 | 0.05 |
ENST00000480945.6
|
DDI2
|
DNA damage inducible 1 homolog 2 |
| chr4_-_109302643 | 0.05 |
ENST00000399126.1
ENST00000505591.1 ENST00000399132.6 |
COL25A1
|
collagen type XXV alpha 1 chain |
| chr17_+_47649899 | 0.05 |
ENST00000290158.9
|
KPNB1
|
karyopherin subunit beta 1 |
| chr3_-_45995807 | 0.05 |
ENST00000535325.5
ENST00000296137.7 |
FYCO1
|
FYVE and coiled-coil domain autophagy adaptor 1 |
| chr4_-_89307732 | 0.05 |
ENST00000609438.2
|
GPRIN3
|
GPRIN family member 3 |
| chr16_-_5033916 | 0.05 |
ENST00000381955.7
ENST00000312251.8 |
NAGPA
|
N-acetylglucosamine-1-phosphodiester alpha-N-acetylglucosaminidase |
| chr16_-_23510389 | 0.05 |
ENST00000562117.1
ENST00000567468.5 ENST00000562944.5 ENST00000309859.8 |
GGA2
|
golgi associated, gamma adaptin ear containing, ARF binding protein 2 |
| chr22_+_41092585 | 0.05 |
ENST00000263253.9
|
EP300
|
E1A binding protein p300 |
| chr6_-_98947911 | 0.05 |
ENST00000369244.7
ENST00000229971.2 |
FBXL4
|
F-box and leucine rich repeat protein 4 |
| chr1_-_68497030 | 0.05 |
ENST00000456315.7
ENST00000525124.1 ENST00000370966.9 |
DEPDC1
|
DEP domain containing 1 |
| chr19_-_55117627 | 0.05 |
ENST00000263433.8
|
PPP1R12C
|
protein phosphatase 1 regulatory subunit 12C |
| chr13_-_27620520 | 0.05 |
ENST00000316334.5
|
LNX2
|
ligand of numb-protein X 2 |
| chr2_+_134120169 | 0.05 |
ENST00000409645.5
|
MGAT5
|
alpha-1,6-mannosylglycoprotein 6-beta-N-acetylglucosaminyltransferase |
| chr7_+_2631978 | 0.05 |
ENST00000258796.12
|
TTYH3
|
tweety family member 3 |
| chr1_-_234479131 | 0.05 |
ENST00000040877.2
|
TARBP1
|
TAR (HIV-1) RNA binding protein 1 |
| chr14_-_74713041 | 0.05 |
ENST00000356357.9
ENST00000555249.1 ENST00000681599.1 ENST00000556202.5 ENST00000681099.1 |
AREL1
|
apoptosis resistant E3 ubiquitin protein ligase 1 |
| chr8_-_11466740 | 0.05 |
ENST00000284486.9
|
FAM167A
|
family with sequence similarity 167 member A |
| chr8_+_119873710 | 0.05 |
ENST00000523492.5
ENST00000286234.6 |
DEPTOR
|
DEP domain containing MTOR interacting protein |
| chr1_-_157138388 | 0.05 |
ENST00000368192.9
|
ETV3
|
ETS variant transcription factor 3 |
| chr13_-_98977975 | 0.05 |
ENST00000376460.5
|
DOCK9
|
dedicator of cytokinesis 9 |
| chr9_-_92764795 | 0.05 |
ENST00000375512.3
ENST00000356884.11 |
BICD2
|
BICD cargo adaptor 2 |
| chr8_+_122781621 | 0.05 |
ENST00000314393.6
|
ZHX2
|
zinc fingers and homeoboxes 2 |
| chr12_+_2052977 | 0.05 |
ENST00000399634.6
ENST00000406454.8 ENST00000327702.12 ENST00000347598.9 ENST00000399603.6 ENST00000399641.6 ENST00000399655.6 ENST00000335762.10 ENST00000682835.1 |
CACNA1C
|
calcium voltage-gated channel subunit alpha1 C |
| chr15_-_65377991 | 0.05 |
ENST00000327987.9
|
IGDCC3
|
immunoglobulin superfamily DCC subclass member 3 |
| chr20_+_43916142 | 0.05 |
ENST00000423191.6
ENST00000372999.5 |
TOX2
|
TOX high mobility group box family member 2 |
| chr6_+_138161932 | 0.05 |
ENST00000251691.5
|
ARFGEF3
|
ARFGEF family member 3 |
| chr9_-_36276967 | 0.05 |
ENST00000396594.8
ENST00000543356.7 |
GNE
|
glucosamine (UDP-N-acetyl)-2-epimerase/N-acetylmannosamine kinase |
| chr4_+_145481845 | 0.05 |
ENST00000302085.9
ENST00000512019.1 |
SMAD1
|
SMAD family member 1 |
| chr2_+_32063533 | 0.05 |
ENST00000315285.9
|
SPAST
|
spastin |
| chr17_+_18315273 | 0.05 |
ENST00000406438.5
|
SMCR8
|
SMCR8-C9orf72 complex subunit |
| chr11_+_112025367 | 0.05 |
ENST00000679614.1
ENST00000679878.1 ENST00000280346.11 ENST00000681339.1 ENST00000681328.1 ENST00000681316.1 ENST00000531306.2 ENST00000680331.1 ENST00000393051.5 |
DLAT
|
dihydrolipoamide S-acetyltransferase |
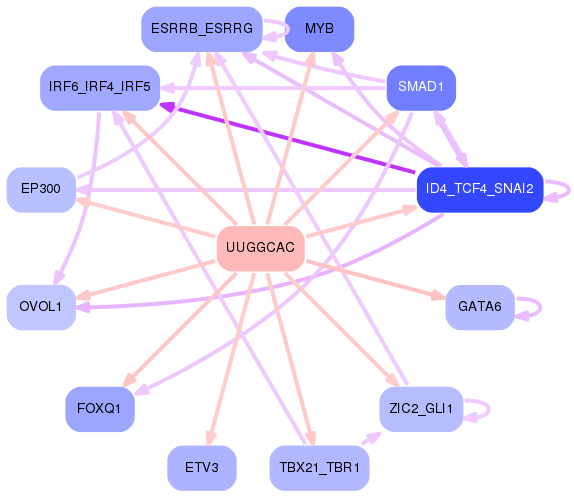
Network of associatons between targets according to the STRING database.

First level regulatory network of UUGGCAC
Gene Ontology Analysis
Gene overrepresentation in biological process category:
| Log-likelihood per target | Total log-likelihood | Term | Description |
|---|---|---|---|
| 0.1 | 0.4 | GO:0032912 | negative regulation of transforming growth factor beta2 production(GO:0032912) |
| 0.1 | 0.4 | GO:0003245 | cardiac muscle tissue growth involved in heart morphogenesis(GO:0003245) |
| 0.1 | 0.5 | GO:0036515 | serotonergic neuron axon guidance(GO:0036515) |
| 0.1 | 0.3 | GO:0090038 | negative regulation of protein kinase C signaling(GO:0090038) |
| 0.1 | 0.2 | GO:0032289 | central nervous system myelin formation(GO:0032289) |
| 0.1 | 0.2 | GO:0060448 | dichotomous subdivision of terminal units involved in lung branching(GO:0060448) |
| 0.1 | 0.2 | GO:0010982 | regulation of high-density lipoprotein particle clearance(GO:0010982) |
| 0.0 | 0.3 | GO:0042271 | susceptibility to natural killer cell mediated cytotoxicity(GO:0042271) |
| 0.0 | 0.1 | GO:1901993 | meiotic cell cycle phase transition(GO:0044771) regulation of meiotic cell cycle phase transition(GO:1901993) negative regulation of meiotic cell cycle phase transition(GO:1901994) |
| 0.0 | 0.1 | GO:1904806 | regulation of protein oxidation(GO:1904806) positive regulation of protein oxidation(GO:1904808) |
| 0.0 | 0.1 | GO:0036510 | trimming of terminal mannose on C branch(GO:0036510) |
| 0.0 | 0.2 | GO:0015783 | GDP-fucose transport(GO:0015783) purine nucleotide-sugar transport(GO:0036079) |
| 0.0 | 0.3 | GO:0051541 | elastin metabolic process(GO:0051541) |
| 0.0 | 0.1 | GO:0061073 | ciliary body morphogenesis(GO:0061073) |
| 0.0 | 0.1 | GO:0021764 | amygdala development(GO:0021764) |
| 0.0 | 0.2 | GO:0034436 | glycoprotein transport(GO:0034436) |
| 0.0 | 0.3 | GO:1990034 | calcium ion export from cell(GO:1990034) |
| 0.0 | 0.2 | GO:0030860 | regulation of polarized epithelial cell differentiation(GO:0030860) |
| 0.0 | 0.1 | GO:1990922 | regulation of hepatic stellate cell proliferation(GO:1904897) positive regulation of hepatic stellate cell proliferation(GO:1904899) hepatic stellate cell proliferation(GO:1990922) |
| 0.0 | 0.1 | GO:0086048 | membrane depolarization during bundle of His cell action potential(GO:0086048) |
| 0.0 | 0.1 | GO:0016094 | polyprenol biosynthetic process(GO:0016094) |
| 0.0 | 0.2 | GO:0061709 | reticulophagy(GO:0061709) |
| 0.0 | 0.1 | GO:0061537 | glycine secretion(GO:0061536) glycine secretion, neurotransmission(GO:0061537) |
| 0.0 | 0.1 | GO:0043973 | histone H3-K4 acetylation(GO:0043973) |
| 0.0 | 0.2 | GO:0031339 | negative regulation of vesicle fusion(GO:0031339) |
| 0.0 | 0.2 | GO:0021999 | neural plate anterior/posterior regionalization(GO:0021999) |
| 0.0 | 0.1 | GO:1901162 | primary amino compound biosynthetic process(GO:1901162) |
| 0.0 | 0.1 | GO:1905073 | proepicardium development(GO:0003342) septum transversum development(GO:0003343) occluding junction disassembly(GO:1905071) regulation of occluding junction disassembly(GO:1905073) positive regulation of occluding junction disassembly(GO:1905075) |
| 0.0 | 0.0 | GO:0072708 | response to sorbitol(GO:0072708) |
| 0.0 | 0.2 | GO:0042539 | hypotonic salinity response(GO:0042539) cellular hypotonic salinity response(GO:0071477) |
| 0.0 | 0.1 | GO:0046379 | extracellular polysaccharide biosynthetic process(GO:0045226) extracellular polysaccharide metabolic process(GO:0046379) |
| 0.0 | 0.1 | GO:0044335 | canonical Wnt signaling pathway involved in neural crest cell differentiation(GO:0044335) |
| 0.0 | 0.1 | GO:0071962 | mitotic sister chromatid cohesion, centromeric(GO:0071962) |
| 0.0 | 0.1 | GO:0007206 | phospholipase C-activating G-protein coupled glutamate receptor signaling pathway(GO:0007206) |
| 0.0 | 0.1 | GO:0033241 | regulation of cellular amine catabolic process(GO:0033241) negative regulation of cellular amine catabolic process(GO:0033242) negative regulation of the force of heart contraction(GO:0098736) regulation of arginine catabolic process(GO:1900081) negative regulation of arginine catabolic process(GO:1900082) regulation of citrulline biosynthetic process(GO:1903248) negative regulation of citrulline biosynthetic process(GO:1903249) negative regulation of cellular amino acid biosynthetic process(GO:2000283) |
| 0.0 | 0.1 | GO:0061445 | endocardial cell fate commitment(GO:0060957) endocardial cushion cell differentiation(GO:0061443) endocardial cushion cell fate commitment(GO:0061445) |
| 0.0 | 0.2 | GO:0090232 | peripheral nervous system myelin maintenance(GO:0032287) positive regulation of spindle checkpoint(GO:0090232) |
| 0.0 | 0.1 | GO:0048570 | notochord morphogenesis(GO:0048570) |
| 0.0 | 0.2 | GO:0035897 | proteolysis in other organism(GO:0035897) |
| 0.0 | 0.1 | GO:0002378 | immunoglobulin biosynthetic process(GO:0002378) |
| 0.0 | 0.1 | GO:0060268 | negative regulation of neutrophil degranulation(GO:0043314) negative regulation of respiratory burst(GO:0060268) negative regulation of blood vessel remodeling(GO:0060313) |
| 0.0 | 0.1 | GO:0036135 | Schwann cell migration(GO:0036135) regulation of Schwann cell migration(GO:1900147) |
| 0.0 | 0.1 | GO:0035093 | spermatogenesis, exchange of chromosomal proteins(GO:0035093) |
| 0.0 | 0.1 | GO:0033490 | cholesterol biosynthetic process via desmosterol(GO:0033489) cholesterol biosynthetic process via lathosterol(GO:0033490) |
| 0.0 | 0.3 | GO:0032926 | negative regulation of activin receptor signaling pathway(GO:0032926) |
| 0.0 | 0.0 | GO:0097051 | establishment of protein localization to endoplasmic reticulum membrane(GO:0097051) |
| 0.0 | 0.1 | GO:0035507 | regulation of myosin-light-chain-phosphatase activity(GO:0035507) |
| 0.0 | 0.0 | GO:1901073 | N-acetylglucosamine biosynthetic process(GO:0006045) glucosamine-containing compound biosynthetic process(GO:1901073) |
| 0.0 | 0.0 | GO:0051230 | mitotic spindle disassembly(GO:0051228) spindle disassembly(GO:0051230) |
| 0.0 | 0.0 | GO:1901254 | modulation by host of viral RNA genome replication(GO:0044830) positive regulation of intracellular transport of viral material(GO:1901254) |
| 0.0 | 0.0 | GO:0060164 | regulation of timing of neuron differentiation(GO:0060164) |
| 0.0 | 0.1 | GO:0036269 | swimming behavior(GO:0036269) |
| 0.0 | 0.4 | GO:0071481 | cellular response to X-ray(GO:0071481) |
| 0.0 | 0.1 | GO:1905150 | regulation of voltage-gated sodium channel activity(GO:1905150) |
| 0.0 | 0.1 | GO:1901098 | positive regulation of autophagosome maturation(GO:1901098) |
| 0.0 | 0.0 | GO:0071657 | visceral motor neuron differentiation(GO:0021524) cardiac cell fate determination(GO:0060913) positive regulation of granulocyte colony-stimulating factor production(GO:0071657) positive regulation of macrophage colony-stimulating factor production(GO:1901258) |
| 0.0 | 0.1 | GO:0044805 | late nucleophagy(GO:0044805) |
| 0.0 | 0.0 | GO:0015917 | aminophospholipid transport(GO:0015917) |
| 0.0 | 0.1 | GO:0098904 | regulation of AV node cell action potential(GO:0098904) |
| 0.0 | 0.2 | GO:0060431 | primary lung bud formation(GO:0060431) |
| 0.0 | 0.1 | GO:0030259 | lipid glycosylation(GO:0030259) |
| 0.0 | 0.0 | GO:0048867 | stem cell fate determination(GO:0048867) |
| 0.0 | 0.1 | GO:0002934 | desmosome organization(GO:0002934) |
| 0.0 | 0.0 | GO:0000451 | rRNA 2'-O-methylation(GO:0000451) |
| 0.0 | 0.3 | GO:0045717 | negative regulation of fatty acid biosynthetic process(GO:0045717) |
| 0.0 | 0.1 | GO:0036324 | vascular endothelial growth factor receptor-2 signaling pathway(GO:0036324) |
| 0.0 | 0.0 | GO:0021503 | neural fold bending(GO:0021503) |
| 0.0 | 0.0 | GO:0075732 | viral penetration into host nucleus(GO:0075732) multi-organism nuclear import(GO:1902594) |
| 0.0 | 0.0 | GO:0031117 | positive regulation of microtubule depolymerization(GO:0031117) |
| 0.0 | 0.2 | GO:0097369 | sodium ion import(GO:0097369) |
| 0.0 | 0.0 | GO:1902269 | positive regulation of polyamine transmembrane transport(GO:1902269) |
| 0.0 | 0.1 | GO:0006686 | sphingomyelin biosynthetic process(GO:0006686) |
| 0.0 | 0.1 | GO:0032439 | endosome localization(GO:0032439) |
| 0.0 | 0.1 | GO:0015014 | heparan sulfate proteoglycan biosynthetic process, polysaccharide chain biosynthetic process(GO:0015014) |
| 0.0 | 0.1 | GO:0001731 | formation of translation preinitiation complex(GO:0001731) |
| 0.0 | 0.1 | GO:0031291 | Ran protein signal transduction(GO:0031291) |
| 0.0 | 0.0 | GO:0030200 | heparan sulfate proteoglycan catabolic process(GO:0030200) |
| 0.0 | 0.2 | GO:0007175 | negative regulation of epidermal growth factor-activated receptor activity(GO:0007175) |
| 0.0 | 0.1 | GO:0018076 | N-terminal peptidyl-lysine acetylation(GO:0018076) |
| 0.0 | 0.0 | GO:1904381 | Golgi apparatus mannose trimming(GO:1904381) |
Gene overrepresentation in cellular component category:
| Log-likelihood per target | Total log-likelihood | Term | Description |
|---|---|---|---|
| 0.1 | 0.2 | GO:0060187 | cell pole(GO:0060187) |
| 0.1 | 0.4 | GO:0097129 | cyclin D2-CDK4 complex(GO:0097129) |
| 0.0 | 0.1 | GO:0032937 | SREBP-SCAP-Insig complex(GO:0032937) |
| 0.0 | 0.2 | GO:0089717 | spanning component of plasma membrane(GO:0044214) spanning component of membrane(GO:0089717) |
| 0.0 | 0.2 | GO:0097197 | tetraspanin-enriched microdomain(GO:0097197) |
| 0.0 | 0.1 | GO:0032584 | growth cone membrane(GO:0032584) |
| 0.0 | 0.1 | GO:1990032 | parallel fiber(GO:1990032) |
| 0.0 | 0.1 | GO:1990111 | spermatoproteasome complex(GO:1990111) |
| 0.0 | 0.1 | GO:1990851 | Wnt-Frizzled-LRP5/6 complex(GO:1990851) |
| 0.0 | 0.4 | GO:0032433 | filopodium tip(GO:0032433) |
| 0.0 | 0.1 | GO:0070022 | transforming growth factor beta receptor homodimeric complex(GO:0070022) |
| 0.0 | 0.1 | GO:0090571 | RNA polymerase II transcription repressor complex(GO:0090571) |
| 0.0 | 0.1 | GO:0048179 | activin receptor complex(GO:0048179) |
| 0.0 | 0.1 | GO:0070847 | core mediator complex(GO:0070847) |
| 0.0 | 0.1 | GO:0005967 | mitochondrial pyruvate dehydrogenase complex(GO:0005967) |
| 0.0 | 0.0 | GO:0002945 | cyclin K-CDK13 complex(GO:0002945) |
Gene overrepresentation in molecular function category:
| Log-likelihood per target | Total log-likelihood | Term | Description |
|---|---|---|---|
| 0.1 | 0.2 | GO:0004307 | ethanolaminephosphotransferase activity(GO:0004307) |
| 0.1 | 0.2 | GO:0034189 | very-low-density lipoprotein particle binding(GO:0034189) |
| 0.0 | 0.2 | GO:0005457 | GDP-fucose transmembrane transporter activity(GO:0005457) purine nucleotide-sugar transmembrane transporter activity(GO:0036080) |
| 0.0 | 0.1 | GO:0050509 | N-acetylglucosaminyl-proteoglycan 4-beta-glucuronosyltransferase activity(GO:0050509) |
| 0.0 | 0.1 | GO:0016524 | latrotoxin receptor activity(GO:0016524) |
| 0.0 | 0.2 | GO:0004465 | lipoprotein lipase activity(GO:0004465) |
| 0.0 | 0.4 | GO:0046625 | sphingolipid binding(GO:0046625) |
| 0.0 | 0.1 | GO:0047493 | sphingomyelin synthase activity(GO:0033188) ceramide cholinephosphotransferase activity(GO:0047493) |
| 0.0 | 0.1 | GO:0071074 | eukaryotic initiation factor eIF2 binding(GO:0071074) |
| 0.0 | 0.2 | GO:0008467 | [heparan sulfate]-glucosamine 3-sulfotransferase 1 activity(GO:0008467) |
| 0.0 | 0.1 | GO:1904928 | coreceptor activity involved in canonical Wnt signaling pathway(GO:1904928) |
| 0.0 | 0.1 | GO:0052858 | peptidyl-lysine N-acetyltransferase activity, acting on acetyl phosphate as donor(GO:0052858) |
| 0.0 | 0.1 | GO:0036487 | nitric-oxide synthase inhibitor activity(GO:0036487) |
| 0.0 | 0.1 | GO:0072590 | N-acetyl-L-aspartate-L-glutamate ligase activity(GO:0072590) |
| 0.0 | 0.1 | GO:0015375 | glycine:sodium symporter activity(GO:0015375) |
| 0.0 | 0.2 | GO:0004571 | mannosyl-oligosaccharide 1,2-alpha-mannosidase activity(GO:0004571) |
| 0.0 | 0.4 | GO:0048185 | activin binding(GO:0048185) |
| 0.0 | 0.1 | GO:0050501 | hyaluronan synthase activity(GO:0050501) |
| 0.0 | 0.0 | GO:0070039 | rRNA (guanosine-2'-O-)-methyltransferase activity(GO:0070039) |
| 0.0 | 0.2 | GO:0019534 | toxin transporter activity(GO:0019534) |
| 0.0 | 0.1 | GO:0099609 | microtubule lateral binding(GO:0099609) |
| 0.0 | 0.0 | GO:0070704 | C-5 sterol desaturase activity(GO:0000248) sterol desaturase activity(GO:0070704) |
| 0.0 | 0.1 | GO:0005025 | transforming growth factor beta receptor activity, type I(GO:0005025) |
| 0.0 | 0.3 | GO:0042813 | Wnt-activated receptor activity(GO:0042813) |
| 0.0 | 0.2 | GO:0001075 | transcription factor activity, RNA polymerase II core promoter sequence-specific binding involved in preinitiation complex assembly(GO:0001075) |
| 0.0 | 0.0 | GO:0003858 | 3-hydroxybutyrate dehydrogenase activity(GO:0003858) |
| 0.0 | 0.0 | GO:0016418 | S-acetyltransferase activity(GO:0016418) |
| 0.0 | 0.2 | GO:0022820 | potassium:chloride symporter activity(GO:0015379) potassium ion symporter activity(GO:0022820) |
| 0.0 | 0.1 | GO:0050682 | AF-2 domain binding(GO:0050682) |
| 0.0 | 0.1 | GO:0016520 | growth hormone-releasing hormone receptor activity(GO:0016520) |
| 0.0 | 0.1 | GO:0015386 | potassium:proton antiporter activity(GO:0015386) |
| 0.0 | 0.2 | GO:0052650 | NADP-retinol dehydrogenase activity(GO:0052650) |
| 0.0 | 0.2 | GO:0086007 | voltage-gated calcium channel activity involved in cardiac muscle cell action potential(GO:0086007) |
| 0.0 | 0.1 | GO:0035662 | Toll-like receptor 4 binding(GO:0035662) |
Gene overrepresentation in curated gene sets: canonical pathways category:
| Log-likelihood per target | Total log-likelihood | Term | Description |
|---|---|---|---|
| 0.0 | 0.4 | PID ANTHRAX PATHWAY | Cellular roles of Anthrax toxin |