Project
Epithelial-Mesenchymal Transition, human (Scheel, 2011)
Navigation
Downloads
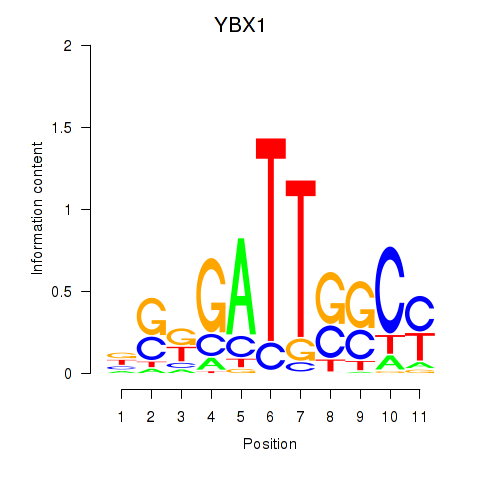
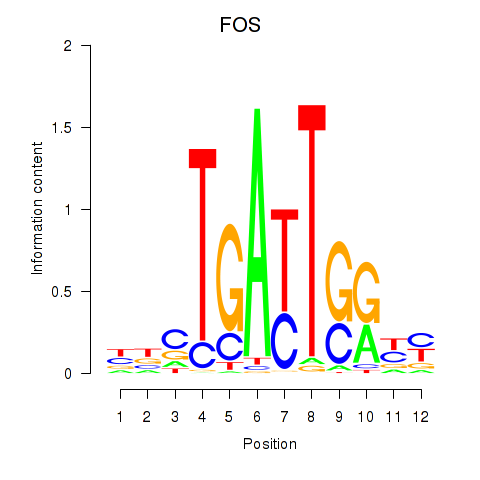
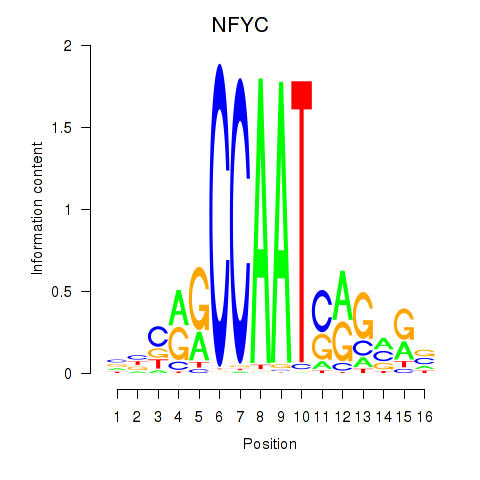
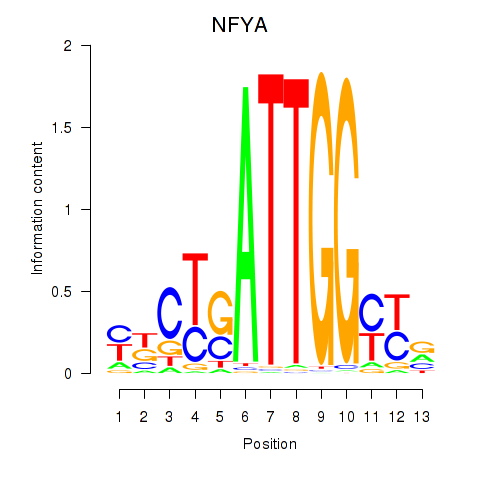
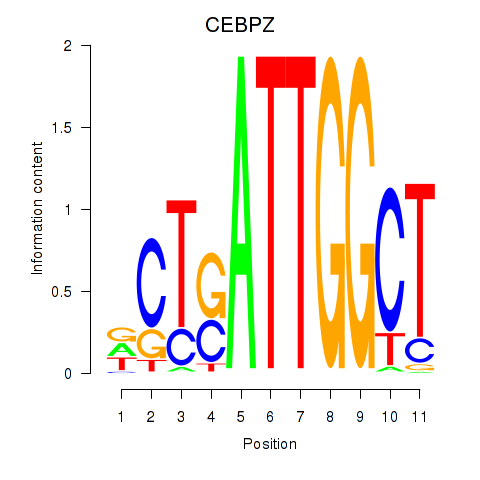
Results for YBX1_FOS_NFYC_NFYA_NFYB_CEBPZ
Z-value: 4.79
Motif logo

Transcription factors associated with YBX1_FOS_NFYC_NFYA_NFYB_CEBPZ
| Gene Symbol | Gene ID | Gene Info |
|---|---|---|
|
YBX1
|
ENSG00000065978.19 | Y-box binding protein 1 |
|
FOS
|
ENSG00000170345.10 | Fos proto-oncogene, AP-1 transcription factor subunit |
|
NFYC
|
ENSG00000066136.20 | nuclear transcription factor Y subunit gamma |
|
NFYA
|
ENSG00000001167.15 | nuclear transcription factor Y subunit alpha |
|
NFYB
|
ENSG00000120837.8 | nuclear transcription factor Y subunit beta |
|
CEBPZ
|
ENSG00000115816.15 | CCAAT enhancer binding protein zeta |
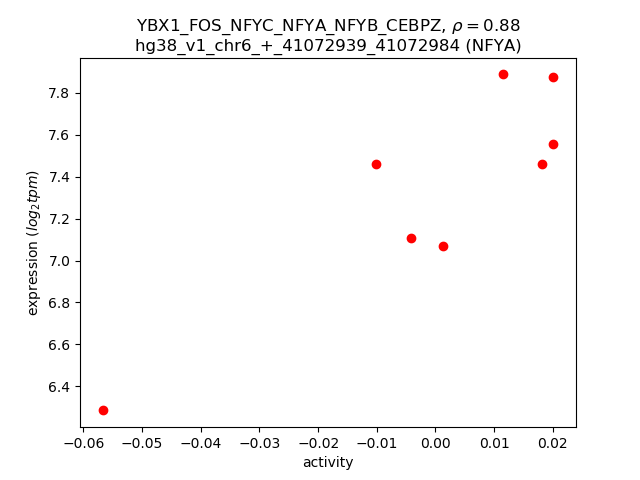
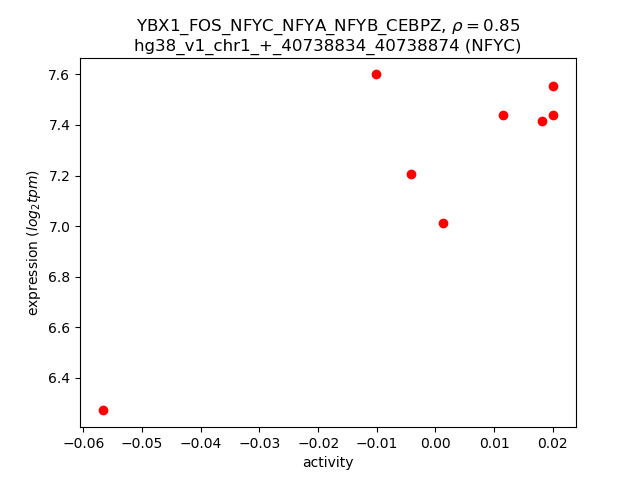
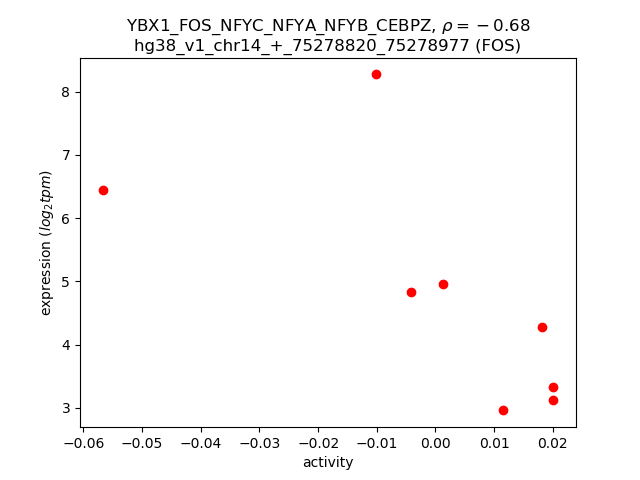
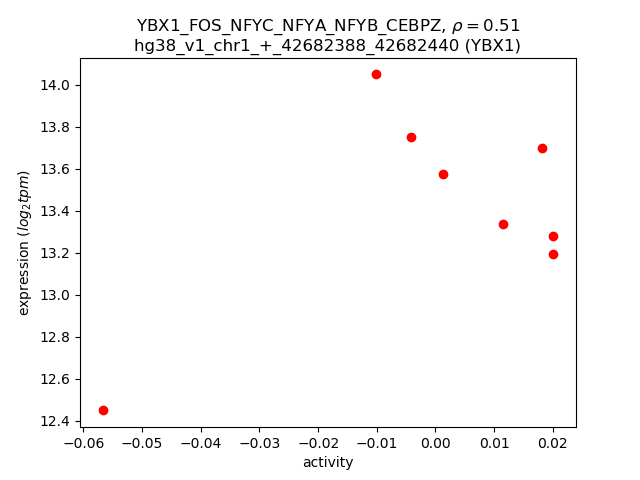
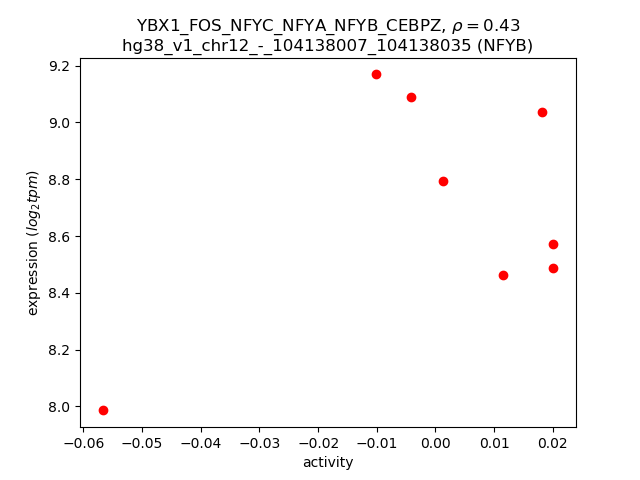
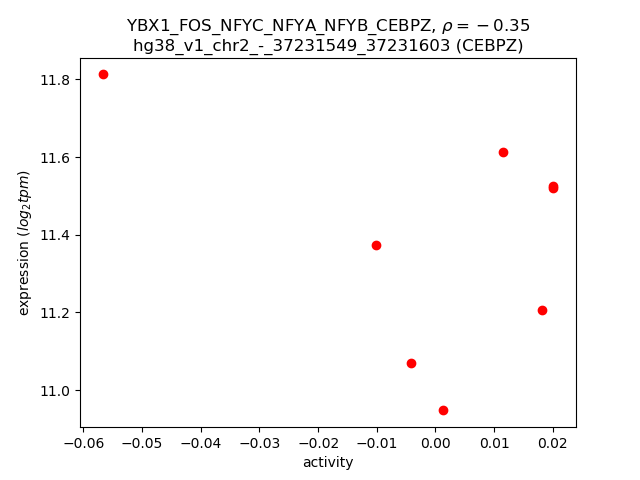
Activity-expression correlation:
| Gene | Promoter | Pearson corr. coef. | P-value | Plot |
|---|---|---|---|---|
| NFYA | hg38_v1_chr6_+_41072939_41072984 | 0.88 | 3.5e-03 | Click! |
| NFYC | hg38_v1_chr1_+_40738834_40738874 | 0.85 | 6.9e-03 | Click! |
| FOS | hg38_v1_chr14_+_75278820_75278977 | -0.68 | 6.5e-02 | Click! |
| YBX1 | hg38_v1_chr1_+_42682388_42682440 | 0.51 | 2.0e-01 | Click! |
| NFYB | hg38_v1_chr12_-_104138007_104138035 | 0.43 | 2.9e-01 | Click! |
| CEBPZ | hg38_v1_chr2_-_37231549_37231603 | -0.35 | 3.9e-01 | Click! |
Activity profile of YBX1_FOS_NFYC_NFYA_NFYB_CEBPZ motif
Sorted Z-values of YBX1_FOS_NFYC_NFYA_NFYB_CEBPZ motif
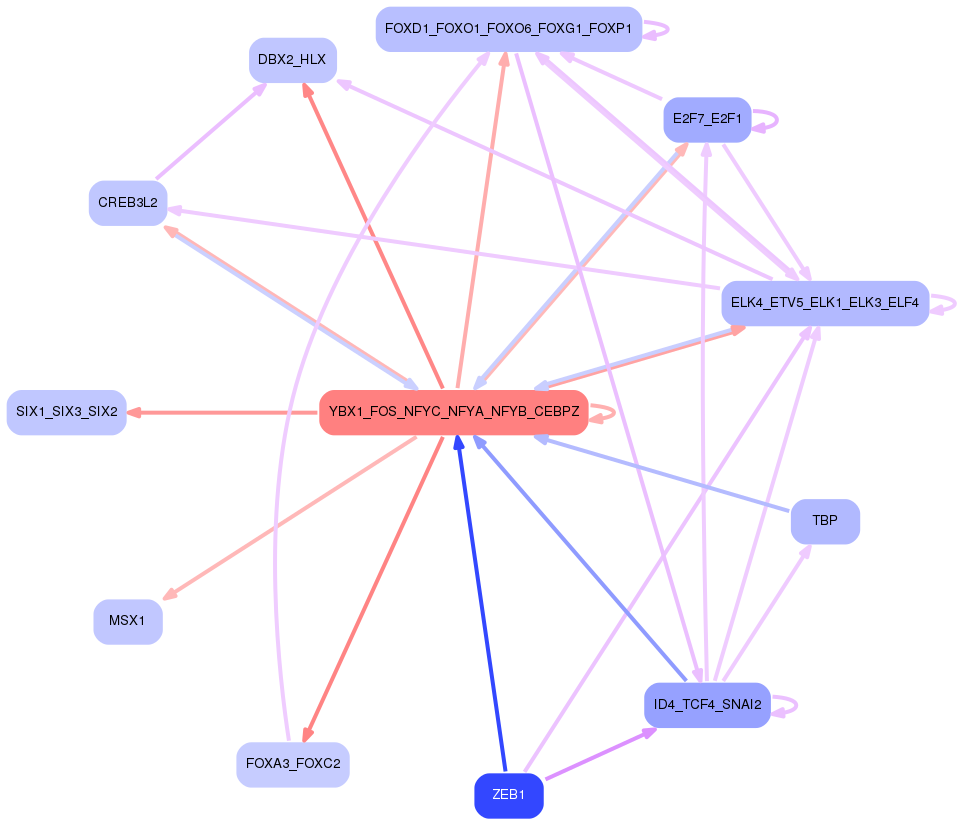
Network of associatons between targets according to the STRING database.

First level regulatory network of YBX1_FOS_NFYC_NFYA_NFYB_CEBPZ
Gene Ontology Analysis
Gene overrepresentation in biological process category:
| Log-likelihood per target | Total log-likelihood | Term | Description |
|---|---|---|---|
| 1.2 | 3.6 | GO:0035470 | positive regulation of vascular wound healing(GO:0035470) |
| 1.1 | 3.4 | GO:0006542 | glutamine biosynthetic process(GO:0006542) |
| 0.9 | 2.6 | GO:2000729 | positive regulation of mesenchymal cell proliferation involved in ureter development(GO:2000729) |
| 0.8 | 4.1 | GO:0046167 | glycerol-3-phosphate biosynthetic process(GO:0046167) |
| 0.8 | 0.8 | GO:0031443 | fast-twitch skeletal muscle fiber contraction(GO:0031443) |
| 0.8 | 2.3 | GO:0006393 | termination of mitochondrial transcription(GO:0006393) |
| 0.7 | 2.2 | GO:0072275 | positive regulation of metanephric mesenchymal cell migration by platelet-derived growth factor receptor-beta signaling pathway(GO:0035793) metanephric glomerulus morphogenesis(GO:0072275) metanephric glomerulus vasculature morphogenesis(GO:0072276) metanephric glomerular capillary formation(GO:0072277) regulation of metanephric mesenchymal cell migration by platelet-derived growth factor receptor-beta signaling pathway(GO:1900238) positive regulation of metanephric mesenchymal cell migration(GO:2000591) |
| 0.7 | 4.4 | GO:0043456 | regulation of pentose-phosphate shunt(GO:0043456) |
| 0.7 | 2.9 | GO:1990108 | protein linear deubiquitination(GO:1990108) |
| 0.7 | 2.1 | GO:0019287 | isopentenyl diphosphate biosynthetic process, mevalonate pathway(GO:0019287) |
| 0.7 | 2.8 | GO:0021816 | extension of a leading process involved in cell motility in cerebral cortex radial glia guided migration(GO:0021816) |
| 0.7 | 2.1 | GO:0060434 | bronchus morphogenesis(GO:0060434) |
| 0.7 | 5.4 | GO:0021678 | third ventricle development(GO:0021678) |
| 0.7 | 2.0 | GO:2000417 | negative regulation of eosinophil migration(GO:2000417) |
| 0.6 | 1.9 | GO:0071931 | positive regulation of transcription involved in G1/S transition of mitotic cell cycle(GO:0071931) |
| 0.6 | 1.9 | GO:0044691 | tooth eruption(GO:0044691) |
| 0.6 | 4.3 | GO:0045629 | negative regulation of T-helper 2 cell differentiation(GO:0045629) |
| 0.6 | 2.4 | GO:0006208 | pyrimidine nucleobase catabolic process(GO:0006208) thymine catabolic process(GO:0006210) thymine metabolic process(GO:0019859) |
| 0.6 | 3.0 | GO:0002904 | positive regulation of B cell apoptotic process(GO:0002904) |
| 0.6 | 1.8 | GO:0031550 | positive regulation of brain-derived neurotrophic factor receptor signaling pathway(GO:0031550) |
| 0.6 | 1.8 | GO:2000298 | regulation of Rho-dependent protein serine/threonine kinase activity(GO:2000298) |
| 0.6 | 1.8 | GO:1900126 | negative regulation of hyaluronan biosynthetic process(GO:1900126) |
| 0.6 | 2.3 | GO:0034241 | macrophage fusion(GO:0034238) regulation of macrophage fusion(GO:0034239) positive regulation of macrophage fusion(GO:0034241) |
| 0.6 | 1.7 | GO:1990086 | lens fiber cell apoptotic process(GO:1990086) |
| 0.6 | 3.9 | GO:0042078 | germ-line stem cell division(GO:0042078) male germ-line stem cell asymmetric division(GO:0048133) germline stem cell asymmetric division(GO:0098728) |
| 0.5 | 1.6 | GO:0010133 | proline catabolic process to glutamate(GO:0010133) |
| 0.5 | 1.6 | GO:0030327 | prenylated protein catabolic process(GO:0030327) |
| 0.5 | 1.5 | GO:0060823 | canonical Wnt signaling pathway involved in neural plate anterior/posterior pattern formation(GO:0060823) |
| 0.5 | 2.0 | GO:0051595 | response to methylglyoxal(GO:0051595) |
| 0.5 | 3.0 | GO:2000035 | regulation of stem cell division(GO:2000035) |
| 0.5 | 2.0 | GO:1903758 | regulation of transcription from RNA polymerase II promoter by histone modification(GO:1903756) negative regulation of transcription from RNA polymerase II promoter by histone modification(GO:1903758) |
| 0.5 | 1.5 | GO:1904253 | positive regulation of bile acid biosynthetic process(GO:0070859) positive regulation of bile acid metabolic process(GO:1904253) |
| 0.5 | 2.4 | GO:1902361 | mitochondrial pyruvate transport(GO:0006850) mitochondrial pyruvate transmembrane transport(GO:1902361) |
| 0.5 | 1.4 | GO:0046725 | negative regulation by virus of viral protein levels in host cell(GO:0046725) negative regulation of metanephric nephron tubule epithelial cell differentiation(GO:0072308) |
| 0.5 | 1.8 | GO:0009236 | cobalamin biosynthetic process(GO:0009236) |
| 0.5 | 4.5 | GO:0031536 | positive regulation of exit from mitosis(GO:0031536) |
| 0.4 | 2.7 | GO:0008218 | bioluminescence(GO:0008218) |
| 0.4 | 2.6 | GO:0006696 | ergosterol biosynthetic process(GO:0006696) ergosterol metabolic process(GO:0008204) |
| 0.4 | 3.4 | GO:0051414 | response to cortisol(GO:0051414) |
| 0.4 | 1.3 | GO:0008614 | pyridoxine metabolic process(GO:0008614) pyridoxine biosynthetic process(GO:0008615) vitamin B6 biosynthetic process(GO:0042819) |
| 0.4 | 2.1 | GO:0045338 | geranyl diphosphate metabolic process(GO:0033383) geranyl diphosphate biosynthetic process(GO:0033384) farnesyl diphosphate biosynthetic process(GO:0045337) farnesyl diphosphate metabolic process(GO:0045338) |
| 0.4 | 2.5 | GO:0097167 | circadian regulation of translation(GO:0097167) |
| 0.4 | 2.3 | GO:0003025 | regulation of systemic arterial blood pressure by baroreceptor feedback(GO:0003025) |
| 0.4 | 1.5 | GO:0002032 | desensitization of G-protein coupled receptor protein signaling pathway by arrestin(GO:0002032) |
| 0.4 | 1.1 | GO:1903526 | negative regulation of membrane tubulation(GO:1903526) |
| 0.4 | 2.3 | GO:0006842 | tricarboxylic acid transport(GO:0006842) citrate transport(GO:0015746) |
| 0.4 | 1.1 | GO:2000777 | positive regulation of proteasomal ubiquitin-dependent protein catabolic process involved in cellular response to hypoxia(GO:2000777) |
| 0.4 | 1.4 | GO:0033306 | phytol metabolic process(GO:0033306) fatty alcohol metabolic process(GO:1903173) |
| 0.4 | 0.4 | GO:0016476 | regulation of embryonic cell shape(GO:0016476) |
| 0.3 | 1.4 | GO:0035880 | embryonic nail plate morphogenesis(GO:0035880) activation of meiosis(GO:0090427) |
| 0.3 | 1.0 | GO:0098746 | fast, calcium ion-dependent exocytosis of neurotransmitter(GO:0098746) |
| 0.3 | 1.0 | GO:0010735 | positive regulation of transcription via serum response element binding(GO:0010735) |
| 0.3 | 2.0 | GO:0097498 | endothelial tube lumen extension(GO:0097498) |
| 0.3 | 1.0 | GO:1902024 | histidine transport(GO:0015817) L-histidine transmembrane transport(GO:0089709) L-histidine transport(GO:1902024) L-arginine transmembrane transport(GO:1903400) |
| 0.3 | 2.6 | GO:0060154 | cellular process regulating host cell cycle in response to virus(GO:0060154) |
| 0.3 | 3.3 | GO:0071492 | cellular response to UV-A(GO:0071492) |
| 0.3 | 1.3 | GO:0030047 | actin modification(GO:0030047) |
| 0.3 | 1.0 | GO:0090076 | relaxation of skeletal muscle(GO:0090076) |
| 0.3 | 1.0 | GO:0006233 | dUDP biosynthetic process(GO:0006227) dTDP biosynthetic process(GO:0006233) pyrimidine nucleoside diphosphate biosynthetic process(GO:0009139) pyrimidine deoxyribonucleoside diphosphate metabolic process(GO:0009196) pyrimidine deoxyribonucleoside diphosphate biosynthetic process(GO:0009197) dTDP metabolic process(GO:0046072) dUDP metabolic process(GO:0046077) |
| 0.3 | 1.0 | GO:0050993 | dimethylallyl diphosphate biosynthetic process(GO:0050992) dimethylallyl diphosphate metabolic process(GO:0050993) |
| 0.3 | 0.9 | GO:0099403 | negative regulation of maintenance of sister chromatid cohesion(GO:0034092) negative regulation of maintenance of mitotic sister chromatid cohesion(GO:0034183) maintenance of mitotic sister chromatid cohesion, telomeric(GO:0099403) mitotic sister chromatid cohesion, telomeric(GO:0099404) regulation of maintenance of mitotic sister chromatid cohesion, telomeric(GO:1904907) negative regulation of maintenance of mitotic sister chromatid cohesion, telomeric(GO:1904908) |
| 0.3 | 2.2 | GO:0071896 | protein localization to adherens junction(GO:0071896) |
| 0.3 | 0.6 | GO:0009085 | lysine biosynthetic process(GO:0009085) lysine biosynthetic process via aminoadipic acid(GO:0019878) |
| 0.3 | 1.2 | GO:2000984 | regulation of ATP citrate synthase activity(GO:2000983) negative regulation of ATP citrate synthase activity(GO:2000984) |
| 0.3 | 1.8 | GO:0006064 | glucuronate catabolic process(GO:0006064) glucuronate catabolic process to xylulose 5-phosphate(GO:0019640) xylulose 5-phosphate metabolic process(GO:0051167) xylulose 5-phosphate biosynthetic process(GO:1901159) |
| 0.3 | 0.9 | GO:0002317 | plasma cell differentiation(GO:0002317) |
| 0.3 | 1.8 | GO:0051012 | microtubule sliding(GO:0051012) |
| 0.3 | 1.2 | GO:0033122 | negative regulation of cyclic nucleotide catabolic process(GO:0030806) negative regulation of cAMP catabolic process(GO:0030821) negative regulation of purine nucleotide catabolic process(GO:0033122) |
| 0.3 | 2.0 | GO:0051684 | maintenance of Golgi location(GO:0051684) |
| 0.3 | 0.9 | GO:1902728 | positive regulation of skeletal muscle cell proliferation(GO:0014858) positive regulation of skeletal muscle satellite cell proliferation(GO:1902724) positive regulation of growth factor dependent skeletal muscle satellite cell proliferation(GO:1902728) |
| 0.3 | 1.4 | GO:0010814 | substance P catabolic process(GO:0010814) calcitonin catabolic process(GO:0010816) endothelin maturation(GO:0034959) |
| 0.3 | 5.1 | GO:0051988 | regulation of attachment of spindle microtubules to kinetochore(GO:0051988) |
| 0.3 | 1.7 | GO:1902897 | regulation of postsynaptic density protein 95 clustering(GO:1902897) |
| 0.3 | 1.1 | GO:0001927 | exocyst assembly(GO:0001927) |
| 0.3 | 2.4 | GO:0034723 | DNA replication-dependent nucleosome assembly(GO:0006335) DNA replication-dependent nucleosome organization(GO:0034723) |
| 0.3 | 1.0 | GO:1904428 | negative regulation of tubulin deacetylation(GO:1904428) |
| 0.3 | 0.3 | GO:0021555 | midbrain-hindbrain boundary morphogenesis(GO:0021555) |
| 0.3 | 1.3 | GO:0044240 | multicellular organism lipid catabolic process(GO:0044240) |
| 0.3 | 0.8 | GO:0035720 | intraciliary anterograde transport(GO:0035720) |
| 0.2 | 0.5 | GO:0010520 | regulation of reciprocal meiotic recombination(GO:0010520) |
| 0.2 | 1.2 | GO:0042822 | pyridoxal phosphate metabolic process(GO:0042822) |
| 0.2 | 3.2 | GO:0015939 | pantothenate metabolic process(GO:0015939) |
| 0.2 | 1.0 | GO:0019401 | alditol biosynthetic process(GO:0019401) |
| 0.2 | 0.7 | GO:0035494 | SNARE complex disassembly(GO:0035494) |
| 0.2 | 2.8 | GO:1905098 | negative regulation of guanyl-nucleotide exchange factor activity(GO:1905098) |
| 0.2 | 0.7 | GO:0042939 | glutathione transport(GO:0034635) tripeptide transport(GO:0042939) |
| 0.2 | 0.9 | GO:0035519 | protein K29-linked ubiquitination(GO:0035519) |
| 0.2 | 0.7 | GO:0014854 | response to inactivity(GO:0014854) |
| 0.2 | 2.0 | GO:0055129 | L-proline biosynthetic process(GO:0055129) |
| 0.2 | 0.9 | GO:0003285 | septum secundum development(GO:0003285) |
| 0.2 | 0.7 | GO:1904761 | negative regulation of myofibroblast differentiation(GO:1904761) |
| 0.2 | 0.7 | GO:0080154 | regulation of fertilization(GO:0080154) |
| 0.2 | 0.9 | GO:0014053 | negative regulation of gamma-aminobutyric acid secretion(GO:0014053) aspartate secretion(GO:0061528) regulation of aspartate secretion(GO:1904448) positive regulation of aspartate secretion(GO:1904450) |
| 0.2 | 0.2 | GO:0009957 | epidermal cell fate specification(GO:0009957) |
| 0.2 | 0.8 | GO:1900169 | regulation of glucocorticoid mediated signaling pathway(GO:1900169) |
| 0.2 | 0.8 | GO:0070885 | negative regulation of calcineurin-NFAT signaling cascade(GO:0070885) |
| 0.2 | 0.2 | GO:1903031 | regulation of microtubule plus-end binding(GO:1903031) positive regulation of microtubule plus-end binding(GO:1903033) |
| 0.2 | 0.6 | GO:0046709 | IDP metabolic process(GO:0046707) IDP catabolic process(GO:0046709) |
| 0.2 | 1.0 | GO:0061030 | epithelial cell differentiation involved in mammary gland alveolus development(GO:0061030) |
| 0.2 | 0.4 | GO:0098989 | NMDA selective glutamate receptor signaling pathway(GO:0098989) |
| 0.2 | 0.6 | GO:1903538 | meiotic spindle elongation(GO:0051232) meiotic cell cycle process involved in oocyte maturation(GO:1903537) regulation of meiotic cell cycle process involved in oocyte maturation(GO:1903538) |
| 0.2 | 0.6 | GO:0051596 | methylglyoxal catabolic process to D-lactate via S-lactoyl-glutathione(GO:0019243) methylglyoxal catabolic process(GO:0051596) methylglyoxal catabolic process to lactate(GO:0061727) |
| 0.2 | 1.6 | GO:1903300 | negative regulation of glucokinase activity(GO:0033132) negative regulation of hexokinase activity(GO:1903300) |
| 0.2 | 0.6 | GO:0007057 | spindle assembly involved in female meiosis I(GO:0007057) |
| 0.2 | 0.4 | GO:2000820 | negative regulation of transcription from RNA polymerase II promoter involved in smooth muscle cell differentiation(GO:2000820) |
| 0.2 | 2.7 | GO:0007288 | sperm axoneme assembly(GO:0007288) |
| 0.2 | 0.4 | GO:0006106 | fumarate metabolic process(GO:0006106) |
| 0.2 | 0.6 | GO:0036071 | N-glycan fucosylation(GO:0036071) |
| 0.2 | 0.6 | GO:0007525 | somatic muscle development(GO:0007525) |
| 0.2 | 1.1 | GO:2000042 | negative regulation of double-strand break repair via homologous recombination(GO:2000042) |
| 0.2 | 1.3 | GO:0032000 | positive regulation of fatty acid beta-oxidation(GO:0032000) |
| 0.2 | 0.4 | GO:0036292 | DNA rewinding(GO:0036292) |
| 0.2 | 0.4 | GO:1901355 | response to rapamycin(GO:1901355) |
| 0.2 | 0.2 | GO:0061043 | regulation of vascular wound healing(GO:0061043) |
| 0.2 | 0.9 | GO:0061084 | regulation of protein refolding(GO:0061083) negative regulation of protein refolding(GO:0061084) |
| 0.2 | 0.5 | GO:0030718 | germ-line stem cell population maintenance(GO:0030718) |
| 0.2 | 1.0 | GO:0048861 | leukemia inhibitory factor signaling pathway(GO:0048861) |
| 0.2 | 0.5 | GO:1901301 | regulation of cargo loading into COPII-coated vesicle(GO:1901301) |
| 0.2 | 1.7 | GO:0006627 | protein processing involved in protein targeting to mitochondrion(GO:0006627) |
| 0.2 | 1.4 | GO:0006880 | intracellular sequestering of iron ion(GO:0006880) sequestering of iron ion(GO:0097577) |
| 0.2 | 0.8 | GO:0045204 | MAPK export from nucleus(GO:0045204) |
| 0.2 | 1.3 | GO:1904431 | positive regulation of t-circle formation(GO:1904431) |
| 0.2 | 2.2 | GO:0014877 | response to muscle inactivity involved in regulation of muscle adaptation(GO:0014877) response to denervation involved in regulation of muscle adaptation(GO:0014894) |
| 0.2 | 1.2 | GO:0016584 | nucleosome positioning(GO:0016584) |
| 0.2 | 1.6 | GO:0001886 | endothelial cell morphogenesis(GO:0001886) |
| 0.2 | 5.0 | GO:0060716 | labyrinthine layer blood vessel development(GO:0060716) |
| 0.2 | 6.7 | GO:0071711 | basement membrane organization(GO:0071711) |
| 0.2 | 1.3 | GO:0045002 | double-strand break repair via single-strand annealing(GO:0045002) |
| 0.2 | 0.2 | GO:1902445 | regulation of mitochondrial membrane permeability involved in programmed necrotic cell death(GO:1902445) |
| 0.2 | 1.9 | GO:0045835 | negative regulation of meiotic nuclear division(GO:0045835) |
| 0.2 | 0.5 | GO:0019626 | short-chain fatty acid catabolic process(GO:0019626) |
| 0.2 | 0.8 | GO:0097368 | establishment of Sertoli cell barrier(GO:0097368) |
| 0.2 | 0.3 | GO:0070318 | positive regulation of G0 to G1 transition(GO:0070318) |
| 0.2 | 0.2 | GO:0006059 | hexitol metabolic process(GO:0006059) |
| 0.2 | 0.5 | GO:0009996 | negative regulation of cell fate specification(GO:0009996) |
| 0.2 | 2.0 | GO:0007042 | lysosomal lumen acidification(GO:0007042) |
| 0.2 | 1.1 | GO:0090166 | Golgi disassembly(GO:0090166) |
| 0.2 | 0.5 | GO:0006566 | threonine metabolic process(GO:0006566) |
| 0.2 | 0.5 | GO:0021849 | neuroblast division in subventricular zone(GO:0021849) |
| 0.1 | 8.7 | GO:0045744 | negative regulation of G-protein coupled receptor protein signaling pathway(GO:0045744) |
| 0.1 | 0.4 | GO:0036388 | pre-replicative complex assembly involved in nuclear cell cycle DNA replication(GO:0006267) pre-replicative complex assembly(GO:0036388) pre-replicative complex assembly involved in cell cycle DNA replication(GO:1902299) |
| 0.1 | 2.7 | GO:0016446 | somatic hypermutation of immunoglobulin genes(GO:0016446) |
| 0.1 | 1.6 | GO:0031087 | deadenylation-independent decapping of nuclear-transcribed mRNA(GO:0031087) |
| 0.1 | 0.4 | GO:0071877 | regulation of adrenergic receptor signaling pathway(GO:0071877) |
| 0.1 | 0.7 | GO:0034421 | post-translational protein acetylation(GO:0034421) |
| 0.1 | 2.7 | GO:0042424 | catechol-containing compound catabolic process(GO:0019614) catecholamine catabolic process(GO:0042424) |
| 0.1 | 1.0 | GO:0051344 | negative regulation of cyclic-nucleotide phosphodiesterase activity(GO:0051344) |
| 0.1 | 0.7 | GO:0007571 | age-dependent response to oxidative stress(GO:0001306) age-dependent response to reactive oxygen species(GO:0001315) regulation of systemic arterial blood pressure by acetylcholine(GO:0003068) vasodilation by acetylcholine involved in regulation of systemic arterial blood pressure(GO:0003069) regulation of systemic arterial blood pressure by neurotransmitter(GO:0003070) age-dependent general metabolic decline(GO:0007571) |
| 0.1 | 3.7 | GO:0034063 | stress granule assembly(GO:0034063) |
| 0.1 | 0.7 | GO:2000467 | positive regulation of glycogen (starch) synthase activity(GO:2000467) |
| 0.1 | 0.6 | GO:0009786 | regulation of asymmetric cell division(GO:0009786) |
| 0.1 | 0.7 | GO:0015808 | L-alanine transport(GO:0015808) |
| 0.1 | 0.4 | GO:0032289 | central nervous system myelin formation(GO:0032289) |
| 0.1 | 7.7 | GO:0035735 | intraciliary transport involved in cilium morphogenesis(GO:0035735) |
| 0.1 | 0.4 | GO:0021524 | visceral motor neuron differentiation(GO:0021524) |
| 0.1 | 1.0 | GO:0070562 | regulation of vitamin D receptor signaling pathway(GO:0070562) |
| 0.1 | 0.8 | GO:0051490 | negative regulation of filopodium assembly(GO:0051490) |
| 0.1 | 0.9 | GO:0007023 | post-chaperonin tubulin folding pathway(GO:0007023) |
| 0.1 | 5.0 | GO:2001275 | positive regulation of glucose import in response to insulin stimulus(GO:2001275) |
| 0.1 | 1.3 | GO:0007621 | negative regulation of female receptivity(GO:0007621) |
| 0.1 | 1.0 | GO:2001033 | negative regulation of double-strand break repair via nonhomologous end joining(GO:2001033) |
| 0.1 | 1.3 | GO:0046959 | habituation(GO:0046959) |
| 0.1 | 4.1 | GO:0051457 | maintenance of protein location in nucleus(GO:0051457) |
| 0.1 | 1.9 | GO:0000338 | protein deneddylation(GO:0000338) |
| 0.1 | 0.1 | GO:0051365 | cellular response to potassium ion starvation(GO:0051365) |
| 0.1 | 0.4 | GO:0072023 | thick ascending limb development(GO:0072023) metanephric thick ascending limb development(GO:0072233) |
| 0.1 | 1.5 | GO:0007097 | nuclear migration(GO:0007097) |
| 0.1 | 0.9 | GO:0016344 | meiotic chromosome movement towards spindle pole(GO:0016344) |
| 0.1 | 1.0 | GO:0045876 | positive regulation of sister chromatid cohesion(GO:0045876) |
| 0.1 | 0.5 | GO:0036369 | transcription factor catabolic process(GO:0036369) |
| 0.1 | 0.4 | GO:0010808 | positive regulation of synaptic vesicle priming(GO:0010808) |
| 0.1 | 2.7 | GO:0036109 | alpha-linolenic acid metabolic process(GO:0036109) |
| 0.1 | 5.5 | GO:0006336 | DNA replication-independent nucleosome assembly(GO:0006336) |
| 0.1 | 0.8 | GO:0018406 | protein C-linked glycosylation(GO:0018103) peptidyl-tryptophan modification(GO:0018211) protein C-linked glycosylation via tryptophan(GO:0018317) protein C-linked glycosylation via 2'-alpha-mannosyl-L-tryptophan(GO:0018406) |
| 0.1 | 0.5 | GO:1903755 | regulation of SUMO transferase activity(GO:1903182) positive regulation of SUMO transferase activity(GO:1903755) |
| 0.1 | 0.6 | GO:0001554 | luteolysis(GO:0001554) |
| 0.1 | 0.1 | GO:1903438 | regulation of cytokinetic process(GO:0032954) regulation of mitotic cytokinetic process(GO:1903436) positive regulation of mitotic cytokinetic process(GO:1903438) positive regulation of mitotic cytokinesis(GO:1903490) |
| 0.1 | 0.4 | GO:0019520 | aldonic acid metabolic process(GO:0019520) D-gluconate metabolic process(GO:0019521) |
| 0.1 | 0.5 | GO:1900224 | positive regulation of nodal signaling pathway involved in determination of lateral mesoderm left/right asymmetry(GO:1900224) |
| 0.1 | 2.3 | GO:0034497 | protein localization to pre-autophagosomal structure(GO:0034497) |
| 0.1 | 0.5 | GO:0032474 | otolith morphogenesis(GO:0032474) |
| 0.1 | 1.0 | GO:0030263 | apoptotic chromosome condensation(GO:0030263) regulation of single stranded viral RNA replication via double stranded DNA intermediate(GO:0045091) |
| 0.1 | 0.8 | GO:0060414 | aorta smooth muscle tissue morphogenesis(GO:0060414) |
| 0.1 | 0.7 | GO:1903377 | negative regulation of oxidative stress-induced neuron intrinsic apoptotic signaling pathway(GO:1903377) |
| 0.1 | 3.2 | GO:0033234 | negative regulation of protein sumoylation(GO:0033234) |
| 0.1 | 0.7 | GO:0006564 | L-serine biosynthetic process(GO:0006564) |
| 0.1 | 0.6 | GO:0006574 | valine catabolic process(GO:0006574) |
| 0.1 | 0.4 | GO:0043137 | DNA replication, removal of RNA primer(GO:0043137) |
| 0.1 | 0.9 | GO:0051415 | interphase microtubule nucleation by interphase microtubule organizing center(GO:0051415) microtubule nucleation by microtubule organizing center(GO:0051418) |
| 0.1 | 1.7 | GO:1900747 | negative regulation of vascular endothelial growth factor signaling pathway(GO:1900747) |
| 0.1 | 0.2 | GO:1902732 | positive regulation of chondrocyte proliferation(GO:1902732) |
| 0.1 | 2.6 | GO:0016558 | protein import into peroxisome matrix(GO:0016558) |
| 0.1 | 0.1 | GO:1902512 | positive regulation of apoptotic DNA fragmentation(GO:1902512) |
| 0.1 | 2.1 | GO:0043486 | histone exchange(GO:0043486) |
| 0.1 | 0.6 | GO:0019255 | glucose 1-phosphate metabolic process(GO:0019255) |
| 0.1 | 0.4 | GO:0043314 | negative regulation of neutrophil degranulation(GO:0043314) |
| 0.1 | 0.7 | GO:0010989 | negative regulation of low-density lipoprotein particle clearance(GO:0010989) |
| 0.1 | 2.9 | GO:0048240 | sperm capacitation(GO:0048240) |
| 0.1 | 1.0 | GO:0010756 | positive regulation of plasminogen activation(GO:0010756) |
| 0.1 | 0.2 | GO:0006982 | response to lipid hydroperoxide(GO:0006982) |
| 0.1 | 0.5 | GO:0019075 | virus maturation(GO:0019075) |
| 0.1 | 2.3 | GO:0007035 | vacuolar acidification(GO:0007035) |
| 0.1 | 1.7 | GO:0035520 | monoubiquitinated protein deubiquitination(GO:0035520) |
| 0.1 | 0.4 | GO:0048808 | male genitalia morphogenesis(GO:0048808) male anatomical structure morphogenesis(GO:0090598) |
| 0.1 | 0.6 | GO:0019264 | glycine biosynthetic process from serine(GO:0019264) |
| 0.1 | 1.4 | GO:0060155 | platelet dense granule organization(GO:0060155) |
| 0.1 | 1.8 | GO:0033539 | fatty acid beta-oxidation using acyl-CoA dehydrogenase(GO:0033539) |
| 0.1 | 0.7 | GO:0002254 | kinin cascade(GO:0002254) plasma kallikrein-kinin cascade(GO:0002353) |
| 0.1 | 0.1 | GO:1904030 | negative regulation of cyclin-dependent protein kinase activity(GO:1904030) |
| 0.1 | 1.0 | GO:2000795 | negative regulation of epithelial cell proliferation involved in lung morphogenesis(GO:2000795) |
| 0.1 | 0.5 | GO:0061762 | CAMKK-AMPK signaling cascade(GO:0061762) |
| 0.1 | 0.1 | GO:1901421 | positive regulation of response to alcohol(GO:1901421) |
| 0.1 | 0.4 | GO:0009298 | GDP-mannose biosynthetic process(GO:0009298) |
| 0.1 | 0.3 | GO:0033364 | mast cell secretory granule organization(GO:0033364) |
| 0.1 | 2.3 | GO:1900745 | positive regulation of p38MAPK cascade(GO:1900745) |
| 0.1 | 2.9 | GO:0002347 | response to tumor cell(GO:0002347) |
| 0.1 | 0.9 | GO:0072662 | protein targeting to peroxisome(GO:0006625) peroxisomal transport(GO:0043574) protein localization to peroxisome(GO:0072662) establishment of protein localization to peroxisome(GO:0072663) |
| 0.1 | 0.4 | GO:0009440 | cyanate metabolic process(GO:0009439) cyanate catabolic process(GO:0009440) |
| 0.1 | 3.0 | GO:0032201 | telomere maintenance via semi-conservative replication(GO:0032201) |
| 0.1 | 1.4 | GO:0061158 | 3'-UTR-mediated mRNA destabilization(GO:0061158) |
| 0.1 | 0.5 | GO:0035935 | androgen secretion(GO:0035935) regulation of androgen secretion(GO:2000834) positive regulation of androgen secretion(GO:2000836) |
| 0.1 | 0.2 | GO:0071930 | negative regulation of transcription involved in G1/S transition of mitotic cell cycle(GO:0071930) |
| 0.1 | 0.4 | GO:0002331 | pre-B cell allelic exclusion(GO:0002331) |
| 0.1 | 10.2 | GO:0000079 | regulation of cyclin-dependent protein serine/threonine kinase activity(GO:0000079) |
| 0.1 | 0.3 | GO:0007161 | calcium-independent cell-matrix adhesion(GO:0007161) interaction with other organism via secreted substance involved in symbiotic interaction(GO:0052047) |
| 0.1 | 0.8 | GO:0019532 | oxalate transport(GO:0019532) |
| 0.1 | 0.3 | GO:0043375 | regulation of nitrogen utilization(GO:0006808) nitrogen utilization(GO:0019740) cochlear nucleus development(GO:0021747) negative regulation of cellular pH reduction(GO:0032848) CD8-positive, alpha-beta T cell lineage commitment(GO:0043375) negative regulation of retinal cell programmed cell death(GO:0046671) |
| 0.1 | 0.8 | GO:0046125 | thymidine metabolic process(GO:0046104) pyrimidine deoxyribonucleoside metabolic process(GO:0046125) |
| 0.1 | 0.8 | GO:0048194 | Golgi vesicle budding(GO:0048194) |
| 0.1 | 0.3 | GO:0035750 | protein localization to myelin sheath abaxonal region(GO:0035750) |
| 0.1 | 0.8 | GO:0046618 | drug export(GO:0046618) |
| 0.1 | 0.3 | GO:0018125 | peptidyl-cysteine methylation(GO:0018125) |
| 0.1 | 0.3 | GO:1904381 | Golgi apparatus mannose trimming(GO:1904381) |
| 0.1 | 2.4 | GO:0051497 | negative regulation of stress fiber assembly(GO:0051497) |
| 0.1 | 1.2 | GO:0090110 | cargo loading into COPII-coated vesicle(GO:0090110) |
| 0.1 | 0.2 | GO:2000646 | positive regulation of receptor catabolic process(GO:2000646) |
| 0.1 | 1.9 | GO:0000920 | cell separation after cytokinesis(GO:0000920) |
| 0.1 | 0.2 | GO:1901860 | positive regulation of mitochondrial DNA metabolic process(GO:1901860) |
| 0.1 | 0.6 | GO:1902857 | positive regulation of nonmotile primary cilium assembly(GO:1902857) |
| 0.1 | 0.6 | GO:0006102 | isocitrate metabolic process(GO:0006102) |
| 0.1 | 0.3 | GO:0009447 | putrescine catabolic process(GO:0009447) |
| 0.1 | 0.5 | GO:0007079 | mitotic chromosome movement towards spindle pole(GO:0007079) |
| 0.1 | 1.3 | GO:0034453 | microtubule anchoring(GO:0034453) |
| 0.1 | 1.0 | GO:0019695 | choline metabolic process(GO:0019695) |
| 0.1 | 1.2 | GO:2001256 | regulation of store-operated calcium entry(GO:2001256) |
| 0.1 | 1.9 | GO:0071447 | cellular response to hydroperoxide(GO:0071447) |
| 0.1 | 0.3 | GO:0051754 | meiotic sister chromatid cohesion, centromeric(GO:0051754) |
| 0.1 | 0.2 | GO:1904772 | hepatocyte homeostasis(GO:0036333) response to tetrachloromethane(GO:1904772) |
| 0.1 | 0.5 | GO:1901552 | positive regulation of endothelial cell development(GO:1901552) positive regulation of establishment of endothelial barrier(GO:1903142) |
| 0.1 | 0.4 | GO:2000327 | nuclear-transcribed mRNA catabolic process, no-go decay(GO:0070966) regulation of ligand-dependent nuclear receptor transcription coactivator activity(GO:2000325) positive regulation of ligand-dependent nuclear receptor transcription coactivator activity(GO:2000327) |
| 0.1 | 0.3 | GO:0030070 | insulin processing(GO:0030070) |
| 0.1 | 0.1 | GO:0035963 | cellular response to interleukin-13(GO:0035963) |
| 0.1 | 0.8 | GO:1902669 | positive regulation of axon guidance(GO:1902669) |
| 0.1 | 0.7 | GO:0006610 | ribosomal protein import into nucleus(GO:0006610) |
| 0.1 | 0.2 | GO:0060382 | release from viral latency(GO:0019046) regulation of DNA strand elongation(GO:0060382) |
| 0.1 | 0.2 | GO:2000118 | regulation of sodium-dependent phosphate transport(GO:2000118) |
| 0.1 | 0.4 | GO:0010216 | maintenance of DNA methylation(GO:0010216) |
| 0.1 | 0.1 | GO:1904526 | regulation of microtubule binding(GO:1904526) |
| 0.1 | 0.1 | GO:0072019 | proximal convoluted tubule development(GO:0072019) metanephric proximal convoluted tubule development(GO:0072229) metanephric proximal tubule development(GO:0072237) |
| 0.1 | 1.1 | GO:0061157 | mRNA destabilization(GO:0061157) |
| 0.1 | 0.7 | GO:2000774 | positive regulation of cellular senescence(GO:2000774) |
| 0.1 | 0.1 | GO:0071698 | olfactory placode formation(GO:0030910) olfactory placode development(GO:0071698) olfactory placode morphogenesis(GO:0071699) |
| 0.1 | 4.0 | GO:0006334 | nucleosome assembly(GO:0006334) |
| 0.1 | 0.2 | GO:0090365 | regulation of mRNA modification(GO:0090365) |
| 0.1 | 0.3 | GO:0071418 | cellular response to amine stimulus(GO:0071418) |
| 0.1 | 0.3 | GO:0051037 | regulation of transcription involved in meiotic cell cycle(GO:0051037) |
| 0.1 | 0.8 | GO:2000574 | regulation of microtubule motor activity(GO:2000574) |
| 0.1 | 0.5 | GO:2000324 | positive regulation of glucocorticoid receptor signaling pathway(GO:2000324) |
| 0.1 | 1.3 | GO:0032780 | negative regulation of ATPase activity(GO:0032780) |
| 0.1 | 0.7 | GO:0071394 | cellular response to testosterone stimulus(GO:0071394) |
| 0.1 | 1.0 | GO:0051895 | negative regulation of focal adhesion assembly(GO:0051895) |
| 0.1 | 3.6 | GO:0015701 | bicarbonate transport(GO:0015701) |
| 0.1 | 1.7 | GO:0070208 | protein heterotrimerization(GO:0070208) |
| 0.1 | 1.2 | GO:0018026 | peptidyl-lysine monomethylation(GO:0018026) |
| 0.1 | 0.1 | GO:0090116 | C-5 methylation of cytosine(GO:0090116) |
| 0.1 | 0.2 | GO:2000374 | regulation of oxygen metabolic process(GO:2000374) |
| 0.1 | 0.5 | GO:0035583 | sequestering of TGFbeta in extracellular matrix(GO:0035583) |
| 0.1 | 0.1 | GO:1990166 | protein localization to site of double-strand break(GO:1990166) |
| 0.1 | 0.3 | GO:0019086 | late viral transcription(GO:0019086) |
| 0.1 | 0.1 | GO:0060932 | His-Purkinje system cell differentiation(GO:0060932) |
| 0.1 | 0.7 | GO:0061087 | positive regulation of histone H3-K27 methylation(GO:0061087) |
| 0.1 | 0.7 | GO:0001955 | blood vessel maturation(GO:0001955) |
| 0.1 | 0.7 | GO:0070911 | global genome nucleotide-excision repair(GO:0070911) |
| 0.1 | 0.3 | GO:0032287 | peripheral nervous system myelin maintenance(GO:0032287) |
| 0.1 | 0.3 | GO:1903232 | melanosome assembly(GO:1903232) |
| 0.1 | 0.1 | GO:0045836 | positive regulation of meiotic nuclear division(GO:0045836) |
| 0.1 | 0.1 | GO:0015744 | succinate transport(GO:0015744) succinate transmembrane transport(GO:0071422) |
| 0.1 | 0.4 | GO:0070272 | proton-transporting ATP synthase complex assembly(GO:0043461) proton-transporting ATP synthase complex biogenesis(GO:0070272) |
| 0.1 | 0.9 | GO:0010642 | negative regulation of platelet-derived growth factor receptor signaling pathway(GO:0010642) |
| 0.1 | 1.9 | GO:0070886 | positive regulation of calcineurin-NFAT signaling cascade(GO:0070886) |
| 0.1 | 0.7 | GO:2000096 | positive regulation of Wnt signaling pathway, planar cell polarity pathway(GO:2000096) |
| 0.1 | 0.2 | GO:1904045 | cellular response to aldosterone(GO:1904045) |
| 0.1 | 0.6 | GO:0030578 | PML body organization(GO:0030578) |
| 0.1 | 0.4 | GO:0060252 | positive regulation of glial cell proliferation(GO:0060252) |
| 0.1 | 2.5 | GO:0043928 | exonucleolytic nuclear-transcribed mRNA catabolic process involved in deadenylation-dependent decay(GO:0043928) |
| 0.1 | 1.3 | GO:0006607 | NLS-bearing protein import into nucleus(GO:0006607) |
| 0.1 | 0.2 | GO:0038178 | complement component C5a signaling pathway(GO:0038178) |
| 0.1 | 0.4 | GO:0045793 | positive regulation of cell size(GO:0045793) |
| 0.1 | 0.3 | GO:0051256 | mitotic spindle midzone assembly(GO:0051256) |
| 0.1 | 1.0 | GO:0009642 | response to light intensity(GO:0009642) cellular response to cholesterol(GO:0071397) |
| 0.1 | 0.2 | GO:0019418 | sulfide oxidation(GO:0019418) sulfide oxidation, using sulfide:quinone oxidoreductase(GO:0070221) |
| 0.1 | 0.7 | GO:0070884 | regulation of calcineurin-NFAT signaling cascade(GO:0070884) |
| 0.1 | 1.6 | GO:0045005 | DNA-dependent DNA replication maintenance of fidelity(GO:0045005) |
| 0.1 | 0.6 | GO:2000781 | positive regulation of double-strand break repair(GO:2000781) |
| 0.1 | 0.4 | GO:0097500 | receptor localization to nonmotile primary cilium(GO:0097500) |
| 0.1 | 0.2 | GO:0034124 | regulation of MyD88-dependent toll-like receptor signaling pathway(GO:0034124) |
| 0.1 | 0.6 | GO:0017062 | respiratory chain complex III assembly(GO:0017062) mitochondrial respiratory chain complex III assembly(GO:0034551) |
| 0.1 | 0.3 | GO:0036072 | intramembranous ossification(GO:0001957) direct ossification(GO:0036072) |
| 0.1 | 0.6 | GO:0072344 | rescue of stalled ribosome(GO:0072344) |
| 0.1 | 5.8 | GO:0032392 | DNA geometric change(GO:0032392) |
| 0.1 | 0.5 | GO:0015840 | urea transport(GO:0015840) |
| 0.1 | 0.2 | GO:0071284 | cellular response to lead ion(GO:0071284) |
| 0.1 | 0.1 | GO:0035751 | regulation of lysosomal lumen pH(GO:0035751) |
| 0.1 | 0.1 | GO:0006287 | base-excision repair, gap-filling(GO:0006287) |
| 0.1 | 0.1 | GO:2001032 | regulation of double-strand break repair via nonhomologous end joining(GO:2001032) |
| 0.1 | 0.4 | GO:0030643 | cellular phosphate ion homeostasis(GO:0030643) cellular trivalent inorganic anion homeostasis(GO:0072502) |
| 0.1 | 0.6 | GO:0048251 | elastic fiber assembly(GO:0048251) |
| 0.1 | 3.4 | GO:0035307 | positive regulation of dephosphorylation(GO:0035306) positive regulation of protein dephosphorylation(GO:0035307) |
| 0.1 | 0.2 | GO:0060437 | negative regulation of neurotrophin TRK receptor signaling pathway(GO:0051387) lung growth(GO:0060437) |
| 0.1 | 0.2 | GO:0003408 | optic cup formation involved in camera-type eye development(GO:0003408) |
| 0.1 | 0.1 | GO:0072209 | glial cell-derived neurotrophic factor secretion(GO:0044467) positive regulation of granulocyte colony-stimulating factor production(GO:0071657) metanephric mesangial cell differentiation(GO:0072209) metanephric glomerular mesangial cell differentiation(GO:0072254) regulation of glial cell-derived neurotrophic factor secretion(GO:1900166) positive regulation of glial cell-derived neurotrophic factor secretion(GO:1900168) positive regulation of macrophage colony-stimulating factor production(GO:1901258) |
| 0.1 | 0.6 | GO:0035608 | protein deglutamylation(GO:0035608) |
| 0.1 | 0.2 | GO:0045900 | negative regulation of translational elongation(GO:0045900) |
| 0.1 | 1.7 | GO:0010738 | regulation of protein kinase A signaling(GO:0010738) |
| 0.1 | 0.1 | GO:0033590 | response to cobalamin(GO:0033590) |
| 0.1 | 0.8 | GO:0007096 | regulation of exit from mitosis(GO:0007096) |
| 0.1 | 0.9 | GO:0043248 | proteasome assembly(GO:0043248) |
| 0.1 | 0.2 | GO:0003072 | regulation of blood vessel size by renin-angiotensin(GO:0002034) renal control of peripheral vascular resistance involved in regulation of systemic arterial blood pressure(GO:0003072) phospholipase C-activating angiotensin-activated signaling pathway(GO:0086097) |
| 0.1 | 0.1 | GO:0007206 | phospholipase C-activating G-protein coupled glutamate receptor signaling pathway(GO:0007206) |
| 0.1 | 1.1 | GO:0090036 | regulation of protein kinase C signaling(GO:0090036) |
| 0.1 | 0.2 | GO:2001200 | positive regulation of dendritic cell differentiation(GO:2001200) |
| 0.1 | 0.2 | GO:0061026 | cardiac muscle tissue regeneration(GO:0061026) |
| 0.1 | 0.3 | GO:1903961 | positive regulation of anion channel activity(GO:1901529) positive regulation of anion transmembrane transport(GO:1903961) |
| 0.1 | 0.1 | GO:0060623 | regulation of chromosome condensation(GO:0060623) |
| 0.1 | 0.3 | GO:0070945 | neutrophil mediated killing of gram-negative bacterium(GO:0070945) |
| 0.0 | 0.8 | GO:0006004 | fucose metabolic process(GO:0006004) |
| 0.0 | 3.3 | GO:0006120 | mitochondrial electron transport, NADH to ubiquinone(GO:0006120) |
| 0.0 | 0.3 | GO:1903608 | protein localization to cytoplasmic stress granule(GO:1903608) |
| 0.0 | 0.2 | GO:0050779 | RNA destabilization(GO:0050779) |
| 0.0 | 0.3 | GO:0046836 | glycolipid transport(GO:0046836) |
| 0.0 | 1.3 | GO:0009083 | branched-chain amino acid catabolic process(GO:0009083) |
| 0.0 | 0.5 | GO:0006449 | regulation of translational termination(GO:0006449) |
| 0.0 | 0.3 | GO:0035965 | cardiolipin acyl-chain remodeling(GO:0035965) |
| 0.0 | 0.6 | GO:0070050 | neuron cellular homeostasis(GO:0070050) |
| 0.0 | 2.2 | GO:0000281 | mitotic cytokinesis(GO:0000281) |
| 0.0 | 0.1 | GO:1904637 | response to ionomycin(GO:1904636) cellular response to ionomycin(GO:1904637) |
| 0.0 | 0.1 | GO:1904694 | negative regulation of vasoconstriction(GO:0045906) negative regulation of vascular smooth muscle contraction(GO:1904694) |
| 0.0 | 1.4 | GO:0097320 | membrane tubulation(GO:0097320) |
| 0.0 | 1.3 | GO:0030252 | growth hormone secretion(GO:0030252) |
| 0.0 | 0.1 | GO:1902303 | regulation of heart rate by hormone(GO:0003064) negative regulation of potassium ion export(GO:1902303) |
| 0.0 | 1.2 | GO:0051452 | intracellular pH reduction(GO:0051452) |
| 0.0 | 0.2 | GO:0036315 | cellular response to sterol(GO:0036315) |
| 0.0 | 0.2 | GO:1904565 | response to 1-oleoyl-sn-glycerol 3-phosphate(GO:1904565) cellular response to 1-oleoyl-sn-glycerol 3-phosphate(GO:1904566) |
| 0.0 | 0.2 | GO:1902544 | regulation of DNA N-glycosylase activity(GO:1902544) |
| 0.0 | 0.1 | GO:0046416 | D-amino acid metabolic process(GO:0046416) |
| 0.0 | 0.2 | GO:0044313 | protein K6-linked deubiquitination(GO:0044313) |
| 0.0 | 0.1 | GO:0098974 | postsynaptic actin cytoskeleton organization(GO:0098974) |
| 0.0 | 0.7 | GO:0036066 | protein O-linked fucosylation(GO:0036066) |
| 0.0 | 0.4 | GO:0030951 | establishment or maintenance of microtubule cytoskeleton polarity(GO:0030951) |
| 0.0 | 0.5 | GO:0036155 | acylglycerol acyl-chain remodeling(GO:0036155) |
| 0.0 | 0.2 | GO:0060158 | phospholipase C-activating dopamine receptor signaling pathway(GO:0060158) |
| 0.0 | 0.7 | GO:0060732 | positive regulation of inositol phosphate biosynthetic process(GO:0060732) |
| 0.0 | 0.1 | GO:0021558 | trochlear nerve development(GO:0021558) |
| 0.0 | 0.1 | GO:0048850 | hypophysis morphogenesis(GO:0048850) |
| 0.0 | 0.1 | GO:0070843 | misfolded protein transport(GO:0070843) polyubiquitinated protein transport(GO:0070844) polyubiquitinated misfolded protein transport(GO:0070845) Hsp90 deacetylation(GO:0070846) |
| 0.0 | 0.3 | GO:0048148 | behavioral response to cocaine(GO:0048148) |
| 0.0 | 0.3 | GO:0006499 | N-terminal protein myristoylation(GO:0006499) |
| 0.0 | 0.2 | GO:0006556 | S-adenosylmethionine biosynthetic process(GO:0006556) |
| 0.0 | 0.5 | GO:0042167 | porphyrin-containing compound catabolic process(GO:0006787) tetrapyrrole catabolic process(GO:0033015) heme catabolic process(GO:0042167) pigment catabolic process(GO:0046149) |
| 0.0 | 0.6 | GO:0042340 | keratan sulfate catabolic process(GO:0042340) |
| 0.0 | 0.1 | GO:1905244 | regulation of modification of synaptic structure(GO:1905244) |
| 0.0 | 0.6 | GO:0045974 | miRNA mediated inhibition of translation(GO:0035278) negative regulation of translation, ncRNA-mediated(GO:0040033) regulation of translation, ncRNA-mediated(GO:0045974) |
| 0.0 | 0.9 | GO:2000675 | negative regulation of type B pancreatic cell apoptotic process(GO:2000675) |
| 0.0 | 1.6 | GO:0008045 | motor neuron axon guidance(GO:0008045) |
| 0.0 | 0.1 | GO:1902766 | skeletal muscle satellite cell migration(GO:1902766) |
| 0.0 | 3.5 | GO:0051436 | negative regulation of ubiquitin-protein ligase activity involved in mitotic cell cycle(GO:0051436) |
| 0.0 | 0.7 | GO:0035024 | negative regulation of Rho protein signal transduction(GO:0035024) |
| 0.0 | 0.2 | GO:0032484 | Ral protein signal transduction(GO:0032484) regulation of Ral protein signal transduction(GO:0032485) |
| 0.0 | 0.2 | GO:1990262 | regulation of anti-Mullerian hormone signaling pathway(GO:1902612) negative regulation of anti-Mullerian hormone signaling pathway(GO:1902613) anti-Mullerian hormone signaling pathway(GO:1990262) |
| 0.0 | 0.1 | GO:0005999 | xylulose biosynthetic process(GO:0005999) |
| 0.0 | 0.2 | GO:0036438 | maintenance of lens transparency(GO:0036438) |
| 0.0 | 0.0 | GO:0019483 | beta-alanine biosynthetic process(GO:0019483) |
| 0.0 | 1.0 | GO:0043968 | histone H2A acetylation(GO:0043968) |
| 0.0 | 1.2 | GO:0048026 | positive regulation of mRNA splicing, via spliceosome(GO:0048026) |
| 0.0 | 1.5 | GO:0035666 | TRIF-dependent toll-like receptor signaling pathway(GO:0035666) |
| 0.0 | 0.3 | GO:0051026 | chiasma assembly(GO:0051026) |
| 0.0 | 0.8 | GO:0010744 | positive regulation of macrophage derived foam cell differentiation(GO:0010744) |
| 0.0 | 0.7 | GO:1903540 | neurotransmitter receptor transport to postsynaptic membrane(GO:0098969) establishment of protein localization to postsynaptic membrane(GO:1903540) |
| 0.0 | 0.1 | GO:0002461 | tolerance induction dependent upon immune response(GO:0002461) |
| 0.0 | 1.6 | GO:0032008 | positive regulation of TOR signaling(GO:0032008) |
| 0.0 | 0.2 | GO:0007468 | regulation of rhodopsin gene expression(GO:0007468) positive regulation of rhodopsin gene expression(GO:0045872) |
| 0.0 | 0.1 | GO:1904781 | positive regulation of protein localization to centrosome(GO:1904781) |
| 0.0 | 0.1 | GO:0034445 | regulation of lipoprotein oxidation(GO:0034442) negative regulation of lipoprotein oxidation(GO:0034443) regulation of plasma lipoprotein particle oxidation(GO:0034444) negative regulation of plasma lipoprotein particle oxidation(GO:0034445) |
| 0.0 | 0.1 | GO:0006710 | androgen catabolic process(GO:0006710) |
| 0.0 | 0.1 | GO:0006295 | nucleotide-excision repair, DNA incision, 3'-to lesion(GO:0006295) |
| 0.0 | 0.3 | GO:2000010 | positive regulation of protein localization to cell surface(GO:2000010) |
| 0.0 | 0.3 | GO:0045198 | establishment of epithelial cell apical/basal polarity(GO:0045198) |
| 0.0 | 0.1 | GO:1901377 | mycotoxin catabolic process(GO:0043387) aflatoxin catabolic process(GO:0046223) organic heteropentacyclic compound catabolic process(GO:1901377) regulation of glutathione biosynthetic process(GO:1903786) positive regulation of glutathione biosynthetic process(GO:1903788) |
| 0.0 | 0.4 | GO:0061635 | regulation of protein complex stability(GO:0061635) |
| 0.0 | 1.0 | GO:0019372 | lipoxygenase pathway(GO:0019372) |
| 0.0 | 0.2 | GO:0031145 | anaphase-promoting complex-dependent catabolic process(GO:0031145) |
| 0.0 | 0.6 | GO:0033617 | mitochondrial respiratory chain complex IV assembly(GO:0033617) |
| 0.0 | 0.4 | GO:0001821 | histamine secretion(GO:0001821) histamine production involved in inflammatory response(GO:0002349) histamine secretion involved in inflammatory response(GO:0002441) histamine secretion by mast cell(GO:0002553) |
| 0.0 | 0.3 | GO:0060012 | synaptic transmission, glycinergic(GO:0060012) |
| 0.0 | 0.6 | GO:0006388 | tRNA splicing, via endonucleolytic cleavage and ligation(GO:0006388) |
| 0.0 | 0.2 | GO:0010760 | negative regulation of macrophage chemotaxis(GO:0010760) |
| 0.0 | 0.2 | GO:0006537 | glutamate biosynthetic process(GO:0006537) |
| 0.0 | 1.3 | GO:0034383 | low-density lipoprotein particle clearance(GO:0034383) |
| 0.0 | 1.2 | GO:0060074 | synapse maturation(GO:0060074) |
| 0.0 | 0.7 | GO:0051654 | establishment of mitochondrion localization(GO:0051654) |
| 0.0 | 1.0 | GO:0032012 | regulation of ARF protein signal transduction(GO:0032012) |
| 0.0 | 2.5 | GO:0000045 | autophagosome assembly(GO:0000045) |
| 0.0 | 0.1 | GO:0046462 | monoacylglycerol metabolic process(GO:0046462) monoacylglycerol catabolic process(GO:0052651) |
| 0.0 | 0.2 | GO:0060017 | parathyroid gland development(GO:0060017) |
| 0.0 | 0.1 | GO:0007231 | osmosensory signaling pathway(GO:0007231) |
| 0.0 | 0.9 | GO:0014002 | astrocyte development(GO:0014002) |
| 0.0 | 0.2 | GO:0071461 | cellular response to redox state(GO:0071461) |
| 0.0 | 0.8 | GO:0043046 | DNA methylation involved in gamete generation(GO:0043046) |
| 0.0 | 0.1 | GO:0006404 | RNA import into nucleus(GO:0006404) |
| 0.0 | 0.3 | GO:0009414 | response to water deprivation(GO:0009414) |
| 0.0 | 0.3 | GO:0010288 | response to lead ion(GO:0010288) |
| 0.0 | 0.2 | GO:0033235 | positive regulation of protein sumoylation(GO:0033235) |
| 0.0 | 1.3 | GO:0032728 | positive regulation of interferon-beta production(GO:0032728) |
| 0.0 | 0.5 | GO:0001778 | plasma membrane repair(GO:0001778) |
| 0.0 | 0.1 | GO:2000586 | regulation of platelet-derived growth factor receptor-beta signaling pathway(GO:2000586) |
| 0.0 | 0.3 | GO:0042073 | intraciliary transport(GO:0042073) |
| 0.0 | 0.9 | GO:0051131 | chaperone-mediated protein complex assembly(GO:0051131) |
| 0.0 | 0.2 | GO:0009249 | protein lipoylation(GO:0009249) |
| 0.0 | 0.0 | GO:0051919 | positive regulation of fibrinolysis(GO:0051919) |
| 0.0 | 0.1 | GO:0043000 | Golgi to plasma membrane CFTR protein transport(GO:0043000) |
| 0.0 | 0.3 | GO:0031507 | heterochromatin assembly(GO:0031507) |
| 0.0 | 0.3 | GO:0035630 | bone mineralization involved in bone maturation(GO:0035630) |
| 0.0 | 0.2 | GO:1904668 | positive regulation of ubiquitin protein ligase activity(GO:1904668) |
| 0.0 | 0.9 | GO:0000305 | response to oxygen radical(GO:0000305) |
| 0.0 | 0.3 | GO:0036010 | protein localization to endosome(GO:0036010) |
| 0.0 | 0.8 | GO:0097352 | autophagosome maturation(GO:0097352) |
| 0.0 | 0.1 | GO:0060743 | epithelial cell maturation involved in prostate gland development(GO:0060743) |
| 0.0 | 0.1 | GO:0072674 | multinuclear osteoclast differentiation(GO:0072674) osteoclast fusion(GO:0072675) |
| 0.0 | 0.1 | GO:0070092 | regulation of glucagon secretion(GO:0070092) |
| 0.0 | 0.3 | GO:0017182 | peptidyl-diphthamide metabolic process(GO:0017182) peptidyl-diphthamide biosynthetic process from peptidyl-histidine(GO:0017183) |
| 0.0 | 1.0 | GO:0072661 | protein targeting to plasma membrane(GO:0072661) |
| 0.0 | 0.1 | GO:0006127 | glycerophosphate shuttle(GO:0006127) |
| 0.0 | 0.1 | GO:0034628 | nicotinamide nucleotide biosynthetic process from aspartate(GO:0019355) 'de novo' NAD biosynthetic process from aspartate(GO:0034628) |
| 0.0 | 0.1 | GO:0045819 | positive regulation of glycogen catabolic process(GO:0045819) |
| 0.0 | 0.3 | GO:0032196 | transposition(GO:0032196) |
| 0.0 | 0.5 | GO:0043153 | entrainment of circadian clock by photoperiod(GO:0043153) |
| 0.0 | 0.3 | GO:0030091 | protein repair(GO:0030091) |
| 0.0 | 0.3 | GO:0016255 | attachment of GPI anchor to protein(GO:0016255) |
| 0.0 | 0.1 | GO:0046322 | negative regulation of fatty acid oxidation(GO:0046322) |
| 0.0 | 0.3 | GO:0070779 | D-aspartate transport(GO:0070777) D-aspartate import(GO:0070779) |
| 0.0 | 0.1 | GO:0090234 | regulation of centromere complex assembly(GO:0090230) regulation of kinetochore assembly(GO:0090234) |
| 0.0 | 0.1 | GO:0043376 | regulation of CD8-positive, alpha-beta T cell differentiation(GO:0043376) |
| 0.0 | 0.5 | GO:0007250 | activation of NF-kappaB-inducing kinase activity(GO:0007250) |
| 0.0 | 0.4 | GO:0033120 | positive regulation of RNA splicing(GO:0033120) |
| 0.0 | 0.1 | GO:0015015 | heparan sulfate proteoglycan biosynthetic process, enzymatic modification(GO:0015015) |
| 0.0 | 0.2 | GO:0060054 | positive regulation of epithelial cell proliferation involved in wound healing(GO:0060054) |
| 0.0 | 2.6 | GO:0035308 | negative regulation of protein dephosphorylation(GO:0035308) |
| 0.0 | 0.1 | GO:0009438 | methylglyoxal metabolic process(GO:0009438) |
| 0.0 | 1.4 | GO:0050885 | neuromuscular process controlling balance(GO:0050885) |
| 0.0 | 0.6 | GO:0035162 | embryonic hemopoiesis(GO:0035162) |
| 0.0 | 0.7 | GO:0043388 | positive regulation of DNA binding(GO:0043388) |
| 0.0 | 0.1 | GO:0060088 | auditory receptor cell stereocilium organization(GO:0060088) |
| 0.0 | 0.4 | GO:1904355 | positive regulation of telomere capping(GO:1904355) |
| 0.0 | 0.2 | GO:1901029 | negative regulation of mitochondrial outer membrane permeabilization involved in apoptotic signaling pathway(GO:1901029) |
| 0.0 | 0.5 | GO:0045663 | positive regulation of myoblast differentiation(GO:0045663) |
| 0.0 | 0.2 | GO:0080009 | mRNA methylation(GO:0080009) |
| 0.0 | 0.2 | GO:0000395 | mRNA 5'-splice site recognition(GO:0000395) |
| 0.0 | 2.8 | GO:0044070 | regulation of anion transport(GO:0044070) |
| 0.0 | 0.4 | GO:0003322 | pancreatic A cell development(GO:0003322) |
| 0.0 | 0.2 | GO:0071361 | cellular response to ethanol(GO:0071361) |
| 0.0 | 0.3 | GO:0034498 | early endosome to Golgi transport(GO:0034498) |
| 0.0 | 0.6 | GO:0045742 | positive regulation of epidermal growth factor receptor signaling pathway(GO:0045742) positive regulation of ERBB signaling pathway(GO:1901186) |
| 0.0 | 0.4 | GO:0007213 | G-protein coupled acetylcholine receptor signaling pathway(GO:0007213) |
| 0.0 | 0.8 | GO:0036297 | interstrand cross-link repair(GO:0036297) |
| 0.0 | 1.6 | GO:0006890 | retrograde vesicle-mediated transport, Golgi to ER(GO:0006890) |
| 0.0 | 0.3 | GO:0007080 | mitotic metaphase plate congression(GO:0007080) |
| 0.0 | 0.1 | GO:0033031 | positive regulation of neutrophil apoptotic process(GO:0033031) |
| 0.0 | 0.5 | GO:0045724 | positive regulation of cilium assembly(GO:0045724) |
| 0.0 | 0.2 | GO:0097267 | omega-hydroxylase P450 pathway(GO:0097267) |
| 0.0 | 0.4 | GO:0016226 | iron-sulfur cluster assembly(GO:0016226) metallo-sulfur cluster assembly(GO:0031163) |
| 0.0 | 0.4 | GO:0051281 | positive regulation of release of sequestered calcium ion into cytosol(GO:0051281) |
| 0.0 | 0.0 | GO:1900451 | positive regulation of glutamate receptor signaling pathway(GO:1900451) |
| 0.0 | 0.1 | GO:0061034 | olfactory bulb mitral cell layer development(GO:0061034) |
| 0.0 | 0.7 | GO:0009250 | glycogen biosynthetic process(GO:0005978) glucan biosynthetic process(GO:0009250) |
| 0.0 | 0.1 | GO:0010499 | proteasomal ubiquitin-independent protein catabolic process(GO:0010499) |
| 0.0 | 0.5 | GO:0071173 | mitotic spindle assembly checkpoint(GO:0007094) spindle assembly checkpoint(GO:0071173) |
| 0.0 | 0.1 | GO:0060368 | regulation of Fc receptor mediated stimulatory signaling pathway(GO:0060368) |
| 0.0 | 0.2 | GO:0086024 | adrenergic receptor signaling pathway involved in positive regulation of heart rate(GO:0086024) |
| 0.0 | 0.2 | GO:2000678 | negative regulation of transcription regulatory region DNA binding(GO:2000678) |
| 0.0 | 0.1 | GO:1901727 | positive regulation of histone deacetylase activity(GO:1901727) |
| 0.0 | 0.2 | GO:0031468 | mitotic nuclear envelope reassembly(GO:0007084) nuclear envelope reassembly(GO:0031468) |
| 0.0 | 0.0 | GO:1901889 | negative regulation of cell junction assembly(GO:1901889) |
| 0.0 | 0.4 | GO:0015937 | coenzyme A biosynthetic process(GO:0015937) |
| 0.0 | 0.1 | GO:0016926 | protein desumoylation(GO:0016926) |
| 0.0 | 0.7 | GO:0006904 | vesicle docking involved in exocytosis(GO:0006904) |
| 0.0 | 0.3 | GO:0007064 | mitotic sister chromatid cohesion(GO:0007064) |
| 0.0 | 0.1 | GO:0002949 | tRNA threonylcarbamoyladenosine modification(GO:0002949) |
| 0.0 | 0.5 | GO:0006363 | termination of RNA polymerase I transcription(GO:0006363) |
| 0.0 | 0.6 | GO:0032481 | positive regulation of type I interferon production(GO:0032481) |
| 0.0 | 0.1 | GO:0002023 | reduction of food intake in response to dietary excess(GO:0002023) |
| 0.0 | 0.9 | GO:0000413 | protein peptidyl-prolyl isomerization(GO:0000413) |
| 0.0 | 0.7 | GO:0045773 | positive regulation of axon extension(GO:0045773) |
| 0.0 | 0.1 | GO:0097698 | base-excision repair, base-free sugar-phosphate removal(GO:0006286) telomere maintenance via base-excision repair(GO:0097698) DNA dephosphorylation(GO:0098502) |
| 0.0 | 0.1 | GO:2000698 | positive regulation of epithelial cell differentiation involved in kidney development(GO:2000698) |
| 0.0 | 0.0 | GO:0001546 | preantral ovarian follicle growth(GO:0001546) multi-layer follicle stage(GO:0048162) regulation of ovulation(GO:0060278) |
| 0.0 | 0.1 | GO:2000259 | positive regulation of complement activation(GO:0045917) positive regulation of protein activation cascade(GO:2000259) |
| 0.0 | 0.5 | GO:0042133 | neurotransmitter metabolic process(GO:0042133) |
| 0.0 | 0.7 | GO:0007520 | myoblast fusion(GO:0007520) |
| 0.0 | 0.0 | GO:0060920 | atrioventricular node development(GO:0003162) cardiac pacemaker cell differentiation(GO:0060920) cardiac pacemaker cell development(GO:0060926) |
| 0.0 | 0.4 | GO:0045839 | negative regulation of mitotic nuclear division(GO:0045839) |
| 0.0 | 0.3 | GO:0046688 | response to copper ion(GO:0046688) |
| 0.0 | 0.1 | GO:0051694 | pointed-end actin filament capping(GO:0051694) |
| 0.0 | 0.0 | GO:1900239 | phenotypic switching(GO:0036166) regulation of phenotypic switching(GO:1900239) |
| 0.0 | 0.1 | GO:1903025 | regulation of RNA polymerase II regulatory region sequence-specific DNA binding(GO:1903025) |
| 0.0 | 0.3 | GO:0031643 | positive regulation of myelination(GO:0031643) |
| 0.0 | 0.1 | GO:0014886 | transition between slow and fast fiber(GO:0014886) |
| 0.0 | 0.1 | GO:1902951 | negative regulation of dendritic spine maintenance(GO:1902951) |
| 0.0 | 0.3 | GO:0006228 | UTP biosynthetic process(GO:0006228) |
| 0.0 | 0.0 | GO:0046689 | response to mercury ion(GO:0046689) |
| 0.0 | 0.3 | GO:0043584 | nose development(GO:0043584) |
| 0.0 | 1.3 | GO:0042147 | retrograde transport, endosome to Golgi(GO:0042147) |
| 0.0 | 0.8 | GO:0010507 | negative regulation of autophagy(GO:0010507) |
| 0.0 | 0.6 | GO:0030835 | negative regulation of actin filament depolymerization(GO:0030835) |
| 0.0 | 0.2 | GO:0035694 | mitochondrial protein catabolic process(GO:0035694) |
| 0.0 | 0.6 | GO:0046597 | negative regulation of viral entry into host cell(GO:0046597) |
| 0.0 | 0.4 | GO:0006646 | phosphatidylethanolamine biosynthetic process(GO:0006646) |
| 0.0 | 0.3 | GO:0006002 | fructose 6-phosphate metabolic process(GO:0006002) |
| 0.0 | 0.5 | GO:0000470 | maturation of LSU-rRNA(GO:0000470) |
| 0.0 | 0.0 | GO:0098501 | polynucleotide dephosphorylation(GO:0098501) polynucleotide 5' dephosphorylation(GO:0098507) |
| 0.0 | 0.2 | GO:0048096 | chromatin-mediated maintenance of transcription(GO:0048096) |
| 0.0 | 0.0 | GO:1901253 | negative regulation of intracellular transport of viral material(GO:1901253) |
| 0.0 | 0.3 | GO:0045648 | positive regulation of erythrocyte differentiation(GO:0045648) |
| 0.0 | 0.2 | GO:0010763 | positive regulation of fibroblast migration(GO:0010763) |
| 0.0 | 0.1 | GO:2000359 | regulation of binding of sperm to zona pellucida(GO:2000359) negative regulation of binding of sperm to zona pellucida(GO:2000360) |
| 0.0 | 0.1 | GO:0033148 | positive regulation of intracellular estrogen receptor signaling pathway(GO:0033148) |
| 0.0 | 0.3 | GO:1900273 | positive regulation of long-term synaptic potentiation(GO:1900273) |
| 0.0 | 0.0 | GO:1902871 | regulation of transcription from RNA polymerase II promoter involved in forebrain neuron fate commitment(GO:0021882) cerebral cortex GABAergic interneuron fate commitment(GO:0021893) commitment of multipotent stem cells to neuronal lineage in forebrain(GO:0021898) positive regulation of neural retina development(GO:0061075) positive regulation of retina development in camera-type eye(GO:1902868) regulation of amacrine cell differentiation(GO:1902869) positive regulation of amacrine cell differentiation(GO:1902871) |
| 0.0 | 0.3 | GO:0043392 | negative regulation of DNA binding(GO:0043392) |
| 0.0 | 0.5 | GO:0061154 | endothelial tube morphogenesis(GO:0061154) |
| 0.0 | 0.4 | GO:0006885 | regulation of pH(GO:0006885) |
| 0.0 | 0.5 | GO:0006283 | transcription-coupled nucleotide-excision repair(GO:0006283) |
| 0.0 | 0.1 | GO:0030242 | pexophagy(GO:0030242) aggrephagy(GO:0035973) |
| 0.0 | 0.3 | GO:0006817 | phosphate ion transport(GO:0006817) |
| 0.0 | 0.1 | GO:2000197 | regulation of ribonucleoprotein complex localization(GO:2000197) |
| 0.0 | 0.2 | GO:0032060 | bleb assembly(GO:0032060) |
| 0.0 | 0.1 | GO:0097039 | protein linear polyubiquitination(GO:0097039) |
| 0.0 | 0.1 | GO:1902018 | negative regulation of cilium assembly(GO:1902018) |
| 0.0 | 0.1 | GO:0019441 | tryptophan catabolic process to kynurenine(GO:0019441) |
| 0.0 | 0.0 | GO:0018364 | peptidyl-glutamine methylation(GO:0018364) |
| 0.0 | 0.1 | GO:0072278 | metanephric comma-shaped body morphogenesis(GO:0072278) |
| 0.0 | 1.0 | GO:1902653 | cholesterol biosynthetic process(GO:0006695) secondary alcohol biosynthetic process(GO:1902653) |
| 0.0 | 0.0 | GO:1902527 | positive regulation of protein monoubiquitination(GO:1902527) |
| 0.0 | 0.3 | GO:0045116 | protein neddylation(GO:0045116) |
| 0.0 | 0.1 | GO:1903027 | regulation of opsonization(GO:1903027) |
| 0.0 | 0.1 | GO:0032202 | telomere assembly(GO:0032202) |
| 0.0 | 0.1 | GO:0010866 | regulation of triglyceride biosynthetic process(GO:0010866) |
| 0.0 | 0.4 | GO:0038128 | ERBB2 signaling pathway(GO:0038128) |
| 0.0 | 0.1 | GO:0048280 | vesicle fusion with Golgi apparatus(GO:0048280) |
| 0.0 | 0.1 | GO:0008354 | germ cell migration(GO:0008354) |
| 0.0 | 0.3 | GO:2001044 | regulation of integrin-mediated signaling pathway(GO:2001044) |
| 0.0 | 0.3 | GO:2001222 | regulation of neuron migration(GO:2001222) |
| 0.0 | 0.2 | GO:0006957 | complement activation, alternative pathway(GO:0006957) |
| 0.0 | 0.1 | GO:0099515 | vesicle transport along actin filament(GO:0030050) actin filament-based transport(GO:0099515) |
| 0.0 | 0.3 | GO:0071108 | protein K48-linked deubiquitination(GO:0071108) |
| 0.0 | 0.7 | GO:0045071 | negative regulation of viral genome replication(GO:0045071) |
| 0.0 | 0.2 | GO:0009072 | aromatic amino acid family metabolic process(GO:0009072) |
| 0.0 | 0.0 | GO:0016259 | selenocysteine metabolic process(GO:0016259) |
| 0.0 | 0.0 | GO:0099525 | presynaptic dense core granule exocytosis(GO:0099525) |
| 0.0 | 0.6 | GO:0007528 | neuromuscular junction development(GO:0007528) |
| 0.0 | 0.3 | GO:0009435 | NAD biosynthetic process(GO:0009435) |
| 0.0 | 0.0 | GO:0002925 | positive regulation of humoral immune response mediated by circulating immunoglobulin(GO:0002925) |
| 0.0 | 0.4 | GO:0016445 | somatic diversification of immunoglobulins(GO:0016445) |
| 0.0 | 0.1 | GO:0002318 | myeloid progenitor cell differentiation(GO:0002318) |
| 0.0 | 0.1 | GO:0060546 | negative regulation of necroptotic process(GO:0060546) |
| 0.0 | 0.1 | GO:0071569 | protein ufmylation(GO:0071569) protein polyufmylation(GO:1990564) protein K69-linked ufmylation(GO:1990592) |
| 0.0 | 0.2 | GO:0010762 | regulation of fibroblast migration(GO:0010762) |
| 0.0 | 0.2 | GO:0031954 | positive regulation of protein autophosphorylation(GO:0031954) |
| 0.0 | 0.1 | GO:0007021 | tubulin complex assembly(GO:0007021) |
| 0.0 | 0.1 | GO:0048254 | snoRNA localization(GO:0048254) |
| 0.0 | 0.6 | GO:0055092 | cholesterol homeostasis(GO:0042632) sterol homeostasis(GO:0055092) |
| 0.0 | 0.3 | GO:0099601 | regulation of neurotransmitter receptor activity(GO:0099601) |
| 0.0 | 0.1 | GO:2000483 | negative regulation of interleukin-8 secretion(GO:2000483) |
| 0.0 | 0.2 | GO:0016048 | detection of temperature stimulus(GO:0016048) |
| 0.0 | 0.1 | GO:0003150 | muscular septum morphogenesis(GO:0003150) |
Gene overrepresentation in cellular component category:
| Log-likelihood per target | Total log-likelihood | Term | Description |
|---|---|---|---|
| 0.6 | 3.9 | GO:0097149 | centralspindlin complex(GO:0097149) |
| 0.4 | 1.7 | GO:0042720 | mitochondrial inner membrane peptidase complex(GO:0042720) |
| 0.4 | 1.1 | GO:0031251 | PAN complex(GO:0031251) |
| 0.3 | 1.0 | GO:0035189 | Rb-E2F complex(GO:0035189) |
| 0.3 | 1.4 | GO:0070288 | intracellular ferritin complex(GO:0008043) ferritin complex(GO:0070288) |
| 0.3 | 4.6 | GO:0098643 | fibrillar collagen trimer(GO:0005583) banded collagen fibril(GO:0098643) |
| 0.3 | 2.0 | GO:0097129 | cyclin D2-CDK4 complex(GO:0097129) |
| 0.3 | 1.0 | GO:1990298 | mitotic checkpoint complex(GO:0033597) bub1-bub3 complex(GO:1990298) |
| 0.3 | 3.5 | GO:0030991 | intraciliary transport particle A(GO:0030991) |
| 0.3 | 1.4 | GO:0031302 | intrinsic component of endosome membrane(GO:0031302) |
| 0.3 | 1.4 | GO:0043625 | delta DNA polymerase complex(GO:0043625) |
| 0.3 | 3.3 | GO:0016602 | CCAAT-binding factor complex(GO:0016602) |
| 0.3 | 1.8 | GO:0002177 | manchette(GO:0002177) |
| 0.3 | 1.0 | GO:0097229 | sperm end piece(GO:0097229) |
| 0.3 | 3.0 | GO:0016593 | Cdc73/Paf1 complex(GO:0016593) |
| 0.2 | 1.2 | GO:0005726 | perichromatin fibrils(GO:0005726) |
| 0.2 | 1.7 | GO:0005947 | mitochondrial alpha-ketoglutarate dehydrogenase complex(GO:0005947) |
| 0.2 | 0.7 | GO:0071598 | neuronal ribonucleoprotein granule(GO:0071598) |
| 0.2 | 0.9 | GO:0032144 | 4-aminobutyrate transaminase complex(GO:0032144) |
| 0.2 | 0.9 | GO:0060201 | clathrin-sculpted acetylcholine transport vesicle(GO:0060200) clathrin-sculpted acetylcholine transport vesicle membrane(GO:0060201) |
| 0.2 | 1.9 | GO:0042406 | extrinsic component of endoplasmic reticulum membrane(GO:0042406) |
| 0.2 | 1.2 | GO:0005967 | mitochondrial pyruvate dehydrogenase complex(GO:0005967) |
| 0.2 | 1.9 | GO:0032389 | MutLalpha complex(GO:0032389) |
| 0.2 | 0.8 | GO:0097362 | MCM8-MCM9 complex(GO:0097362) |
| 0.2 | 2.8 | GO:0031209 | SCAR complex(GO:0031209) |
| 0.2 | 2.2 | GO:0005869 | dynactin complex(GO:0005869) |
| 0.2 | 0.7 | GO:0033186 | CAF-1 complex(GO:0033186) |
| 0.2 | 2.9 | GO:0043240 | Fanconi anaemia nuclear complex(GO:0043240) |
| 0.2 | 3.3 | GO:0012510 | trans-Golgi network transport vesicle membrane(GO:0012510) |
| 0.2 | 0.7 | GO:0070044 | synaptobrevin 2-SNAP-25-syntaxin-1a complex(GO:0070044) |
| 0.2 | 0.9 | GO:0008275 | gamma-tubulin small complex(GO:0008275) |
| 0.2 | 3.6 | GO:0097225 | sperm midpiece(GO:0097225) |
| 0.2 | 5.2 | GO:0097386 | glial cell projection(GO:0097386) |
| 0.2 | 0.7 | GO:0032133 | chromosome passenger complex(GO:0032133) |
| 0.2 | 6.8 | GO:0005680 | anaphase-promoting complex(GO:0005680) |
| 0.2 | 3.6 | GO:0005952 | cAMP-dependent protein kinase complex(GO:0005952) |
| 0.2 | 1.9 | GO:0033588 | Elongator holoenzyme complex(GO:0033588) |
| 0.2 | 2.3 | GO:0031618 | nuclear pericentric heterochromatin(GO:0031618) |
| 0.2 | 0.5 | GO:0001674 | female germ cell nucleus(GO:0001674) |
| 0.2 | 2.9 | GO:0031616 | spindle pole centrosome(GO:0031616) |
| 0.2 | 2.0 | GO:0005688 | U6 snRNP(GO:0005688) |
| 0.2 | 0.8 | GO:0032301 | MutSalpha complex(GO:0032301) |
| 0.1 | 0.4 | GO:0005656 | nuclear pre-replicative complex(GO:0005656) pre-replicative complex(GO:0036387) |
| 0.1 | 0.4 | GO:0097135 | cyclin E2-CDK2 complex(GO:0097135) |
| 0.1 | 1.0 | GO:0044327 | dendritic spine head(GO:0044327) |
| 0.1 | 1.1 | GO:0034751 | aryl hydrocarbon receptor complex(GO:0034751) |
| 0.1 | 4.0 | GO:0005942 | phosphatidylinositol 3-kinase complex(GO:0005942) |
| 0.1 | 0.7 | GO:0071942 | XPC complex(GO:0071942) |
| 0.1 | 0.3 | GO:1990726 | Lsm1-7-Pat1 complex(GO:1990726) |
| 0.1 | 1.7 | GO:0005589 | collagen type VI trimer(GO:0005589) collagen beaded filament(GO:0098647) |
| 0.1 | 6.5 | GO:0044298 | neuronal cell body membrane(GO:0032809) cell body membrane(GO:0044298) |
| 0.1 | 1.7 | GO:0097136 | Bcl-2 family protein complex(GO:0097136) |
| 0.1 | 1.4 | GO:0042382 | paraspeckles(GO:0042382) |
| 0.1 | 1.0 | GO:0000110 | nucleotide-excision repair factor 1 complex(GO:0000110) |
| 0.1 | 15.2 | GO:0005758 | mitochondrial intermembrane space(GO:0005758) |
| 0.1 | 0.6 | GO:0043291 | RAVE complex(GO:0043291) |
| 0.1 | 2.3 | GO:0000812 | Swr1 complex(GO:0000812) |
| 0.1 | 0.7 | GO:0071547 | piP-body(GO:0071547) |
| 0.1 | 0.5 | GO:1990075 | periciliary membrane compartment(GO:1990075) |
| 0.1 | 0.5 | GO:1990356 | sumoylated E2 ligase complex(GO:1990356) |
| 0.1 | 0.6 | GO:0030992 | intraciliary transport particle B(GO:0030992) |
| 0.1 | 0.4 | GO:0032777 | Piccolo NuA4 histone acetyltransferase complex(GO:0032777) |
| 0.1 | 1.9 | GO:0030127 | COPII vesicle coat(GO:0030127) |
| 0.1 | 0.4 | GO:0070876 | SOSS complex(GO:0070876) |
| 0.1 | 1.5 | GO:0008290 | F-actin capping protein complex(GO:0008290) |
| 0.1 | 0.2 | GO:0030981 | cortical microtubule cytoskeleton(GO:0030981) |
| 0.1 | 1.7 | GO:0033179 | proton-transporting V-type ATPase, V0 domain(GO:0033179) |
| 0.1 | 0.5 | GO:0070381 | endosome to plasma membrane transport vesicle(GO:0070381) |
| 0.1 | 0.3 | GO:0010370 | perinucleolar chromocenter(GO:0010370) |
| 0.1 | 0.5 | GO:0032444 | activin responsive factor complex(GO:0032444) |
| 0.1 | 0.4 | GO:0071817 | MMXD complex(GO:0071817) |
| 0.1 | 1.0 | GO:0072357 | PTW/PP1 phosphatase complex(GO:0072357) |
| 0.1 | 1.3 | GO:0070776 | H3 histone acetyltransferase complex(GO:0070775) MOZ/MORF histone acetyltransferase complex(GO:0070776) |
| 0.1 | 0.6 | GO:1990131 | Gtr1-Gtr2 GTPase complex(GO:1990131) |
| 0.1 | 0.5 | GO:0031262 | Ndc80 complex(GO:0031262) |
| 0.1 | 0.2 | GO:0000799 | nuclear condensin complex(GO:0000799) |
| 0.1 | 7.8 | GO:0010494 | cytoplasmic stress granule(GO:0010494) |
| 0.1 | 3.7 | GO:0080008 | Cul4-RING E3 ubiquitin ligase complex(GO:0080008) |
| 0.1 | 0.3 | GO:0005900 | oncostatin-M receptor complex(GO:0005900) |
| 0.1 | 0.7 | GO:0044294 | dendritic growth cone(GO:0044294) |
| 0.1 | 0.8 | GO:0000138 | Golgi trans cisterna(GO:0000138) |
| 0.1 | 0.3 | GO:0032937 | SREBP-SCAP-Insig complex(GO:0032937) |
| 0.1 | 0.4 | GO:0005971 | ribonucleoside-diphosphate reductase complex(GO:0005971) |
| 0.1 | 0.3 | GO:0097125 | cyclin B1-CDK1 complex(GO:0097125) |
| 0.1 | 1.5 | GO:0000346 | transcription export complex(GO:0000346) |
| 0.1 | 0.5 | GO:1990635 | proximal dendrite(GO:1990635) |
| 0.1 | 2.7 | GO:0031304 | intrinsic component of mitochondrial inner membrane(GO:0031304) integral component of mitochondrial inner membrane(GO:0031305) |
| 0.1 | 1.9 | GO:0070822 | Sin3-type complex(GO:0070822) |
| 0.1 | 4.2 | GO:0045171 | intercellular bridge(GO:0045171) |
| 0.1 | 1.3 | GO:0070938 | contractile ring(GO:0070938) |
| 0.1 | 0.4 | GO:0032299 | ribonuclease H2 complex(GO:0032299) |
| 0.1 | 0.4 | GO:0070557 | PCNA-p21 complex(GO:0070557) |
| 0.1 | 0.5 | GO:0000408 | EKC/KEOPS complex(GO:0000408) |
| 0.1 | 0.4 | GO:0001652 | granular component(GO:0001652) |
| 0.1 | 0.6 | GO:0036449 | microtubule minus-end(GO:0036449) |
| 0.1 | 2.9 | GO:0000159 | protein phosphatase type 2A complex(GO:0000159) |
| 0.1 | 0.6 | GO:0071953 | elastic fiber(GO:0071953) |
| 0.1 | 1.8 | GO:0005614 | interstitial matrix(GO:0005614) |
| 0.1 | 7.1 | GO:0005776 | autophagosome(GO:0005776) |
| 0.1 | 3.2 | GO:0097542 | ciliary tip(GO:0097542) |
| 0.1 | 0.3 | GO:0097513 | myosin II filament(GO:0097513) |
| 0.1 | 1.2 | GO:0032045 | guanyl-nucleotide exchange factor complex(GO:0032045) |
| 0.1 | 0.4 | GO:0044305 | calyx of Held(GO:0044305) |
| 0.1 | 0.4 | GO:0072669 | tRNA-splicing ligase complex(GO:0072669) |
| 0.1 | 2.2 | GO:0031233 | intrinsic component of external side of plasma membrane(GO:0031233) |
| 0.1 | 0.5 | GO:0071986 | Ragulator complex(GO:0071986) |
| 0.1 | 1.3 | GO:0097025 | MPP7-DLG1-LIN7 complex(GO:0097025) |
| 0.1 | 0.8 | GO:0097546 | ciliary base(GO:0097546) |
| 0.1 | 0.9 | GO:0030478 | actin cap(GO:0030478) |
| 0.1 | 0.7 | GO:0044233 | ER-mitochondrion membrane contact site(GO:0044233) |
| 0.1 | 0.2 | GO:0070435 | Shc-EGFR complex(GO:0070435) |
| 0.1 | 0.3 | GO:0032300 | mismatch repair complex(GO:0032300) |
| 0.1 | 0.4 | GO:0016272 | prefoldin complex(GO:0016272) |
| 0.1 | 1.0 | GO:0005662 | DNA replication factor A complex(GO:0005662) |
| 0.1 | 0.2 | GO:0048269 | methionine adenosyltransferase complex(GO:0048269) |
| 0.1 | 0.4 | GO:0043219 | lateral loop(GO:0043219) |
| 0.1 | 0.2 | GO:0031515 | tRNA (m1A) methyltransferase complex(GO:0031515) |
| 0.1 | 1.9 | GO:0035861 | site of double-strand break(GO:0035861) |
| 0.1 | 6.7 | GO:0005604 | basement membrane(GO:0005604) |
| 0.1 | 0.3 | GO:0033503 | HULC complex(GO:0033503) |
| 0.1 | 1.1 | GO:0044300 | cerebellar mossy fiber(GO:0044300) |
| 0.1 | 0.8 | GO:0030126 | COPI vesicle coat(GO:0030126) |
| 0.1 | 0.4 | GO:0034715 | pICln-Sm protein complex(GO:0034715) |
| 0.0 | 0.4 | GO:0097452 | GAIT complex(GO:0097452) |
| 0.0 | 0.5 | GO:0008541 | proteasome regulatory particle, lid subcomplex(GO:0008541) |
| 0.0 | 0.1 | GO:0051233 | spindle midzone(GO:0051233) |
| 0.0 | 2.9 | GO:0031201 | SNARE complex(GO:0031201) |
| 0.0 | 1.2 | GO:0035327 | transcriptionally active chromatin(GO:0035327) |
| 0.0 | 0.5 | GO:0060171 | stereocilium membrane(GO:0060171) |
| 0.0 | 2.1 | GO:0005669 | transcription factor TFIID complex(GO:0005669) |
| 0.0 | 0.5 | GO:0043220 | Schmidt-Lanterman incisure(GO:0043220) |
| 0.0 | 0.5 | GO:0000015 | phosphopyruvate hydratase complex(GO:0000015) |
| 0.0 | 0.6 | GO:0019773 | proteasome core complex, alpha-subunit complex(GO:0019773) |
| 0.0 | 1.5 | GO:0071339 | MLL1/2 complex(GO:0044665) MLL1 complex(GO:0071339) |
| 0.0 | 0.3 | GO:0042765 | GPI-anchor transamidase complex(GO:0042765) |
| 0.0 | 0.5 | GO:0034464 | BBSome(GO:0034464) |
| 0.0 | 0.1 | GO:0002139 | stereocilia coupling link(GO:0002139) |
| 0.0 | 0.2 | GO:0032798 | Swi5-Sfr1 complex(GO:0032798) |
| 0.0 | 0.9 | GO:0032391 | photoreceptor connecting cilium(GO:0032391) |
| 0.0 | 2.6 | GO:0005747 | mitochondrial respiratory chain complex I(GO:0005747) NADH dehydrogenase complex(GO:0030964) respiratory chain complex I(GO:0045271) |
| 0.0 | 0.6 | GO:0000177 | cytoplasmic exosome (RNase complex)(GO:0000177) |
| 0.0 | 0.2 | GO:0009331 | glycerol-3-phosphate dehydrogenase complex(GO:0009331) |
| 0.0 | 0.2 | GO:0036396 | MIS complex(GO:0036396) mRNA editing complex(GO:0045293) |
| 0.0 | 0.3 | GO:0065010 | extracellular membrane-bounded organelle(GO:0065010) |
| 0.0 | 0.4 | GO:0035371 | microtubule plus-end(GO:0035371) |
| 0.0 | 0.2 | GO:0035838 | growing cell tip(GO:0035838) |
| 0.0 | 0.6 | GO:0000786 | nucleosome(GO:0000786) |
| 0.0 | 1.6 | GO:0009925 | basal plasma membrane(GO:0009925) |
| 0.0 | 0.3 | GO:0031931 | TORC1 complex(GO:0031931) |
| 0.0 | 1.0 | GO:0005666 | DNA-directed RNA polymerase III complex(GO:0005666) |
| 0.0 | 0.6 | GO:0005689 | U12-type spliceosomal complex(GO:0005689) |
| 0.0 | 1.4 | GO:0016592 | mediator complex(GO:0016592) |
| 0.0 | 4.7 | GO:0090575 | RNA polymerase II transcription factor complex(GO:0090575) |
| 0.0 | 0.5 | GO:0098563 | integral component of synaptic vesicle membrane(GO:0030285) intrinsic component of synaptic vesicle membrane(GO:0098563) |
| 0.0 | 0.0 | GO:0044609 | DBIRD complex(GO:0044609) |
| 0.0 | 0.2 | GO:0045254 | pyruvate dehydrogenase complex(GO:0045254) |
| 0.0 | 3.6 | GO:0005811 | lipid particle(GO:0005811) |
| 0.0 | 2.4 | GO:0005871 | kinesin complex(GO:0005871) |
| 0.0 | 0.6 | GO:0005832 | chaperonin-containing T-complex(GO:0005832) |
| 0.0 | 1.7 | GO:0008180 | COP9 signalosome(GO:0008180) |
| 0.0 | 0.3 | GO:0032593 | insulin-responsive compartment(GO:0032593) |
| 0.0 | 4.0 | GO:0044291 | cell-cell contact zone(GO:0044291) |
| 0.0 | 2.1 | GO:0032154 | cleavage furrow(GO:0032154) cell surface furrow(GO:0097610) |
| 0.0 | 0.1 | GO:0030663 | COPI-coated vesicle membrane(GO:0030663) |
| 0.0 | 4.4 | GO:0030496 | midbody(GO:0030496) |
| 0.0 | 0.9 | GO:0034451 | centriolar satellite(GO:0034451) |
| 0.0 | 0.0 | GO:0031261 | DNA replication preinitiation complex(GO:0031261) |
| 0.0 | 0.1 | GO:0098837 | postsynaptic recycling endosome(GO:0098837) |
| 0.0 | 0.3 | GO:0031083 | BLOC-1 complex(GO:0031083) |
| 0.0 | 0.1 | GO:0019907 | cyclin-dependent protein kinase activating kinase holoenzyme complex(GO:0019907) |
| 0.0 | 0.4 | GO:0000813 | ESCRT I complex(GO:0000813) |
| 0.0 | 0.4 | GO:0030008 | TRAPP complex(GO:0030008) |
| 0.0 | 1.1 | GO:0071565 | nBAF complex(GO:0071565) |
| 0.0 | 2.0 | GO:0072686 | mitotic spindle(GO:0072686) |
| 0.0 | 0.5 | GO:0033202 | Ino80 complex(GO:0031011) DNA helicase complex(GO:0033202) |
| 0.0 | 2.1 | GO:0000118 | histone deacetylase complex(GO:0000118) |
| 0.0 | 0.6 | GO:0005682 | U5 snRNP(GO:0005682) |
| 0.0 | 0.5 | GO:0005839 | proteasome core complex(GO:0005839) |
| 0.0 | 0.1 | GO:1902636 | kinociliary basal body(GO:1902636) |
| 0.0 | 0.5 | GO:0043205 | microfibril(GO:0001527) fibril(GO:0043205) |
| 0.0 | 0.8 | GO:0005876 | spindle microtubule(GO:0005876) |
| 0.0 | 14.3 | GO:0005759 | mitochondrial matrix(GO:0005759) |
| 0.0 | 0.4 | GO:0008540 | proteasome regulatory particle, base subcomplex(GO:0008540) |
| 0.0 | 0.4 | GO:0043189 | NuA4 histone acetyltransferase complex(GO:0035267) H4/H2A histone acetyltransferase complex(GO:0043189) H4 histone acetyltransferase complex(GO:1902562) |
| 0.0 | 0.2 | GO:0033165 | interphotoreceptor matrix(GO:0033165) |
| 0.0 | 0.1 | GO:1990769 | proximal neuron projection(GO:1990769) |
| 0.0 | 4.2 | GO:0043197 | dendritic spine(GO:0043197) |
| 0.0 | 0.8 | GO:0043034 | costamere(GO:0043034) |
| 0.0 | 1.6 | GO:0036126 | sperm flagellum(GO:0036126) |
| 0.0 | 0.1 | GO:0030897 | HOPS complex(GO:0030897) |
| 0.0 | 0.2 | GO:0030905 | retromer, tubulation complex(GO:0030905) |
| 0.0 | 0.5 | GO:0035145 | exon-exon junction complex(GO:0035145) |
| 0.0 | 0.1 | GO:0030312 | external encapsulating structure(GO:0030312) |
| 0.0 | 2.0 | GO:0031093 | platelet alpha granule lumen(GO:0031093) |
| 0.0 | 0.1 | GO:0043196 | varicosity(GO:0043196) |
| 0.0 | 0.2 | GO:0005579 | membrane attack complex(GO:0005579) |
| 0.0 | 2.6 | GO:0044306 | neuron projection terminus(GO:0044306) |
| 0.0 | 3.9 | GO:0005777 | peroxisome(GO:0005777) microbody(GO:0042579) |
| 0.0 | 0.1 | GO:0070652 | HAUS complex(GO:0070652) |
| 0.0 | 0.4 | GO:0035098 | ESC/E(Z) complex(GO:0035098) |
| 0.0 | 0.1 | GO:0070552 | BRISC complex(GO:0070552) |
| 0.0 | 0.3 | GO:0005665 | DNA-directed RNA polymerase II, core complex(GO:0005665) |
| 0.0 | 0.2 | GO:0016461 | unconventional myosin complex(GO:0016461) |
| 0.0 | 0.1 | GO:0034365 | discoidal high-density lipoprotein particle(GO:0034365) |
| 0.0 | 0.3 | GO:0031970 | organelle envelope lumen(GO:0031970) |
| 0.0 | 0.1 | GO:0030915 | Smc5-Smc6 complex(GO:0030915) |
| 0.0 | 0.1 | GO:0061574 | ASAP complex(GO:0061574) |
| 0.0 | 1.0 | GO:0099501 | synaptic vesicle membrane(GO:0030672) exocytic vesicle membrane(GO:0099501) |
| 0.0 | 1.5 | GO:0000922 | spindle pole(GO:0000922) |
| 0.0 | 2.4 | GO:0043202 | lysosomal lumen(GO:0043202) |
| 0.0 | 0.2 | GO:0016471 | vacuolar proton-transporting V-type ATPase complex(GO:0016471) |
| 0.0 | 0.4 | GO:0000791 | euchromatin(GO:0000791) |
| 0.0 | 0.2 | GO:0008385 | IkappaB kinase complex(GO:0008385) |
| 0.0 | 0.2 | GO:0005786 | signal recognition particle, endoplasmic reticulum targeting(GO:0005786) |
| 0.0 | 1.0 | GO:0031463 | Cul3-RING ubiquitin ligase complex(GO:0031463) |
| 0.0 | 1.5 | GO:0015934 | large ribosomal subunit(GO:0015934) |
| 0.0 | 0.5 | GO:0001772 | immunological synapse(GO:0001772) |
| 0.0 | 0.9 | GO:0005834 | heterotrimeric G-protein complex(GO:0005834) |
| 0.0 | 0.3 | GO:0044447 | axoneme part(GO:0044447) |
| 0.0 | 0.1 | GO:0030934 | anchoring collagen complex(GO:0030934) |
| 0.0 | 0.2 | GO:0005847 | mRNA cleavage and polyadenylation specificity factor complex(GO:0005847) |
| 0.0 | 3.4 | GO:0005874 | microtubule(GO:0005874) |
| 0.0 | 0.0 | GO:0097433 | dense body(GO:0097433) |
| 0.0 | 1.9 | GO:0005882 | intermediate filament(GO:0005882) |
| 0.0 | 0.1 | GO:0071546 | pi-body(GO:0071546) |
| 0.0 | 0.1 | GO:0000974 | Prp19 complex(GO:0000974) |
| 0.0 | 0.2 | GO:0005885 | Arp2/3 protein complex(GO:0005885) |
| 0.0 | 0.2 | GO:0042629 | mast cell granule(GO:0042629) |
| 0.0 | 0.1 | GO:0000930 | gamma-tubulin complex(GO:0000930) |
| 0.0 | 0.3 | GO:0043596 | nuclear replication fork(GO:0043596) |
| 0.0 | 0.1 | GO:0071797 | LUBAC complex(GO:0071797) |
| 0.0 | 0.1 | GO:0035985 | senescence-associated heterochromatin focus(GO:0035985) |
| 0.0 | 0.1 | GO:0070761 | pre-snoRNP complex(GO:0070761) |
| 0.0 | 1.2 | GO:0031985 | Golgi cisterna(GO:0031985) |
Gene overrepresentation in molecular function category:
| Log-likelihood per target | Total log-likelihood | Term | Description |
|---|---|---|---|
| 1.1 | 3.4 | GO:0016211 | glutamate-ammonia ligase activity(GO:0004356) ammonia ligase activity(GO:0016211) acid-ammonia (or amide) ligase activity(GO:0016880) |
| 0.9 | 4.4 | GO:0004619 | bisphosphoglycerate mutase activity(GO:0004082) phosphoglycerate mutase activity(GO:0004619) 2,3-bisphosphoglycerate-dependent phosphoglycerate mutase activity(GO:0046538) |
| 0.8 | 4.1 | GO:0004370 | glycerol kinase activity(GO:0004370) |
| 0.7 | 2.2 | GO:0005017 | platelet-derived growth factor-activated receptor activity(GO:0005017) |
| 0.7 | 2.1 | GO:0000248 | C-5 sterol desaturase activity(GO:0000248) sterol desaturase activity(GO:0070704) |
| 0.6 | 3.1 | GO:0042030 | ATPase inhibitor activity(GO:0042030) |
| 0.6 | 3.0 | GO:0098519 | nucleotide phosphatase activity, acting on free nucleotides(GO:0098519) |
| 0.6 | 2.3 | GO:0004306 | ethanolamine-phosphate cytidylyltransferase activity(GO:0004306) |
| 0.5 | 1.5 | GO:0050613 | delta14-sterol reductase activity(GO:0050613) |
| 0.5 | 2.5 | GO:0031749 | D2 dopamine receptor binding(GO:0031749) |
| 0.5 | 4.9 | GO:0046935 | 1-phosphatidylinositol-3-kinase regulator activity(GO:0046935) |
| 0.5 | 1.9 | GO:0031826 | type 2A serotonin receptor binding(GO:0031826) |
| 0.5 | 3.4 | GO:0004594 | pantothenate kinase activity(GO:0004594) |
| 0.5 | 1.4 | GO:0046577 | long-chain-alcohol oxidase activity(GO:0046577) |
| 0.4 | 1.8 | GO:0005169 | neurotrophin TRKB receptor binding(GO:0005169) |
| 0.4 | 2.6 | GO:0051996 | farnesyl-diphosphate farnesyltransferase activity(GO:0004310) squalene synthase activity(GO:0051996) |
| 0.4 | 1.3 | GO:0008534 | oxidized purine nucleobase lesion DNA N-glycosylase activity(GO:0008534) |
| 0.4 | 5.0 | GO:0048407 | platelet-derived growth factor binding(GO:0048407) |
| 0.4 | 2.1 | GO:0004161 | dimethylallyltranstransferase activity(GO:0004161) geranyltranstransferase activity(GO:0004337) |
| 0.4 | 2.3 | GO:0015137 | citrate transmembrane transporter activity(GO:0015137) tricarboxylic acid transmembrane transporter activity(GO:0015142) |
| 0.4 | 1.1 | GO:0034739 | histone deacetylase activity (H4-K16 specific)(GO:0034739) |
| 0.4 | 1.8 | GO:0016453 | C-acetyltransferase activity(GO:0016453) |
| 0.4 | 1.4 | GO:0044378 | non-sequence-specific DNA binding, bending(GO:0044378) |
| 0.3 | 1.0 | GO:0061505 | DNA topoisomerase type II (ATP-hydrolyzing) activity(GO:0003918) DNA topoisomerase II activity(GO:0061505) |
| 0.3 | 1.0 | GO:0010698 | acetyltransferase activator activity(GO:0010698) |
| 0.3 | 1.0 | GO:0004421 | hydroxymethylglutaryl-CoA synthase activity(GO:0004421) |
| 0.3 | 1.0 | GO:0005287 | high-affinity basic amino acid transmembrane transporter activity(GO:0005287) high-affinity arginine transmembrane transporter activity(GO:0005289) high-affinity lysine transmembrane transporter activity(GO:0005292) |
| 0.3 | 1.0 | GO:0004798 | thymidylate kinase activity(GO:0004798) |
| 0.3 | 9.9 | GO:0001965 | G-protein alpha-subunit binding(GO:0001965) |
| 0.3 | 1.0 | GO:0004452 | isopentenyl-diphosphate delta-isomerase activity(GO:0004452) |
| 0.3 | 0.9 | GO:0052810 | 1-phosphatidylinositol-5-kinase activity(GO:0052810) |
| 0.3 | 1.5 | GO:0016822 | hydrolase activity, acting on acid carbon-carbon bonds(GO:0016822) hydrolase activity, acting on acid carbon-carbon bonds, in ketonic substances(GO:0016823) |
| 0.3 | 2.7 | GO:0016206 | catechol O-methyltransferase activity(GO:0016206) |
| 0.3 | 2.4 | GO:0050833 | pyruvate transmembrane transporter activity(GO:0050833) |
| 0.3 | 0.9 | GO:0016649 | electron-transferring-flavoprotein dehydrogenase activity(GO:0004174) oxidoreductase activity, acting on the CH-NH group of donors, quinone or similar compound as acceptor(GO:0016649) |
| 0.3 | 2.3 | GO:0004735 | pyrroline-5-carboxylate reductase activity(GO:0004735) |
| 0.3 | 1.1 | GO:0004616 | phosphogluconate dehydrogenase (decarboxylating) activity(GO:0004616) |
| 0.3 | 0.8 | GO:0003955 | NAD(P)H dehydrogenase (quinone) activity(GO:0003955) |
| 0.3 | 4.1 | GO:0005225 | volume-sensitive anion channel activity(GO:0005225) |
| 0.3 | 0.8 | GO:0033981 | D-dopachrome decarboxylase activity(GO:0033981) |
| 0.3 | 0.8 | GO:0003826 | alpha-ketoacid dehydrogenase activity(GO:0003826) 3-methyl-2-oxobutanoate dehydrogenase (2-methylpropanoyl-transferring) activity(GO:0003863) |
| 0.2 | 1.2 | GO:0008969 | phosphohistidine phosphatase activity(GO:0008969) |
| 0.2 | 0.7 | GO:0004874 | aryl hydrocarbon receptor activity(GO:0004874) |
| 0.2 | 0.7 | GO:0005483 | soluble NSF attachment protein activity(GO:0005483) |
| 0.2 | 2.3 | GO:0032138 | single base insertion or deletion binding(GO:0032138) |
| 0.2 | 1.2 | GO:0047066 | phospholipid-hydroperoxide glutathione peroxidase activity(GO:0047066) |
| 0.2 | 0.9 | GO:0032145 | 4-aminobutyrate transaminase activity(GO:0003867) succinate-semialdehyde dehydrogenase binding(GO:0032145) (S)-3-amino-2-methylpropionate transaminase activity(GO:0047298) |
| 0.2 | 0.6 | GO:0047012 | C-3 sterol dehydrogenase (C-4 sterol decarboxylase) activity(GO:0000252) sterol-4-alpha-carboxylate 3-dehydrogenase (decarboxylating) activity(GO:0047012) |
| 0.2 | 2.6 | GO:0051434 | BH3 domain binding(GO:0051434) |
| 0.2 | 0.8 | GO:0033265 | choline binding(GO:0033265) |
| 0.2 | 1.9 | GO:0048495 | Roundabout binding(GO:0048495) |
| 0.2 | 0.6 | GO:0004157 | dihydropyrimidinase activity(GO:0004157) |
| 0.2 | 1.4 | GO:0004771 | sterol esterase activity(GO:0004771) |
| 0.2 | 0.6 | GO:0030156 | benzodiazepine receptor binding(GO:0030156) |
| 0.2 | 0.6 | GO:0004416 | hydroxyacylglutathione hydrolase activity(GO:0004416) |
| 0.2 | 0.6 | GO:0052815 | medium-chain acyl-CoA hydrolase activity(GO:0052815) long-chain acyl-CoA hydrolase activity(GO:0052816) |
| 0.2 | 2.2 | GO:0042731 | PH domain binding(GO:0042731) |
| 0.2 | 1.8 | GO:0016670 | oxidoreductase activity, acting on a sulfur group of donors, oxygen as acceptor(GO:0016670) |
| 0.2 | 2.0 | GO:0004957 | prostaglandin E receptor activity(GO:0004957) |
| 0.2 | 0.6 | GO:0008424 | glycoprotein 6-alpha-L-fucosyltransferase activity(GO:0008424) alpha-(1->6)-fucosyltransferase activity(GO:0046921) |
| 0.2 | 0.6 | GO:0019150 | D-ribulokinase activity(GO:0019150) |
| 0.2 | 0.6 | GO:0015616 | DNA translocase activity(GO:0015616) |
| 0.2 | 3.7 | GO:0004551 | nucleotide diphosphatase activity(GO:0004551) |
| 0.2 | 0.9 | GO:0030395 | lactose binding(GO:0030395) |
| 0.2 | 1.8 | GO:0034235 | GPI anchor binding(GO:0034235) |
| 0.2 | 0.7 | GO:0004449 | isocitrate dehydrogenase (NAD+) activity(GO:0004449) |
| 0.2 | 1.0 | GO:0030348 | syntaxin-3 binding(GO:0030348) |
| 0.2 | 0.7 | GO:0004647 | phosphoserine phosphatase activity(GO:0004647) |
| 0.2 | 3.5 | GO:0008510 | sodium:bicarbonate symporter activity(GO:0008510) |
| 0.2 | 3.1 | GO:0061578 | Lys63-specific deubiquitinase activity(GO:0061578) |
| 0.2 | 0.6 | GO:0000285 | 1-phosphatidylinositol-3-phosphate 5-kinase activity(GO:0000285) |
| 0.2 | 4.1 | GO:0005095 | GTPase inhibitor activity(GO:0005095) |
| 0.2 | 0.6 | GO:0008665 | 2'-phosphotransferase activity(GO:0008665) |
| 0.2 | 3.9 | GO:0000062 | fatty-acyl-CoA binding(GO:0000062) |
| 0.2 | 0.6 | GO:0004032 | alditol:NADP+ 1-oxidoreductase activity(GO:0004032) |
| 0.2 | 3.6 | GO:0019870 | potassium channel inhibitor activity(GO:0019870) |
| 0.1 | 1.3 | GO:0034056 | estrogen response element binding(GO:0034056) |
| 0.1 | 0.9 | GO:0004095 | carnitine O-palmitoyltransferase activity(GO:0004095) |
| 0.1 | 0.6 | GO:0017089 | glycolipid transporter activity(GO:0017089) |
| 0.1 | 0.6 | GO:0061769 | ribosylnicotinamide kinase activity(GO:0050262) ribosylnicotinate kinase activity(GO:0061769) |
| 0.1 | 0.6 | GO:0070905 | serine binding(GO:0070905) |
| 0.1 | 1.4 | GO:0030346 | protein phosphatase 2B binding(GO:0030346) |
| 0.1 | 0.6 | GO:0004773 | steryl-sulfatase activity(GO:0004773) |
| 0.1 | 0.7 | GO:0032795 | heterotrimeric G-protein binding(GO:0032795) |
| 0.1 | 1.1 | GO:0050815 | phosphoserine binding(GO:0050815) |
| 0.1 | 7.3 | GO:0061631 | ubiquitin conjugating enzyme activity(GO:0061631) |
| 0.1 | 2.0 | GO:0045159 | myosin II binding(GO:0045159) |
| 0.1 | 0.8 | GO:0070568 | guanylyltransferase activity(GO:0070568) |
| 0.1 | 1.0 | GO:0003747 | translation release factor activity(GO:0003747) translation termination factor activity(GO:0008079) |
| 0.1 | 1.3 | GO:0042799 | histone methyltransferase activity (H4-K20 specific)(GO:0042799) |
| 0.1 | 1.7 | GO:0050072 | m7G(5')pppN diphosphatase activity(GO:0050072) |
| 0.1 | 1.0 | GO:1990599 | 3' overhang single-stranded DNA endodeoxyribonuclease activity(GO:1990599) |
| 0.1 | 0.6 | GO:0004999 | vasoactive intestinal polypeptide receptor activity(GO:0004999) |
| 0.1 | 0.6 | GO:0004468 | lysine N-acetyltransferase activity, acting on acetyl phosphate as donor(GO:0004468) |
| 0.1 | 0.7 | GO:0004096 | catalase activity(GO:0004096) |
| 0.1 | 0.4 | GO:0016784 | 3-mercaptopyruvate sulfurtransferase activity(GO:0016784) |
| 0.1 | 1.1 | GO:0070740 | tubulin-glutamic acid ligase activity(GO:0070740) |
| 0.1 | 0.5 | GO:0061650 | ubiquitin-like protein conjugating enzyme activity(GO:0061650) |
| 0.1 | 0.2 | GO:0004074 | biliverdin reductase activity(GO:0004074) |
| 0.1 | 1.8 | GO:0008199 | ferric iron binding(GO:0008199) |
| 0.1 | 13.4 | GO:0004722 | protein serine/threonine phosphatase activity(GO:0004722) |
| 0.1 | 0.2 | GO:0032139 | dinucleotide insertion or deletion binding(GO:0032139) |
| 0.1 | 1.4 | GO:0070181 | small ribosomal subunit rRNA binding(GO:0070181) |
| 0.1 | 0.3 | GO:0030550 | acetylcholine receptor inhibitor activity(GO:0030550) |
| 0.1 | 0.8 | GO:0008479 | queuine tRNA-ribosyltransferase activity(GO:0008479) |
| 0.1 | 0.7 | GO:0015307 | drug:proton antiporter activity(GO:0015307) |
| 0.1 | 0.9 | GO:1904929 | coreceptor activity involved in Wnt signaling pathway, planar cell polarity pathway(GO:1904929) |
| 0.1 | 2.3 | GO:0004861 | cyclin-dependent protein serine/threonine kinase inhibitor activity(GO:0004861) |
| 0.1 | 0.8 | GO:0004797 | thymidine kinase activity(GO:0004797) |
| 0.1 | 0.7 | GO:0061649 | ubiquitinated histone binding(GO:0061649) |
| 0.1 | 0.7 | GO:0003998 | acylphosphatase activity(GO:0003998) |
| 0.1 | 3.1 | GO:0034236 | protein kinase A catalytic subunit binding(GO:0034236) |
| 0.1 | 0.4 | GO:0031716 | calcitonin receptor binding(GO:0031716) |
| 0.1 | 0.4 | GO:0032137 | guanine/thymine mispair binding(GO:0032137) |
| 0.1 | 1.3 | GO:0097157 | pre-mRNA intronic binding(GO:0097157) |
| 0.1 | 0.4 | GO:0042134 | rRNA primary transcript binding(GO:0042134) |
| 0.1 | 0.5 | GO:0050436 | microfibril binding(GO:0050436) |
| 0.1 | 0.3 | GO:0050571 | 1,5-anhydro-D-fructose reductase activity(GO:0050571) |
| 0.1 | 1.8 | GO:0070403 | NAD+ binding(GO:0070403) |
| 0.1 | 0.6 | GO:0004740 | pyruvate dehydrogenase (acetyl-transferring) kinase activity(GO:0004740) |
| 0.1 | 0.7 | GO:0015180 | L-alanine transmembrane transporter activity(GO:0015180) alanine transmembrane transporter activity(GO:0022858) |
| 0.1 | 0.4 | GO:0010385 | double-stranded methylated DNA binding(GO:0010385) |
| 0.1 | 1.2 | GO:0008607 | phosphorylase kinase regulator activity(GO:0008607) |
| 0.1 | 0.3 | GO:0034584 | piRNA binding(GO:0034584) |
| 0.1 | 0.1 | GO:0016639 | oxidoreductase activity, acting on the CH-NH2 group of donors, NAD or NADP as acceptor(GO:0016639) |
| 0.1 | 0.5 | GO:0004882 | androgen receptor activity(GO:0004882) |
| 0.1 | 0.8 | GO:0031730 | CCR5 chemokine receptor binding(GO:0031730) |
| 0.1 | 0.3 | GO:0060422 | peptidyl-dipeptidase inhibitor activity(GO:0060422) |
| 0.1 | 0.3 | GO:0003923 | GPI-anchor transamidase activity(GO:0003923) |
| 0.1 | 0.7 | GO:0016721 | superoxide dismutase activity(GO:0004784) oxidoreductase activity, acting on superoxide radicals as acceptor(GO:0016721) |
| 0.1 | 0.6 | GO:0048408 | epidermal growth factor binding(GO:0048408) |
| 0.1 | 0.9 | GO:0055104 | ligase inhibitor activity(GO:0055104) ubiquitin ligase inhibitor activity(GO:1990948) |
| 0.1 | 6.4 | GO:0004407 | histone deacetylase activity(GO:0004407) |
| 0.1 | 0.4 | GO:0061676 | importin-alpha family protein binding(GO:0061676) |
| 0.1 | 3.2 | GO:0070577 | lysine-acetylated histone binding(GO:0070577) |
| 0.1 | 0.6 | GO:0046975 | histone methyltransferase activity (H3-K36 specific)(GO:0046975) |
| 0.1 | 0.5 | GO:0042392 | sphingosine-1-phosphate phosphatase activity(GO:0042392) |
| 0.1 | 0.3 | GO:0052839 | inositol 5-diphosphate pentakisphosphate 5-kinase activity(GO:0052836) inositol diphosphate tetrakisphosphate kinase activity(GO:0052839) |
| 0.1 | 0.2 | GO:0031752 | D5 dopamine receptor binding(GO:0031752) |
| 0.1 | 0.8 | GO:0019531 | oxalate transmembrane transporter activity(GO:0019531) |
| 0.1 | 0.4 | GO:0004140 | dephospho-CoA kinase activity(GO:0004140) |
| 0.1 | 0.7 | GO:0008597 | calcium-dependent protein serine/threonine phosphatase regulator activity(GO:0008597) |
| 0.1 | 0.2 | GO:0000253 | 3-keto sterol reductase activity(GO:0000253) |
| 0.1 | 0.1 | GO:0052812 | phosphatidylinositol-3,4-bisphosphate 5-kinase activity(GO:0052812) |
| 0.1 | 1.0 | GO:0009374 | biotin binding(GO:0009374) |
| 0.1 | 0.2 | GO:0035651 | AP-3 adaptor complex binding(GO:0035651) |
| 0.1 | 3.1 | GO:0003785 | actin monomer binding(GO:0003785) |
| 0.1 | 0.3 | GO:0003983 | UTP:glucose-1-phosphate uridylyltransferase activity(GO:0003983) UTP-monosaccharide-1-phosphate uridylyltransferase activity(GO:0051748) |
| 0.1 | 2.2 | GO:0016646 | oxidoreductase activity, acting on the CH-NH group of donors, NAD or NADP as acceptor(GO:0016646) |
| 0.1 | 11.8 | GO:0017048 | Rho GTPase binding(GO:0017048) |
| 0.1 | 1.8 | GO:0035615 | clathrin adaptor activity(GO:0035615) endocytic adaptor activity(GO:0098748) |
| 0.1 | 1.1 | GO:0004691 | cAMP-dependent protein kinase activity(GO:0004691) |
| 0.1 | 0.6 | GO:0044323 | retinoic acid-responsive element binding(GO:0044323) |
| 0.1 | 0.4 | GO:0044729 | hemi-methylated DNA-binding(GO:0044729) |
| 0.1 | 1.4 | GO:0035925 | mRNA 3'-UTR AU-rich region binding(GO:0035925) |
| 0.1 | 2.2 | GO:0071949 | FAD binding(GO:0071949) |
| 0.1 | 0.3 | GO:0004852 | uroporphyrinogen-III synthase activity(GO:0004852) |
| 0.1 | 0.5 | GO:0061133 | endopeptidase activator activity(GO:0061133) |
| 0.1 | 3.0 | GO:1990841 | promoter-specific chromatin binding(GO:1990841) |
| 0.1 | 6.1 | GO:0019003 | GDP binding(GO:0019003) |
| 0.1 | 1.7 | GO:0035497 | cAMP response element binding(GO:0035497) |
| 0.1 | 0.2 | GO:0001596 | angiotensin type I receptor activity(GO:0001596) |
| 0.1 | 0.5 | GO:0008158 | hedgehog receptor activity(GO:0008158) |
| 0.1 | 2.3 | GO:0070566 | adenylyltransferase activity(GO:0070566) |
| 0.1 | 0.3 | GO:0004915 | interleukin-6 receptor activity(GO:0004915) leukemia inhibitory factor receptor activity(GO:0004923) interleukin-6 binding(GO:0019981) |
| 0.1 | 0.8 | GO:0019215 | intermediate filament binding(GO:0019215) |
| 0.1 | 0.1 | GO:0015141 | succinate transmembrane transporter activity(GO:0015141) |
| 0.1 | 0.9 | GO:0098505 | G-rich strand telomeric DNA binding(GO:0098505) |
| 0.1 | 1.1 | GO:0003924 | GTPase activity(GO:0003924) |
| 0.1 | 0.2 | GO:0004878 | complement component C5a receptor activity(GO:0004878) |
| 0.1 | 0.4 | GO:0043237 | laminin-1 binding(GO:0043237) |
| 0.1 | 0.6 | GO:0004844 | uracil DNA N-glycosylase activity(GO:0004844) deaminated base DNA N-glycosylase activity(GO:0097506) |
| 0.1 | 0.2 | GO:0034353 | RNA pyrophosphohydrolase activity(GO:0034353) |
| 0.1 | 4.6 | GO:0016655 | oxidoreductase activity, acting on NAD(P)H, quinone or similar compound as acceptor(GO:0016655) |
| 0.1 | 0.3 | GO:0016933 | extracellular-glycine-gated ion channel activity(GO:0016933) extracellular-glycine-gated chloride channel activity(GO:0016934) |
| 0.1 | 0.3 | GO:1990254 | keratin filament binding(GO:1990254) |
| 0.1 | 0.5 | GO:0030618 | transforming growth factor beta receptor, pathway-specific cytoplasmic mediator activity(GO:0030618) |
| 0.1 | 0.3 | GO:0019862 | IgA binding(GO:0019862) |
| 0.1 | 1.3 | GO:0001223 | transcription coactivator binding(GO:0001223) |
| 0.1 | 0.9 | GO:0001206 | transcriptional repressor activity, RNA polymerase II distal enhancer sequence-specific binding(GO:0001206) |
| 0.1 | 0.5 | GO:0033743 | peptide-methionine (R)-S-oxide reductase activity(GO:0033743) |
| 0.1 | 2.6 | GO:0043015 | gamma-tubulin binding(GO:0043015) |
| 0.1 | 0.3 | GO:0005113 | patched binding(GO:0005113) |
| 0.1 | 0.5 | GO:0019784 | NEDD8-specific protease activity(GO:0019784) |
| 0.1 | 0.3 | GO:0005167 | neurotrophin TRK receptor binding(GO:0005167) |
| 0.1 | 1.3 | GO:0097602 | cullin family protein binding(GO:0097602) |
| 0.1 | 0.8 | GO:0031386 | protein tag(GO:0031386) |
| 0.1 | 1.1 | GO:0008253 | 5'-nucleotidase activity(GO:0008253) |
| 0.1 | 1.1 | GO:0086008 | voltage-gated potassium channel activity involved in cardiac muscle cell action potential repolarization(GO:0086008) |
| 0.1 | 0.4 | GO:0004523 | RNA-DNA hybrid ribonuclease activity(GO:0004523) |
| 0.1 | 2.1 | GO:0080025 | phosphatidylinositol-3,5-bisphosphate binding(GO:0080025) |
| 0.1 | 0.3 | GO:0017108 | 5'-flap endonuclease activity(GO:0017108) |
| 0.1 | 2.2 | GO:0043236 | laminin binding(GO:0043236) |
| 0.1 | 2.9 | GO:0005484 | SNAP receptor activity(GO:0005484) |
| 0.1 | 0.3 | GO:0004614 | phosphoglucomutase activity(GO:0004614) |
| 0.1 | 1.2 | GO:0070300 | phosphatidic acid binding(GO:0070300) |
| 0.1 | 3.7 | GO:0003678 | DNA helicase activity(GO:0003678) |
| 0.1 | 2.8 | GO:0031491 | nucleosome binding(GO:0031491) |
| 0.1 | 0.4 | GO:0010997 | anaphase-promoting complex binding(GO:0010997) |
| 0.1 | 0.7 | GO:0004726 | non-membrane spanning protein tyrosine phosphatase activity(GO:0004726) |
| 0.0 | 0.8 | GO:0004791 | thioredoxin-disulfide reductase activity(GO:0004791) |
| 0.0 | 1.3 | GO:0008301 | DNA binding, bending(GO:0008301) |
| 0.0 | 0.2 | GO:1904492 | Ac-Asp-Glu binding(GO:1904492) tetrahydrofolyl-poly(glutamate) polymer binding(GO:1904493) |
| 0.0 | 0.3 | GO:0047696 | beta-adrenergic receptor kinase activity(GO:0047696) |
| 0.0 | 0.6 | GO:0070679 | inositol 1,4,5 trisphosphate binding(GO:0070679) |
| 0.0 | 3.3 | GO:0000980 | RNA polymerase II distal enhancer sequence-specific DNA binding(GO:0000980) |
| 0.0 | 0.2 | GO:0004803 | transposase activity(GO:0004803) |
| 0.0 | 1.4 | GO:0046961 | ATPase activity, coupled to transmembrane movement of ions, rotational mechanism(GO:0044769) proton-transporting ATPase activity, rotational mechanism(GO:0046961) |
| 0.0 | 0.5 | GO:0004634 | phosphopyruvate hydratase activity(GO:0004634) |
| 0.0 | 1.5 | GO:0004707 | MAP kinase activity(GO:0004707) |
| 0.0 | 0.2 | GO:0004360 | glutamine-fructose-6-phosphate transaminase (isomerizing) activity(GO:0004360) |
| 0.0 | 0.2 | GO:0097100 | supercoiled DNA binding(GO:0097100) |
| 0.0 | 0.0 | GO:0034416 | bisphosphoglycerate phosphatase activity(GO:0034416) |
| 0.0 | 0.3 | GO:0001517 | N-acetylglucosamine 6-O-sulfotransferase activity(GO:0001517) |
| 0.0 | 1.5 | GO:0003887 | DNA-directed DNA polymerase activity(GO:0003887) |
| 0.0 | 0.2 | GO:0005087 | Ran guanyl-nucleotide exchange factor activity(GO:0005087) |
| 0.0 | 0.2 | GO:0005220 | inositol 1,4,5-trisphosphate-sensitive calcium-release channel activity(GO:0005220) |
| 0.0 | 0.5 | GO:0017162 | aryl hydrocarbon receptor binding(GO:0017162) |
| 0.0 | 0.2 | GO:0005047 | signal recognition particle binding(GO:0005047) |
| 0.0 | 0.2 | GO:1990460 | leptin receptor binding(GO:1990460) |
| 0.0 | 0.4 | GO:0005131 | growth hormone receptor binding(GO:0005131) |
| 0.0 | 0.4 | GO:0004128 | cytochrome-b5 reductase activity, acting on NAD(P)H(GO:0004128) |
| 0.0 | 4.3 | GO:0005518 | collagen binding(GO:0005518) |
| 0.0 | 0.1 | GO:0008267 | poly-glutamine tract binding(GO:0008267) |
| 0.0 | 2.3 | GO:0005546 | phosphatidylinositol-4,5-bisphosphate binding(GO:0005546) |
| 0.0 | 0.2 | GO:0008321 | Ral guanyl-nucleotide exchange factor activity(GO:0008321) |
| 0.0 | 2.9 | GO:0004402 | histone acetyltransferase activity(GO:0004402) |
| 0.0 | 1.0 | GO:0000993 | RNA polymerase II core binding(GO:0000993) |
| 0.0 | 0.2 | GO:0004335 | galactokinase activity(GO:0004335) |
| 0.0 | 2.3 | GO:0004712 | protein serine/threonine/tyrosine kinase activity(GO:0004712) |
| 0.0 | 0.8 | GO:0098641 | cadherin binding involved in cell-cell adhesion(GO:0098641) |
| 0.0 | 4.9 | GO:0019208 | phosphatase regulator activity(GO:0019208) |
| 0.0 | 1.5 | GO:0008139 | nuclear localization sequence binding(GO:0008139) |
| 0.0 | 0.2 | GO:0016668 | oxidoreductase activity, acting on a sulfur group of donors, NAD(P) as acceptor(GO:0016668) |
| 0.0 | 0.3 | GO:0004727 | prenylated protein tyrosine phosphatase activity(GO:0004727) |
| 0.0 | 1.0 | GO:0017075 | syntaxin-1 binding(GO:0017075) |
| 0.0 | 0.4 | GO:0032050 | clathrin heavy chain binding(GO:0032050) |
| 0.0 | 0.3 | GO:0030983 | mismatched DNA binding(GO:0030983) |
| 0.0 | 0.1 | GO:0052591 | sn-glycerol-3-phosphate:ubiquinone oxidoreductase activity(GO:0052590) sn-glycerol-3-phosphate:ubiquinone-8 oxidoreductase activity(GO:0052591) |
| 0.0 | 0.1 | GO:0070139 | ubiquitin-like protein-specific endopeptidase activity(GO:0070137) SUMO-specific endopeptidase activity(GO:0070139) |
| 0.0 | 0.8 | GO:0004185 | serine-type carboxypeptidase activity(GO:0004185) |
| 0.0 | 0.1 | GO:0051525 | NFAT protein binding(GO:0051525) |
| 0.0 | 0.4 | GO:0005078 | MAP-kinase scaffold activity(GO:0005078) |
| 0.0 | 5.3 | GO:0042393 | histone binding(GO:0042393) |
| 0.0 | 2.9 | GO:0035591 | signaling adaptor activity(GO:0035591) |
| 0.0 | 0.7 | GO:0005024 | transforming growth factor beta-activated receptor activity(GO:0005024) |
| 0.0 | 1.4 | GO:0030544 | Hsp70 protein binding(GO:0030544) |
| 0.0 | 1.2 | GO:0001786 | phosphatidylserine binding(GO:0001786) |
| 0.0 | 0.7 | GO:0001871 | pattern binding(GO:0001871) polysaccharide binding(GO:0030247) |
| 0.0 | 0.3 | GO:0044548 | S100 protein binding(GO:0044548) |
| 0.0 | 0.2 | GO:0008109 | N-acetyllactosaminide beta-1,6-N-acetylglucosaminyltransferase activity(GO:0008109) |
| 0.0 | 0.2 | GO:0035173 | histone kinase activity(GO:0035173) |
| 0.0 | 0.1 | GO:0005010 | insulin-like growth factor-activated receptor activity(GO:0005010) |
| 0.0 | 0.3 | GO:0000268 | peroxisome targeting sequence binding(GO:0000268) |
| 0.0 | 0.2 | GO:1902444 | riboflavin binding(GO:1902444) |
| 0.0 | 0.9 | GO:0004298 | threonine-type endopeptidase activity(GO:0004298) threonine-type peptidase activity(GO:0070003) |
| 0.0 | 0.2 | GO:0003691 | double-stranded telomeric DNA binding(GO:0003691) |
| 0.0 | 0.1 | GO:0034602 | oxoglutarate dehydrogenase (NAD+) activity(GO:0034602) |
| 0.0 | 1.5 | GO:0005164 | tumor necrosis factor receptor binding(GO:0005164) |
| 0.0 | 0.1 | GO:0003986 | acetyl-CoA hydrolase activity(GO:0003986) |
| 0.0 | 0.1 | GO:0070991 | medium-chain-acyl-CoA dehydrogenase activity(GO:0070991) |
| 0.0 | 0.6 | GO:0000339 | RNA cap binding(GO:0000339) |
| 0.0 | 0.1 | GO:0004618 | phosphoglycerate kinase activity(GO:0004618) |
| 0.0 | 0.1 | GO:0008853 | exodeoxyribonuclease III activity(GO:0008853) |
| 0.0 | 0.2 | GO:0050786 | RAGE receptor binding(GO:0050786) |
| 0.0 | 1.1 | GO:0005158 | insulin receptor binding(GO:0005158) |
| 0.0 | 0.2 | GO:1901612 | cardiolipin binding(GO:1901612) |
| 0.0 | 3.7 | GO:0004386 | helicase activity(GO:0004386) |
| 0.0 | 0.2 | GO:0003988 | acetyl-CoA C-acyltransferase activity(GO:0003988) |
| 0.0 | 3.0 | GO:0003777 | microtubule motor activity(GO:0003777) |
| 0.0 | 1.3 | GO:0035035 | histone acetyltransferase binding(GO:0035035) |
| 0.0 | 3.4 | GO:0043130 | ubiquitin binding(GO:0043130) |
| 0.0 | 0.6 | GO:0017091 | AU-rich element binding(GO:0017091) |
| 0.0 | 1.3 | GO:0017046 | peptide hormone binding(GO:0017046) |
| 0.0 | 0.5 | GO:0031683 | G-protein beta/gamma-subunit complex binding(GO:0031683) |
| 0.0 | 0.6 | GO:0034185 | apolipoprotein binding(GO:0034185) |
| 0.0 | 0.7 | GO:0008143 | poly(A) binding(GO:0008143) |
| 0.0 | 0.9 | GO:0004709 | MAP kinase kinase kinase activity(GO:0004709) |
| 0.0 | 4.7 | GO:0017124 | SH3 domain binding(GO:0017124) |
| 0.0 | 1.8 | GO:0048306 | calcium-dependent protein binding(GO:0048306) |
| 0.0 | 0.1 | GO:0051373 | FATZ binding(GO:0051373) |
| 0.0 | 0.3 | GO:0008429 | phosphatidylethanolamine binding(GO:0008429) |
| 0.0 | 0.6 | GO:0097200 | cysteine-type endopeptidase activity involved in execution phase of apoptosis(GO:0097200) |
| 0.0 | 0.6 | GO:0032266 | phosphatidylinositol-3-phosphate binding(GO:0032266) |
| 0.0 | 1.4 | GO:0008028 | monocarboxylic acid transmembrane transporter activity(GO:0008028) |
| 0.0 | 0.2 | GO:0045545 | syndecan binding(GO:0045545) |
| 0.0 | 0.6 | GO:0008483 | transaminase activity(GO:0008483) |
| 0.0 | 0.2 | GO:0048039 | ubiquinone binding(GO:0048039) |
| 0.0 | 0.1 | GO:0004359 | glutaminase activity(GO:0004359) |
| 0.0 | 0.1 | GO:0016671 | oxidoreductase activity, acting on a sulfur group of donors, disulfide as acceptor(GO:0016671) |
| 0.0 | 0.3 | GO:0030742 | GTP-dependent protein binding(GO:0030742) |
| 0.0 | 0.2 | GO:0030292 | protein tyrosine kinase inhibitor activity(GO:0030292) |
| 0.0 | 0.1 | GO:0031849 | olfactory receptor binding(GO:0031849) |
| 0.0 | 0.2 | GO:0008430 | selenium binding(GO:0008430) |
| 0.0 | 0.3 | GO:0001135 | transcription factor activity, RNA polymerase II transcription factor recruiting(GO:0001135) |
| 0.0 | 0.1 | GO:0071566 | UFM1 activating enzyme activity(GO:0071566) |
| 0.0 | 0.4 | GO:0047372 | acylglycerol lipase activity(GO:0047372) |
| 0.0 | 0.2 | GO:0015450 | P-P-bond-hydrolysis-driven protein transmembrane transporter activity(GO:0015450) |
| 0.0 | 1.2 | GO:0016859 | cis-trans isomerase activity(GO:0016859) |
| 0.0 | 0.2 | GO:0016286 | small conductance calcium-activated potassium channel activity(GO:0016286) |
| 0.0 | 0.1 | GO:0016714 | oxidoreductase activity, acting on paired donors, with incorporation or reduction of molecular oxygen, reduced pteridine as one donor, and incorporation of one atom of oxygen(GO:0016714) |
| 0.0 | 0.3 | GO:0015501 | glutamate:sodium symporter activity(GO:0015501) |
| 0.0 | 0.0 | GO:0031711 | bradykinin receptor binding(GO:0031711) |
| 0.0 | 1.2 | GO:0005507 | copper ion binding(GO:0005507) |
| 0.0 | 0.4 | GO:0016641 | oxidoreductase activity, acting on the CH-NH2 group of donors, oxygen as acceptor(GO:0016641) |
| 0.0 | 0.1 | GO:0016744 | transferase activity, transferring aldehyde or ketonic groups(GO:0016744) |
| 0.0 | 0.8 | GO:0030971 | receptor tyrosine kinase binding(GO:0030971) |
| 0.0 | 0.4 | GO:0019992 | diacylglycerol binding(GO:0019992) |
| 0.0 | 0.8 | GO:0031690 | adrenergic receptor binding(GO:0031690) |
| 0.0 | 0.6 | GO:0030159 | receptor signaling complex scaffold activity(GO:0030159) |
| 0.0 | 0.0 | GO:0071987 | WD40-repeat domain binding(GO:0071987) |
| 0.0 | 0.4 | GO:0030898 | actin-dependent ATPase activity(GO:0030898) |
| 0.0 | 0.1 | GO:0043199 | sulfate binding(GO:0043199) |
| 0.0 | 0.2 | GO:0042975 | peroxisome proliferator activated receptor binding(GO:0042975) |
| 0.0 | 0.1 | GO:0042610 | CD8 receptor binding(GO:0042610) |
| 0.0 | 0.4 | GO:0008198 | ferrous iron binding(GO:0008198) |
| 0.0 | 0.3 | GO:0045294 | alpha-catenin binding(GO:0045294) |
| 0.0 | 0.1 | GO:0035368 | selenocysteine insertion sequence binding(GO:0035368) |
| 0.0 | 0.1 | GO:0030345 | extracellular matrix structural constituent conferring compression resistance(GO:0030021) structural constituent of tooth enamel(GO:0030345) |
| 0.0 | 0.1 | GO:0003909 | DNA ligase activity(GO:0003909) DNA ligase (ATP) activity(GO:0003910) |
| 0.0 | 0.1 | GO:0005280 | hydrogen:amino acid symporter activity(GO:0005280) |
| 0.0 | 0.4 | GO:0004181 | metallocarboxypeptidase activity(GO:0004181) |
| 0.0 | 0.1 | GO:0010340 | carboxyl-O-methyltransferase activity(GO:0010340) protein carboxyl O-methyltransferase activity(GO:0051998) |
| 0.0 | 0.9 | GO:0003899 | DNA-directed RNA polymerase activity(GO:0003899) RNA polymerase activity(GO:0034062) |
| 0.0 | 0.2 | GO:0060072 | large conductance calcium-activated potassium channel activity(GO:0060072) |
| 0.0 | 0.3 | GO:0050431 | transforming growth factor beta binding(GO:0050431) |
| 0.0 | 0.3 | GO:0015929 | hexosaminidase activity(GO:0015929) |
| 0.0 | 0.4 | GO:0043539 | protein serine/threonine kinase activator activity(GO:0043539) |
| 0.0 | 0.3 | GO:0004535 | poly(A)-specific ribonuclease activity(GO:0004535) |
| 0.0 | 0.3 | GO:0004653 | polypeptide N-acetylgalactosaminyltransferase activity(GO:0004653) |
| 0.0 | 0.1 | GO:0016888 | endodeoxyribonuclease activity, producing 5'-phosphomonoesters(GO:0016888) |
| 0.0 | 0.1 | GO:0003828 | alpha-N-acetylneuraminate alpha-2,8-sialyltransferase activity(GO:0003828) |
| 0.0 | 0.2 | GO:0004716 | receptor signaling protein tyrosine kinase activity(GO:0004716) |
| 0.0 | 0.3 | GO:0019905 | syntaxin binding(GO:0019905) |
| 0.0 | 2.2 | GO:0005089 | Rho guanyl-nucleotide exchange factor activity(GO:0005089) |
| 0.0 | 0.1 | GO:0008467 | [heparan sulfate]-glucosamine 3-sulfotransferase 1 activity(GO:0008467) |
| 0.0 | 0.1 | GO:0050656 | 3'-phosphoadenosine 5'-phosphosulfate binding(GO:0050656) |
| 0.0 | 0.0 | GO:0016300 | tRNA (uracil) methyltransferase activity(GO:0016300) |
| 0.0 | 0.2 | GO:0004016 | adenylate cyclase activity(GO:0004016) |
| 0.0 | 0.0 | GO:0051538 | 3 iron, 4 sulfur cluster binding(GO:0051538) |
| 0.0 | 0.1 | GO:0035800 | deubiquitinase activator activity(GO:0035800) |
| 0.0 | 0.1 | GO:0008097 | 5S rRNA binding(GO:0008097) |
| 0.0 | 5.4 | GO:0030695 | GTPase regulator activity(GO:0030695) |
| 0.0 | 0.1 | GO:0003886 | DNA (cytosine-5-)-methyltransferase activity(GO:0003886) |
| 0.0 | 0.3 | GO:0097109 | neuroligin family protein binding(GO:0097109) |
| 0.0 | 1.7 | GO:0008238 | exopeptidase activity(GO:0008238) |
| 0.0 | 0.1 | GO:0031728 | CCR3 chemokine receptor binding(GO:0031728) |
| 0.0 | 0.1 | GO:0001665 | alpha-N-acetylgalactosaminide alpha-2,6-sialyltransferase activity(GO:0001665) |
| 0.0 | 0.4 | GO:0005086 | ARF guanyl-nucleotide exchange factor activity(GO:0005086) |
| 0.0 | 0.5 | GO:0044390 | ubiquitin-like protein conjugating enzyme binding(GO:0044390) |
| 0.0 | 0.2 | GO:0016538 | cyclin-dependent protein serine/threonine kinase regulator activity(GO:0016538) |
| 0.0 | 4.6 | GO:0005525 | GTP binding(GO:0005525) |
| 0.0 | 0.1 | GO:0001515 | opioid peptide activity(GO:0001515) |
| 0.0 | 0.1 | GO:0031871 | proteinase activated receptor binding(GO:0031871) |
| 0.0 | 0.3 | GO:0004550 | nucleoside diphosphate kinase activity(GO:0004550) |
| 0.0 | 0.6 | GO:0030276 | clathrin binding(GO:0030276) |
| 0.0 | 0.3 | GO:0042169 | SH2 domain binding(GO:0042169) |
| 0.0 | 0.1 | GO:0046912 | transferase activity, transferring acyl groups, acyl groups converted into alkyl on transfer(GO:0046912) |
| 0.0 | 0.7 | GO:0004843 | thiol-dependent ubiquitin-specific protease activity(GO:0004843) |
| 0.0 | 0.4 | GO:0008308 | voltage-gated anion channel activity(GO:0008308) |
| 0.0 | 0.1 | GO:0035473 | lipase binding(GO:0035473) |
| 0.0 | 0.1 | GO:0015106 | bicarbonate transmembrane transporter activity(GO:0015106) |
| 0.0 | 0.1 | GO:0004045 | aminoacyl-tRNA hydrolase activity(GO:0004045) |
| 0.0 | 0.3 | GO:0008191 | metalloendopeptidase inhibitor activity(GO:0008191) |
| 0.0 | 0.1 | GO:0099583 | neurotransmitter receptor activity involved in regulation of postsynaptic cytosolic calcium ion concentration(GO:0099583) |
| 0.0 | 0.0 | GO:0050119 | N-acetylglucosamine deacetylase activity(GO:0050119) |
| 0.0 | 0.1 | GO:0003872 | 6-phosphofructokinase activity(GO:0003872) |
| 0.0 | 0.1 | GO:0051032 | nucleic acid transmembrane transporter activity(GO:0051032) RNA transmembrane transporter activity(GO:0051033) |
| 0.0 | 0.1 | GO:0016900 | oxidoreductase activity, acting on the CH-OH group of donors, disulfide as acceptor(GO:0016900) vitamin-K-epoxide reductase (warfarin-sensitive) activity(GO:0047057) |
Gene overrepresentation in curated gene sets: canonical pathways category:
| Log-likelihood per target | Total log-likelihood | Term | Description |
|---|---|---|---|
| 0.2 | 2.0 | PID CXCR4 PATHWAY | CXCR4-mediated signaling events |
| 0.1 | 10.2 | PID PLK1 PATHWAY | PLK1 signaling events |
| 0.1 | 4.0 | PID ARF 3PATHWAY | Arf1 pathway |
| 0.1 | 2.0 | ST TYPE I INTERFERON PATHWAY | Type I Interferon (alpha/beta IFN) Pathway |
| 0.1 | 7.5 | NABA BASEMENT MEMBRANES | Genes encoding structural components of basement membranes |
| 0.1 | 2.4 | PID P38 GAMMA DELTA PATHWAY | Signaling mediated by p38-gamma and p38-delta |
| 0.1 | 2.7 | SA PROGRAMMED CELL DEATH | Programmed cell death, or apoptosis, eliminates damaged or unneeded cells. |
| 0.1 | 4.7 | NABA COLLAGENS | Genes encoding collagen proteins |
| 0.1 | 2.3 | PID CIRCADIAN PATHWAY | Circadian rhythm pathway |
| 0.1 | 8.3 | PID TCPTP PATHWAY | Signaling events mediated by TCPTP |
| 0.1 | 1.1 | PID RANBP2 PATHWAY | Sumoylation by RanBP2 regulates transcriptional repression |
| 0.1 | 2.2 | SA G1 AND S PHASES | Cdk2, 4, and 6 bind cyclin D in G1, while cdk2/cyclin E promotes the G1/S transition. |
| 0.1 | 5.1 | SIG PIP3 SIGNALING IN B LYMPHOCYTES | Genes related to PIP3 signaling in B lymphocytes |
| 0.1 | 2.0 | PID HIF1A PATHWAY | Hypoxic and oxygen homeostasis regulation of HIF-1-alpha |
| 0.1 | 3.3 | PID SYNDECAN 2 PATHWAY | Syndecan-2-mediated signaling events |
| 0.1 | 2.8 | PID P38 MKK3 6PATHWAY | p38 MAPK signaling pathway |
| 0.1 | 3.5 | PID AURORA B PATHWAY | Aurora B signaling |
| 0.1 | 0.3 | SA B CELL RECEPTOR COMPLEXES | Antigen binding to B cell receptors activates protein tyrosine kinases, such as the Src family, which ultimate activate MAP kinases. |
| 0.1 | 1.5 | PID NFKAPPAB ATYPICAL PATHWAY | Atypical NF-kappaB pathway |
| 0.1 | 2.5 | PID NFKAPPAB CANONICAL PATHWAY | Canonical NF-kappaB pathway |
| 0.1 | 1.7 | PID S1P S1P2 PATHWAY | S1P2 pathway |
| 0.1 | 1.3 | PID DELTA NP63 PATHWAY | Validated transcriptional targets of deltaNp63 isoforms |
| 0.1 | 1.3 | SA FAS SIGNALING | The TNF-type receptor Fas induces apoptosis on ligand binding. |
| 0.1 | 2.3 | PID IL12 STAT4 PATHWAY | IL12 signaling mediated by STAT4 |
| 0.1 | 6.4 | PID MYC REPRESS PATHWAY | Validated targets of C-MYC transcriptional repression |
| 0.1 | 0.7 | PID AURORA A PATHWAY | Aurora A signaling |
| 0.0 | 2.4 | PID RAC1 REG PATHWAY | Regulation of RAC1 activity |
| 0.0 | 0.4 | SIG IL4RECEPTOR IN B LYPHOCYTES | Genes related to IL4 rceptor signaling in B lymphocytes |
| 0.0 | 0.3 | PID S1P S1P4 PATHWAY | S1P4 pathway |
| 0.0 | 2.4 | PID INTEGRIN A4B1 PATHWAY | Alpha4 beta1 integrin signaling events |
| 0.0 | 2.5 | PID HEDGEHOG GLI PATHWAY | Hedgehog signaling events mediated by Gli proteins |
| 0.0 | 3.5 | PID CDC42 REG PATHWAY | Regulation of CDC42 activity |
| 0.0 | 2.9 | PID HNF3B PATHWAY | FOXA2 and FOXA3 transcription factor networks |
| 0.0 | 3.1 | PID HNF3A PATHWAY | FOXA1 transcription factor network |
| 0.0 | 2.3 | PID PTP1B PATHWAY | Signaling events mediated by PTP1B |
| 0.0 | 2.5 | NABA PROTEOGLYCANS | Genes encoding proteoglycans |
| 0.0 | 2.0 | PID SHP2 PATHWAY | SHP2 signaling |
| 0.0 | 0.0 | PID ERB GENOMIC PATHWAY | Validated nuclear estrogen receptor beta network |
| 0.0 | 1.0 | PID RET PATHWAY | Signaling events regulated by Ret tyrosine kinase |
| 0.0 | 1.2 | PID P38 MK2 PATHWAY | p38 signaling mediated by MAPKAP kinases |
| 0.0 | 1.3 | PID ERBB1 INTERNALIZATION PATHWAY | Internalization of ErbB1 |
| 0.0 | 1.3 | PID THROMBIN PAR1 PATHWAY | PAR1-mediated thrombin signaling events |
| 0.0 | 1.8 | PID NETRIN PATHWAY | Netrin-mediated signaling events |
| 0.0 | 1.4 | PID TCR CALCIUM PATHWAY | Calcium signaling in the CD4+ TCR pathway |
| 0.0 | 1.0 | PID FOXO PATHWAY | FoxO family signaling |
| 0.0 | 1.0 | PID PRL SIGNALING EVENTS PATHWAY | Signaling events mediated by PRL |
| 0.0 | 0.8 | ST GA12 PATHWAY | G alpha 12 Pathway |
| 0.0 | 0.1 | PID NFAT 3PATHWAY | Role of Calcineurin-dependent NFAT signaling in lymphocytes |
| 0.0 | 1.0 | PID MYC PATHWAY | C-MYC pathway |
| 0.0 | 1.0 | ST T CELL SIGNAL TRANSDUCTION | T Cell Signal Transduction |
| 0.0 | 1.1 | PID IL12 2PATHWAY | IL12-mediated signaling events |
| 0.0 | 1.8 | PID IL4 2PATHWAY | IL4-mediated signaling events |
| 0.0 | 0.2 | PID WNT CANONICAL PATHWAY | Canonical Wnt signaling pathway |
| 0.0 | 1.9 | PID REG GR PATHWAY | Glucocorticoid receptor regulatory network |
| 0.0 | 0.1 | SIG BCR SIGNALING PATHWAY | Members of the BCR signaling pathway |
| 0.0 | 0.8 | PID ARF6 PATHWAY | Arf6 signaling events |
| 0.0 | 0.6 | PID HDAC CLASSIII PATHWAY | Signaling events mediated by HDAC Class III |
| 0.0 | 0.8 | SIG CHEMOTAXIS | Genes related to chemotaxis |
| 0.0 | 0.2 | PID EPO PATHWAY | EPO signaling pathway |
| 0.0 | 0.6 | PID TAP63 PATHWAY | Validated transcriptional targets of TAp63 isoforms |
| 0.0 | 1.1 | PID AR TF PATHWAY | Regulation of Androgen receptor activity |
| 0.0 | 0.1 | ST PHOSPHOINOSITIDE 3 KINASE PATHWAY | PI3K Pathway |
| 0.0 | 0.5 | PID HDAC CLASSII PATHWAY | Signaling events mediated by HDAC Class II |
| 0.0 | 0.2 | ST TUMOR NECROSIS FACTOR PATHWAY | Tumor Necrosis Factor Pathway. |
| 0.0 | 0.2 | PID A6B1 A6B4 INTEGRIN PATHWAY | a6b1 and a6b4 Integrin signaling |
| 0.0 | 1.3 | PID RB 1PATHWAY | Regulation of retinoblastoma protein |
| 0.0 | 1.1 | PID E2F PATHWAY | E2F transcription factor network |
| 0.0 | 0.3 | SIG PIP3 SIGNALING IN CARDIAC MYOCTES | Genes related to PIP3 signaling in cardiac myocytes |
| 0.0 | 0.4 | SIG CD40PATHWAYMAP | Genes related to CD40 signaling |
| 0.0 | 0.2 | PID BCR 5PATHWAY | BCR signaling pathway |
| 0.0 | 0.2 | PID IL23 PATHWAY | IL23-mediated signaling events |
| 0.0 | 1.0 | PID PDGFRB PATHWAY | PDGFR-beta signaling pathway |
| 0.0 | 0.1 | PID ERBB1 RECEPTOR PROXIMAL PATHWAY | EGF receptor (ErbB1) signaling pathway |
| 0.0 | 0.3 | PID LYSOPHOSPHOLIPID PATHWAY | LPA receptor mediated events |
| 0.0 | 0.4 | PID AP1 PATHWAY | AP-1 transcription factor network |
| 0.0 | 0.3 | PID VEGFR1 2 PATHWAY | Signaling events mediated by VEGFR1 and VEGFR2 |
| 0.0 | 0.2 | SIG REGULATION OF THE ACTIN CYTOSKELETON BY RHO GTPASES | Genes related to regulation of the actin cytoskeleton |
Gene overrepresentation in curated gene sets: REACTOME pathways category:
| Log-likelihood per target | Total log-likelihood | Term | Description |
|---|---|---|---|
| 0.3 | 4.3 | REACTOME PLATELET ADHESION TO EXPOSED COLLAGEN | Genes involved in Platelet Adhesion to exposed collagen |
| 0.2 | 4.3 | REACTOME THE NLRP3 INFLAMMASOME | Genes involved in The NLRP3 inflammasome |
| 0.2 | 4.9 | REACTOME IL 7 SIGNALING | Genes involved in Interleukin-7 signaling |
| 0.2 | 6.8 | REACTOME AMINO ACID SYNTHESIS AND INTERCONVERSION TRANSAMINATION | Genes involved in Amino acid synthesis and interconversion (transamination) |
| 0.2 | 3.1 | REACTOME REMOVAL OF THE FLAP INTERMEDIATE FROM THE C STRAND | Genes involved in Removal of the Flap Intermediate from the C-strand |
| 0.2 | 3.4 | REACTOME VITAMIN B5 PANTOTHENATE METABOLISM | Genes involved in Vitamin B5 (pantothenate) metabolism |
| 0.2 | 0.2 | REACTOME APC C CDC20 MEDIATED DEGRADATION OF MITOTIC PROTEINS | Genes involved in APC/C:Cdc20 mediated degradation of mitotic proteins |
| 0.2 | 7.0 | REACTOME INHIBITION OF THE PROTEOLYTIC ACTIVITY OF APC C REQUIRED FOR THE ONSET OF ANAPHASE BY MITOTIC SPINDLE CHECKPOINT COMPONENTS | Genes involved in Inhibition of the proteolytic activity of APC/C required for the onset of anaphase by mitotic spindle checkpoint components |
| 0.2 | 2.9 | REACTOME IL 6 SIGNALING | Genes involved in Interleukin-6 signaling |
| 0.2 | 7.8 | REACTOME CHOLESTEROL BIOSYNTHESIS | Genes involved in Cholesterol biosynthesis |
| 0.2 | 2.6 | REACTOME INFLAMMASOMES | Genes involved in Inflammasomes |
| 0.2 | 3.6 | REACTOME GLUCAGON SIGNALING IN METABOLIC REGULATION | Genes involved in Glucagon signaling in metabolic regulation |
| 0.2 | 2.0 | REACTOME PROSTANOID LIGAND RECEPTORS | Genes involved in Prostanoid ligand receptors |
| 0.1 | 2.6 | REACTOME ALPHA LINOLENIC ACID ALA METABOLISM | Genes involved in alpha-linolenic acid (ALA) metabolism |
| 0.1 | 3.9 | REACTOME POST CHAPERONIN TUBULIN FOLDING PATHWAY | Genes involved in Post-chaperonin tubulin folding pathway |
| 0.1 | 7.1 | REACTOME RECYCLING PATHWAY OF L1 | Genes involved in Recycling pathway of L1 |
| 0.1 | 2.0 | REACTOME CDC6 ASSOCIATION WITH THE ORC ORIGIN COMPLEX | Genes involved in CDC6 association with the ORC:origin complex |
| 0.1 | 3.8 | REACTOME BRANCHED CHAIN AMINO ACID CATABOLISM | Genes involved in Branched-chain amino acid catabolism |
| 0.1 | 9.8 | REACTOME G ALPHA Z SIGNALLING EVENTS | Genes involved in G alpha (z) signalling events |
| 0.1 | 2.5 | REACTOME SYNTHESIS OF PE | Genes involved in Synthesis of PE |
| 0.1 | 0.3 | REACTOME DESTABILIZATION OF MRNA BY BRF1 | Genes involved in Destabilization of mRNA by Butyrate Response Factor 1 (BRF1) |
| 0.1 | 2.2 | REACTOME THROMBIN SIGNALLING THROUGH PROTEINASE ACTIVATED RECEPTORS PARS | Genes involved in Thrombin signalling through proteinase activated receptors (PARs) |
| 0.1 | 2.6 | REACTOME MRNA DECAY BY 5 TO 3 EXORIBONUCLEASE | Genes involved in mRNA Decay by 5' to 3' Exoribonuclease |
| 0.1 | 3.4 | REACTOME BOTULINUM NEUROTOXICITY | Genes involved in Botulinum neurotoxicity |
| 0.1 | 0.5 | REACTOME APC CDC20 MEDIATED DEGRADATION OF NEK2A | Genes involved in APC-Cdc20 mediated degradation of Nek2A |
| 0.1 | 0.5 | REACTOME REGULATION OF THE FANCONI ANEMIA PATHWAY | Genes involved in Regulation of the Fanconi anemia pathway |
| 0.1 | 1.8 | REACTOME ROLE OF DCC IN REGULATING APOPTOSIS | Genes involved in Role of DCC in regulating apoptosis |
| 0.1 | 1.6 | REACTOME ERKS ARE INACTIVATED | Genes involved in ERKs are inactivated |
| 0.1 | 4.4 | REACTOME A TETRASACCHARIDE LINKER SEQUENCE IS REQUIRED FOR GAG SYNTHESIS | Genes involved in A tetrasaccharide linker sequence is required for GAG synthesis |
| 0.1 | 10.1 | REACTOME G ALPHA1213 SIGNALLING EVENTS | Genes involved in G alpha (12/13) signalling events |
| 0.1 | 1.7 | REACTOME G2 M DNA DAMAGE CHECKPOINT | Genes involved in G2/M DNA damage checkpoint |
| 0.1 | 5.3 | REACTOME NEGATIVE REGULATORS OF RIG I MDA5 SIGNALING | Genes involved in Negative regulators of RIG-I/MDA5 signaling |
| 0.1 | 0.7 | REACTOME REGULATION OF INSULIN SECRETION BY ACETYLCHOLINE | Genes involved in Regulation of Insulin Secretion by Acetylcholine |
| 0.1 | 0.7 | REACTOME SIGNALING BY EGFR IN CANCER | Genes involved in Signaling by EGFR in Cancer |
| 0.1 | 1.5 | REACTOME MITOCHONDRIAL FATTY ACID BETA OXIDATION | Genes involved in Mitochondrial Fatty Acid Beta-Oxidation |
| 0.1 | 1.9 | REACTOME DEPOSITION OF NEW CENPA CONTAINING NUCLEOSOMES AT THE CENTROMERE | Genes involved in Deposition of New CENPA-containing Nucleosomes at the Centromere |
| 0.1 | 0.9 | REACTOME COPI MEDIATED TRANSPORT | Genes involved in COPI Mediated Transport |
| 0.1 | 2.7 | REACTOME KINESINS | Genes involved in Kinesins |
| 0.1 | 0.2 | REACTOME P53 DEPENDENT G1 DNA DAMAGE RESPONSE | Genes involved in p53-Dependent G1 DNA Damage Response |
| 0.1 | 0.7 | REACTOME REGULATION OF ORNITHINE DECARBOXYLASE ODC | Genes involved in Regulation of ornithine decarboxylase (ODC) |
| 0.1 | 1.6 | REACTOME DAG AND IP3 SIGNALING | Genes involved in DAG and IP3 signaling |
| 0.1 | 1.1 | REACTOME SYNTHESIS OF PIPS AT THE LATE ENDOSOME MEMBRANE | Genes involved in Synthesis of PIPs at the late endosome membrane |
| 0.1 | 0.1 | REACTOME CIRCADIAN REPRESSION OF EXPRESSION BY REV ERBA | Genes involved in Circadian Repression of Expression by REV-ERBA |
| 0.1 | 0.8 | REACTOME APOPTOSIS INDUCED DNA FRAGMENTATION | Genes involved in Apoptosis induced DNA fragmentation |
| 0.1 | 5.2 | REACTOME RESPIRATORY ELECTRON TRANSPORT | Genes involved in Respiratory electron transport |
| 0.1 | 1.1 | REACTOME CTLA4 INHIBITORY SIGNALING | Genes involved in CTLA4 inhibitory signaling |
| 0.1 | 1.3 | REACTOME CITRIC ACID CYCLE TCA CYCLE | Genes involved in Citric acid cycle (TCA cycle) |
| 0.1 | 1.3 | REACTOME AKT PHOSPHORYLATES TARGETS IN THE CYTOSOL | Genes involved in AKT phosphorylates targets in the cytosol |
| 0.1 | 1.1 | REACTOME BASE FREE SUGAR PHOSPHATE REMOVAL VIA THE SINGLE NUCLEOTIDE REPLACEMENT PATHWAY | Genes involved in Base-free sugar-phosphate removal via the single-nucleotide replacement pathway |
| 0.1 | 0.9 | REACTOME SIGNAL ATTENUATION | Genes involved in Signal attenuation |
| 0.0 | 2.8 | REACTOME NETRIN1 SIGNALING | Genes involved in Netrin-1 signaling |
| 0.0 | 7.1 | REACTOME SIGNALING BY RHO GTPASES | Genes involved in Signaling by Rho GTPases |
| 0.0 | 1.4 | REACTOME FORMATION OF INCISION COMPLEX IN GG NER | Genes involved in Formation of incision complex in GG-NER |
| 0.0 | 0.9 | REACTOME REGULATION OF RHEB GTPASE ACTIVITY BY AMPK | Genes involved in Regulation of Rheb GTPase activity by AMPK |
| 0.0 | 0.0 | REACTOME TRAF3 DEPENDENT IRF ACTIVATION PATHWAY | Genes involved in TRAF3-dependent IRF activation pathway |
| 0.0 | 0.9 | REACTOME GABA SYNTHESIS RELEASE REUPTAKE AND DEGRADATION | Genes involved in GABA synthesis, release, reuptake and degradation |
| 0.0 | 1.9 | REACTOME MRNA SPLICING MINOR PATHWAY | Genes involved in mRNA Splicing - Minor Pathway |
| 0.0 | 0.6 | REACTOME KERATAN SULFATE DEGRADATION | Genes involved in Keratan sulfate degradation |
| 0.0 | 0.8 | REACTOME P38MAPK EVENTS | Genes involved in p38MAPK events |
| 0.0 | 1.3 | REACTOME LYSOSOME VESICLE BIOGENESIS | Genes involved in Lysosome Vesicle Biogenesis |
| 0.0 | 1.3 | REACTOME REGULATION OF HYPOXIA INDUCIBLE FACTOR HIF BY OXYGEN | Genes involved in Regulation of Hypoxia-inducible Factor (HIF) by Oxygen |
| 0.0 | 4.6 | REACTOME FACTORS INVOLVED IN MEGAKARYOCYTE DEVELOPMENT AND PLATELET PRODUCTION | Genes involved in Factors involved in megakaryocyte development and platelet production |
| 0.0 | 1.3 | REACTOME EFFECTS OF PIP2 HYDROLYSIS | Genes involved in Effects of PIP2 hydrolysis |
| 0.0 | 2.1 | REACTOME TRANSPORT TO THE GOLGI AND SUBSEQUENT MODIFICATION | Genes involved in Transport to the Golgi and subsequent modification |
| 0.0 | 1.5 | REACTOME RNA POL III TRANSCRIPTION TERMINATION | Genes involved in RNA Polymerase III Transcription Termination |
| 0.0 | 1.0 | REACTOME DARPP 32 EVENTS | Genes involved in DARPP-32 events |
| 0.0 | 0.6 | REACTOME INTRINSIC PATHWAY | Genes involved in Intrinsic Pathway |
| 0.0 | 1.4 | REACTOME SYNTHESIS AND INTERCONVERSION OF NUCLEOTIDE DI AND TRIPHOSPHATES | Genes involved in Synthesis and interconversion of nucleotide di- and triphosphates |
| 0.0 | 0.6 | REACTOME SIGNALING BY FGFR1 FUSION MUTANTS | Genes involved in Signaling by FGFR1 fusion mutants |
| 0.0 | 0.7 | REACTOME ACTIVATED AMPK STIMULATES FATTY ACID OXIDATION IN MUSCLE | Genes involved in Activated AMPK stimulates fatty-acid oxidation in muscle |
| 0.0 | 1.4 | REACTOME MAPK TARGETS NUCLEAR EVENTS MEDIATED BY MAP KINASES | Genes involved in MAPK targets/ Nuclear events mediated by MAP kinases |
| 0.0 | 0.8 | REACTOME DESTABILIZATION OF MRNA BY KSRP | Genes involved in Destabilization of mRNA by KSRP |
| 0.0 | 0.6 | REACTOME GLUCAGON TYPE LIGAND RECEPTORS | Genes involved in Glucagon-type ligand receptors |
| 0.0 | 2.7 | REACTOME LOSS OF NLP FROM MITOTIC CENTROSOMES | Genes involved in Loss of Nlp from mitotic centrosomes |
| 0.0 | 0.6 | REACTOME THE ACTIVATION OF ARYLSULFATASES | Genes involved in The activation of arylsulfatases |
| 0.0 | 2.3 | REACTOME SCF BETA TRCP MEDIATED DEGRADATION OF EMI1 | Genes involved in SCF-beta-TrCP mediated degradation of Emi1 |
| 0.0 | 1.5 | REACTOME BMAL1 CLOCK NPAS2 ACTIVATES CIRCADIAN EXPRESSION | Genes involved in BMAL1:CLOCK/NPAS2 Activates Circadian Expression |
| 0.0 | 0.7 | REACTOME GLUTAMATE NEUROTRANSMITTER RELEASE CYCLE | Genes involved in Glutamate Neurotransmitter Release Cycle |
| 0.0 | 0.0 | REACTOME INTERACTIONS OF VPR WITH HOST CELLULAR PROTEINS | Genes involved in Interactions of Vpr with host cellular proteins |
| 0.0 | 0.2 | REACTOME SYNTHESIS OF PIPS AT THE EARLY ENDOSOME MEMBRANE | Genes involved in Synthesis of PIPs at the early endosome membrane |
| 0.0 | 1.6 | REACTOME MHC CLASS II ANTIGEN PRESENTATION | Genes involved in MHC class II antigen presentation |
| 0.0 | 0.4 | REACTOME ANTIGEN ACTIVATES B CELL RECEPTOR LEADING TO GENERATION OF SECOND MESSENGERS | Genes involved in Antigen Activates B Cell Receptor Leading to Generation of Second Messengers |
| 0.0 | 1.0 | REACTOME CASPASE MEDIATED CLEAVAGE OF CYTOSKELETAL PROTEINS | Genes involved in Caspase-mediated cleavage of cytoskeletal proteins |
| 0.0 | 0.2 | REACTOME SPRY REGULATION OF FGF SIGNALING | Genes involved in Spry regulation of FGF signaling |
| 0.0 | 0.3 | REACTOME FANCONI ANEMIA PATHWAY | Genes involved in Fanconi Anemia pathway |
| 0.0 | 0.8 | REACTOME PRE NOTCH TRANSCRIPTION AND TRANSLATION | Genes involved in Pre-NOTCH Transcription and Translation |
| 0.0 | 0.5 | REACTOME CELL EXTRACELLULAR MATRIX INTERACTIONS | Genes involved in Cell-extracellular matrix interactions |
| 0.0 | 3.8 | REACTOME TRANSPORT OF INORGANIC CATIONS ANIONS AND AMINO ACIDS OLIGOPEPTIDES | Genes involved in Transport of inorganic cations/anions and amino acids/oligopeptides |
| 0.0 | 10.8 | REACTOME GENERIC TRANSCRIPTION PATHWAY | Genes involved in Generic Transcription Pathway |
| 0.0 | 0.5 | REACTOME SEMA4D INDUCED CELL MIGRATION AND GROWTH CONE COLLAPSE | Genes involved in Sema4D induced cell migration and growth-cone collapse |
| 0.0 | 0.9 | REACTOME STEROID HORMONES | Genes involved in Steroid hormones |
| 0.0 | 0.6 | REACTOME NOD1 2 SIGNALING PATHWAY | Genes involved in NOD1/2 Signaling Pathway |
| 0.0 | 0.5 | REACTOME ORGANIC CATION ANION ZWITTERION TRANSPORT | Genes involved in Organic cation/anion/zwitterion transport |
| 0.0 | 1.2 | REACTOME TRANS GOLGI NETWORK VESICLE BUDDING | Genes involved in trans-Golgi Network Vesicle Budding |
| 0.0 | 0.2 | REACTOME APOBEC3G MEDIATED RESISTANCE TO HIV1 INFECTION | Genes involved in APOBEC3G mediated resistance to HIV-1 infection |
| 0.0 | 0.2 | REACTOME HOMOLOGOUS RECOMBINATION REPAIR OF REPLICATION INDEPENDENT DOUBLE STRAND BREAKS | Genes involved in Homologous recombination repair of replication-independent double-strand breaks |
| 0.0 | 0.1 | REACTOME REGULATION OF INSULIN SECRETION | Genes involved in Regulation of Insulin Secretion |
| 0.0 | 0.2 | REACTOME REGULATION OF SIGNALING BY CBL | Genes involved in Regulation of signaling by CBL |
| 0.0 | 0.5 | REACTOME INHIBITION OF VOLTAGE GATED CA2 CHANNELS VIA GBETA GAMMA SUBUNITS | Genes involved in Inhibition of voltage gated Ca2+ channels via Gbeta/gamma subunits |
| 0.0 | 1.2 | REACTOME TRANSCRIPTIONAL REGULATION OF WHITE ADIPOCYTE DIFFERENTIATION | Genes involved in Transcriptional Regulation of White Adipocyte Differentiation |
| 0.0 | 0.3 | REACTOME GRB2 SOS PROVIDES LINKAGE TO MAPK SIGNALING FOR INTERGRINS | Genes involved in GRB2:SOS provides linkage to MAPK signaling for Intergrins |
| 0.0 | 0.4 | REACTOME CHONDROITIN SULFATE BIOSYNTHESIS | Genes involved in Chondroitin sulfate biosynthesis |
| 0.0 | 0.8 | REACTOME PYRIMIDINE METABOLISM | Genes involved in Pyrimidine metabolism |
| 0.0 | 0.4 | REACTOME G1 PHASE | Genes involved in G1 Phase |
| 0.0 | 0.1 | REACTOME SIGNALING BY WNT | Genes involved in Signaling by Wnt |
| 0.0 | 0.5 | REACTOME METABOLISM OF PORPHYRINS | Genes involved in Metabolism of porphyrins |
| 0.0 | 0.5 | REACTOME SYNTHESIS OF PIPS AT THE PLASMA MEMBRANE | Genes involved in Synthesis of PIPs at the plasma membrane |
| 0.0 | 0.3 | REACTOME GLUCURONIDATION | Genes involved in Glucuronidation |
| 0.0 | 0.1 | REACTOME TRAF6 MEDIATED IRF7 ACTIVATION | Genes involved in TRAF6 mediated IRF7 activation |
| 0.0 | 0.6 | REACTOME MYOGENESIS | Genes involved in Myogenesis |
| 0.0 | 2.2 | REACTOME NONSENSE MEDIATED DECAY ENHANCED BY THE EXON JUNCTION COMPLEX | Genes involved in Nonsense Mediated Decay Enhanced by the Exon Junction Complex |
| 0.0 | 0.1 | REACTOME TRYPTOPHAN CATABOLISM | Genes involved in Tryptophan catabolism |
| 0.0 | 0.8 | REACTOME ANTIVIRAL MECHANISM BY IFN STIMULATED GENES | Genes involved in Antiviral mechanism by IFN-stimulated genes |
| 0.0 | 0.3 | REACTOME REGULATION OF INSULIN LIKE GROWTH FACTOR IGF ACTIVITY BY INSULIN LIKE GROWTH FACTOR BINDING PROTEINS IGFBPS | Genes involved in Regulation of Insulin-like Growth Factor (IGF) Activity by Insulin-like Growth Factor Binding Proteins (IGFBPs) |
| 0.0 | 0.8 | REACTOME NCAM1 INTERACTIONS | Genes involved in NCAM1 interactions |