Project
Epithelial-Mesenchymal Transition, human (Scheel, 2011)
Navigation
Downloads
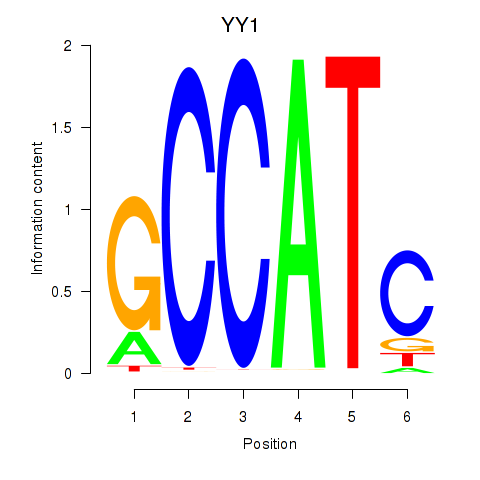
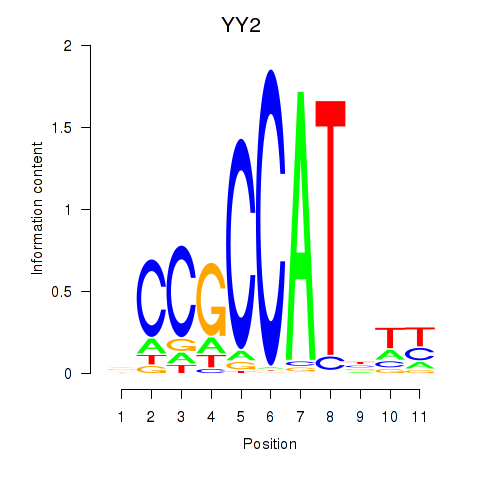
Results for YY1_YY2
Z-value: 1.07
Motif logo
Transcription factors associated with YY1_YY2
| Gene Symbol | Gene ID | Gene Info |
|---|---|---|
|
YY1
|
ENSG00000100811.14 | YY1 transcription factor |
|
YY2
|
ENSG00000230797.3 | YY2 transcription factor |
Activity-expression correlation:
| Gene | Promoter | Pearson corr. coef. | P-value | Plot |
|---|---|---|---|---|
| YY1 | hg38_v1_chr14_+_100239121_100239196 | 0.42 | 3.0e-01 | Click! |
| YY2 | hg38_v1_chrX_+_21855987_21855987 | 0.05 | 9.1e-01 | Click! |
Activity profile of YY1_YY2 motif
Sorted Z-values of YY1_YY2 motif
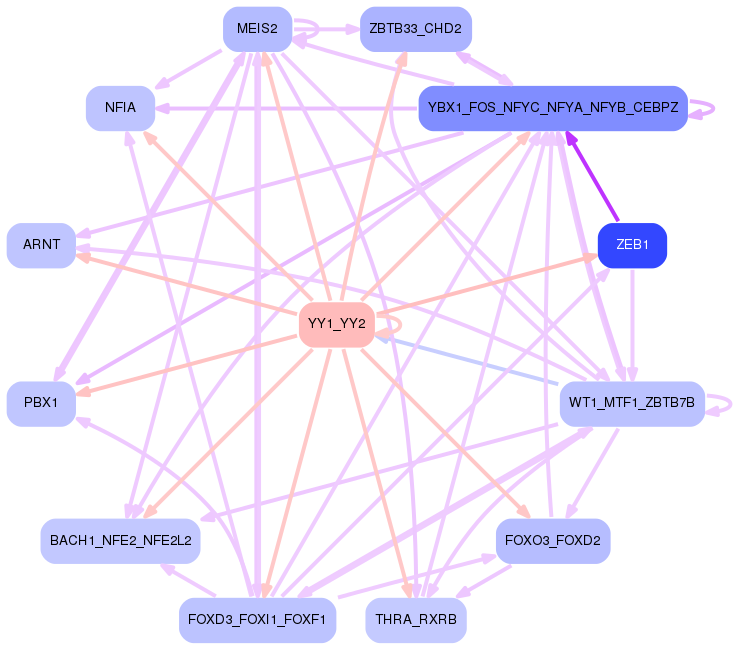
Network of associatons between targets according to the STRING database.

First level regulatory network of YY1_YY2
Gene Ontology Analysis
Gene overrepresentation in biological process category:
| Log-likelihood per target | Total log-likelihood | Term | Description |
|---|---|---|---|
| 0.6 | 1.7 | GO:0090341 | negative regulation of secretion of lysosomal enzymes(GO:0090341) |
| 0.5 | 2.0 | GO:2000314 | regulation of neural crest formation(GO:0090299) negative regulation of neural crest formation(GO:0090301) negative regulation of fibroblast growth factor receptor signaling pathway involved in neural plate anterior/posterior pattern formation(GO:2000314) |
| 0.3 | 1.7 | GO:0003065 | positive regulation of heart rate by epinephrine(GO:0003065) |
| 0.3 | 0.8 | GO:1902824 | positive regulation of late endosome to lysosome transport(GO:1902824) |
| 0.2 | 0.7 | GO:0035691 | macrophage migration inhibitory factor signaling pathway(GO:0035691) |
| 0.2 | 0.7 | GO:1903225 | negative regulation of endodermal cell differentiation(GO:1903225) |
| 0.2 | 0.6 | GO:1902309 | regulation of heart rate by hormone(GO:0003064) negative regulation of peptidyl-serine dephosphorylation(GO:1902309) |
| 0.2 | 0.6 | GO:0060392 | negative regulation of SMAD protein import into nucleus(GO:0060392) |
| 0.2 | 1.3 | GO:0060988 | lipid tube assembly(GO:0060988) |
| 0.2 | 0.6 | GO:0035494 | SNARE complex disassembly(GO:0035494) |
| 0.2 | 1.5 | GO:0089700 | protein kinase D signaling(GO:0089700) |
| 0.2 | 0.5 | GO:0006683 | galactosylceramide catabolic process(GO:0006683) |
| 0.2 | 0.5 | GO:0001544 | initiation of primordial ovarian follicle growth(GO:0001544) |
| 0.2 | 1.4 | GO:0070236 | negative regulation of activation-induced cell death of T cells(GO:0070236) |
| 0.2 | 0.6 | GO:2000984 | regulation of ATP citrate synthase activity(GO:2000983) negative regulation of ATP citrate synthase activity(GO:2000984) |
| 0.2 | 0.6 | GO:1903173 | phytol metabolic process(GO:0033306) fatty alcohol metabolic process(GO:1903173) |
| 0.1 | 2.2 | GO:0007288 | sperm axoneme assembly(GO:0007288) |
| 0.1 | 2.4 | GO:1900747 | negative regulation of vascular endothelial growth factor signaling pathway(GO:1900747) |
| 0.1 | 0.6 | GO:1904428 | negative regulation of tubulin deacetylation(GO:1904428) |
| 0.1 | 0.5 | GO:1902445 | regulation of mitochondrial membrane permeability involved in programmed necrotic cell death(GO:1902445) |
| 0.1 | 1.3 | GO:0051344 | negative regulation of cyclic-nucleotide phosphodiesterase activity(GO:0051344) |
| 0.1 | 0.3 | GO:0030505 | inorganic diphosphate transport(GO:0030505) |
| 0.1 | 0.5 | GO:0036515 | serotonergic neuron axon guidance(GO:0036515) |
| 0.1 | 0.4 | GO:0070213 | protein auto-ADP-ribosylation(GO:0070213) |
| 0.1 | 1.0 | GO:0046886 | positive regulation of hormone biosynthetic process(GO:0046886) |
| 0.1 | 0.3 | GO:0046416 | D-amino acid metabolic process(GO:0046416) |
| 0.1 | 0.4 | GO:1903756 | regulation of transcription from RNA polymerase II promoter by histone modification(GO:1903756) negative regulation of transcription from RNA polymerase II promoter by histone modification(GO:1903758) |
| 0.1 | 0.9 | GO:1904684 | negative regulation of metalloendopeptidase activity(GO:1904684) |
| 0.1 | 0.4 | GO:0071418 | cellular response to amine stimulus(GO:0071418) |
| 0.1 | 0.6 | GO:0097498 | endothelial tube lumen extension(GO:0097498) |
| 0.1 | 0.8 | GO:0045602 | negative regulation of endothelial cell differentiation(GO:0045602) |
| 0.1 | 0.3 | GO:0044537 | regulation of circulating fibrinogen levels(GO:0044537) |
| 0.1 | 0.3 | GO:0034402 | recruitment of 3'-end processing factors to RNA polymerase II holoenzyme complex(GO:0034402) |
| 0.1 | 0.3 | GO:0050760 | negative regulation of thymidylate synthase biosynthetic process(GO:0050760) |
| 0.1 | 0.4 | GO:0019072 | viral genome packaging(GO:0019072) viral RNA genome packaging(GO:0019074) |
| 0.1 | 0.5 | GO:0035624 | receptor transactivation(GO:0035624) |
| 0.1 | 0.3 | GO:0030472 | mitotic spindle organization in nucleus(GO:0030472) |
| 0.1 | 0.3 | GO:0035407 | histone H3-T11 phosphorylation(GO:0035407) |
| 0.1 | 0.3 | GO:0033386 | geranylgeranyl diphosphate metabolic process(GO:0033385) geranylgeranyl diphosphate biosynthetic process(GO:0033386) |
| 0.1 | 0.5 | GO:0030644 | cellular chloride ion homeostasis(GO:0030644) |
| 0.1 | 0.4 | GO:0051643 | endoplasmic reticulum localization(GO:0051643) |
| 0.1 | 1.0 | GO:1900028 | negative regulation of ruffle assembly(GO:1900028) |
| 0.1 | 0.3 | GO:0005986 | sucrose biosynthetic process(GO:0005986) |
| 0.1 | 0.4 | GO:2000301 | negative regulation of synaptic vesicle exocytosis(GO:2000301) |
| 0.1 | 0.4 | GO:0061428 | negative regulation of transcription from RNA polymerase II promoter in response to hypoxia(GO:0061428) |
| 0.1 | 0.6 | GO:0006880 | intracellular sequestering of iron ion(GO:0006880) sequestering of iron ion(GO:0097577) |
| 0.1 | 0.7 | GO:0036371 | protein localization to T-tubule(GO:0036371) |
| 0.1 | 0.2 | GO:1905053 | regulation of base-excision repair(GO:1905051) positive regulation of base-excision repair(GO:1905053) |
| 0.1 | 0.2 | GO:1903862 | positive regulation of oxidative phosphorylation(GO:1903862) |
| 0.1 | 0.1 | GO:0042662 | negative regulation of mesodermal cell fate specification(GO:0042662) |
| 0.1 | 0.3 | GO:0006210 | pyrimidine nucleobase catabolic process(GO:0006208) thymine catabolic process(GO:0006210) thymine metabolic process(GO:0019859) |
| 0.1 | 0.3 | GO:0007571 | age-dependent response to oxidative stress(GO:0001306) age-dependent response to reactive oxygen species(GO:0001315) regulation of systemic arterial blood pressure by acetylcholine(GO:0003068) vasodilation by acetylcholine involved in regulation of systemic arterial blood pressure(GO:0003069) regulation of systemic arterial blood pressure by neurotransmitter(GO:0003070) age-dependent general metabolic decline(GO:0007571) |
| 0.1 | 0.6 | GO:0017062 | respiratory chain complex III assembly(GO:0017062) mitochondrial respiratory chain complex III assembly(GO:0034551) |
| 0.1 | 0.2 | GO:0002143 | tRNA wobble position uridine thiolation(GO:0002143) |
| 0.1 | 1.2 | GO:0033617 | mitochondrial respiratory chain complex IV assembly(GO:0033617) |
| 0.1 | 0.2 | GO:0010808 | positive regulation of synaptic vesicle priming(GO:0010808) |
| 0.1 | 0.3 | GO:0006540 | glutamate decarboxylation to succinate(GO:0006540) |
| 0.1 | 0.2 | GO:1904529 | regulation of actin filament binding(GO:1904529) regulation of actin binding(GO:1904616) |
| 0.1 | 0.2 | GO:1903377 | negative regulation of oxidative stress-induced neuron intrinsic apoptotic signaling pathway(GO:1903377) |
| 0.1 | 0.9 | GO:0046950 | cellular ketone body metabolic process(GO:0046950) |
| 0.1 | 0.2 | GO:0036060 | filtration diaphragm assembly(GO:0036058) slit diaphragm assembly(GO:0036060) |
| 0.1 | 0.2 | GO:1901491 | negative regulation of lymphangiogenesis(GO:1901491) |
| 0.1 | 0.2 | GO:1903004 | regulation of protein K63-linked deubiquitination(GO:1903004) positive regulation of protein K63-linked deubiquitination(GO:1903006) |
| 0.1 | 0.7 | GO:0006975 | DNA damage induced protein phosphorylation(GO:0006975) |
| 0.1 | 0.2 | GO:1901874 | negative regulation of post-translational protein modification(GO:1901874) |
| 0.1 | 0.3 | GO:1901911 | diadenosine polyphosphate catabolic process(GO:0015961) diphosphoinositol polyphosphate metabolic process(GO:0071543) diadenosine pentaphosphate metabolic process(GO:1901906) diadenosine pentaphosphate catabolic process(GO:1901907) diadenosine hexaphosphate metabolic process(GO:1901908) diadenosine hexaphosphate catabolic process(GO:1901909) adenosine 5'-(hexahydrogen pentaphosphate) metabolic process(GO:1901910) adenosine 5'-(hexahydrogen pentaphosphate) catabolic process(GO:1901911) |
| 0.1 | 0.5 | GO:2000601 | positive regulation of Arp2/3 complex-mediated actin nucleation(GO:2000601) |
| 0.1 | 0.1 | GO:1902953 | positive regulation of ER to Golgi vesicle-mediated transport(GO:1902953) |
| 0.1 | 0.2 | GO:0030576 | Cajal body organization(GO:0030576) |
| 0.1 | 0.9 | GO:0061162 | establishment of monopolar cell polarity(GO:0061162) |
| 0.1 | 0.7 | GO:0034465 | response to carbon monoxide(GO:0034465) |
| 0.1 | 0.2 | GO:0006227 | dUDP biosynthetic process(GO:0006227) dTDP biosynthetic process(GO:0006233) pyrimidine nucleoside diphosphate biosynthetic process(GO:0009139) pyrimidine deoxyribonucleoside diphosphate metabolic process(GO:0009196) pyrimidine deoxyribonucleoside diphosphate biosynthetic process(GO:0009197) dTDP metabolic process(GO:0046072) dUDP metabolic process(GO:0046077) |
| 0.1 | 0.3 | GO:0044240 | multicellular organism lipid catabolic process(GO:0044240) |
| 0.1 | 0.3 | GO:0099590 | neurotransmitter receptor internalization(GO:0099590) |
| 0.0 | 0.4 | GO:1903593 | regulation of histamine secretion by mast cell(GO:1903593) |
| 0.0 | 1.0 | GO:0043116 | negative regulation of vascular permeability(GO:0043116) |
| 0.0 | 0.2 | GO:0044313 | protein K6-linked deubiquitination(GO:0044313) |
| 0.0 | 0.2 | GO:1903788 | mycotoxin catabolic process(GO:0043387) aflatoxin catabolic process(GO:0046223) organic heteropentacyclic compound catabolic process(GO:1901377) regulation of glutathione biosynthetic process(GO:1903786) positive regulation of glutathione biosynthetic process(GO:1903788) |
| 0.0 | 0.5 | GO:0010756 | positive regulation of plasminogen activation(GO:0010756) |
| 0.0 | 0.1 | GO:0060823 | canonical Wnt signaling pathway involved in neural plate anterior/posterior pattern formation(GO:0060823) |
| 0.0 | 0.2 | GO:1901662 | phylloquinone metabolic process(GO:0042374) phylloquinone catabolic process(GO:0042376) quinone catabolic process(GO:1901662) |
| 0.0 | 0.2 | GO:0046203 | spermidine catabolic process(GO:0046203) |
| 0.0 | 0.2 | GO:0006121 | mitochondrial electron transport, succinate to ubiquinone(GO:0006121) |
| 0.0 | 0.3 | GO:0051461 | positive regulation of corticotropin secretion(GO:0051461) |
| 0.0 | 0.4 | GO:0035583 | sequestering of TGFbeta in extracellular matrix(GO:0035583) |
| 0.0 | 0.1 | GO:0044691 | tooth eruption(GO:0044691) |
| 0.0 | 1.1 | GO:0043508 | negative regulation of JUN kinase activity(GO:0043508) |
| 0.0 | 0.4 | GO:1901725 | regulation of histone deacetylase activity(GO:1901725) |
| 0.0 | 0.5 | GO:0061469 | regulation of type B pancreatic cell proliferation(GO:0061469) |
| 0.0 | 0.6 | GO:2000096 | positive regulation of Wnt signaling pathway, planar cell polarity pathway(GO:2000096) |
| 0.0 | 0.4 | GO:0006616 | SRP-dependent cotranslational protein targeting to membrane, translocation(GO:0006616) |
| 0.0 | 0.2 | GO:0018008 | N-terminal peptidyl-glycine N-myristoylation(GO:0018008) |
| 0.0 | 0.2 | GO:0006669 | sphinganine-1-phosphate biosynthetic process(GO:0006669) |
| 0.0 | 3.4 | GO:0006120 | mitochondrial electron transport, NADH to ubiquinone(GO:0006120) |
| 0.0 | 0.7 | GO:0040032 | post-embryonic body morphogenesis(GO:0040032) |
| 0.0 | 0.1 | GO:1900126 | negative regulation of hyaluronan biosynthetic process(GO:1900126) |
| 0.0 | 0.1 | GO:0034227 | tRNA thio-modification(GO:0034227) |
| 0.0 | 0.4 | GO:0010993 | regulation of ubiquitin homeostasis(GO:0010993) free ubiquitin chain polymerization(GO:0010994) |
| 0.0 | 0.2 | GO:0044314 | protein K27-linked ubiquitination(GO:0044314) |
| 0.0 | 0.7 | GO:0034638 | phosphatidylcholine catabolic process(GO:0034638) |
| 0.0 | 0.1 | GO:0019287 | isopentenyl diphosphate biosynthetic process, mevalonate pathway(GO:0019287) |
| 0.0 | 0.3 | GO:0060154 | cellular process regulating host cell cycle in response to virus(GO:0060154) |
| 0.0 | 0.5 | GO:0046600 | negative regulation of centriole replication(GO:0046600) |
| 0.0 | 0.2 | GO:0061358 | negative regulation of Wnt protein secretion(GO:0061358) |
| 0.0 | 0.1 | GO:1904170 | regulation of bleb assembly(GO:1904170) positive regulation of bleb assembly(GO:1904172) |
| 0.0 | 0.5 | GO:0044342 | type B pancreatic cell proliferation(GO:0044342) |
| 0.0 | 0.0 | GO:0016340 | calcium-dependent cell-matrix adhesion(GO:0016340) |
| 0.0 | 0.4 | GO:0035973 | aggrephagy(GO:0035973) |
| 0.0 | 0.2 | GO:0051697 | protein delipidation(GO:0051697) |
| 0.0 | 0.2 | GO:0000961 | negative regulation of mitochondrial RNA catabolic process(GO:0000961) |
| 0.0 | 0.4 | GO:0033564 | anterior/posterior axon guidance(GO:0033564) |
| 0.0 | 0.1 | GO:2000646 | positive regulation of receptor catabolic process(GO:2000646) |
| 0.0 | 0.1 | GO:0035928 | rRNA import into mitochondrion(GO:0035928) |
| 0.0 | 0.2 | GO:0046504 | ether lipid biosynthetic process(GO:0008611) glycerol ether biosynthetic process(GO:0046504) ether biosynthetic process(GO:1901503) |
| 0.0 | 0.7 | GO:0045793 | positive regulation of cell size(GO:0045793) |
| 0.0 | 0.4 | GO:0010936 | negative regulation of macrophage cytokine production(GO:0010936) |
| 0.0 | 0.4 | GO:0000028 | ribosomal small subunit assembly(GO:0000028) |
| 0.0 | 0.4 | GO:0031087 | deadenylation-independent decapping of nuclear-transcribed mRNA(GO:0031087) |
| 0.0 | 0.1 | GO:0019520 | aldonic acid metabolic process(GO:0019520) D-gluconate metabolic process(GO:0019521) |
| 0.0 | 0.1 | GO:0042427 | serotonin biosynthetic process(GO:0042427) |
| 0.0 | 1.1 | GO:0009083 | branched-chain amino acid catabolic process(GO:0009083) |
| 0.0 | 0.6 | GO:0045835 | negative regulation of meiotic nuclear division(GO:0045835) |
| 0.0 | 0.1 | GO:0043449 | olfactory learning(GO:0008355) cellular alkene metabolic process(GO:0043449) |
| 0.0 | 0.1 | GO:1904253 | positive regulation of bile acid biosynthetic process(GO:0070859) positive regulation of bile acid metabolic process(GO:1904253) |
| 0.0 | 0.1 | GO:0000415 | negative regulation of histone H3-K36 methylation(GO:0000415) negative regulation of histone H3-K4 methylation(GO:0051572) |
| 0.0 | 0.2 | GO:0003219 | cardiac right ventricle formation(GO:0003219) |
| 0.0 | 0.1 | GO:1903445 | intermembrane transport(GO:0046909) protein transport from ciliary membrane to plasma membrane(GO:1903445) |
| 0.0 | 0.1 | GO:1902499 | positive regulation of protein autoubiquitination(GO:1902499) |
| 0.0 | 0.3 | GO:0060666 | dichotomous subdivision of terminal units involved in salivary gland branching(GO:0060666) |
| 0.0 | 0.5 | GO:0043983 | histone H4-K12 acetylation(GO:0043983) |
| 0.0 | 0.3 | GO:0035694 | mitochondrial protein catabolic process(GO:0035694) |
| 0.0 | 0.1 | GO:2000850 | negative regulation of cortisol secretion(GO:0051463) negative regulation of steroid hormone secretion(GO:2000832) negative regulation of corticosteroid hormone secretion(GO:2000847) negative regulation of glucocorticoid secretion(GO:2000850) |
| 0.0 | 0.2 | GO:0019626 | short-chain fatty acid catabolic process(GO:0019626) |
| 0.0 | 0.1 | GO:0010607 | negative regulation of cytoplasmic mRNA processing body assembly(GO:0010607) |
| 0.0 | 0.1 | GO:0048213 | Golgi vesicle prefusion complex stabilization(GO:0048213) |
| 0.0 | 0.2 | GO:0061419 | positive regulation of transcription from RNA polymerase II promoter in response to hypoxia(GO:0061419) positive regulation of ephrin receptor signaling pathway(GO:1901189) regulation of canonical Wnt signaling pathway involved in cardiac muscle cell fate commitment(GO:1901295) positive regulation of canonical Wnt signaling pathway involved in cardiac muscle cell fate commitment(GO:1901297) regulation of canonical Wnt signaling pathway involved in heart development(GO:1905066) positive regulation of canonical Wnt signaling pathway involved in heart development(GO:1905068) |
| 0.0 | 0.3 | GO:0036089 | cleavage furrow formation(GO:0036089) |
| 0.0 | 0.1 | GO:0033088 | negative regulation of immature T cell proliferation in thymus(GO:0033088) |
| 0.0 | 0.1 | GO:0035726 | common myeloid progenitor cell proliferation(GO:0035726) |
| 0.0 | 0.4 | GO:0006122 | mitochondrial electron transport, ubiquinol to cytochrome c(GO:0006122) |
| 0.0 | 0.7 | GO:0033539 | fatty acid beta-oxidation using acyl-CoA dehydrogenase(GO:0033539) |
| 0.0 | 0.0 | GO:0072019 | proximal convoluted tubule development(GO:0072019) metanephric proximal convoluted tubule development(GO:0072229) |
| 0.0 | 0.1 | GO:0001546 | preantral ovarian follicle growth(GO:0001546) multi-layer follicle stage(GO:0048162) |
| 0.0 | 0.5 | GO:0030043 | actin filament fragmentation(GO:0030043) |
| 0.0 | 0.1 | GO:0006447 | regulation of translational initiation by iron(GO:0006447) |
| 0.0 | 0.4 | GO:0071550 | death-inducing signaling complex assembly(GO:0071550) |
| 0.0 | 0.2 | GO:0010724 | regulation of definitive erythrocyte differentiation(GO:0010724) |
| 0.0 | 1.1 | GO:0008045 | motor neuron axon guidance(GO:0008045) |
| 0.0 | 0.1 | GO:0032785 | negative regulation of DNA-templated transcription, elongation(GO:0032785) |
| 0.0 | 0.3 | GO:0021563 | glossopharyngeal nerve development(GO:0021563) |
| 0.0 | 0.1 | GO:0010387 | COP9 signalosome assembly(GO:0010387) |
| 0.0 | 0.0 | GO:0036090 | cleavage furrow ingression(GO:0036090) |
| 0.0 | 0.2 | GO:0023021 | termination of signal transduction(GO:0023021) |
| 0.0 | 0.2 | GO:0015680 | intracellular copper ion transport(GO:0015680) |
| 0.0 | 0.1 | GO:1902361 | mitochondrial pyruvate transport(GO:0006850) mitochondrial pyruvate transmembrane transport(GO:1902361) |
| 0.0 | 0.2 | GO:0044211 | CTP salvage(GO:0044211) |
| 0.0 | 0.1 | GO:0038030 | non-canonical Wnt signaling pathway via MAPK cascade(GO:0038030) non-canonical Wnt signaling pathway via JNK cascade(GO:0038031) |
| 0.0 | 0.4 | GO:0019388 | galactose catabolic process(GO:0019388) |
| 0.0 | 0.2 | GO:1903265 | positive regulation of tumor necrosis factor-mediated signaling pathway(GO:1903265) |
| 0.0 | 0.1 | GO:0099404 | negative regulation of maintenance of sister chromatid cohesion(GO:0034092) negative regulation of maintenance of mitotic sister chromatid cohesion(GO:0034183) maintenance of mitotic sister chromatid cohesion, telomeric(GO:0099403) mitotic sister chromatid cohesion, telomeric(GO:0099404) regulation of maintenance of mitotic sister chromatid cohesion, telomeric(GO:1904907) negative regulation of maintenance of mitotic sister chromatid cohesion, telomeric(GO:1904908) |
| 0.0 | 0.2 | GO:0070269 | pyroptosis(GO:0070269) |
| 0.0 | 0.3 | GO:0035799 | ureter maturation(GO:0035799) |
| 0.0 | 0.1 | GO:0043000 | Golgi to plasma membrane CFTR protein transport(GO:0043000) |
| 0.0 | 0.0 | GO:0045053 | protein retention in Golgi apparatus(GO:0045053) |
| 0.0 | 0.4 | GO:0048739 | cardiac muscle fiber development(GO:0048739) |
| 0.0 | 0.1 | GO:0018171 | peptidyl-cysteine oxidation(GO:0018171) |
| 0.0 | 0.2 | GO:0097428 | protein maturation by iron-sulfur cluster transfer(GO:0097428) |
| 0.0 | 0.2 | GO:0032417 | positive regulation of sodium:proton antiporter activity(GO:0032417) |
| 0.0 | 0.7 | GO:0035162 | embryonic hemopoiesis(GO:0035162) |
| 0.0 | 0.2 | GO:0006102 | isocitrate metabolic process(GO:0006102) |
| 0.0 | 4.1 | GO:0006614 | SRP-dependent cotranslational protein targeting to membrane(GO:0006614) |
| 0.0 | 0.1 | GO:0015670 | carbon dioxide transport(GO:0015670) |
| 0.0 | 0.1 | GO:0002159 | desmosome assembly(GO:0002159) |
| 0.0 | 0.5 | GO:0030150 | protein import into mitochondrial matrix(GO:0030150) |
| 0.0 | 0.2 | GO:0042796 | snRNA transcription from RNA polymerase III promoter(GO:0042796) |
| 0.0 | 0.2 | GO:1903207 | neuron death in response to hydrogen peroxide(GO:0036476) positive regulation of cyclic-nucleotide phosphodiesterase activity(GO:0051343) regulation of hydrogen peroxide-induced neuron death(GO:1903207) negative regulation of hydrogen peroxide-induced neuron death(GO:1903208) |
| 0.0 | 0.2 | GO:2000324 | positive regulation of glucocorticoid receptor signaling pathway(GO:2000324) |
| 0.0 | 0.1 | GO:0072720 | response to dithiothreitol(GO:0072720) |
| 0.0 | 0.3 | GO:2000786 | positive regulation of autophagosome assembly(GO:2000786) |
| 0.0 | 0.2 | GO:1902748 | melanocyte migration(GO:0097324) positive regulation of lens fiber cell differentiation(GO:1902748) |
| 0.0 | 0.9 | GO:2000300 | regulation of synaptic vesicle exocytosis(GO:2000300) |
| 0.0 | 0.6 | GO:0033630 | positive regulation of cell adhesion mediated by integrin(GO:0033630) |
| 0.0 | 0.2 | GO:0097500 | receptor localization to nonmotile primary cilium(GO:0097500) |
| 0.0 | 0.1 | GO:0045925 | positive regulation of female receptivity(GO:0045925) |
| 0.0 | 0.1 | GO:0090427 | activation of meiosis(GO:0090427) |
| 0.0 | 0.4 | GO:1902659 | regulation of glucose mediated signaling pathway(GO:1902659) |
| 0.0 | 0.2 | GO:0006335 | DNA replication-dependent nucleosome assembly(GO:0006335) DNA replication-dependent nucleosome organization(GO:0034723) |
| 0.0 | 0.2 | GO:0036444 | calcium ion transmembrane import into mitochondrion(GO:0036444) |
| 0.0 | 1.0 | GO:0034243 | regulation of transcription elongation from RNA polymerase II promoter(GO:0034243) |
| 0.0 | 0.3 | GO:0045046 | protein import into peroxisome membrane(GO:0045046) |
| 0.0 | 0.3 | GO:2000766 | negative regulation of cytoplasmic translation(GO:2000766) |
| 0.0 | 0.1 | GO:0071894 | histone H2B conserved C-terminal lysine ubiquitination(GO:0071894) |
| 0.0 | 0.5 | GO:0045838 | positive regulation of membrane potential(GO:0045838) |
| 0.0 | 0.2 | GO:0050942 | positive regulation of pigment cell differentiation(GO:0050942) |
| 0.0 | 0.9 | GO:0045736 | negative regulation of cyclin-dependent protein serine/threonine kinase activity(GO:0045736) |
| 0.0 | 0.2 | GO:0016139 | glycoside catabolic process(GO:0016139) |
| 0.0 | 0.1 | GO:0072367 | regulation of lipid transport by regulation of transcription from RNA polymerase II promoter(GO:0072367) |
| 0.0 | 0.3 | GO:0072189 | ureter development(GO:0072189) |
| 0.0 | 0.0 | GO:0042776 | mitochondrial ATP synthesis coupled proton transport(GO:0042776) |
| 0.0 | 0.2 | GO:0034141 | positive regulation of toll-like receptor 3 signaling pathway(GO:0034141) |
| 0.0 | 0.2 | GO:0060020 | Bergmann glial cell differentiation(GO:0060020) |
| 0.0 | 0.2 | GO:0018344 | protein geranylgeranylation(GO:0018344) |
| 0.0 | 0.1 | GO:0002588 | positive regulation of antigen processing and presentation of peptide or polysaccharide antigen via MHC class II(GO:0002582) positive regulation of antigen processing and presentation of peptide antigen(GO:0002585) positive regulation of antigen processing and presentation of peptide antigen via MHC class II(GO:0002588) |
| 0.0 | 0.1 | GO:0036245 | cellular response to menadione(GO:0036245) |
| 0.0 | 0.3 | GO:0014877 | response to muscle inactivity involved in regulation of muscle adaptation(GO:0014877) response to denervation involved in regulation of muscle adaptation(GO:0014894) |
| 0.0 | 0.2 | GO:1905146 | lysosomal protein catabolic process(GO:1905146) |
| 0.0 | 0.1 | GO:1902951 | negative regulation of dendritic spine maintenance(GO:1902951) |
| 0.0 | 0.2 | GO:0071830 | chylomicron remnant clearance(GO:0034382) triglyceride-rich lipoprotein particle clearance(GO:0071830) |
| 0.0 | 0.1 | GO:1904562 | phosphatidylinositol 5-phosphate metabolic process(GO:1904562) |
| 0.0 | 0.2 | GO:0035871 | protein K11-linked deubiquitination(GO:0035871) |
| 0.0 | 0.1 | GO:1903537 | meiotic spindle elongation(GO:0051232) meiotic cell cycle process involved in oocyte maturation(GO:1903537) regulation of meiotic cell cycle process involved in oocyte maturation(GO:1903538) |
| 0.0 | 0.1 | GO:0016240 | autophagosome docking(GO:0016240) |
| 0.0 | 0.2 | GO:0003057 | regulation of the force of heart contraction by chemical signal(GO:0003057) |
| 0.0 | 1.1 | GO:0045599 | negative regulation of fat cell differentiation(GO:0045599) |
| 0.0 | 0.1 | GO:0071042 | U1 snRNA 3'-end processing(GO:0034473) U5 snRNA 3'-end processing(GO:0034476) nuclear polyadenylation-dependent mRNA catabolic process(GO:0071042) polyadenylation-dependent mRNA catabolic process(GO:0071047) |
| 0.0 | 0.7 | GO:0043968 | histone H2A acetylation(GO:0043968) |
| 0.0 | 0.2 | GO:0032482 | Rab protein signal transduction(GO:0032482) |
| 0.0 | 0.3 | GO:2000774 | positive regulation of cellular senescence(GO:2000774) |
| 0.0 | 0.4 | GO:0043248 | proteasome assembly(GO:0043248) |
| 0.0 | 0.1 | GO:0016926 | protein desumoylation(GO:0016926) |
| 0.0 | 0.3 | GO:0001833 | inner cell mass cell proliferation(GO:0001833) |
| 0.0 | 0.0 | GO:0050932 | regulation of pigment cell differentiation(GO:0050932) |
| 0.0 | 0.1 | GO:0051684 | maintenance of Golgi location(GO:0051684) |
| 0.0 | 0.1 | GO:0006627 | protein processing involved in protein targeting to mitochondrion(GO:0006627) |
| 0.0 | 0.3 | GO:0046838 | phosphorylated carbohydrate dephosphorylation(GO:0046838) inositol phosphate dephosphorylation(GO:0046855) |
| 0.0 | 0.1 | GO:0002322 | B cell proliferation involved in immune response(GO:0002322) |
| 0.0 | 0.4 | GO:0007021 | tubulin complex assembly(GO:0007021) |
| 0.0 | 0.4 | GO:0045899 | positive regulation of RNA polymerase II transcriptional preinitiation complex assembly(GO:0045899) |
| 0.0 | 2.4 | GO:0008625 | extrinsic apoptotic signaling pathway via death domain receptors(GO:0008625) |
| 0.0 | 0.1 | GO:1904885 | beta-catenin destruction complex assembly(GO:1904885) |
| 0.0 | 0.1 | GO:0035610 | protein side chain deglutamylation(GO:0035610) |
| 0.0 | 0.1 | GO:0035234 | ectopic germ cell programmed cell death(GO:0035234) |
| 0.0 | 0.1 | GO:0070940 | dephosphorylation of RNA polymerase II C-terminal domain(GO:0070940) |
| 0.0 | 0.1 | GO:0061743 | motor learning(GO:0061743) |
| 0.0 | 0.1 | GO:0048241 | epinephrine transport(GO:0048241) |
| 0.0 | 0.1 | GO:0044533 | induction of programmed cell death(GO:0012502) positive regulation of apoptotic process in other organism(GO:0044533) positive regulation by symbiont of host programmed cell death(GO:0052042) positive regulation by organism of programmed cell death in other organism involved in symbiotic interaction(GO:0052330) positive regulation by organism of apoptotic process in other organism involved in symbiotic interaction(GO:0052501) |
| 0.0 | 0.8 | GO:0000715 | nucleotide-excision repair, DNA damage recognition(GO:0000715) |
| 0.0 | 0.1 | GO:0070634 | transepithelial ammonium transport(GO:0070634) |
| 0.0 | 0.1 | GO:0072365 | regulation of cellular ketone metabolic process by negative regulation of transcription from RNA polymerase II promoter(GO:0072365) |
| 0.0 | 1.7 | GO:0061418 | regulation of transcription from RNA polymerase II promoter in response to hypoxia(GO:0061418) |
| 0.0 | 0.2 | GO:0060340 | positive regulation of type I interferon-mediated signaling pathway(GO:0060340) |
| 0.0 | 0.1 | GO:1990564 | protein polyufmylation(GO:1990564) protein K69-linked ufmylation(GO:1990592) |
| 0.0 | 0.1 | GO:1903232 | melanosome assembly(GO:1903232) |
| 0.0 | 0.2 | GO:0006978 | DNA damage response, signal transduction by p53 class mediator resulting in transcription of p21 class mediator(GO:0006978) |
| 0.0 | 0.2 | GO:0008343 | adult feeding behavior(GO:0008343) |
| 0.0 | 0.1 | GO:1990166 | protein localization to site of double-strand break(GO:1990166) |
| 0.0 | 0.3 | GO:0033148 | positive regulation of intracellular estrogen receptor signaling pathway(GO:0033148) |
| 0.0 | 0.1 | GO:0072513 | positive regulation of secondary heart field cardioblast proliferation(GO:0072513) |
| 0.0 | 0.5 | GO:0097178 | ruffle assembly(GO:0097178) |
| 0.0 | 0.2 | GO:2000643 | positive regulation of early endosome to late endosome transport(GO:2000643) |
| 0.0 | 0.8 | GO:0010165 | response to X-ray(GO:0010165) |
| 0.0 | 0.6 | GO:0051131 | chaperone-mediated protein complex assembly(GO:0051131) |
| 0.0 | 0.1 | GO:0045653 | negative regulation of megakaryocyte differentiation(GO:0045653) |
| 0.0 | 0.0 | GO:2000118 | regulation of sodium-dependent phosphate transport(GO:2000118) |
| 0.0 | 0.1 | GO:0046092 | deoxycytidine metabolic process(GO:0046092) |
| 0.0 | 0.4 | GO:0033622 | integrin activation(GO:0033622) |
| 0.0 | 0.0 | GO:0035281 | pre-miRNA export from nucleus(GO:0035281) |
| 0.0 | 0.1 | GO:0006104 | succinyl-CoA metabolic process(GO:0006104) |
| 0.0 | 0.1 | GO:1904354 | negative regulation of telomere capping(GO:1904354) |
| 0.0 | 0.3 | GO:0006228 | UTP biosynthetic process(GO:0006228) |
| 0.0 | 0.1 | GO:0038089 | positive regulation of cell migration by vascular endothelial growth factor signaling pathway(GO:0038089) |
| 0.0 | 0.7 | GO:0032728 | positive regulation of interferon-beta production(GO:0032728) |
| 0.0 | 0.1 | GO:1905049 | negative regulation of metallopeptidase activity(GO:1905049) |
| 0.0 | 0.1 | GO:0006287 | base-excision repair, gap-filling(GO:0006287) |
| 0.0 | 0.0 | GO:1990022 | RNA polymerase II complex import to nucleus(GO:0044376) RNA polymerase III complex localization to nucleus(GO:1990022) |
| 0.0 | 0.4 | GO:0002076 | osteoblast development(GO:0002076) |
| 0.0 | 0.2 | GO:0034498 | early endosome to Golgi transport(GO:0034498) |
| 0.0 | 0.0 | GO:0061056 | sclerotome development(GO:0061056) |
| 0.0 | 0.1 | GO:0017196 | N-terminal peptidyl-methionine acetylation(GO:0017196) |
| 0.0 | 0.1 | GO:0006621 | protein retention in ER lumen(GO:0006621) |
| 0.0 | 0.1 | GO:0048341 | paraxial mesoderm formation(GO:0048341) |
| 0.0 | 0.2 | GO:0048227 | plasma membrane to endosome transport(GO:0048227) |
| 0.0 | 1.5 | GO:0006890 | retrograde vesicle-mediated transport, Golgi to ER(GO:0006890) |
| 0.0 | 0.0 | GO:1903259 | exon-exon junction complex disassembly(GO:1903259) |
| 0.0 | 0.1 | GO:1902414 | protein localization to cell junction(GO:1902414) |
| 0.0 | 1.6 | GO:0070125 | mitochondrial translational elongation(GO:0070125) |
| 0.0 | 0.1 | GO:0086024 | adrenergic receptor signaling pathway involved in positive regulation of heart rate(GO:0086024) |
| 0.0 | 0.0 | GO:0001868 | regulation of complement activation, lectin pathway(GO:0001868) negative regulation of complement activation, lectin pathway(GO:0001869) |
| 0.0 | 0.3 | GO:0006895 | Golgi to endosome transport(GO:0006895) |
| 0.0 | 0.1 | GO:0070862 | negative regulation of protein exit from endoplasmic reticulum(GO:0070862) negative regulation of retrograde protein transport, ER to cytosol(GO:1904153) |
| 0.0 | 0.1 | GO:0006987 | activation of signaling protein activity involved in unfolded protein response(GO:0006987) |
| 0.0 | 0.5 | GO:0070979 | protein K11-linked ubiquitination(GO:0070979) |
| 0.0 | 0.1 | GO:0030263 | apoptotic chromosome condensation(GO:0030263) |
| 0.0 | 0.1 | GO:0060296 | regulation of cilium movement involved in cell motility(GO:0060295) regulation of cilium beat frequency involved in ciliary motility(GO:0060296) regulation of cilium-dependent cell motility(GO:1902019) |
| 0.0 | 0.2 | GO:0006554 | lysine catabolic process(GO:0006554) |
| 0.0 | 0.1 | GO:1902525 | regulation of protein monoubiquitination(GO:1902525) |
| 0.0 | 0.5 | GO:0048665 | neuron fate specification(GO:0048665) |
| 0.0 | 0.0 | GO:1902219 | regulation of intrinsic apoptotic signaling pathway in response to osmotic stress(GO:1902218) negative regulation of intrinsic apoptotic signaling pathway in response to osmotic stress(GO:1902219) |
| 0.0 | 0.1 | GO:0032510 | endosome to lysosome transport via multivesicular body sorting pathway(GO:0032510) |
| 0.0 | 0.0 | GO:0097167 | circadian regulation of translation(GO:0097167) |
| 0.0 | 0.1 | GO:0006003 | fructose 2,6-bisphosphate metabolic process(GO:0006003) |
| 0.0 | 0.1 | GO:0034499 | late endosome to Golgi transport(GO:0034499) |
| 0.0 | 0.0 | GO:0021758 | caudate nucleus development(GO:0021757) putamen development(GO:0021758) |
| 0.0 | 0.2 | GO:0051775 | response to redox state(GO:0051775) |
| 0.0 | 0.1 | GO:0000414 | regulation of histone H3-K36 methylation(GO:0000414) |
| 0.0 | 0.1 | GO:0030311 | poly-N-acetyllactosamine biosynthetic process(GO:0030311) |
| 0.0 | 0.0 | GO:0070370 | heat acclimation(GO:0010286) cellular heat acclimation(GO:0070370) |
| 0.0 | 0.0 | GO:0090063 | positive regulation of microtubule nucleation(GO:0090063) |
| 0.0 | 0.2 | GO:0019852 | L-ascorbic acid metabolic process(GO:0019852) |
| 0.0 | 0.2 | GO:0023019 | signal transduction involved in regulation of gene expression(GO:0023019) |
| 0.0 | 0.1 | GO:0015811 | L-cystine transport(GO:0015811) basic amino acid transmembrane transport(GO:1990822) |
| 0.0 | 0.1 | GO:0010757 | negative regulation of plasminogen activation(GO:0010757) |
| 0.0 | 0.0 | GO:0018312 | peptidyl-serine ADP-ribosylation(GO:0018312) |
| 0.0 | 0.1 | GO:0051151 | negative regulation of smooth muscle cell differentiation(GO:0051151) |
| 0.0 | 0.3 | GO:0043162 | ubiquitin-dependent protein catabolic process via the multivesicular body sorting pathway(GO:0043162) |
| 0.0 | 0.1 | GO:0046146 | tetrahydrobiopterin biosynthetic process(GO:0006729) tetrahydrobiopterin metabolic process(GO:0046146) |
| 0.0 | 0.1 | GO:0060040 | retinal bipolar neuron differentiation(GO:0060040) |
| 0.0 | 0.9 | GO:0045600 | positive regulation of fat cell differentiation(GO:0045600) |
| 0.0 | 0.0 | GO:0048239 | negative regulation of DNA recombination at telomere(GO:0048239) regulation of DNA recombination at telomere(GO:0072695) |
| 0.0 | 0.1 | GO:0042754 | negative regulation of circadian rhythm(GO:0042754) |
| 0.0 | 0.0 | GO:0042412 | taurine biosynthetic process(GO:0042412) |
| 0.0 | 0.8 | GO:0043966 | histone H3 acetylation(GO:0043966) |
| 0.0 | 0.4 | GO:0060292 | long term synaptic depression(GO:0060292) |
| 0.0 | 0.1 | GO:1904293 | negative regulation of ERAD pathway(GO:1904293) |
| 0.0 | 0.2 | GO:0032802 | low-density lipoprotein particle receptor catabolic process(GO:0032802) |
| 0.0 | 0.0 | GO:0060017 | parathyroid gland development(GO:0060017) |
| 0.0 | 0.8 | GO:0030049 | muscle filament sliding(GO:0030049) actin-myosin filament sliding(GO:0033275) |
| 0.0 | 0.1 | GO:1904896 | ESCRT complex disassembly(GO:1904896) ESCRT III complex disassembly(GO:1904903) |
| 0.0 | 0.0 | GO:0070221 | sulfide oxidation(GO:0019418) sulfide oxidation, using sulfide:quinone oxidoreductase(GO:0070221) |
| 0.0 | 0.1 | GO:0043562 | cellular response to nitrogen starvation(GO:0006995) cellular response to nitrogen levels(GO:0043562) |
| 0.0 | 0.1 | GO:0008298 | intracellular mRNA localization(GO:0008298) |
| 0.0 | 0.3 | GO:0031468 | nuclear envelope reassembly(GO:0031468) |
| 0.0 | 0.2 | GO:0070911 | global genome nucleotide-excision repair(GO:0070911) |
| 0.0 | 0.1 | GO:0060613 | fat pad development(GO:0060613) |
| 0.0 | 0.6 | GO:0000413 | protein peptidyl-prolyl isomerization(GO:0000413) |
| 0.0 | 0.0 | GO:0042414 | epinephrine metabolic process(GO:0042414) epinephrine biosynthetic process(GO:0042418) |
| 0.0 | 0.1 | GO:0098735 | positive regulation of the force of heart contraction(GO:0098735) |
| 0.0 | 0.0 | GO:0072233 | thick ascending limb development(GO:0072023) metanephric thick ascending limb development(GO:0072233) |
| 0.0 | 0.2 | GO:0006293 | nucleotide-excision repair, preincision complex stabilization(GO:0006293) |
| 0.0 | 0.3 | GO:0051016 | barbed-end actin filament capping(GO:0051016) |
| 0.0 | 0.1 | GO:0042780 | tRNA 3'-end processing(GO:0042780) |
Gene overrepresentation in cellular component category:
| Log-likelihood per target | Total log-likelihood | Term | Description |
|---|---|---|---|
| 0.4 | 1.3 | GO:0060987 | lipid tube(GO:0060987) |
| 0.2 | 0.7 | GO:0005588 | collagen type V trimer(GO:0005588) |
| 0.2 | 1.6 | GO:0002177 | manchette(GO:0002177) |
| 0.2 | 2.5 | GO:0005589 | collagen type VI trimer(GO:0005589) collagen beaded filament(GO:0098647) |
| 0.2 | 1.1 | GO:0097442 | CA3 pyramidal cell dendrite(GO:0097442) |
| 0.2 | 0.7 | GO:0008043 | intracellular ferritin complex(GO:0008043) ferritin complex(GO:0070288) |
| 0.2 | 1.3 | GO:0034751 | aryl hydrocarbon receptor complex(GO:0034751) |
| 0.2 | 2.3 | GO:0005862 | muscle thin filament tropomyosin(GO:0005862) |
| 0.1 | 1.0 | GO:0030062 | mitochondrial tricarboxylic acid cycle enzyme complex(GO:0030062) |
| 0.1 | 0.1 | GO:0000110 | nucleotide-excision repair factor 1 complex(GO:0000110) |
| 0.1 | 1.0 | GO:0031466 | Cul5-RING ubiquitin ligase complex(GO:0031466) |
| 0.1 | 0.2 | GO:0015934 | large ribosomal subunit(GO:0015934) |
| 0.1 | 0.4 | GO:0070044 | synaptobrevin 2-SNAP-25-syntaxin-1a complex(GO:0070044) |
| 0.1 | 0.8 | GO:0016272 | prefoldin complex(GO:0016272) |
| 0.1 | 0.4 | GO:0097196 | Shu complex(GO:0097196) |
| 0.1 | 0.3 | GO:0070685 | macropinocytic cup(GO:0070685) |
| 0.1 | 0.5 | GO:0001652 | granular component(GO:0001652) |
| 0.1 | 0.3 | GO:0042720 | mitochondrial inner membrane peptidase complex(GO:0042720) |
| 0.1 | 0.2 | GO:0070931 | Golgi-associated vesicle lumen(GO:0070931) |
| 0.1 | 0.7 | GO:0061574 | ASAP complex(GO:0061574) |
| 0.1 | 0.4 | GO:0008622 | epsilon DNA polymerase complex(GO:0008622) |
| 0.1 | 0.2 | GO:0035370 | UBC13-UEV1A complex(GO:0035370) |
| 0.1 | 0.8 | GO:0019774 | proteasome core complex, beta-subunit complex(GO:0019774) |
| 0.1 | 0.5 | GO:0044294 | dendritic growth cone(GO:0044294) |
| 0.1 | 0.3 | GO:0032044 | DSIF complex(GO:0032044) |
| 0.1 | 0.7 | GO:0097136 | Bcl-2 family protein complex(GO:0097136) |
| 0.1 | 0.3 | GO:0071598 | neuronal ribonucleoprotein granule(GO:0071598) |
| 0.0 | 0.6 | GO:0016602 | CCAAT-binding factor complex(GO:0016602) |
| 0.0 | 3.2 | GO:0005747 | mitochondrial respiratory chain complex I(GO:0005747) NADH dehydrogenase complex(GO:0030964) respiratory chain complex I(GO:0045271) |
| 0.0 | 0.1 | GO:0005953 | CAAX-protein geranylgeranyltransferase complex(GO:0005953) |
| 0.0 | 0.3 | GO:1990246 | uniplex complex(GO:1990246) |
| 0.0 | 0.6 | GO:0045275 | mitochondrial respiratory chain complex III(GO:0005750) respiratory chain complex III(GO:0045275) |
| 0.0 | 0.6 | GO:0001520 | outer dense fiber(GO:0001520) |
| 0.0 | 0.2 | GO:0005854 | nascent polypeptide-associated complex(GO:0005854) |
| 0.0 | 0.3 | GO:1903440 | calcitonin family receptor complex(GO:1903439) amylin receptor complex(GO:1903440) |
| 0.0 | 0.3 | GO:1990812 | growth cone filopodium(GO:1990812) |
| 0.0 | 0.2 | GO:0045281 | mitochondrial respiratory chain complex II, succinate dehydrogenase complex (ubiquinone)(GO:0005749) succinate dehydrogenase complex (ubiquinone)(GO:0045257) respiratory chain complex II(GO:0045273) succinate dehydrogenase complex(GO:0045281) fumarate reductase complex(GO:0045283) |
| 0.0 | 0.1 | GO:1990111 | spermatoproteasome complex(GO:1990111) |
| 0.0 | 1.6 | GO:0000421 | autophagosome membrane(GO:0000421) |
| 0.0 | 0.2 | GO:0030905 | retromer, tubulation complex(GO:0030905) |
| 0.0 | 0.5 | GO:0031209 | SCAR complex(GO:0031209) |
| 0.0 | 0.9 | GO:0000242 | pericentriolar material(GO:0000242) |
| 0.0 | 0.4 | GO:0031595 | nuclear proteasome complex(GO:0031595) |
| 0.0 | 0.2 | GO:0000408 | EKC/KEOPS complex(GO:0000408) |
| 0.0 | 0.4 | GO:0033588 | Elongator holoenzyme complex(GO:0033588) |
| 0.0 | 0.3 | GO:0042719 | mitochondrial intermembrane space protein transporter complex(GO:0042719) |
| 0.0 | 0.3 | GO:0008541 | proteasome regulatory particle, lid subcomplex(GO:0008541) |
| 0.0 | 0.2 | GO:0016035 | zeta DNA polymerase complex(GO:0016035) |
| 0.0 | 0.2 | GO:0017101 | aminoacyl-tRNA synthetase multienzyme complex(GO:0017101) |
| 0.0 | 0.2 | GO:0035363 | histone locus body(GO:0035363) |
| 0.0 | 0.3 | GO:0005638 | lamin filament(GO:0005638) |
| 0.0 | 0.8 | GO:0031083 | BLOC-1 complex(GO:0031083) |
| 0.0 | 0.3 | GO:0005742 | mitochondrial outer membrane translocase complex(GO:0005742) |
| 0.0 | 0.1 | GO:0034365 | discoidal high-density lipoprotein particle(GO:0034365) |
| 0.0 | 0.1 | GO:0071942 | XPC complex(GO:0071942) |
| 0.0 | 0.3 | GO:0051286 | cell tip(GO:0051286) |
| 0.0 | 3.2 | GO:0022625 | cytosolic large ribosomal subunit(GO:0022625) |
| 0.0 | 0.3 | GO:0005869 | dynactin complex(GO:0005869) |
| 0.0 | 0.1 | GO:1990604 | IRE1-TRAF2-ASK1 complex(GO:1990604) |
| 0.0 | 0.2 | GO:0031673 | H zone(GO:0031673) |
| 0.0 | 0.1 | GO:0000333 | telomerase catalytic core complex(GO:0000333) |
| 0.0 | 0.1 | GO:0033186 | CAF-1 complex(GO:0033186) |
| 0.0 | 0.2 | GO:1990630 | IRE1-RACK1-PP2A complex(GO:1990630) |
| 0.0 | 0.1 | GO:1990730 | VCP-NSFL1C complex(GO:1990730) |
| 0.0 | 0.5 | GO:0005832 | chaperonin-containing T-complex(GO:0005832) |
| 0.0 | 0.3 | GO:0005786 | signal recognition particle, endoplasmic reticulum targeting(GO:0005786) |
| 0.0 | 0.6 | GO:0036020 | endolysosome membrane(GO:0036020) |
| 0.0 | 0.5 | GO:0005952 | cAMP-dependent protein kinase complex(GO:0005952) |
| 0.0 | 0.1 | GO:0031417 | NatC complex(GO:0031417) |
| 0.0 | 0.3 | GO:0034464 | BBSome(GO:0034464) |
| 0.0 | 0.2 | GO:0070847 | core mediator complex(GO:0070847) |
| 0.0 | 0.7 | GO:0031143 | pseudopodium(GO:0031143) |
| 0.0 | 0.3 | GO:0008290 | F-actin capping protein complex(GO:0008290) |
| 0.0 | 0.1 | GO:0031905 | early endosome lumen(GO:0031905) |
| 0.0 | 0.1 | GO:0045160 | myosin I complex(GO:0045160) |
| 0.0 | 0.8 | GO:0005680 | anaphase-promoting complex(GO:0005680) |
| 0.0 | 0.0 | GO:0042721 | mitochondrial inner membrane protein insertion complex(GO:0042721) |
| 0.0 | 0.2 | GO:0098559 | cytoplasmic side of early endosome membrane(GO:0098559) |
| 0.0 | 0.8 | GO:0030137 | COPI-coated vesicle(GO:0030137) |
| 0.0 | 0.2 | GO:0032777 | Piccolo NuA4 histone acetyltransferase complex(GO:0032777) |
| 0.0 | 2.4 | GO:0000313 | organellar ribosome(GO:0000313) mitochondrial ribosome(GO:0005761) |
| 0.0 | 0.2 | GO:0002193 | MAML1-RBP-Jkappa- ICN1 complex(GO:0002193) |
| 0.0 | 0.5 | GO:0035145 | exon-exon junction complex(GO:0035145) |
| 0.0 | 0.6 | GO:0043189 | NuA4 histone acetyltransferase complex(GO:0035267) H4/H2A histone acetyltransferase complex(GO:0043189) H4 histone acetyltransferase complex(GO:1902562) |
| 0.0 | 0.2 | GO:0032584 | growth cone membrane(GO:0032584) |
| 0.0 | 0.1 | GO:0061617 | MICOS complex(GO:0061617) |
| 0.0 | 0.1 | GO:0044305 | calyx of Held(GO:0044305) |
| 0.0 | 4.0 | GO:0090575 | RNA polymerase II transcription factor complex(GO:0090575) |
| 0.0 | 0.4 | GO:0005847 | mRNA cleavage and polyadenylation specificity factor complex(GO:0005847) |
| 0.0 | 1.3 | GO:0043198 | dendritic shaft(GO:0043198) |
| 0.0 | 0.1 | GO:0005968 | Rab-protein geranylgeranyltransferase complex(GO:0005968) |
| 0.0 | 0.0 | GO:0005965 | protein farnesyltransferase complex(GO:0005965) |
| 0.0 | 0.2 | GO:0000138 | Golgi trans cisterna(GO:0000138) |
| 0.0 | 0.5 | GO:0005689 | U12-type spliceosomal complex(GO:0005689) |
| 0.0 | 0.2 | GO:0031462 | Cul2-RING ubiquitin ligase complex(GO:0031462) |
| 0.0 | 0.2 | GO:0000015 | phosphopyruvate hydratase complex(GO:0000015) |
| 0.0 | 0.1 | GO:0000812 | Swr1 complex(GO:0000812) |
| 0.0 | 0.2 | GO:0070552 | BRISC complex(GO:0070552) |
| 0.0 | 0.1 | GO:0030678 | mitochondrial ribonuclease P complex(GO:0030678) |
| 0.0 | 0.2 | GO:0016593 | Cdc73/Paf1 complex(GO:0016593) |
| 0.0 | 0.6 | GO:0080008 | Cul4-RING E3 ubiquitin ligase complex(GO:0080008) |
| 0.0 | 0.3 | GO:0097512 | cardiac myofibril(GO:0097512) |
| 0.0 | 0.0 | GO:0042565 | RNA nuclear export complex(GO:0042565) |
| 0.0 | 0.1 | GO:0000308 | cytoplasmic cyclin-dependent protein kinase holoenzyme complex(GO:0000308) |
| 0.0 | 0.3 | GO:0005662 | DNA replication factor A complex(GO:0005662) |
| 0.0 | 0.4 | GO:1990124 | messenger ribonucleoprotein complex(GO:1990124) |
| 0.0 | 0.3 | GO:0060077 | inhibitory synapse(GO:0060077) |
| 0.0 | 0.4 | GO:0043205 | microfibril(GO:0001527) fibril(GO:0043205) |
| 0.0 | 0.1 | GO:0071986 | Ragulator complex(GO:0071986) |
| 0.0 | 0.0 | GO:1990716 | axonemal central apparatus(GO:1990716) |
| 0.0 | 1.1 | GO:0005834 | heterotrimeric G-protein complex(GO:0005834) |
| 0.0 | 0.5 | GO:0071564 | npBAF complex(GO:0071564) |
| 0.0 | 0.1 | GO:0033553 | rDNA heterochromatin(GO:0033553) |
| 0.0 | 0.1 | GO:1905202 | 3-methylcrotonyl-CoA carboxylase complex, mitochondrial(GO:0002169) methylcrotonoyl-CoA carboxylase complex(GO:1905202) |
| 0.0 | 0.4 | GO:0097546 | ciliary base(GO:0097546) |
| 0.0 | 0.2 | GO:0071565 | nBAF complex(GO:0071565) |
| 0.0 | 0.1 | GO:0031205 | endoplasmic reticulum Sec complex(GO:0031205) |
| 0.0 | 0.1 | GO:1990635 | proximal dendrite(GO:1990635) |
| 0.0 | 0.1 | GO:0005853 | eukaryotic translation elongation factor 1 complex(GO:0005853) |
| 0.0 | 1.4 | GO:0001750 | photoreceptor outer segment(GO:0001750) |
| 0.0 | 0.9 | GO:0022627 | cytosolic small ribosomal subunit(GO:0022627) |
| 0.0 | 0.2 | GO:0061700 | GATOR2 complex(GO:0061700) |
| 0.0 | 0.1 | GO:0070436 | Grb2-EGFR complex(GO:0070436) |
| 0.0 | 0.3 | GO:0033202 | Ino80 complex(GO:0031011) DNA helicase complex(GO:0033202) |
| 0.0 | 1.2 | GO:0005758 | mitochondrial intermembrane space(GO:0005758) |
| 0.0 | 0.6 | GO:0031430 | M band(GO:0031430) |
| 0.0 | 0.0 | GO:0035517 | PR-DUB complex(GO:0035517) |
| 0.0 | 0.1 | GO:0071203 | WASH complex(GO:0071203) |
| 0.0 | 0.0 | GO:0070195 | growth hormone receptor complex(GO:0070195) |
| 0.0 | 0.1 | GO:0032133 | chromosome passenger complex(GO:0032133) |
| 0.0 | 0.1 | GO:0097169 | AIM2 inflammasome complex(GO:0097169) |
| 0.0 | 0.1 | GO:0032302 | MutSalpha complex(GO:0032301) MutSbeta complex(GO:0032302) |
| 0.0 | 0.2 | GO:0017119 | Golgi transport complex(GO:0017119) |
| 0.0 | 0.2 | GO:0032045 | guanyl-nucleotide exchange factor complex(GO:0032045) |
| 0.0 | 0.0 | GO:1990316 | ATG1/ULK1 kinase complex(GO:1990316) |
| 0.0 | 0.2 | GO:0005845 | mRNA cap binding complex(GO:0005845) |
| 0.0 | 0.0 | GO:1990726 | Lsm1-7-Pat1 complex(GO:1990726) |
| 0.0 | 0.1 | GO:0097443 | sorting endosome(GO:0097443) |
| 0.0 | 0.1 | GO:0000788 | nuclear nucleosome(GO:0000788) |
| 0.0 | 1.1 | GO:0031903 | peroxisomal membrane(GO:0005778) microbody membrane(GO:0031903) |
| 0.0 | 0.2 | GO:0000815 | ESCRT III complex(GO:0000815) |
| 0.0 | 0.1 | GO:0005677 | chromatin silencing complex(GO:0005677) |
| 0.0 | 0.1 | GO:0005964 | phosphorylase kinase complex(GO:0005964) |
Gene overrepresentation in molecular function category:
| Log-likelihood per target | Total log-likelihood | Term | Description |
|---|---|---|---|
| 0.3 | 1.7 | GO:0032810 | sterol response element binding(GO:0032810) |
| 0.3 | 0.9 | GO:0004874 | aryl hydrocarbon receptor activity(GO:0004874) |
| 0.2 | 0.7 | GO:0003863 | alpha-ketoacid dehydrogenase activity(GO:0003826) 3-methyl-2-oxobutanoate dehydrogenase (2-methylpropanoyl-transferring) activity(GO:0003863) |
| 0.2 | 0.6 | GO:0046577 | long-chain-alcohol oxidase activity(GO:0046577) |
| 0.2 | 0.8 | GO:0047391 | alkylglycerophosphoethanolamine phosphodiesterase activity(GO:0047391) |
| 0.2 | 0.5 | GO:0004336 | galactosylceramidase activity(GO:0004336) |
| 0.2 | 0.5 | GO:0036361 | racemase and epimerase activity, acting on amino acids and derivatives(GO:0016855) racemase activity, acting on amino acids and derivatives(GO:0036361) amino-acid racemase activity(GO:0047661) |
| 0.1 | 1.2 | GO:0043426 | MRF binding(GO:0043426) |
| 0.1 | 0.9 | GO:0016403 | dimethylargininase activity(GO:0016403) |
| 0.1 | 0.6 | GO:0003998 | acylphosphatase activity(GO:0003998) |
| 0.1 | 0.4 | GO:0004852 | uroporphyrinogen-III synthase activity(GO:0004852) |
| 0.1 | 0.8 | GO:0050815 | phosphoserine binding(GO:0050815) |
| 0.1 | 0.2 | GO:0034485 | phosphatidylinositol-3,4,5-trisphosphate 5-phosphatase activity(GO:0034485) |
| 0.1 | 0.3 | GO:0015140 | malate transmembrane transporter activity(GO:0015140) |
| 0.1 | 0.3 | GO:0016309 | 1-phosphatidylinositol-5-phosphate 4-kinase activity(GO:0016309) |
| 0.1 | 1.2 | GO:0017162 | aryl hydrocarbon receptor binding(GO:0017162) |
| 0.1 | 1.8 | GO:0070513 | death domain binding(GO:0070513) |
| 0.1 | 0.4 | GO:0004419 | hydroxymethylglutaryl-CoA lyase activity(GO:0004419) |
| 0.1 | 0.7 | GO:0008121 | ubiquinol-cytochrome-c reductase activity(GO:0008121) oxidoreductase activity, acting on diphenols and related substances as donors, cytochrome as acceptor(GO:0016681) |
| 0.1 | 0.3 | GO:0035402 | histone kinase activity (H3-T11 specific)(GO:0035402) |
| 0.1 | 0.3 | GO:0052839 | inositol 5-diphosphate pentakisphosphate 5-kinase activity(GO:0052836) inositol diphosphate tetrakisphosphate kinase activity(GO:0052839) |
| 0.1 | 0.4 | GO:0008969 | phosphohistidine phosphatase activity(GO:0008969) |
| 0.1 | 0.2 | GO:0000253 | 3-keto sterol reductase activity(GO:0000253) |
| 0.1 | 0.2 | GO:0042903 | tubulin deacetylase activity(GO:0042903) |
| 0.1 | 0.3 | GO:0001069 | regulatory region RNA binding(GO:0001069) |
| 0.1 | 0.3 | GO:0042132 | fructose 1,6-bisphosphate 1-phosphatase activity(GO:0042132) |
| 0.1 | 0.4 | GO:0050436 | microfibril binding(GO:0050436) |
| 0.1 | 0.5 | GO:0001165 | RNA polymerase I upstream control element sequence-specific DNA binding(GO:0001165) |
| 0.1 | 0.2 | GO:0030305 | heparanase activity(GO:0030305) |
| 0.1 | 0.6 | GO:0070740 | tubulin-glutamic acid ligase activity(GO:0070740) |
| 0.1 | 0.3 | GO:0008160 | protein tyrosine phosphatase activator activity(GO:0008160) |
| 0.1 | 0.2 | GO:0052810 | 1-phosphatidylinositol-5-kinase activity(GO:0052810) |
| 0.1 | 0.4 | GO:0004614 | phosphoglucomutase activity(GO:0004614) |
| 0.1 | 0.7 | GO:0060072 | large conductance calcium-activated potassium channel activity(GO:0060072) |
| 0.1 | 0.5 | GO:0016724 | ferroxidase activity(GO:0004322) oxidoreductase activity, oxidizing metal ions, oxygen as acceptor(GO:0016724) |
| 0.1 | 0.2 | GO:0016649 | electron-transferring-flavoprotein dehydrogenase activity(GO:0004174) oxidoreductase activity, acting on the CH-NH group of donors, quinone or similar compound as acceptor(GO:0016649) |
| 0.1 | 0.2 | GO:0004165 | dodecenoyl-CoA delta-isomerase activity(GO:0004165) |
| 0.1 | 0.3 | GO:0010861 | thyroid hormone receptor activator activity(GO:0010861) thyroid hormone receptor coactivator activity(GO:0030375) |
| 0.1 | 0.4 | GO:0004045 | aminoacyl-tRNA hydrolase activity(GO:0004045) |
| 0.1 | 0.3 | GO:0004140 | dephospho-CoA kinase activity(GO:0004140) |
| 0.1 | 0.2 | GO:0008798 | beta-aspartyl-peptidase activity(GO:0008798) |
| 0.1 | 1.5 | GO:0048156 | tau protein binding(GO:0048156) |
| 0.1 | 0.2 | GO:0060422 | peptidyl-dipeptidase inhibitor activity(GO:0060422) |
| 0.1 | 0.2 | GO:0031531 | thyrotropin-releasing hormone receptor binding(GO:0031531) |
| 0.1 | 0.2 | GO:0004449 | isocitrate dehydrogenase (NAD+) activity(GO:0004449) |
| 0.1 | 0.3 | GO:0052845 | endopolyphosphatase activity(GO:0000298) diphosphoinositol-polyphosphate diphosphatase activity(GO:0008486) bis(5'-adenosyl)-hexaphosphatase activity(GO:0034431) bis(5'-adenosyl)-pentaphosphatase activity(GO:0034432) inositol diphosphate tetrakisphosphate diphosphatase activity(GO:0052840) inositol bisdiphosphate tetrakisphosphate diphosphatase activity(GO:0052841) inositol diphosphate pentakisphosphate diphosphatase activity(GO:0052842) inositol-1-diphosphate-2,3,4,5,6-pentakisphosphate diphosphatase activity(GO:0052843) inositol-3-diphosphate-1,2,4,5,6-pentakisphosphate diphosphatase activity(GO:0052844) inositol-5-diphosphate-1,2,3,4,6-pentakisphosphate diphosphatase activity(GO:0052845) inositol-1,5-bisdiphosphate-2,3,4,6-tetrakisphosphate 1-diphosphatase activity(GO:0052846) inositol-1,5-bisdiphosphate-2,3,4,6-tetrakisphosphate 5-diphosphatase activity(GO:0052847) inositol-3,5-bisdiphosphate-2,3,4,6-tetrakisphosphate 5-diphosphatase activity(GO:0052848) |
| 0.1 | 0.5 | GO:0030160 | GKAP/Homer scaffold activity(GO:0030160) |
| 0.1 | 0.2 | GO:0005163 | nerve growth factor receptor binding(GO:0005163) |
| 0.1 | 3.1 | GO:0008137 | NADH dehydrogenase (ubiquinone) activity(GO:0008137) NADH dehydrogenase (quinone) activity(GO:0050136) |
| 0.1 | 0.2 | GO:0004798 | thymidylate kinase activity(GO:0004798) |
| 0.1 | 0.3 | GO:0004161 | dimethylallyltranstransferase activity(GO:0004161) geranyltranstransferase activity(GO:0004337) |
| 0.0 | 0.5 | GO:0004784 | superoxide dismutase activity(GO:0004784) oxidoreductase activity, acting on superoxide radicals as acceptor(GO:0016721) |
| 0.0 | 0.6 | GO:0070181 | small ribosomal subunit rRNA binding(GO:0070181) |
| 0.0 | 0.2 | GO:0008410 | CoA-transferase activity(GO:0008410) |
| 0.0 | 0.3 | GO:0030628 | pre-mRNA 3'-splice site binding(GO:0030628) |
| 0.0 | 0.2 | GO:0004886 | 9-cis retinoic acid receptor activity(GO:0004886) |
| 0.0 | 0.4 | GO:0031432 | titin binding(GO:0031432) |
| 0.0 | 0.1 | GO:0035651 | AP-3 adaptor complex binding(GO:0035651) |
| 0.0 | 0.2 | GO:0019107 | glycylpeptide N-tetradecanoyltransferase activity(GO:0004379) myristoyltransferase activity(GO:0019107) |
| 0.0 | 0.5 | GO:0031995 | insulin-like growth factor II binding(GO:0031995) |
| 0.0 | 0.1 | GO:0004662 | CAAX-protein geranylgeranyltransferase activity(GO:0004662) |
| 0.0 | 0.2 | GO:1990460 | leptin receptor binding(GO:1990460) |
| 0.0 | 0.9 | GO:0004861 | cyclin-dependent protein serine/threonine kinase inhibitor activity(GO:0004861) |
| 0.0 | 0.2 | GO:0017077 | oxidative phosphorylation uncoupler activity(GO:0017077) |
| 0.0 | 0.3 | GO:0005315 | inorganic phosphate transmembrane transporter activity(GO:0005315) |
| 0.0 | 0.3 | GO:0004351 | glutamate decarboxylase activity(GO:0004351) |
| 0.0 | 0.5 | GO:0008603 | cAMP-dependent protein kinase regulator activity(GO:0008603) |
| 0.0 | 0.2 | GO:0004979 | beta-endorphin receptor activity(GO:0004979) morphine receptor activity(GO:0038047) |
| 0.0 | 1.0 | GO:0008191 | metalloendopeptidase inhibitor activity(GO:0008191) |
| 0.0 | 0.4 | GO:0015038 | glutathione disulfide oxidoreductase activity(GO:0015038) |
| 0.0 | 0.2 | GO:0019797 | procollagen-proline 3-dioxygenase activity(GO:0019797) |
| 0.0 | 1.0 | GO:0004697 | protein kinase C activity(GO:0004697) |
| 0.0 | 0.3 | GO:0097643 | amylin receptor activity(GO:0097643) |
| 0.0 | 0.2 | GO:0070404 | NADH binding(GO:0070404) |
| 0.0 | 0.2 | GO:0000104 | succinate dehydrogenase activity(GO:0000104) |
| 0.0 | 0.7 | GO:0005522 | profilin binding(GO:0005522) |
| 0.0 | 0.3 | GO:1904929 | coreceptor activity involved in Wnt signaling pathway, planar cell polarity pathway(GO:1904929) |
| 0.0 | 0.1 | GO:0004616 | phosphogluconate dehydrogenase (decarboxylating) activity(GO:0004616) |
| 0.0 | 0.2 | GO:0008453 | alanine-glyoxylate transaminase activity(GO:0008453) |
| 0.0 | 0.1 | GO:0031755 | endothelial differentiation G-protein coupled receptor binding(GO:0031753) Edg-2 lysophosphatidic acid receptor binding(GO:0031755) |
| 0.0 | 0.4 | GO:0005078 | MAP-kinase scaffold activity(GO:0005078) |
| 0.0 | 0.1 | GO:0008184 | glycogen phosphorylase activity(GO:0008184) |
| 0.0 | 0.8 | GO:0031698 | beta-2 adrenergic receptor binding(GO:0031698) |
| 0.0 | 0.3 | GO:0004445 | inositol-polyphosphate 5-phosphatase activity(GO:0004445) |
| 0.0 | 0.1 | GO:0004853 | uroporphyrinogen decarboxylase activity(GO:0004853) |
| 0.0 | 0.4 | GO:0008607 | phosphorylase kinase regulator activity(GO:0008607) |
| 0.0 | 0.9 | GO:0004298 | threonine-type endopeptidase activity(GO:0004298) threonine-type peptidase activity(GO:0070003) |
| 0.0 | 0.4 | GO:0051371 | muscle alpha-actinin binding(GO:0051371) |
| 0.0 | 0.2 | GO:0050733 | RS domain binding(GO:0050733) |
| 0.0 | 0.4 | GO:0015266 | protein channel activity(GO:0015266) |
| 0.0 | 0.8 | GO:0002162 | dystroglycan binding(GO:0002162) |
| 0.0 | 0.2 | GO:0000404 | heteroduplex DNA loop binding(GO:0000404) |
| 0.0 | 0.2 | GO:1904288 | BAT3 complex binding(GO:1904288) |
| 0.0 | 0.2 | GO:0019788 | NEDD8 transferase activity(GO:0019788) |
| 0.0 | 0.9 | GO:0004707 | MAP kinase activity(GO:0004707) |
| 0.0 | 0.1 | GO:0070139 | ubiquitin-like protein-specific endopeptidase activity(GO:0070137) SUMO-specific endopeptidase activity(GO:0070139) |
| 0.0 | 0.2 | GO:0035368 | selenocysteine insertion sequence binding(GO:0035368) |
| 0.0 | 0.3 | GO:0000268 | peroxisome targeting sequence binding(GO:0000268) |
| 0.0 | 0.1 | GO:0004774 | succinate-CoA ligase activity(GO:0004774) |
| 0.0 | 0.7 | GO:0000062 | fatty-acyl-CoA binding(GO:0000062) |
| 0.0 | 0.1 | GO:0004792 | thiosulfate sulfurtransferase activity(GO:0004792) |
| 0.0 | 2.3 | GO:0050840 | extracellular matrix binding(GO:0050840) |
| 0.0 | 0.1 | GO:1904455 | ubiquitin-specific protease activity involved in negative regulation of ERAD pathway(GO:1904455) |
| 0.0 | 0.1 | GO:0004661 | protein geranylgeranyltransferase activity(GO:0004661) |
| 0.0 | 1.4 | GO:0061631 | ubiquitin conjugating enzyme activity(GO:0061631) |
| 0.0 | 0.2 | GO:0017050 | sphinganine kinase activity(GO:0008481) D-erythro-sphingosine kinase activity(GO:0017050) |
| 0.0 | 0.2 | GO:1990254 | keratin filament binding(GO:1990254) |
| 0.0 | 0.1 | GO:0004157 | dihydropyrimidinase activity(GO:0004157) |
| 0.0 | 5.8 | GO:0003735 | structural constituent of ribosome(GO:0003735) |
| 0.0 | 0.4 | GO:0016004 | phospholipase activator activity(GO:0016004) |
| 0.0 | 0.1 | GO:0008900 | hydrogen:potassium-exchanging ATPase activity(GO:0008900) |
| 0.0 | 0.6 | GO:0035615 | clathrin adaptor activity(GO:0035615) endocytic adaptor activity(GO:0098748) |
| 0.0 | 0.3 | GO:0009374 | biotin binding(GO:0009374) |
| 0.0 | 1.3 | GO:0030544 | Hsp70 protein binding(GO:0030544) |
| 0.0 | 0.2 | GO:0019826 | oxygen sensor activity(GO:0019826) |
| 0.0 | 0.2 | GO:0051373 | FATZ binding(GO:0051373) |
| 0.0 | 0.1 | GO:0032090 | Pyrin domain binding(GO:0032090) |
| 0.0 | 0.7 | GO:0016922 | ligand-dependent nuclear receptor binding(GO:0016922) |
| 0.0 | 0.1 | GO:0015450 | P-P-bond-hydrolysis-driven protein transmembrane transporter activity(GO:0015450) |
| 0.0 | 0.1 | GO:0042610 | CD8 receptor binding(GO:0042610) |
| 0.0 | 0.2 | GO:0010385 | double-stranded methylated DNA binding(GO:0010385) |
| 0.0 | 0.2 | GO:0036402 | proteasome-activating ATPase activity(GO:0036402) |
| 0.0 | 0.2 | GO:0036132 | 13-prostaglandin reductase activity(GO:0036132) 15-oxoprostaglandin 13-oxidase activity(GO:0047522) |
| 0.0 | 0.2 | GO:0004849 | uridine kinase activity(GO:0004849) |
| 0.0 | 1.1 | GO:0005484 | SNAP receptor activity(GO:0005484) |
| 0.0 | 0.2 | GO:0030911 | TPR domain binding(GO:0030911) |
| 0.0 | 0.1 | GO:0008427 | calcium-dependent protein kinase inhibitor activity(GO:0008427) |
| 0.0 | 0.4 | GO:0015467 | G-protein activated inward rectifier potassium channel activity(GO:0015467) |
| 0.0 | 0.1 | GO:0031752 | D5 dopamine receptor binding(GO:0031752) |
| 0.0 | 0.8 | GO:0004709 | MAP kinase kinase kinase activity(GO:0004709) |
| 0.0 | 0.3 | GO:0004028 | 3-chloroallyl aldehyde dehydrogenase activity(GO:0004028) |
| 0.0 | 0.2 | GO:0005094 | Rho GDP-dissociation inhibitor activity(GO:0005094) |
| 0.0 | 0.2 | GO:0005047 | signal recognition particle binding(GO:0005047) |
| 0.0 | 0.1 | GO:0035605 | peptidyl-cysteine S-nitrosylase activity(GO:0035605) |
| 0.0 | 0.4 | GO:0008253 | 5'-nucleotidase activity(GO:0008253) |
| 0.0 | 0.1 | GO:0032038 | myosin II heavy chain binding(GO:0032038) |
| 0.0 | 0.1 | GO:0015616 | DNA translocase activity(GO:0015616) |
| 0.0 | 0.8 | GO:0044183 | protein binding involved in protein folding(GO:0044183) |
| 0.0 | 0.1 | GO:0016402 | pristanoyl-CoA oxidase activity(GO:0016402) |
| 0.0 | 0.0 | GO:0004660 | protein farnesyltransferase activity(GO:0004660) |
| 0.0 | 0.1 | GO:0004773 | steryl-sulfatase activity(GO:0004773) |
| 0.0 | 0.5 | GO:0070064 | proline-rich region binding(GO:0070064) |
| 0.0 | 0.4 | GO:0005351 | sugar:proton symporter activity(GO:0005351) cation:sugar symporter activity(GO:0005402) |
| 0.0 | 0.2 | GO:0030292 | protein tyrosine kinase inhibitor activity(GO:0030292) |
| 0.0 | 0.1 | GO:0050833 | pyruvate transmembrane transporter activity(GO:0050833) |
| 0.0 | 0.1 | GO:0016714 | oxidoreductase activity, acting on paired donors, with incorporation or reduction of molecular oxygen, reduced pteridine as one donor, and incorporation of one atom of oxygen(GO:0016714) |
| 0.0 | 0.1 | GO:0004609 | phosphatidylserine decarboxylase activity(GO:0004609) |
| 0.0 | 0.1 | GO:0004739 | pyruvate dehydrogenase (acetyl-transferring) activity(GO:0004739) |
| 0.0 | 0.2 | GO:0016783 | sulfurtransferase activity(GO:0016783) |
| 0.0 | 0.2 | GO:0004634 | phosphopyruvate hydratase activity(GO:0004634) |
| 0.0 | 1.6 | GO:0035064 | methylated histone binding(GO:0035064) |
| 0.0 | 0.2 | GO:0004767 | sphingomyelin phosphodiesterase activity(GO:0004767) |
| 0.0 | 0.1 | GO:0048495 | Roundabout binding(GO:0048495) |
| 0.0 | 0.6 | GO:0003785 | actin monomer binding(GO:0003785) |
| 0.0 | 0.1 | GO:0071209 | U7 snRNA binding(GO:0071209) |
| 0.0 | 0.0 | GO:0090631 | pre-miRNA transporter activity(GO:0090631) |
| 0.0 | 0.5 | GO:0008409 | 5'-3' exonuclease activity(GO:0008409) |
| 0.0 | 0.1 | GO:0004095 | carnitine O-palmitoyltransferase activity(GO:0004095) |
| 0.0 | 0.1 | GO:0019784 | NEDD8-specific protease activity(GO:0019784) |
| 0.0 | 0.2 | GO:0004957 | prostaglandin E receptor activity(GO:0004957) |
| 0.0 | 0.3 | GO:0017154 | semaphorin receptor activity(GO:0017154) |
| 0.0 | 0.3 | GO:0017166 | vinculin binding(GO:0017166) |
| 0.0 | 0.6 | GO:0003950 | NAD+ ADP-ribosyltransferase activity(GO:0003950) |
| 0.0 | 0.1 | GO:0003873 | 6-phosphofructo-2-kinase activity(GO:0003873) |
| 0.0 | 0.1 | GO:0005277 | acetylcholine transmembrane transporter activity(GO:0005277) secondary active organic cation transmembrane transporter activity(GO:0008513) acetate ester transmembrane transporter activity(GO:1901375) |
| 0.0 | 1.4 | GO:0008307 | structural constituent of muscle(GO:0008307) |
| 0.0 | 0.3 | GO:0034452 | dynactin binding(GO:0034452) |
| 0.0 | 0.1 | GO:0004797 | deoxycytidine kinase activity(GO:0004137) thymidine kinase activity(GO:0004797) |
| 0.0 | 0.1 | GO:0005134 | interleukin-2 receptor binding(GO:0005134) |
| 0.0 | 0.1 | GO:0004111 | creatine kinase activity(GO:0004111) |
| 0.0 | 0.1 | GO:0008479 | queuine tRNA-ribosyltransferase activity(GO:0008479) |
| 0.0 | 0.1 | GO:0004971 | AMPA glutamate receptor activity(GO:0004971) |
| 0.0 | 0.7 | GO:0001221 | transcription cofactor binding(GO:0001221) |
| 0.0 | 0.2 | GO:0046790 | virion binding(GO:0046790) |
| 0.0 | 0.3 | GO:0004181 | metallocarboxypeptidase activity(GO:0004181) |
| 0.0 | 0.2 | GO:0000150 | recombinase activity(GO:0000150) |
| 0.0 | 0.1 | GO:0015184 | L-cystine transmembrane transporter activity(GO:0015184) |
| 0.0 | 0.1 | GO:1904315 | neurotransmitter receptor activity involved in regulation of postsynaptic membrane potential(GO:0099529) transmitter-gated ion channel activity involved in regulation of postsynaptic membrane potential(GO:1904315) |
| 0.0 | 0.2 | GO:0004726 | non-membrane spanning protein tyrosine phosphatase activity(GO:0004726) |
| 0.0 | 0.0 | GO:0003985 | acetyl-CoA C-acetyltransferase activity(GO:0003985) |
| 0.0 | 0.0 | GO:0005148 | prolactin receptor binding(GO:0005148) |
| 0.0 | 0.1 | GO:0042975 | peroxisome proliferator activated receptor binding(GO:0042975) |
| 0.0 | 0.1 | GO:0099580 | ion antiporter activity involved in regulation of postsynaptic membrane potential(GO:0099580) |
| 0.0 | 0.4 | GO:0000993 | RNA polymerase II core binding(GO:0000993) |
| 0.0 | 0.0 | GO:0004782 | sulfinoalanine decarboxylase activity(GO:0004782) |
| 0.0 | 0.1 | GO:0033592 | RNA strand annealing activity(GO:0033592) |
| 0.0 | 0.3 | GO:0070008 | serine-type exopeptidase activity(GO:0070008) |
| 0.0 | 0.1 | GO:0004931 | extracellular ATP-gated cation channel activity(GO:0004931) ATP-gated ion channel activity(GO:0035381) |
| 0.0 | 0.3 | GO:0017025 | TBP-class protein binding(GO:0017025) |
| 0.0 | 0.2 | GO:0016653 | oxidoreductase activity, acting on NAD(P)H, heme protein as acceptor(GO:0016653) |
| 0.0 | 0.0 | GO:0031826 | type 2A serotonin receptor binding(GO:0031826) |
| 0.0 | 0.7 | GO:0004407 | histone deacetylase activity(GO:0004407) protein deacetylase activity(GO:0033558) |
| 0.0 | 0.4 | GO:0004198 | calcium-dependent cysteine-type endopeptidase activity(GO:0004198) |
| 0.0 | 0.2 | GO:0005092 | GDP-dissociation inhibitor activity(GO:0005092) |
| 0.0 | 0.2 | GO:0051010 | microtubule plus-end binding(GO:0051010) |
| 0.0 | 0.1 | GO:0032184 | SUMO polymer binding(GO:0032184) |
| 0.0 | 0.1 | GO:0004689 | phosphorylase kinase activity(GO:0004689) |
| 0.0 | 0.3 | GO:0001965 | G-protein alpha-subunit binding(GO:0001965) |
Gene overrepresentation in curated gene sets: canonical pathways category:
| Log-likelihood per target | Total log-likelihood | Term | Description |
|---|---|---|---|
| 0.0 | 0.0 | PID RANBP2 PATHWAY | Sumoylation by RanBP2 regulates transcriptional repression |
| 0.0 | 0.8 | PID P38 GAMMA DELTA PATHWAY | Signaling mediated by p38-gamma and p38-delta |
| 0.0 | 2.3 | NABA PROTEOGLYCANS | Genes encoding proteoglycans |
| 0.0 | 1.2 | PID HIF1A PATHWAY | Hypoxic and oxygen homeostasis regulation of HIF-1-alpha |
| 0.0 | 2.1 | PID RXR VDR PATHWAY | RXR and RAR heterodimerization with other nuclear receptor |
| 0.0 | 2.4 | PID IGF1 PATHWAY | IGF1 pathway |
| 0.0 | 1.0 | PID ARF 3PATHWAY | Arf1 pathway |
| 0.0 | 0.6 | SA PROGRAMMED CELL DEATH | Programmed cell death, or apoptosis, eliminates damaged or unneeded cells. |
| 0.0 | 2.2 | PID CASPASE PATHWAY | Caspase cascade in apoptosis |
| 0.0 | 2.0 | ST DIFFERENTIATION PATHWAY IN PC12 CELLS | Differentiation Pathway in PC12 Cells; this is a specific case of PAC1 Receptor Pathway. |
| 0.0 | 0.2 | PID IL3 PATHWAY | IL3-mediated signaling events |
| 0.0 | 0.2 | PID BARD1 PATHWAY | BARD1 signaling events |
| 0.0 | 2.3 | ST FAS SIGNALING PATHWAY | Fas Signaling Pathway |
| 0.0 | 0.3 | PID EPHA2 FWD PATHWAY | EPHA2 forward signaling |
| 0.0 | 0.4 | PID INSULIN GLUCOSE PATHWAY | Insulin-mediated glucose transport |
| 0.0 | 0.1 | PID IL2 PI3K PATHWAY | IL2 signaling events mediated by PI3K |
| 0.0 | 1.5 | PID RAC1 REG PATHWAY | Regulation of RAC1 activity |
| 0.0 | 0.5 | PID PI3KCI AKT PATHWAY | Class I PI3K signaling events mediated by Akt |
| 0.0 | 0.4 | PID ERB GENOMIC PATHWAY | Validated nuclear estrogen receptor beta network |
| 0.0 | 0.2 | ST JAK STAT PATHWAY | Jak-STAT Pathway |
| 0.0 | 0.6 | PID MYC PATHWAY | C-MYC pathway |
| 0.0 | 1.3 | PID ARF6 TRAFFICKING PATHWAY | Arf6 trafficking events |
| 0.0 | 0.5 | PID P38 MK2 PATHWAY | p38 signaling mediated by MAPKAP kinases |
| 0.0 | 1.1 | PID LKB1 PATHWAY | LKB1 signaling events |
| 0.0 | 0.0 | ST INTERFERON GAMMA PATHWAY | Interferon gamma pathway. |
| 0.0 | 0.2 | PID THROMBIN PAR4 PATHWAY | PAR4-mediated thrombin signaling events |
| 0.0 | 0.2 | PID TCR JNK PATHWAY | JNK signaling in the CD4+ TCR pathway |
| 0.0 | 0.2 | SIG REGULATION OF THE ACTIN CYTOSKELETON BY RHO GTPASES | Genes related to regulation of the actin cytoskeleton |
| 0.0 | 0.1 | PID ECADHERIN KERATINOCYTE PATHWAY | E-cadherin signaling in keratinocytes |
| 0.0 | 0.3 | PID FOXO PATHWAY | FoxO family signaling |
| 0.0 | 0.4 | PID NFKAPPAB CANONICAL PATHWAY | Canonical NF-kappaB pathway |
| 0.0 | 0.2 | PID CIRCADIAN PATHWAY | Circadian rhythm pathway |
| 0.0 | 0.1 | SIG IL4RECEPTOR IN B LYPHOCYTES | Genes related to IL4 rceptor signaling in B lymphocytes |
| 0.0 | 0.7 | PID HEDGEHOG GLI PATHWAY | Hedgehog signaling events mediated by Gli proteins |
| 0.0 | 0.3 | PID THROMBIN PAR1 PATHWAY | PAR1-mediated thrombin signaling events |
Gene overrepresentation in curated gene sets: REACTOME pathways category:
| Log-likelihood per target | Total log-likelihood | Term | Description |
|---|---|---|---|
| 0.1 | 2.5 | REACTOME CS DS DEGRADATION | Genes involved in CS/DS degradation |
| 0.1 | 0.7 | REACTOME RNA POL I PROMOTER OPENING | Genes involved in RNA Polymerase I Promoter Opening |
| 0.1 | 0.2 | REACTOME SIGNALING BY WNT | Genes involved in Signaling by Wnt |
| 0.1 | 0.7 | REACTOME COPI MEDIATED TRANSPORT | Genes involved in COPI Mediated Transport |
| 0.1 | 4.5 | REACTOME RESPIRATORY ELECTRON TRANSPORT | Genes involved in Respiratory electron transport |
| 0.0 | 2.7 | REACTOME SMOOTH MUSCLE CONTRACTION | Genes involved in Smooth Muscle Contraction |
| 0.0 | 1.4 | REACTOME BRANCHED CHAIN AMINO ACID CATABOLISM | Genes involved in Branched-chain amino acid catabolism |
| 0.0 | 0.2 | REACTOME RESPIRATORY ELECTRON TRANSPORT ATP SYNTHESIS BY CHEMIOSMOTIC COUPLING AND HEAT PRODUCTION BY UNCOUPLING PROTEINS | Genes involved in Respiratory electron transport, ATP synthesis by chemiosmotic coupling, and heat production by uncoupling proteins. |
| 0.0 | 0.9 | REACTOME SIGNALLING TO P38 VIA RIT AND RIN | Genes involved in Signalling to p38 via RIT and RIN |
| 0.0 | 0.9 | REACTOME NOREPINEPHRINE NEUROTRANSMITTER RELEASE CYCLE | Genes involved in Norepinephrine Neurotransmitter Release Cycle |
| 0.0 | 1.0 | REACTOME CIRCADIAN REPRESSION OF EXPRESSION BY REV ERBA | Genes involved in Circadian Repression of Expression by REV-ERBA |
| 0.0 | 5.1 | REACTOME PEPTIDE CHAIN ELONGATION | Genes involved in Peptide chain elongation |
| 0.0 | 0.7 | REACTOME MRNA DECAY BY 5 TO 3 EXORIBONUCLEASE | Genes involved in mRNA Decay by 5' to 3' Exoribonuclease |
| 0.0 | 1.2 | REACTOME SPHINGOLIPID DE NOVO BIOSYNTHESIS | Genes involved in Sphingolipid de novo biosynthesis |
| 0.0 | 0.6 | REACTOME RETROGRADE NEUROTROPHIN SIGNALLING | Genes involved in Retrograde neurotrophin signalling |
| 0.0 | 0.4 | REACTOME DSCAM INTERACTIONS | Genes involved in DSCAM interactions |
| 0.0 | 1.2 | REACTOME REGULATION OF HYPOXIA INDUCIBLE FACTOR HIF BY OXYGEN | Genes involved in Regulation of Hypoxia-inducible Factor (HIF) by Oxygen |
| 0.0 | 0.9 | REACTOME PHOSPHORYLATION OF THE APC C | Genes involved in Phosphorylation of the APC/C |
| 0.0 | 0.7 | REACTOME HS GAG DEGRADATION | Genes involved in HS-GAG degradation |
| 0.0 | 0.5 | REACTOME GAMMA CARBOXYLATION TRANSPORT AND AMINO TERMINAL CLEAVAGE OF PROTEINS | Genes involved in Gamma-carboxylation, transport, and amino-terminal cleavage of proteins |
| 0.0 | 0.3 | REACTOME POST CHAPERONIN TUBULIN FOLDING PATHWAY | Genes involved in Post-chaperonin tubulin folding pathway |
| 0.0 | 0.1 | REACTOME REGULATION OF APOPTOSIS | Genes involved in Regulation of Apoptosis |
| 0.0 | 1.5 | REACTOME AUTODEGRADATION OF CDH1 BY CDH1 APC C | Genes involved in Autodegradation of Cdh1 by Cdh1:APC/C |
| 0.0 | 0.8 | REACTOME SIGNALING BY NODAL | Genes involved in Signaling by NODAL |
| 0.0 | 1.0 | REACTOME PROSTACYCLIN SIGNALLING THROUGH PROSTACYCLIN RECEPTOR | Genes involved in Prostacyclin signalling through prostacyclin receptor |
| 0.0 | 0.2 | REACTOME MEMBRANE BINDING AND TARGETTING OF GAG PROTEINS | Genes involved in Membrane binding and targetting of GAG proteins |
| 0.0 | 0.4 | REACTOME ROLE OF DCC IN REGULATING APOPTOSIS | Genes involved in Role of DCC in regulating apoptosis |
| 0.0 | 0.3 | REACTOME RECYCLING OF BILE ACIDS AND SALTS | Genes involved in Recycling of bile acids and salts |
| 0.0 | 0.5 | REACTOME REGULATION OF INSULIN LIKE GROWTH FACTOR IGF ACTIVITY BY INSULIN LIKE GROWTH FACTOR BINDING PROTEINS IGFBPS | Genes involved in Regulation of Insulin-like Growth Factor (IGF) Activity by Insulin-like Growth Factor Binding Proteins (IGFBPs) |
| 0.0 | 0.1 | REACTOME G BETA GAMMA SIGNALLING THROUGH PLC BETA | Genes involved in G beta:gamma signalling through PLC beta |
| 0.0 | 0.4 | REACTOME MITOCHONDRIAL FATTY ACID BETA OXIDATION | Genes involved in Mitochondrial Fatty Acid Beta-Oxidation |
| 0.0 | 2.0 | REACTOME NUCLEAR RECEPTOR TRANSCRIPTION PATHWAY | Genes involved in Nuclear Receptor transcription pathway |
| 0.0 | 1.1 | REACTOME SIGNALING BY ROBO RECEPTOR | Genes involved in Signaling by Robo receptor |
| 0.0 | 0.5 | REACTOME SIGNALING BY HIPPO | Genes involved in Signaling by Hippo |
| 0.0 | 0.2 | REACTOME PROSTANOID LIGAND RECEPTORS | Genes involved in Prostanoid ligand receptors |
| 0.0 | 0.2 | REACTOME PTM GAMMA CARBOXYLATION HYPUSINE FORMATION AND ARYLSULFATASE ACTIVATION | Genes involved in PTM: gamma carboxylation, hypusine formation and arylsulfatase activation |
| 0.0 | 0.6 | REACTOME SYNTHESIS AND INTERCONVERSION OF NUCLEOTIDE DI AND TRIPHOSPHATES | Genes involved in Synthesis and interconversion of nucleotide di- and triphosphates |
| 0.0 | 0.3 | REACTOME SPRY REGULATION OF FGF SIGNALING | Genes involved in Spry regulation of FGF signaling |
| 0.0 | 0.3 | REACTOME CITRIC ACID CYCLE TCA CYCLE | Genes involved in Citric acid cycle (TCA cycle) |
| 0.0 | 0.7 | REACTOME SYNTHESIS OF PIPS AT THE PLASMA MEMBRANE | Genes involved in Synthesis of PIPs at the plasma membrane |
| 0.0 | 0.3 | REACTOME DCC MEDIATED ATTRACTIVE SIGNALING | Genes involved in DCC mediated attractive signaling |
| 0.0 | 0.3 | REACTOME TRAFFICKING OF GLUR2 CONTAINING AMPA RECEPTORS | Genes involved in Trafficking of GluR2-containing AMPA receptors |
| 0.0 | 0.4 | REACTOME METABOLISM OF PORPHYRINS | Genes involved in Metabolism of porphyrins |
| 0.0 | 0.3 | REACTOME TIE2 SIGNALING | Genes involved in Tie2 Signaling |
| 0.0 | 0.6 | REACTOME PREFOLDIN MEDIATED TRANSFER OF SUBSTRATE TO CCT TRIC | Genes involved in Prefoldin mediated transfer of substrate to CCT/TriC |
| 0.0 | 0.1 | REACTOME THROMBOXANE SIGNALLING THROUGH TP RECEPTOR | Genes involved in Thromboxane signalling through TP receptor |
| 0.0 | 0.7 | REACTOME GLUCONEOGENESIS | Genes involved in Gluconeogenesis |
| 0.0 | 0.4 | REACTOME GLUCAGON SIGNALING IN METABOLIC REGULATION | Genes involved in Glucagon signaling in metabolic regulation |
| 0.0 | 0.4 | REACTOME FORMATION OF INCISION COMPLEX IN GG NER | Genes involved in Formation of incision complex in GG-NER |
| 0.0 | 0.4 | REACTOME CELL EXTRACELLULAR MATRIX INTERACTIONS | Genes involved in Cell-extracellular matrix interactions |
| 0.0 | 0.3 | REACTOME INHIBITION OF VOLTAGE GATED CA2 CHANNELS VIA GBETA GAMMA SUBUNITS | Genes involved in Inhibition of voltage gated Ca2+ channels via Gbeta/gamma subunits |
| 0.0 | 0.3 | REACTOME GLYCOGEN BREAKDOWN GLYCOGENOLYSIS | Genes involved in Glycogen breakdown (glycogenolysis) |
| 0.0 | 0.2 | REACTOME GLUTAMATE NEUROTRANSMITTER RELEASE CYCLE | Genes involved in Glutamate Neurotransmitter Release Cycle |
| 0.0 | 0.4 | REACTOME ELONGATION ARREST AND RECOVERY | Genes involved in Elongation arrest and recovery |
| 0.0 | 0.6 | REACTOME INTRINSIC PATHWAY FOR APOPTOSIS | Genes involved in Intrinsic Pathway for Apoptosis |
| 0.0 | 0.1 | REACTOME APOBEC3G MEDIATED RESISTANCE TO HIV1 INFECTION | Genes involved in APOBEC3G mediated resistance to HIV-1 infection |
| 0.0 | 0.6 | REACTOME SPHINGOLIPID METABOLISM | Genes involved in Sphingolipid metabolism |
| 0.0 | 2.5 | REACTOME SIGNALING BY RHO GTPASES | Genes involved in Signaling by Rho GTPases |
| 0.0 | 0.8 | REACTOME NCAM1 INTERACTIONS | Genes involved in NCAM1 interactions |
| 0.0 | 0.1 | REACTOME RECYCLING PATHWAY OF L1 | Genes involved in Recycling pathway of L1 |
| 0.0 | 0.1 | REACTOME CONVERSION FROM APC C CDC20 TO APC C CDH1 IN LATE ANAPHASE | Genes involved in Conversion from APC/C:Cdc20 to APC/C:Cdh1 in late anaphase |
| 0.0 | 0.2 | REACTOME G PROTEIN ACTIVATION | Genes involved in G-protein activation |