Project
Epithelial-Mesenchymal Transition, human (Scheel, 2011)
Navigation
Downloads
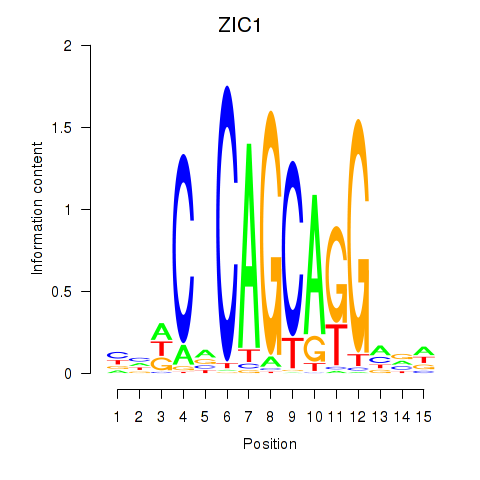
Results for ZIC1
Z-value: 0.34
Motif logo
Transcription factors associated with ZIC1
| Gene Symbol | Gene ID | Gene Info |
|---|---|---|
|
ZIC1
|
ENSG00000152977.10 | Zic family member 1 |
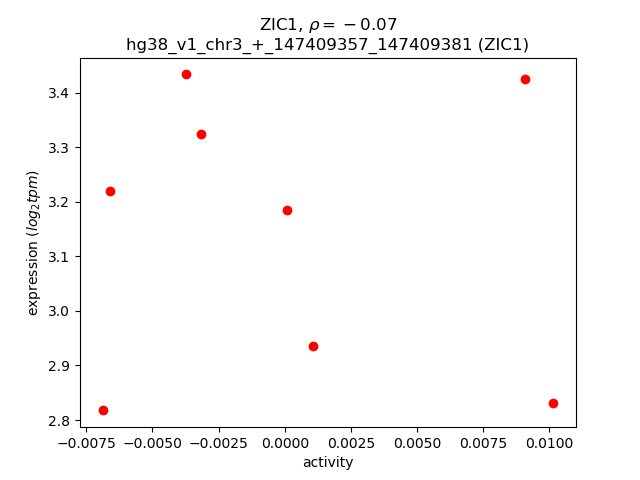
Activity-expression correlation:
| Gene | Promoter | Pearson corr. coef. | P-value | Plot |
|---|---|---|---|---|
| ZIC1 | hg38_v1_chr3_+_147409357_147409381 | -0.07 | 8.8e-01 | Click! |
Activity profile of ZIC1 motif
Sorted Z-values of ZIC1 motif
| Promoter | Log-likelihood | Transcript | Gene | Gene Info |
|---|---|---|---|---|
| chr19_-_3028356 | 0.18 |
ENST00000586422.5
|
TLE2
|
TLE family member 2, transcriptional corepressor |
| chr8_-_119673368 | 0.16 |
ENST00000427067.6
|
ENPP2
|
ectonucleotide pyrophosphatase/phosphodiesterase 2 |
| chr13_+_101452629 | 0.16 |
ENST00000622834.4
ENST00000545560.6 ENST00000376180.8 |
ITGBL1
|
integrin subunit beta like 1 |
| chr13_+_101452569 | 0.15 |
ENST00000618057.4
|
ITGBL1
|
integrin subunit beta like 1 |
| chr17_-_44968263 | 0.13 |
ENST00000253407.4
|
C1QL1
|
complement C1q like 1 |
| chr6_+_132570322 | 0.13 |
ENST00000275198.1
|
TAAR6
|
trace amine associated receptor 6 |
| chr9_-_16870702 | 0.13 |
ENST00000380667.6
ENST00000545497.5 ENST00000486514.5 |
BNC2
|
basonuclin 2 |
| chr17_-_41027198 | 0.12 |
ENST00000361883.6
|
KRTAP1-5
|
keratin associated protein 1-5 |
| chr19_-_58098203 | 0.10 |
ENST00000600845.1
ENST00000240727.10 ENST00000600897.5 ENST00000421612.6 ENST00000601063.1 ENST00000601144.6 |
ZSCAN18
|
zinc finger and SCAN domain containing 18 |
| chr2_+_169069537 | 0.10 |
ENST00000428522.5
ENST00000450153.1 ENST00000674881.1 ENST00000421653.5 |
DHRS9
|
dehydrogenase/reductase 9 |
| chr1_+_89524871 | 0.09 |
ENST00000639264.1
|
LRRC8B
|
leucine rich repeat containing 8 VRAC subunit B |
| chr1_+_89524819 | 0.09 |
ENST00000439853.6
ENST00000330947.7 ENST00000449440.5 ENST00000640258.1 |
LRRC8B
|
leucine rich repeat containing 8 VRAC subunit B |
| chr4_+_678189 | 0.09 |
ENST00000507804.1
|
MYL5
|
myosin light chain 5 |
| chr21_+_44646414 | 0.09 |
ENST00000334670.9
|
KRTAP10-11
|
keratin associated protein 10-11 |
| chr2_-_98936155 | 0.09 |
ENST00000428096.5
ENST00000397899.7 ENST00000420294.1 |
CRACDL
|
CRACD like |
| chr10_-_48493641 | 0.08 |
ENST00000417247.6
|
ARHGAP22
|
Rho GTPase activating protein 22 |
| chr6_-_87095059 | 0.07 |
ENST00000369582.6
ENST00000610310.3 ENST00000630630.2 ENST00000627148.3 ENST00000625577.1 |
CGA
|
glycoprotein hormones, alpha polypeptide |
| chr22_+_22375984 | 0.07 |
ENST00000390296.2
|
IGLV5-45
|
immunoglobulin lambda variable 5-45 |
| chr11_+_68010281 | 0.07 |
ENST00000615463.4
ENST00000342456.11 |
ALDH3B1
|
aldehyde dehydrogenase 3 family member B1 |
| chr22_-_30387078 | 0.06 |
ENST00000215798.10
|
RNF215
|
ring finger protein 215 |
| chr9_-_16870662 | 0.06 |
ENST00000380672.9
|
BNC2
|
basonuclin 2 |
| chr3_+_141386862 | 0.06 |
ENST00000513258.5
|
ZBTB38
|
zinc finger and BTB domain containing 38 |
| chr5_+_112976702 | 0.06 |
ENST00000515408.5
ENST00000513585.6 |
DCP2
|
decapping mRNA 2 |
| chr7_-_100896123 | 0.06 |
ENST00000428317.7
|
ACHE
|
acetylcholinesterase (Cartwright blood group) |
| chr6_-_35688907 | 0.06 |
ENST00000539068.5
ENST00000357266.9 |
FKBP5
|
FKBP prolyl isomerase 5 |
| chr17_-_41065879 | 0.05 |
ENST00000394015.3
|
KRTAP2-4
|
keratin associated protein 2-4 |
| chr16_+_30985181 | 0.05 |
ENST00000262520.10
ENST00000297679.10 ENST00000562932.5 ENST00000574447.1 |
HSD3B7
|
hydroxy-delta-5-steroid dehydrogenase, 3 beta- and steroid delta-isomerase 7 |
| chr16_+_55479188 | 0.05 |
ENST00000219070.9
|
MMP2
|
matrix metallopeptidase 2 |
| chr13_-_44474296 | 0.05 |
ENST00000611198.4
|
TSC22D1
|
TSC22 domain family member 1 |
| chr1_-_20119527 | 0.05 |
ENST00000375105.8
ENST00000617227.1 |
PLA2G2D
|
phospholipase A2 group IID |
| chr17_+_18377769 | 0.05 |
ENST00000399134.5
|
EVPLL
|
envoplakin like |
| chr5_+_112976757 | 0.05 |
ENST00000389063.3
|
DCP2
|
decapping mRNA 2 |
| chr17_+_41226648 | 0.05 |
ENST00000377721.3
|
KRTAP9-2
|
keratin associated protein 9-2 |
| chr9_-_124500986 | 0.05 |
ENST00000373587.3
|
NR5A1
|
nuclear receptor subfamily 5 group A member 1 |
| chr11_+_116830529 | 0.05 |
ENST00000630701.1
|
APOC3
|
apolipoprotein C3 |
| chr11_-_134253248 | 0.04 |
ENST00000392595.6
ENST00000352327.5 ENST00000341541.8 ENST00000392594.7 |
THYN1
|
thymocyte nuclear protein 1 |
| chrX_-_154805386 | 0.04 |
ENST00000393531.5
ENST00000369534.8 ENST00000453245.5 ENST00000428488.1 ENST00000369531.1 |
MPP1
|
membrane palmitoylated protein 1 |
| chr2_+_135741717 | 0.04 |
ENST00000415164.5
|
UBXN4
|
UBX domain protein 4 |
| chr20_+_56629296 | 0.04 |
ENST00000201031.3
|
TFAP2C
|
transcription factor AP-2 gamma |
| chr19_+_44905785 | 0.04 |
ENST00000446996.5
ENST00000252486.9 ENST00000434152.5 |
APOE
|
apolipoprotein E |
| chr20_-_44210697 | 0.04 |
ENST00000255174.3
|
OSER1
|
oxidative stress responsive serine rich 1 |
| chr1_+_16022004 | 0.04 |
ENST00000439316.6
|
CLCNKA
|
chloride voltage-gated channel Ka |
| chr17_-_41034871 | 0.04 |
ENST00000344363.7
|
KRTAP1-3
|
keratin associated protein 1-3 |
| chr2_+_79120474 | 0.04 |
ENST00000233735.2
|
REG1A
|
regenerating family member 1 alpha |
| chr22_+_43923755 | 0.04 |
ENST00000423180.2
ENST00000216180.8 |
PNPLA3
|
patatin like phospholipase domain containing 3 |
| chr1_+_18631513 | 0.04 |
ENST00000400661.3
|
PAX7
|
paired box 7 |
| chr5_-_141673160 | 0.04 |
ENST00000513878.5
|
ARAP3
|
ArfGAP with RhoGAP domain, ankyrin repeat and PH domain 3 |
| chr22_+_39014249 | 0.04 |
ENST00000361441.5
|
APOBEC3C
|
apolipoprotein B mRNA editing enzyme catalytic subunit 3C |
| chrX_-_154805516 | 0.04 |
ENST00000413259.7
|
MPP1
|
membrane palmitoylated protein 1 |
| chr15_-_40564980 | 0.04 |
ENST00000558750.5
ENST00000561011.5 ENST00000560305.5 ENST00000559911.5 ENST00000558113.5 ENST00000559103.1 ENST00000558918.1 ENST00000416810.7 ENST00000558871.1 ENST00000358005.7 ENST00000625629.2 |
CCDC32
|
coiled-coil domain containing 32 |
| chr1_+_18631006 | 0.04 |
ENST00000375375.7
|
PAX7
|
paired box 7 |
| chr5_+_157743703 | 0.04 |
ENST00000286307.6
|
LSM11
|
LSM11, U7 small nuclear RNA associated |
| chr6_-_168319762 | 0.04 |
ENST00000366795.4
|
DACT2
|
dishevelled binding antagonist of beta catenin 2 |
| chr6_-_168319691 | 0.03 |
ENST00000610183.1
ENST00000607983.1 |
DACT2
|
dishevelled binding antagonist of beta catenin 2 |
| chr12_+_4809176 | 0.03 |
ENST00000280684.3
|
KCNA6
|
potassium voltage-gated channel subfamily A member 6 |
| chr10_-_62268837 | 0.03 |
ENST00000373789.8
|
RTKN2
|
rhotekin 2 |
| chr21_+_43728851 | 0.03 |
ENST00000327574.4
|
PDXK
|
pyridoxal kinase |
| chr22_-_24226112 | 0.03 |
ENST00000425408.5
|
GGT5
|
gamma-glutamyltransferase 5 |
| chr11_+_68010339 | 0.03 |
ENST00000617288.4
|
ALDH3B1
|
aldehyde dehydrogenase 3 family member B1 |
| chr5_-_127073467 | 0.03 |
ENST00000607731.5
ENST00000509733.7 ENST00000296662.10 ENST00000535381.6 |
C5orf63
|
chromosome 5 open reading frame 63 |
| chr1_+_16043736 | 0.03 |
ENST00000619181.4
|
CLCNKB
|
chloride voltage-gated channel Kb |
| chr10_-_33335074 | 0.03 |
ENST00000432372.6
|
NRP1
|
neuropilin 1 |
| chr14_+_57268963 | 0.03 |
ENST00000261558.8
|
AP5M1
|
adaptor related protein complex 5 subunit mu 1 |
| chr15_+_41621134 | 0.03 |
ENST00000566718.6
|
MGA
|
MAX dimerization protein MGA |
| chr16_+_28846674 | 0.03 |
ENST00000322610.12
|
SH2B1
|
SH2B adaptor protein 1 |
| chr21_+_30396030 | 0.03 |
ENST00000355459.4
|
KRTAP13-1
|
keratin associated protein 13-1 |
| chr19_-_3063101 | 0.03 |
ENST00000221561.12
|
TLE5
|
TLE family member 5, transcriptional modulator |
| chr1_+_111449442 | 0.03 |
ENST00000369722.8
ENST00000483994.1 |
ATP5PB
|
ATP synthase peripheral stalk-membrane subunit b |
| chr19_-_3062772 | 0.03 |
ENST00000586742.5
|
TLE5
|
TLE family member 5, transcriptional modulator |
| chr1_+_61404076 | 0.03 |
ENST00000357977.5
|
NFIA
|
nuclear factor I A |
| chr7_-_100895878 | 0.03 |
ENST00000419336.6
ENST00000241069.11 ENST00000411582.4 ENST00000302913.8 |
ACHE
|
acetylcholinesterase (Cartwright blood group) |
| chr12_-_58920465 | 0.03 |
ENST00000320743.8
|
LRIG3
|
leucine rich repeats and immunoglobulin like domains 3 |
| chr1_+_65147514 | 0.03 |
ENST00000545314.5
|
AK4
|
adenylate kinase 4 |
| chr14_+_54567100 | 0.03 |
ENST00000554335.6
|
SAMD4A
|
sterile alpha motif domain containing 4A |
| chr1_-_211133945 | 0.03 |
ENST00000640044.1
ENST00000640566.1 |
KCNH1
|
potassium voltage-gated channel subfamily H member 1 |
| chr3_-_86991135 | 0.03 |
ENST00000398399.7
|
VGLL3
|
vestigial like family member 3 |
| chr11_+_62242232 | 0.03 |
ENST00000244926.4
|
SCGB1D2
|
secretoglobin family 1D member 2 |
| chr4_-_174829212 | 0.03 |
ENST00000340217.5
ENST00000274093.8 |
GLRA3
|
glycine receptor alpha 3 |
| chr19_-_3062464 | 0.02 |
ENST00000327141.9
|
TLE5
|
TLE family member 5, transcriptional modulator |
| chr10_+_113709261 | 0.02 |
ENST00000672138.1
ENST00000452490.3 |
CASP7
|
caspase 7 |
| chr19_+_13024917 | 0.02 |
ENST00000587260.1
|
NFIX
|
nuclear factor I X |
| chr19_+_41003946 | 0.02 |
ENST00000593831.1
|
CYP2B6
|
cytochrome P450 family 2 subfamily B member 6 |
| chr1_+_65147657 | 0.02 |
ENST00000546702.5
|
AK4
|
adenylate kinase 4 |
| chr1_+_16021871 | 0.02 |
ENST00000375692.5
|
CLCNKA
|
chloride voltage-gated channel Ka |
| chr1_+_16043776 | 0.02 |
ENST00000375679.9
|
CLCNKB
|
chloride voltage-gated channel Kb |
| chr3_-_71305986 | 0.02 |
ENST00000647614.1
|
FOXP1
|
forkhead box P1 |
| chr11_-_73598183 | 0.02 |
ENST00000064778.8
|
FAM168A
|
family with sequence similarity 168 member A |
| chr1_+_16022030 | 0.02 |
ENST00000331433.5
|
CLCNKA
|
chloride voltage-gated channel Ka |
| chr11_-_40294089 | 0.02 |
ENST00000278198.2
|
LRRC4C
|
leucine rich repeat containing 4C |
| chr11_-_73598067 | 0.02 |
ENST00000450446.6
ENST00000356467.5 |
FAM168A
|
family with sequence similarity 168 member A |
| chr4_+_88523810 | 0.02 |
ENST00000512194.2
ENST00000598772.1 ENST00000597259.2 |
ENSG00000287542.1
PIGY-DT
|
HECT and RLD domain containing E3 ubiquitin protein ligase 3 PIGY divergent transcript |
| chr4_-_40630588 | 0.02 |
ENST00000514014.1
|
RBM47
|
RNA binding motif protein 47 |
| chr13_-_28495079 | 0.02 |
ENST00000615840.4
ENST00000282397.9 ENST00000541932.5 ENST00000539099.1 ENST00000639477.1 |
FLT1
|
fms related receptor tyrosine kinase 1 |
| chr14_+_64504574 | 0.02 |
ENST00000358738.3
|
ZBTB1
|
zinc finger and BTB domain containing 1 |
| chr16_-_695946 | 0.02 |
ENST00000562563.1
|
FBXL16
|
F-box and leucine rich repeat protein 16 |
| chr2_+_88885397 | 0.02 |
ENST00000390243.2
|
IGKV4-1
|
immunoglobulin kappa variable 4-1 |
| chr2_+_230878139 | 0.02 |
ENST00000620962.1
|
ITM2C
|
integral membrane protein 2C |
| chr20_-_32743406 | 0.02 |
ENST00000474815.2
ENST00000446419.6 ENST00000278980.11 ENST00000642484.1 ENST00000646357.1 |
COMMD7
ENSG00000285382.1
|
COMM domain containing 7 novel protein |
| chr17_+_77453993 | 0.02 |
ENST00000592951.5
|
SEPTIN9
|
septin 9 |
| chr10_-_33334898 | 0.02 |
ENST00000395995.5
|
NRP1
|
neuropilin 1 |
| chr6_-_34248989 | 0.02 |
ENST00000481533.5
ENST00000468145.1 ENST00000476320.6 ENST00000394990.8 |
SMIM29
|
small integral membrane protein 29 |
| chr17_-_55732074 | 0.02 |
ENST00000575734.5
|
TMEM100
|
transmembrane protein 100 |
| chrX_-_47574738 | 0.02 |
ENST00000640721.1
|
SYN1
|
synapsin I |
| chr3_-_71306012 | 0.02 |
ENST00000649431.1
ENST00000610810.5 |
FOXP1
|
forkhead box P1 |
| chr1_+_2556361 | 0.02 |
ENST00000355716.5
|
TNFRSF14
|
TNF receptor superfamily member 14 |
| chr17_+_8339837 | 0.02 |
ENST00000328248.7
ENST00000584943.1 |
ODF4
|
outer dense fiber of sperm tails 4 |
| chr10_-_33334625 | 0.02 |
ENST00000374875.5
ENST00000374822.8 ENST00000374867.7 |
NRP1
|
neuropilin 1 |
| chr1_-_1779976 | 0.02 |
ENST00000378625.5
|
NADK
|
NAD kinase |
| chr17_+_62627628 | 0.02 |
ENST00000303375.10
|
MRC2
|
mannose receptor C type 2 |
| chr10_+_96043394 | 0.02 |
ENST00000403870.7
ENST00000265992.9 ENST00000465148.3 |
CCNJ
|
cyclin J |
| chr16_+_721596 | 0.02 |
ENST00000568916.1
|
ANTKMT
|
adenine nucleotide translocase lysine methyltransferase |
| chr17_+_45999250 | 0.02 |
ENST00000537309.1
|
STH
|
saitohin |
| chr7_+_107744134 | 0.02 |
ENST00000222597.6
ENST00000440859.8 ENST00000415884.6 |
CBLL1
|
Cbl proto-oncogene like 1 |
| chr12_-_25648544 | 0.02 |
ENST00000540106.5
ENST00000445693.5 ENST00000545543.1 |
LMNTD1
|
lamin tail domain containing 1 |
| chr7_-_103149182 | 0.02 |
ENST00000417955.5
ENST00000341533.8 ENST00000425379.1 |
NAPEPLD
|
N-acyl phosphatidylethanolamine phospholipase D |
| chr6_-_34249102 | 0.02 |
ENST00000636500.1
|
SMIM29
|
small integral membrane protein 29 |
| chr10_-_62268685 | 0.02 |
ENST00000395260.3
|
RTKN2
|
rhotekin 2 |
| chr21_+_44697427 | 0.01 |
ENST00000618832.1
|
KRTAP10-12
|
keratin associated protein 10-12 |
| chr21_+_44600597 | 0.01 |
ENST00000609664.2
|
KRTAP10-7
|
keratin associated protein 10-7 |
| chrX_+_13689171 | 0.01 |
ENST00000618931.2
|
RAB9A
|
RAB9A, member RAS oncogene family |
| chr22_-_23580223 | 0.01 |
ENST00000249053.3
ENST00000330377.3 ENST00000438703.1 |
IGLL1
|
immunoglobulin lambda like polypeptide 1 |
| chr4_+_24795560 | 0.01 |
ENST00000382120.4
|
SOD3
|
superoxide dismutase 3 |
| chr17_-_10036741 | 0.01 |
ENST00000585266.5
|
GAS7
|
growth arrest specific 7 |
| chr12_-_124567464 | 0.01 |
ENST00000458234.5
|
NCOR2
|
nuclear receptor corepressor 2 |
| chr15_+_80060113 | 0.01 |
ENST00000618205.4
|
ZFAND6
|
zinc finger AN1-type containing 6 |
| chr1_+_226223618 | 0.01 |
ENST00000542034.5
ENST00000366810.6 |
MIXL1
|
Mix paired-like homeobox |
| chrX_+_13689116 | 0.01 |
ENST00000464506.2
ENST00000243325.6 |
RAB9A
|
RAB9A, member RAS oncogene family |
| chr19_+_38390055 | 0.01 |
ENST00000587947.5
ENST00000338502.8 |
SPRED3
|
sprouty related EVH1 domain containing 3 |
| chr6_+_31572279 | 0.01 |
ENST00000418386.3
|
LTA
|
lymphotoxin alpha |
| chr4_-_108168950 | 0.01 |
ENST00000379951.6
|
LEF1
|
lymphoid enhancer binding factor 1 |
| chr15_+_80059568 | 0.01 |
ENST00000613266.4
ENST00000561060.5 |
ZFAND6
|
zinc finger AN1-type containing 6 |
| chr19_-_45639104 | 0.01 |
ENST00000586770.5
ENST00000591721.5 ENST00000245925.8 ENST00000590043.5 ENST00000589876.5 |
EML2
|
EMAP like 2 |
| chr1_-_211134135 | 0.01 |
ENST00000638983.1
ENST00000271751.10 ENST00000639952.1 |
ENSG00000284299.1
KCNH1
|
novel protein potassium voltage-gated channel subfamily H member 1 |
| chr1_+_161118083 | 0.01 |
ENST00000368009.7
ENST00000368007.8 ENST00000392190.9 ENST00000368008.5 |
NIT1
|
nitrilase 1 |
| chr4_-_108168919 | 0.01 |
ENST00000265165.6
|
LEF1
|
lymphoid enhancer binding factor 1 |
| chr17_+_30477362 | 0.01 |
ENST00000225724.9
ENST00000451249.7 ENST00000467337.6 ENST00000581721.5 ENST00000414833.2 |
GOSR1
|
golgi SNAP receptor complex member 1 |
| chr6_+_28141830 | 0.01 |
ENST00000330236.7
|
ZKSCAN8
|
zinc finger with KRAB and SCAN domains 8 |
| chr15_+_80059635 | 0.01 |
ENST00000559157.5
|
ZFAND6
|
zinc finger AN1-type containing 6 |
| chr1_+_23793649 | 0.01 |
ENST00000374501.1
|
LYPLA2
|
lysophospholipase 2 |
| chr17_-_58531941 | 0.01 |
ENST00000581607.1
ENST00000317256.10 ENST00000426861.5 ENST00000580809.5 ENST00000577729.5 ENST00000583291.1 |
SEPTIN4
|
septin 4 |
| chr17_-_41047267 | 0.01 |
ENST00000542137.1
ENST00000391419.3 |
KRTAP2-1
|
keratin associated protein 2-1 |
| chr14_+_38207893 | 0.01 |
ENST00000267377.3
|
SSTR1
|
somatostatin receptor 1 |
| chr6_+_31571957 | 0.01 |
ENST00000454783.5
|
LTA
|
lymphotoxin alpha |
| chr3_+_32817990 | 0.01 |
ENST00000383763.6
|
TRIM71
|
tripartite motif containing 71 |
| chr15_-_83067199 | 0.01 |
ENST00000261721.9
|
BTBD1
|
BTB domain containing 1 |
| chr7_-_150800533 | 0.01 |
ENST00000434545.5
|
TMEM176B
|
transmembrane protein 176B |
| chr7_-_103149056 | 0.01 |
ENST00000465647.6
ENST00000418294.1 |
NAPEPLD
|
N-acyl phosphatidylethanolamine phospholipase D |
| chr12_+_26938454 | 0.01 |
ENST00000229395.8
ENST00000544111.5 ENST00000546072.5 ENST00000327214.5 |
FGFR1OP2
|
FGFR1 oncogene partner 2 |
| chr15_+_81296913 | 0.01 |
ENST00000394652.6
|
IL16
|
interleukin 16 |
| chr21_-_44592505 | 0.01 |
ENST00000400368.1
|
KRTAP10-6
|
keratin associated protein 10-6 |
| chr4_-_88523740 | 0.01 |
ENST00000273968.5
ENST00000527353.2 |
PYURF
PIGY
|
PIGY upstream reading frame phosphatidylinositol glycan anchor biosynthesis class Y |
| chr1_-_89175997 | 0.01 |
ENST00000294671.3
ENST00000650452.1 |
GBP7
|
guanylate binding protein 7 |
| chr4_+_118685373 | 0.01 |
ENST00000388822.10
ENST00000508801.1 |
METTL14
|
methyltransferase like 14 |
| chr8_-_81842192 | 0.01 |
ENST00000353788.8
ENST00000520618.5 ENST00000518183.5 ENST00000396330.6 ENST00000519119.5 |
SNX16
|
sorting nexin 16 |
| chr6_-_168075831 | 0.01 |
ENST00000440994.6
|
FRMD1
|
FERM domain containing 1 |
| chr17_-_7043906 | 0.01 |
ENST00000308009.5
ENST00000447225.1 |
SLC16A11
|
solute carrier family 16 member 11 |
| chr7_-_108240049 | 0.01 |
ENST00000379022.8
|
NRCAM
|
neuronal cell adhesion molecule |
| chr16_-_11392065 | 0.01 |
ENST00000599216.5
|
ENSG00000188897.9
|
novel lipoprotein amino terminal region containing protein |
| chr17_-_7044091 | 0.01 |
ENST00000574600.3
ENST00000662352.3 ENST00000673828.2 |
SLC16A11
|
solute carrier family 16 member 11 |
| chr5_+_141135199 | 0.01 |
ENST00000231134.8
ENST00000623915.1 |
PCDHB5
|
protocadherin beta 5 |
| chr11_-_22625804 | 0.01 |
ENST00000327470.6
|
FANCF
|
FA complementation group F |
| chr14_-_57268810 | 0.01 |
ENST00000413566.6
ENST00000340918.11 ENST00000621441.5 |
EXOC5
|
exocyst complex component 5 |
| chr21_+_44697172 | 0.01 |
ENST00000400365.3
|
KRTAP10-12
|
keratin associated protein 10-12 |
| chr5_+_153491174 | 0.01 |
ENST00000521843.6
|
GRIA1
|
glutamate ionotropic receptor AMPA type subunit 1 |
| chr8_-_81841958 | 0.01 |
ENST00000519817.5
ENST00000521773.5 ENST00000523757.5 ENST00000345957.9 |
SNX16
|
sorting nexin 16 |
| chr17_-_64130813 | 0.01 |
ENST00000606895.2
|
ERN1
|
endoplasmic reticulum to nucleus signaling 1 |
| chr15_+_84980440 | 0.01 |
ENST00000310298.8
ENST00000557957.5 |
PDE8A
|
phosphodiesterase 8A |
| chr1_+_15438435 | 0.01 |
ENST00000375943.6
ENST00000375949.5 |
CTRC
|
chymotrypsin C |
| chrX_-_70931089 | 0.00 |
ENST00000374299.8
ENST00000298085.4 |
SLC7A3
|
solute carrier family 7 member 3 |
| chr6_-_35688935 | 0.00 |
ENST00000542713.1
|
FKBP5
|
FKBP prolyl isomerase 5 |
| chr10_-_73495966 | 0.00 |
ENST00000342558.3
ENST00000360663.10 ENST00000394828.6 ENST00000394829.6 |
PPP3CB
|
protein phosphatase 3 catalytic subunit beta |
| chr7_-_73842508 | 0.00 |
ENST00000297873.9
|
METTL27
|
methyltransferase like 27 |
| chr19_+_36604817 | 0.00 |
ENST00000423582.5
|
ZNF382
|
zinc finger protein 382 |
| chr4_+_6269831 | 0.00 |
ENST00000503569.5
ENST00000673991.1 ENST00000682275.1 ENST00000226760.5 |
WFS1
|
wolframin ER transmembrane glycoprotein |
| chr19_-_2740001 | 0.00 |
ENST00000545664.5
ENST00000269740.9 ENST00000589363.5 ENST00000455372.2 |
SLC39A3
|
solute carrier family 39 member 3 |
| chrY_+_5000226 | 0.00 |
ENST00000333703.8
ENST00000622698.4 ENST00000621505.1 |
PCDH11Y
|
protocadherin 11 Y-linked |
| chr3_+_52420955 | 0.00 |
ENST00000465863.1
|
PHF7
|
PHD finger protein 7 |
| chr11_-_2171805 | 0.00 |
ENST00000381178.5
ENST00000381175.5 ENST00000333684.9 ENST00000352909.8 |
TH
|
tyrosine hydroxylase |
| chr12_+_5432101 | 0.00 |
ENST00000423158.4
|
NTF3
|
neurotrophin 3 |
| chr3_+_49020443 | 0.00 |
ENST00000326912.8
|
NDUFAF3
|
NADH:ubiquinone oxidoreductase complex assembly factor 3 |
| chr12_-_54588636 | 0.00 |
ENST00000257905.13
|
PPP1R1A
|
protein phosphatase 1 regulatory inhibitor subunit 1A |
| chr17_-_69060906 | 0.00 |
ENST00000495634.5
ENST00000453985.6 ENST00000340001.9 ENST00000585714.1 |
ABCA9
|
ATP binding cassette subfamily A member 9 |
| chr11_+_15073562 | 0.00 |
ENST00000533448.1
ENST00000324229.11 |
CALCB
|
calcitonin related polypeptide beta |
| chr19_+_35449584 | 0.00 |
ENST00000246549.2
|
FFAR2
|
free fatty acid receptor 2 |
| chr22_+_29306582 | 0.00 |
ENST00000616432.4
ENST00000416823.1 ENST00000428622.1 |
GAS2L1
|
growth arrest specific 2 like 1 |
| chr11_-_62921339 | 0.00 |
ENST00000306960.4
|
CHRM1
|
cholinergic receptor muscarinic 1 |
| chr17_-_58544315 | 0.00 |
ENST00000671766.1
ENST00000672673.2 ENST00000321691.3 |
SEPTIN4
|
septin 4 |
| chr10_-_69416323 | 0.00 |
ENST00000619173.4
|
TACR2
|
tachykinin receptor 2 |
| chr20_+_33031648 | 0.00 |
ENST00000349552.1
|
BPIFB6
|
BPI fold containing family B member 6 |
| chr18_+_63702958 | 0.00 |
ENST00000544088.6
|
SERPINB11
|
serpin family B member 11 |
| chr14_+_35826298 | 0.00 |
ENST00000216807.12
|
BRMS1L
|
BRMS1 like transcriptional repressor |
| chr11_-_46121397 | 0.00 |
ENST00000676320.1
|
PHF21A
|
PHD finger protein 21A |
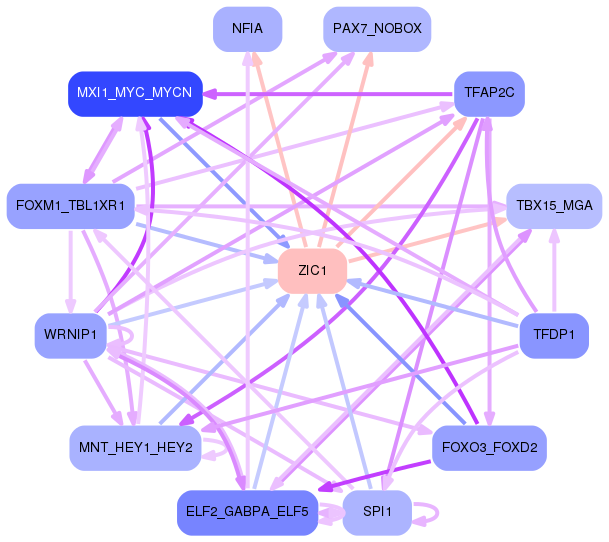
Network of associatons between targets according to the STRING database.

First level regulatory network of ZIC1
Gene Ontology Analysis
Gene overrepresentation in biological process category:
| Log-likelihood per target | Total log-likelihood | Term | Description |
|---|---|---|---|
| 0.0 | 0.1 | GO:0099558 | maintenance of synapse structure(GO:0099558) |
| 0.0 | 0.1 | GO:0032223 | negative regulation of synaptic transmission, cholinergic(GO:0032223) neurotransmitter receptor biosynthetic process(GO:0045212) |
| 0.0 | 0.1 | GO:0014813 | skeletal muscle satellite cell commitment(GO:0014813) |
| 0.0 | 0.1 | GO:0072061 | inner medullary collecting duct development(GO:0072061) negative regulation of nodal signaling pathway(GO:1900108) |
| 0.0 | 0.1 | GO:0021649 | vestibulocochlear nerve structural organization(GO:0021649) positive regulation of cytokine activity(GO:0060301) ganglion morphogenesis(GO:0061552) VEGF-activated neuropilin signaling pathway involved in axon guidance(GO:1902378) dorsal root ganglion morphogenesis(GO:1904835) otic placode development(GO:1905040) |
| 0.0 | 0.1 | GO:0032489 | regulation of Cdc42 protein signal transduction(GO:0032489) |
| 0.0 | 0.0 | GO:1905051 | regulation of base-excision repair(GO:1905051) positive regulation of base-excision repair(GO:1905053) |
| 0.0 | 0.0 | GO:0007538 | primary sex determination(GO:0007538) |
| 0.0 | 0.1 | GO:0042904 | 9-cis-retinoic acid biosynthetic process(GO:0042904) 9-cis-retinoic acid metabolic process(GO:0042905) |
| 0.0 | 0.2 | GO:0034638 | phosphatidylcholine catabolic process(GO:0034638) |
Gene overrepresentation in cellular component category:
| Log-likelihood per target | Total log-likelihood | Term | Description |
|---|---|---|---|
| 0.0 | 0.1 | GO:0044301 | climbing fiber(GO:0044301) |
| 0.0 | 0.1 | GO:0034363 | intermediate-density lipoprotein particle(GO:0034363) |
Gene overrepresentation in molecular function category:
| Log-likelihood per target | Total log-likelihood | Term | Description |
|---|---|---|---|
| 0.0 | 0.2 | GO:0047391 | alkylglycerophosphoethanolamine phosphodiesterase activity(GO:0047391) |
| 0.0 | 0.1 | GO:0003990 | acetylcholinesterase activity(GO:0003990) |
| 0.0 | 0.1 | GO:0001594 | trace-amine receptor activity(GO:0001594) |
| 0.0 | 0.1 | GO:0004534 | 5'-3' exoribonuclease activity(GO:0004534) |
| 0.0 | 0.2 | GO:0005225 | volume-sensitive anion channel activity(GO:0005225) |
| 0.0 | 0.0 | GO:0071209 | U7 snRNA binding(GO:0071209) |
| 0.0 | 0.1 | GO:0046899 | nucleoside triphosphate adenylate kinase activity(GO:0046899) |