Project
Epithelial-Mesenchymal Transition, human (Scheel, 2011)
Navigation
Downloads
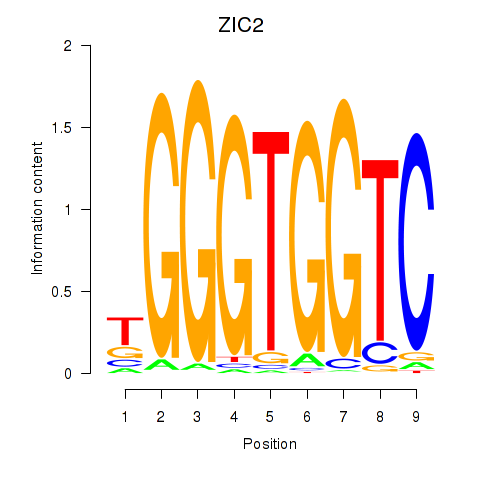
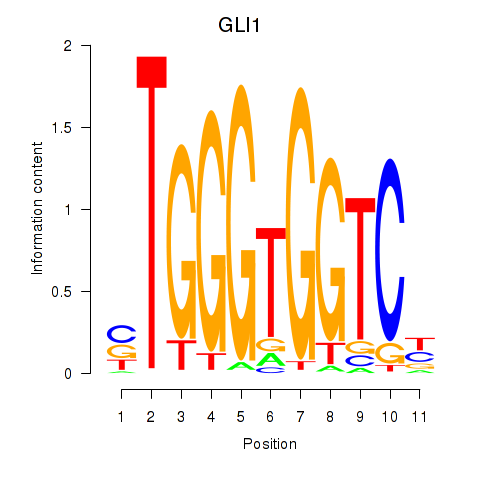
Results for ZIC2_GLI1
Z-value: 0.49
Motif logo
Transcription factors associated with ZIC2_GLI1
| Gene Symbol | Gene ID | Gene Info |
|---|---|---|
|
ZIC2
|
ENSG00000043355.12 | Zic family member 2 |
|
GLI1
|
ENSG00000111087.10 | GLI family zinc finger 1 |
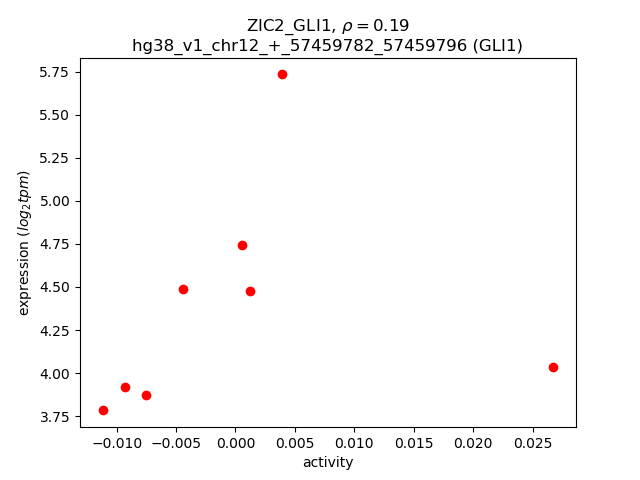
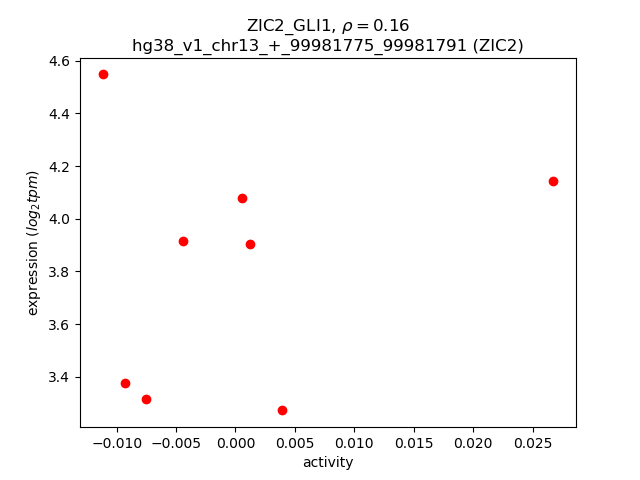
Activity-expression correlation:
| Gene | Promoter | Pearson corr. coef. | P-value | Plot |
|---|---|---|---|---|
| GLI1 | hg38_v1_chr12_+_57459782_57459796, hg38_v1_chr12_+_57460127_57460151 | 0.19 | 6.4e-01 | Click! |
| ZIC2 | hg38_v1_chr13_+_99981775_99981791 | 0.16 | 7.1e-01 | Click! |
Activity profile of ZIC2_GLI1 motif
Sorted Z-values of ZIC2_GLI1 motif
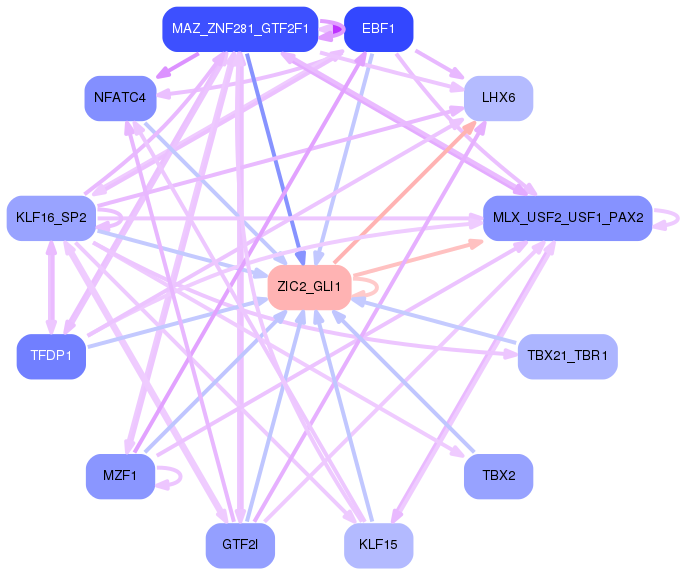
Network of associatons between targets according to the STRING database.

First level regulatory network of ZIC2_GLI1
Gene Ontology Analysis
Gene overrepresentation in biological process category:
| Log-likelihood per target | Total log-likelihood | Term | Description |
|---|---|---|---|
| 0.1 | 0.4 | GO:0010157 | response to chlorate(GO:0010157) |
| 0.1 | 1.3 | GO:0021842 | directional guidance of interneurons involved in migration from the subpallium to the cortex(GO:0021840) chemorepulsion involved in interneuron migration from the subpallium to the cortex(GO:0021842) |
| 0.1 | 0.5 | GO:0098582 | innate vocalization behavior(GO:0098582) positive regulation of histone H4-K16 acetylation(GO:2000620) |
| 0.1 | 0.2 | GO:0009436 | glyoxylate catabolic process(GO:0009436) |
| 0.1 | 0.2 | GO:2000283 | regulation of cellular amine catabolic process(GO:0033241) negative regulation of cellular amine catabolic process(GO:0033242) negative regulation of the force of heart contraction(GO:0098736) regulation of arginine catabolic process(GO:1900081) negative regulation of arginine catabolic process(GO:1900082) regulation of citrulline biosynthetic process(GO:1903248) negative regulation of citrulline biosynthetic process(GO:1903249) negative regulation of cellular amino acid biosynthetic process(GO:2000283) |
| 0.1 | 0.2 | GO:1903570 | regulation of protein kinase D signaling(GO:1903570) positive regulation of protein kinase D signaling(GO:1903572) |
| 0.0 | 0.1 | GO:0046967 | cytosol to ER transport(GO:0046967) |
| 0.0 | 0.2 | GO:0010760 | negative regulation of macrophage chemotaxis(GO:0010760) |
| 0.0 | 0.5 | GO:0021853 | cerebral cortex GABAergic interneuron migration(GO:0021853) interneuron migration(GO:1904936) |
| 0.0 | 0.1 | GO:0002581 | negative regulation of antigen processing and presentation of peptide or polysaccharide antigen via MHC class II(GO:0002581) |
| 0.0 | 0.2 | GO:0035603 | fibroblast growth factor receptor signaling pathway involved in negative regulation of apoptotic process in bone marrow(GO:0035602) fibroblast growth factor receptor signaling pathway involved in hemopoiesis(GO:0035603) fibroblast growth factor receptor signaling pathway involved in positive regulation of cell proliferation in bone marrow(GO:0035604) |
| 0.0 | 0.2 | GO:0000430 | regulation of transcription from RNA polymerase II promoter by glucose(GO:0000430) positive regulation of transcription from RNA polymerase II promoter by glucose(GO:0000432) late viral transcription(GO:0019086) |
| 0.0 | 0.6 | GO:0032926 | negative regulation of activin receptor signaling pathway(GO:0032926) |
| 0.0 | 0.2 | GO:2001268 | negative regulation of cysteine-type endopeptidase activity involved in apoptotic signaling pathway(GO:2001268) |
| 0.0 | 0.1 | GO:0060024 | rhythmic synaptic transmission(GO:0060024) |
| 0.0 | 0.1 | GO:0061073 | ciliary body morphogenesis(GO:0061073) |
| 0.0 | 0.7 | GO:0071420 | cellular response to histamine(GO:0071420) |
| 0.0 | 0.1 | GO:0018879 | biphenyl metabolic process(GO:0018879) |
| 0.0 | 0.4 | GO:0045162 | clustering of voltage-gated sodium channels(GO:0045162) |
| 0.0 | 0.6 | GO:0031581 | hemidesmosome assembly(GO:0031581) |
| 0.0 | 0.2 | GO:0010961 | cellular magnesium ion homeostasis(GO:0010961) |
| 0.0 | 0.0 | GO:1903973 | negative regulation of macrophage colony-stimulating factor signaling pathway(GO:1902227) negative regulation of response to macrophage colony-stimulating factor(GO:1903970) negative regulation of cellular response to macrophage colony-stimulating factor stimulus(GO:1903973) |
| 0.0 | 0.1 | GO:1903285 | negative regulation of dopamine uptake involved in synaptic transmission(GO:0051585) norepinephrine uptake(GO:0051620) regulation of norepinephrine uptake(GO:0051621) negative regulation of norepinephrine uptake(GO:0051622) negative regulation of catecholamine uptake involved in synaptic transmission(GO:0051945) regulation of glutathione peroxidase activity(GO:1903282) positive regulation of glutathione peroxidase activity(GO:1903284) positive regulation of hydrogen peroxide catabolic process(GO:1903285) positive regulation of peroxidase activity(GO:2000470) |
| 0.0 | 0.3 | GO:0048387 | negative regulation of retinoic acid receptor signaling pathway(GO:0048387) |
| 0.0 | 0.1 | GO:0002086 | diaphragm contraction(GO:0002086) |
| 0.0 | 0.2 | GO:0097116 | gephyrin clustering involved in postsynaptic density assembly(GO:0097116) |
| 0.0 | 0.0 | GO:0045041 | B cell cytokine production(GO:0002368) protein import into mitochondrial intermembrane space(GO:0045041) |
| 0.0 | 0.0 | GO:0072061 | inner medullary collecting duct development(GO:0072061) |
| 0.0 | 0.1 | GO:0050882 | voluntary musculoskeletal movement(GO:0050882) |
| 0.0 | 0.0 | GO:0019046 | release from viral latency(GO:0019046) |
| 0.0 | 0.1 | GO:0006663 | platelet activating factor biosynthetic process(GO:0006663) |
| 0.0 | 0.0 | GO:0060915 | fibroblast growth factor receptor signaling pathway involved in mammary gland specification(GO:0060595) mammary gland bud formation(GO:0060615) branch elongation involved in salivary gland morphogenesis(GO:0060667) mesenchymal cell differentiation involved in lung development(GO:0060915) |
| 0.0 | 0.1 | GO:0072014 | proximal tubule development(GO:0072014) |
| 0.0 | 0.0 | GO:0060032 | notochord regression(GO:0060032) |
| 0.0 | 0.1 | GO:2000348 | regulation of CD40 signaling pathway(GO:2000348) |
| 0.0 | 0.1 | GO:1903659 | regulation of complement-dependent cytotoxicity(GO:1903659) |
| 0.0 | 0.3 | GO:0009235 | cobalamin metabolic process(GO:0009235) |
| 0.0 | 0.0 | GO:0002296 | T-helper 1 cell lineage commitment(GO:0002296) |
Gene overrepresentation in cellular component category:
| Log-likelihood per target | Total log-likelihood | Term | Description |
|---|---|---|---|
| 0.1 | 0.4 | GO:0005610 | laminin-5 complex(GO:0005610) |
| 0.0 | 0.4 | GO:0044294 | dendritic growth cone(GO:0044294) |
| 0.0 | 0.2 | GO:0043256 | laminin complex(GO:0043256) |
| 0.0 | 0.2 | GO:0000839 | Hrd1p ubiquitin ligase ERAD-L complex(GO:0000839) |
| 0.0 | 0.2 | GO:0097129 | cyclin D2-CDK4 complex(GO:0097129) |
| 0.0 | 1.2 | GO:0030673 | axolemma(GO:0030673) |
| 0.0 | 0.1 | GO:0042825 | TAP complex(GO:0042825) |
| 0.0 | 0.2 | GO:0016589 | NURF complex(GO:0016589) |
| 0.0 | 0.7 | GO:1902711 | GABA-A receptor complex(GO:1902711) |
| 0.0 | 0.2 | GO:0005955 | calcineurin complex(GO:0005955) |
| 0.0 | 0.3 | GO:0042622 | photoreceptor outer segment membrane(GO:0042622) |
| 0.0 | 0.4 | GO:0043194 | axon initial segment(GO:0043194) |
| 0.0 | 0.1 | GO:0000798 | nuclear cohesin complex(GO:0000798) |
| 0.0 | 0.3 | GO:0016580 | Sin3 complex(GO:0016580) |
| 0.0 | 0.1 | GO:0072546 | ER membrane protein complex(GO:0072546) |
Gene overrepresentation in molecular function category:
| Log-likelihood per target | Total log-likelihood | Term | Description |
|---|---|---|---|
| 0.4 | 1.1 | GO:0005055 | laminin receptor activity(GO:0005055) |
| 0.1 | 1.3 | GO:0005176 | ErbB-2 class receptor binding(GO:0005176) |
| 0.1 | 0.3 | GO:0097108 | smoothened binding(GO:0005119) hedgehog family protein binding(GO:0097108) |
| 0.1 | 0.2 | GO:0036487 | nitric-oxide synthase inhibitor activity(GO:0036487) |
| 0.0 | 0.7 | GO:0008503 | benzodiazepine receptor activity(GO:0008503) |
| 0.0 | 0.2 | GO:0016833 | oxo-acid-lyase activity(GO:0016833) |
| 0.0 | 0.2 | GO:0043183 | vascular endothelial growth factor receptor 1 binding(GO:0043183) |
| 0.0 | 0.6 | GO:0048185 | activin binding(GO:0048185) |
| 0.0 | 0.4 | GO:0086080 | protein binding involved in heterotypic cell-cell adhesion(GO:0086080) |
| 0.0 | 0.3 | GO:0052650 | NADP-retinol dehydrogenase activity(GO:0052650) |
| 0.0 | 0.1 | GO:0035939 | microsatellite binding(GO:0035939) |
| 0.0 | 0.1 | GO:0060961 | phospholipase D inhibitor activity(GO:0060961) |
| 0.0 | 0.1 | GO:0005220 | inositol 1,4,5-trisphosphate-sensitive calcium-release channel activity(GO:0005220) |
| 0.0 | 0.1 | GO:0047025 | 3-oxoacyl-[acyl-carrier-protein] reductase (NADH) activity(GO:0047025) |
| 0.0 | 0.1 | GO:0046979 | peptide-transporting ATPase activity(GO:0015440) MHC class Ib protein binding(GO:0023029) TAP2 binding(GO:0046979) |
| 0.0 | 0.1 | GO:0008240 | tripeptidyl-peptidase activity(GO:0008240) |
| 0.0 | 0.3 | GO:0004653 | polypeptide N-acetylgalactosaminyltransferase activity(GO:0004653) |
| 0.0 | 0.2 | GO:0005007 | fibroblast growth factor-activated receptor activity(GO:0005007) |
| 0.0 | 0.1 | GO:0098770 | FBXO family protein binding(GO:0098770) |
| 0.0 | 0.1 | GO:0033188 | sphingomyelin synthase activity(GO:0033188) ceramide cholinephosphotransferase activity(GO:0047493) |
| 0.0 | 0.1 | GO:0047192 | 1-alkylglycerophosphocholine O-acetyltransferase activity(GO:0047192) |
| 0.0 | 0.3 | GO:0001222 | transcription corepressor binding(GO:0001222) |
| 0.0 | 0.0 | GO:0003839 | gamma-glutamylcyclotransferase activity(GO:0003839) |
| 0.0 | 0.0 | GO:0070905 | serine binding(GO:0070905) |
| 0.0 | 0.2 | GO:1904264 | ubiquitin protein ligase activity involved in ERAD pathway(GO:1904264) |
| 0.0 | 0.1 | GO:0016286 | small conductance calcium-activated potassium channel activity(GO:0016286) |
Gene overrepresentation in curated gene sets: canonical pathways category:
| Log-likelihood per target | Total log-likelihood | Term | Description |
|---|---|---|---|
| 0.0 | 0.6 | PID INTEGRIN4 PATHWAY | Alpha6 beta4 integrin-ligand interactions |
| 0.0 | 1.2 | PID ERBB NETWORK PATHWAY | ErbB receptor signaling network |
Gene overrepresentation in curated gene sets: REACTOME pathways category:
| Log-likelihood per target | Total log-likelihood | Term | Description |
|---|---|---|---|
| 0.0 | 1.3 | REACTOME DOWNREGULATION OF ERBB2 ERBB3 SIGNALING | Genes involved in Downregulation of ERBB2:ERBB3 signaling |
| 0.0 | 0.7 | REACTOME GABA A RECEPTOR ACTIVATION | Genes involved in GABA A receptor activation |
| 0.0 | 0.0 | REACTOME SIGNALING BY FGFR3 MUTANTS | Genes involved in Signaling by FGFR3 mutants |
| 0.0 | 0.1 | REACTOME REGULATION OF THE FANCONI ANEMIA PATHWAY | Genes involved in Regulation of the Fanconi anemia pathway |
| 0.0 | 0.5 | REACTOME DEGRADATION OF THE EXTRACELLULAR MATRIX | Genes involved in Degradation of the extracellular matrix |