Project
Epithelial-Mesenchymal Transition, human (Scheel, 2011)
Navigation
Downloads
Results for ZNF711_TFAP2A_TFAP2D
Z-value: 2.60
Motif logo
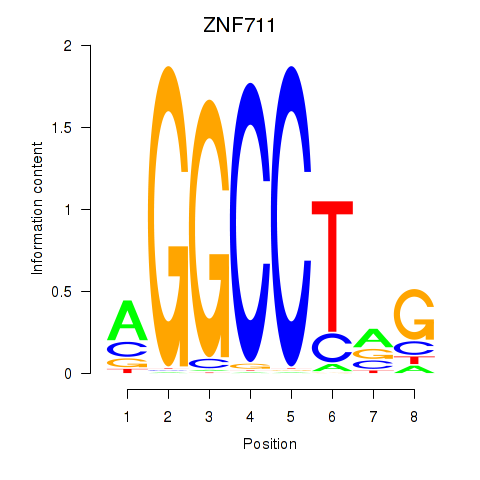
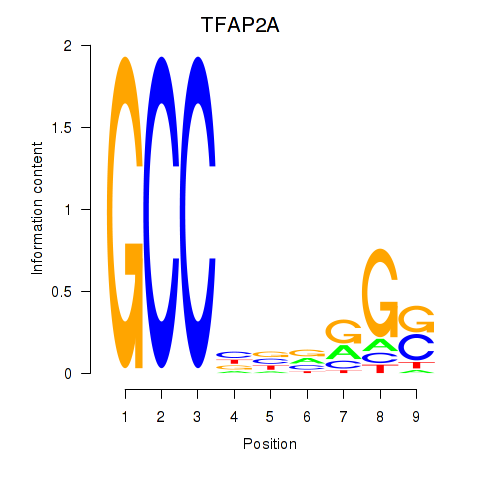
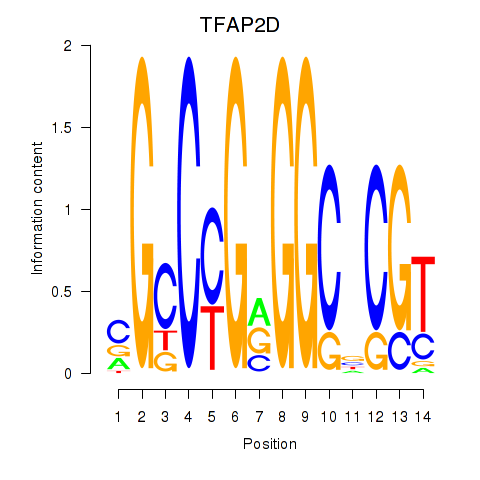
Transcription factors associated with ZNF711_TFAP2A_TFAP2D
| Gene Symbol | Gene ID | Gene Info |
|---|---|---|
|
ZNF711
|
ENSG00000147180.17 | zinc finger protein 711 |
|
TFAP2A
|
ENSG00000137203.15 | transcription factor AP-2 alpha |
|
TFAP2D
|
ENSG00000008197.5 | transcription factor AP-2 delta |
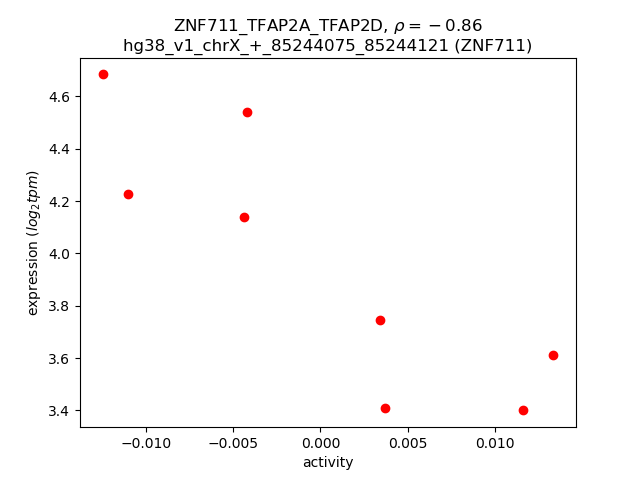
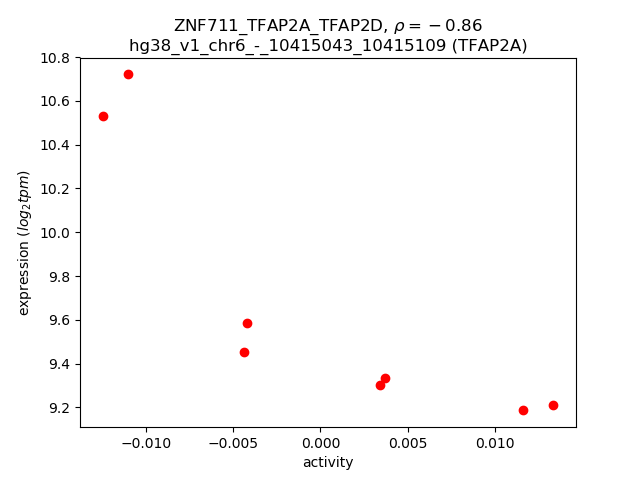
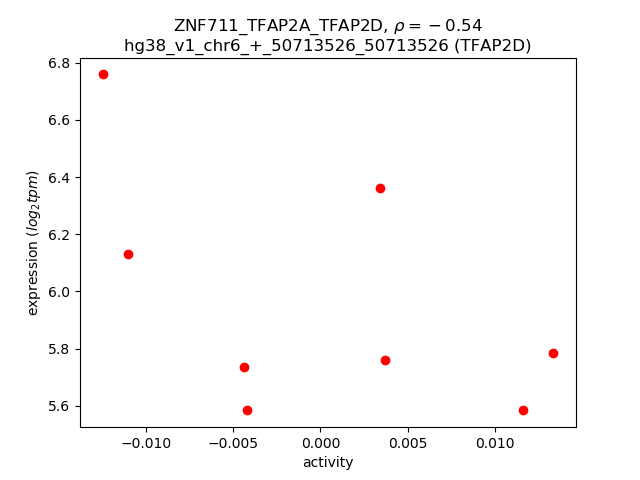
Activity-expression correlation:
| Gene | Promoter | Pearson corr. coef. | P-value | Plot |
|---|---|---|---|---|
| ZNF711 | hg38_v1_chrX_+_85244075_85244121 | -0.86 | 5.9e-03 | Click! |
| TFAP2A | hg38_v1_chr6_-_10415043_10415109, hg38_v1_chr6_-_10412367_10412400 | -0.86 | 6.5e-03 | Click! |
| TFAP2D | hg38_v1_chr6_+_50713526_50713526 | -0.54 | 1.7e-01 | Click! |
Activity profile of ZNF711_TFAP2A_TFAP2D motif
Sorted Z-values of ZNF711_TFAP2A_TFAP2D motif
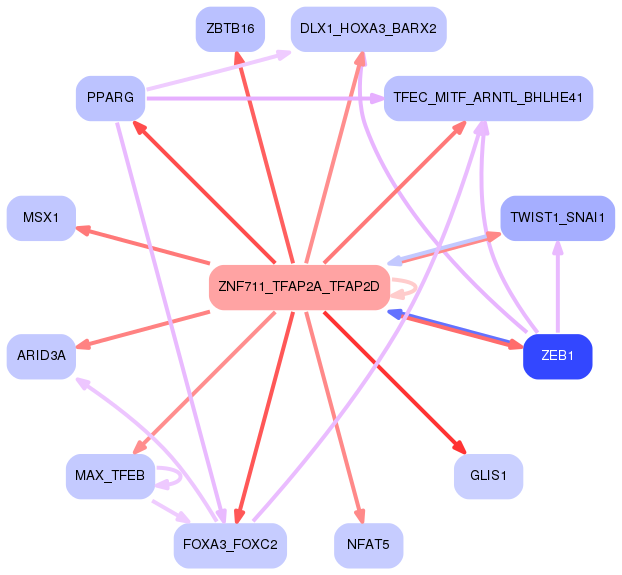
Network of associatons between targets according to the STRING database.

First level regulatory network of ZNF711_TFAP2A_TFAP2D
Gene Ontology Analysis
Gene overrepresentation in biological process category:
| Log-likelihood per target | Total log-likelihood | Term | Description |
|---|---|---|---|
| 2.9 | 8.7 | GO:1900155 | regulation of bone trabecula formation(GO:1900154) negative regulation of bone trabecula formation(GO:1900155) |
| 1.3 | 4.0 | GO:1903465 | vacuolar phosphate transport(GO:0007037) positive regulation of mitotic cell cycle DNA replication(GO:1903465) positive regulation of parathyroid hormone secretion(GO:2000830) |
| 1.3 | 3.8 | GO:0031550 | positive regulation of brain-derived neurotrophic factor receptor signaling pathway(GO:0031550) |
| 1.2 | 3.6 | GO:1903400 | L-arginine transmembrane transport(GO:1903400) |
| 1.1 | 3.2 | GO:0006542 | glutamine biosynthetic process(GO:0006542) |
| 1.1 | 6.3 | GO:0060988 | lipid tube assembly(GO:0060988) |
| 1.0 | 13.4 | GO:0034465 | response to carbon monoxide(GO:0034465) |
| 1.0 | 7.1 | GO:2000230 | negative regulation of pancreatic stellate cell proliferation(GO:2000230) |
| 1.0 | 1.0 | GO:1905154 | negative regulation of membrane invagination(GO:1905154) |
| 0.9 | 2.6 | GO:0002416 | IgG immunoglobulin transcytosis in epithelial cells mediated by FcRn immunoglobulin receptor(GO:0002416) |
| 0.8 | 4.2 | GO:1904566 | response to 1-oleoyl-sn-glycerol 3-phosphate(GO:1904565) cellular response to 1-oleoyl-sn-glycerol 3-phosphate(GO:1904566) |
| 0.8 | 2.4 | GO:0099552 | trans-synaptic signaling by lipid, modulating synaptic transmission(GO:0099552) trans-synaptic signaling by endocannabinoid, modulating synaptic transmission(GO:0099553) |
| 0.8 | 0.8 | GO:0071306 | cellular response to vitamin E(GO:0071306) |
| 0.8 | 3.8 | GO:0046167 | glycerol-3-phosphate biosynthetic process(GO:0046167) |
| 0.7 | 3.0 | GO:1904980 | positive regulation of endosome organization(GO:1904980) |
| 0.7 | 2.2 | GO:2000417 | negative regulation of eosinophil migration(GO:2000417) |
| 0.7 | 2.9 | GO:0033634 | positive regulation of cell-cell adhesion mediated by integrin(GO:0033634) |
| 0.7 | 8.2 | GO:0048251 | elastic fiber assembly(GO:0048251) |
| 0.7 | 2.7 | GO:0035407 | histone H3-T11 phosphorylation(GO:0035407) |
| 0.7 | 2.0 | GO:2000661 | positive regulation of interleukin-1-mediated signaling pathway(GO:2000661) |
| 0.7 | 2.0 | GO:0030505 | inorganic diphosphate transport(GO:0030505) |
| 0.7 | 4.0 | GO:0051138 | positive regulation of NK T cell differentiation(GO:0051138) |
| 0.7 | 3.3 | GO:0003065 | positive regulation of heart rate by epinephrine(GO:0003065) |
| 0.7 | 1.3 | GO:0060823 | canonical Wnt signaling pathway involved in neural plate anterior/posterior pattern formation(GO:0060823) |
| 0.6 | 2.4 | GO:1990166 | protein localization to site of double-strand break(GO:1990166) |
| 0.6 | 2.4 | GO:0002904 | positive regulation of B cell apoptotic process(GO:0002904) |
| 0.6 | 1.7 | GO:0006683 | galactosylceramide catabolic process(GO:0006683) |
| 0.6 | 0.6 | GO:0009217 | purine deoxyribonucleoside triphosphate catabolic process(GO:0009217) |
| 0.6 | 3.4 | GO:0032487 | regulation of Rap protein signal transduction(GO:0032487) |
| 0.6 | 3.3 | GO:0070086 | ubiquitin-dependent endocytosis(GO:0070086) |
| 0.5 | 4.4 | GO:0006203 | dGTP catabolic process(GO:0006203) |
| 0.5 | 1.6 | GO:1902724 | positive regulation of skeletal muscle satellite cell proliferation(GO:1902724) positive regulation of growth factor dependent skeletal muscle satellite cell proliferation(GO:1902728) |
| 0.5 | 4.1 | GO:0035583 | sequestering of TGFbeta in extracellular matrix(GO:0035583) |
| 0.5 | 1.5 | GO:0035470 | positive regulation of vascular wound healing(GO:0035470) |
| 0.5 | 12.3 | GO:0070208 | protein heterotrimerization(GO:0070208) |
| 0.5 | 3.6 | GO:0090210 | regulation of establishment of blood-brain barrier(GO:0090210) |
| 0.5 | 1.5 | GO:1901069 | guanosine-containing compound catabolic process(GO:1901069) |
| 0.5 | 2.0 | GO:1903182 | regulation of SUMO transferase activity(GO:1903182) positive regulation of SUMO transferase activity(GO:1903755) |
| 0.5 | 3.0 | GO:1904978 | regulation of endosome organization(GO:1904978) |
| 0.5 | 1.5 | GO:1904017 | cellular response to Thyroglobulin triiodothyronine(GO:1904017) |
| 0.5 | 4.3 | GO:0060355 | positive regulation of cell adhesion molecule production(GO:0060355) |
| 0.5 | 1.4 | GO:1903892 | negative regulation of ATF6-mediated unfolded protein response(GO:1903892) |
| 0.5 | 1.4 | GO:1901420 | negative regulation of response to alcohol(GO:1901420) |
| 0.5 | 1.4 | GO:2001025 | positive regulation of response to drug(GO:2001025) |
| 0.5 | 3.3 | GO:0045079 | negative regulation of chemokine biosynthetic process(GO:0045079) |
| 0.5 | 1.8 | GO:0097089 | methyl-branched fatty acid metabolic process(GO:0097089) |
| 0.4 | 1.3 | GO:0007225 | patched ligand maturation(GO:0007225) signal maturation(GO:0035638) |
| 0.4 | 1.3 | GO:0034414 | tRNA 3'-trailer cleavage, endonucleolytic(GO:0034414) tRNA 3'-trailer cleavage(GO:0042779) |
| 0.4 | 1.8 | GO:0009447 | putrescine catabolic process(GO:0009447) |
| 0.4 | 4.0 | GO:0089700 | protein kinase D signaling(GO:0089700) |
| 0.4 | 1.3 | GO:0050760 | negative regulation of thymidylate synthase biosynthetic process(GO:0050760) |
| 0.4 | 1.7 | GO:0051410 | detoxification of nitrogen compound(GO:0051410) cellular detoxification of nitrogen compound(GO:0070458) |
| 0.4 | 1.7 | GO:0046671 | negative regulation of cellular pH reduction(GO:0032848) CD8-positive, alpha-beta T cell lineage commitment(GO:0043375) negative regulation of retinal cell programmed cell death(GO:0046671) |
| 0.4 | 2.2 | GO:0009138 | pyrimidine nucleoside diphosphate metabolic process(GO:0009138) |
| 0.4 | 2.6 | GO:0006642 | triglyceride mobilization(GO:0006642) |
| 0.4 | 2.2 | GO:0045048 | protein insertion into ER membrane(GO:0045048) |
| 0.4 | 3.8 | GO:0045602 | negative regulation of endothelial cell differentiation(GO:0045602) |
| 0.4 | 1.3 | GO:0055011 | atrial cardiac muscle cell differentiation(GO:0055011) atrial cardiac muscle cell development(GO:0055014) |
| 0.4 | 1.3 | GO:0006500 | N-terminal protein palmitoylation(GO:0006500) |
| 0.4 | 2.5 | GO:0010734 | protein glutathionylation(GO:0010731) regulation of protein glutathionylation(GO:0010732) negative regulation of protein glutathionylation(GO:0010734) |
| 0.4 | 1.2 | GO:1990086 | lens fiber cell apoptotic process(GO:1990086) |
| 0.4 | 1.2 | GO:0031443 | fast-twitch skeletal muscle fiber contraction(GO:0031443) |
| 0.4 | 1.2 | GO:2001045 | negative regulation of integrin-mediated signaling pathway(GO:2001045) |
| 0.4 | 1.2 | GO:1902871 | regulation of transcription from RNA polymerase II promoter involved in forebrain neuron fate commitment(GO:0021882) cerebral cortex GABAergic interneuron fate commitment(GO:0021893) positive regulation of neural retina development(GO:0061075) positive regulation of retina development in camera-type eye(GO:1902868) regulation of amacrine cell differentiation(GO:1902869) positive regulation of amacrine cell differentiation(GO:1902871) |
| 0.4 | 3.5 | GO:0051388 | positive regulation of neurotrophin TRK receptor signaling pathway(GO:0051388) |
| 0.4 | 6.7 | GO:0006048 | UDP-N-acetylglucosamine biosynthetic process(GO:0006048) |
| 0.4 | 1.2 | GO:0034395 | regulation of transcription from RNA polymerase II promoter in response to iron(GO:0034395) |
| 0.4 | 1.1 | GO:0042412 | taurine biosynthetic process(GO:0042412) |
| 0.4 | 1.9 | GO:0009996 | negative regulation of cell fate specification(GO:0009996) |
| 0.4 | 1.1 | GO:0035674 | tricarboxylic acid transmembrane transport(GO:0035674) |
| 0.4 | 1.5 | GO:1904835 | vestibulocochlear nerve structural organization(GO:0021649) neuropilin signaling pathway(GO:0038189) VEGF-activated neuropilin signaling pathway(GO:0038190) positive regulation of cytokine activity(GO:0060301) ganglion morphogenesis(GO:0061552) positive regulation of retinal ganglion cell axon guidance(GO:1902336) VEGF-activated neuropilin signaling pathway involved in axon guidance(GO:1902378) dorsal root ganglion morphogenesis(GO:1904835) otic placode development(GO:1905040) |
| 0.4 | 1.1 | GO:0006117 | acetaldehyde metabolic process(GO:0006117) |
| 0.4 | 0.4 | GO:0090076 | relaxation of skeletal muscle(GO:0090076) |
| 0.4 | 1.5 | GO:0023021 | termination of signal transduction(GO:0023021) |
| 0.4 | 1.5 | GO:0016334 | morphogenesis of follicular epithelium(GO:0016333) establishment or maintenance of polarity of follicular epithelium(GO:0016334) establishment of planar polarity of follicular epithelium(GO:0042247) |
| 0.4 | 0.4 | GO:0010040 | response to iron(II) ion(GO:0010040) |
| 0.4 | 2.2 | GO:0001957 | intramembranous ossification(GO:0001957) direct ossification(GO:0036072) |
| 0.4 | 1.4 | GO:1903633 | regulation of calcium-dependent ATPase activity(GO:1903610) negative regulation of calcium-dependent ATPase activity(GO:1903611) regulation of dUTP diphosphatase activity(GO:1903627) positive regulation of dUTP diphosphatase activity(GO:1903629) negative regulation of aminoacyl-tRNA ligase activity(GO:1903631) regulation of leucine-tRNA ligase activity(GO:1903633) negative regulation of leucine-tRNA ligase activity(GO:1903634) |
| 0.4 | 1.1 | GO:0042357 | thiamine diphosphate metabolic process(GO:0042357) |
| 0.4 | 1.1 | GO:2000793 | cell proliferation involved in heart valve development(GO:2000793) |
| 0.4 | 2.1 | GO:0000720 | pyrimidine dimer repair by nucleotide-excision repair(GO:0000720) |
| 0.4 | 1.1 | GO:1905000 | regulation of membrane repolarization during atrial cardiac muscle cell action potential(GO:1905000) |
| 0.4 | 3.2 | GO:0070236 | negative regulation of activation-induced cell death of T cells(GO:0070236) |
| 0.3 | 1.4 | GO:0030047 | actin modification(GO:0030047) |
| 0.3 | 2.1 | GO:0060971 | embryonic heart tube left/right pattern formation(GO:0060971) |
| 0.3 | 1.4 | GO:0072137 | condensed mesenchymal cell proliferation(GO:0072137) |
| 0.3 | 2.7 | GO:0035879 | plasma membrane lactate transport(GO:0035879) |
| 0.3 | 1.0 | GO:0090222 | centrosome-templated microtubule nucleation(GO:0090222) |
| 0.3 | 0.7 | GO:1903225 | negative regulation of endodermal cell differentiation(GO:1903225) |
| 0.3 | 2.0 | GO:0010748 | regulation of plasma membrane long-chain fatty acid transport(GO:0010746) negative regulation of plasma membrane long-chain fatty acid transport(GO:0010748) plasma membrane long-chain fatty acid transport(GO:0015911) |
| 0.3 | 0.3 | GO:1902809 | skeletal muscle fiber differentiation(GO:0098528) regulation of skeletal muscle fiber differentiation(GO:1902809) |
| 0.3 | 0.3 | GO:1901620 | regulation of smoothened signaling pathway involved in dorsal/ventral neural tube patterning(GO:1901620) |
| 0.3 | 0.7 | GO:0060160 | negative regulation of dopamine receptor signaling pathway(GO:0060160) |
| 0.3 | 0.7 | GO:0010735 | positive regulation of transcription via serum response element binding(GO:0010735) |
| 0.3 | 1.0 | GO:0031445 | regulation of heterochromatin assembly(GO:0031445) positive regulation of heterochromatin assembly(GO:0031453) |
| 0.3 | 0.3 | GO:1902990 | mitotic telomere maintenance via semi-conservative replication(GO:1902990) |
| 0.3 | 2.6 | GO:0046726 | positive regulation by virus of viral protein levels in host cell(GO:0046726) |
| 0.3 | 1.0 | GO:0000103 | sulfate assimilation(GO:0000103) |
| 0.3 | 1.3 | GO:0006740 | NADPH regeneration(GO:0006740) |
| 0.3 | 3.9 | GO:0030091 | protein repair(GO:0030091) |
| 0.3 | 1.0 | GO:0036333 | hepatocyte homeostasis(GO:0036333) response to tetrachloromethane(GO:1904772) |
| 0.3 | 0.6 | GO:0060434 | bronchus morphogenesis(GO:0060434) |
| 0.3 | 1.0 | GO:0001544 | initiation of primordial ovarian follicle growth(GO:0001544) |
| 0.3 | 1.0 | GO:0070904 | L-ascorbic acid transport(GO:0015882) transepithelial L-ascorbic acid transport(GO:0070904) |
| 0.3 | 1.0 | GO:0061304 | retinal blood vessel morphogenesis(GO:0061304) |
| 0.3 | 7.0 | GO:0036109 | alpha-linolenic acid metabolic process(GO:0036109) |
| 0.3 | 1.0 | GO:0035026 | leading edge cell differentiation(GO:0035026) |
| 0.3 | 1.3 | GO:0090427 | activation of meiosis(GO:0090427) |
| 0.3 | 0.3 | GO:1903579 | negative regulation of nucleoside metabolic process(GO:0045978) negative regulation of cellular respiration(GO:1901856) negative regulation of mitochondrial electron transport, NADH to ubiquinone(GO:1902957) negative regulation of ATP metabolic process(GO:1903579) |
| 0.3 | 1.6 | GO:0034334 | adherens junction maintenance(GO:0034334) |
| 0.3 | 3.1 | GO:0046898 | response to cycloheximide(GO:0046898) |
| 0.3 | 4.1 | GO:0010891 | negative regulation of sequestering of triglyceride(GO:0010891) |
| 0.3 | 1.3 | GO:2000546 | positive regulation of cell chemotaxis to fibroblast growth factor(GO:1904849) positive regulation of endothelial cell chemotaxis to fibroblast growth factor(GO:2000546) |
| 0.3 | 1.9 | GO:0046092 | deoxycytidine metabolic process(GO:0046092) |
| 0.3 | 3.1 | GO:0071492 | cellular response to UV-A(GO:0071492) |
| 0.3 | 0.3 | GO:0040020 | regulation of meiotic nuclear division(GO:0040020) |
| 0.3 | 0.9 | GO:0032304 | negative regulation of icosanoid secretion(GO:0032304) |
| 0.3 | 0.9 | GO:0045062 | extrathymic T cell selection(GO:0045062) |
| 0.3 | 1.5 | GO:1902998 | macrophage proliferation(GO:0061517) microglial cell proliferation(GO:0061518) regulation of neuronal signal transduction(GO:1902847) positive regulation of neurofibrillary tangle assembly(GO:1902998) |
| 0.3 | 2.1 | GO:0018317 | protein C-linked glycosylation(GO:0018103) peptidyl-tryptophan modification(GO:0018211) protein C-linked glycosylation via tryptophan(GO:0018317) protein C-linked glycosylation via 2'-alpha-mannosyl-L-tryptophan(GO:0018406) |
| 0.3 | 2.7 | GO:1902897 | regulation of postsynaptic density protein 95 clustering(GO:1902897) |
| 0.3 | 0.9 | GO:0035359 | negative regulation of peroxisome proliferator activated receptor signaling pathway(GO:0035359) |
| 0.3 | 0.9 | GO:1901492 | positive regulation of lymphangiogenesis(GO:1901492) |
| 0.3 | 1.8 | GO:0003383 | apical constriction(GO:0003383) |
| 0.3 | 0.9 | GO:0071529 | cementum mineralization(GO:0071529) |
| 0.3 | 0.6 | GO:0018916 | nitrobenzene metabolic process(GO:0018916) |
| 0.3 | 0.9 | GO:0007057 | spindle assembly involved in female meiosis I(GO:0007057) |
| 0.3 | 1.5 | GO:0019087 | transformation of host cell by virus(GO:0019087) |
| 0.3 | 1.2 | GO:0034238 | macrophage fusion(GO:0034238) regulation of macrophage fusion(GO:0034239) positive regulation of macrophage fusion(GO:0034241) |
| 0.3 | 1.5 | GO:0006850 | mitochondrial pyruvate transport(GO:0006850) mitochondrial pyruvate transmembrane transport(GO:1902361) |
| 0.3 | 0.6 | GO:0010752 | regulation of cGMP-mediated signaling(GO:0010752) |
| 0.3 | 0.9 | GO:0032289 | central nervous system myelin formation(GO:0032289) |
| 0.3 | 1.7 | GO:0021564 | vagus nerve development(GO:0021564) |
| 0.3 | 0.9 | GO:0006113 | fermentation(GO:0006113) regulation of fermentation(GO:0043465) |
| 0.3 | 1.1 | GO:0032290 | peripheral nervous system myelin formation(GO:0032290) |
| 0.3 | 0.9 | GO:0032877 | positive regulation of DNA endoreduplication(GO:0032877) |
| 0.3 | 0.9 | GO:2001153 | regulation of renal water transport(GO:2001151) positive regulation of renal water transport(GO:2001153) |
| 0.3 | 1.4 | GO:1903906 | plasma membrane raft distribution(GO:0044855) plasma membrane raft localization(GO:0044856) plasma membrane raft polarization(GO:0044858) regulation of plasma membrane raft polarization(GO:1903906) |
| 0.3 | 1.4 | GO:2000312 | regulation of kainate selective glutamate receptor activity(GO:2000312) |
| 0.3 | 1.1 | GO:0035426 | extracellular matrix-cell signaling(GO:0035426) |
| 0.3 | 0.3 | GO:1902954 | regulation of early endosome to recycling endosome transport(GO:1902954) |
| 0.3 | 0.6 | GO:0046110 | xanthine metabolic process(GO:0046110) |
| 0.3 | 0.6 | GO:0071335 | submandibular salivary gland formation(GO:0060661) hair follicle cell proliferation(GO:0071335) regulation of hair follicle cell proliferation(GO:0071336) positive regulation of hair follicle cell proliferation(GO:0071338) |
| 0.3 | 1.4 | GO:0051643 | endoplasmic reticulum localization(GO:0051643) |
| 0.3 | 1.1 | GO:0007181 | transforming growth factor beta receptor complex assembly(GO:0007181) |
| 0.3 | 1.4 | GO:0010814 | substance P catabolic process(GO:0010814) calcitonin catabolic process(GO:0010816) endothelin maturation(GO:0034959) |
| 0.3 | 0.8 | GO:1901301 | regulation of cargo loading into COPII-coated vesicle(GO:1901301) |
| 0.3 | 1.4 | GO:0051387 | negative regulation of neurotrophin TRK receptor signaling pathway(GO:0051387) |
| 0.3 | 2.8 | GO:2001028 | positive regulation of endothelial cell chemotaxis(GO:2001028) |
| 0.3 | 1.7 | GO:2001184 | positive regulation of interleukin-12 secretion(GO:2001184) |
| 0.3 | 0.8 | GO:0071931 | positive regulation of transcription involved in G1/S transition of mitotic cell cycle(GO:0071931) |
| 0.3 | 1.9 | GO:0070164 | negative regulation of adiponectin secretion(GO:0070164) |
| 0.3 | 1.4 | GO:0038089 | positive regulation of cell migration by vascular endothelial growth factor signaling pathway(GO:0038089) |
| 0.3 | 1.6 | GO:0006003 | fructose 2,6-bisphosphate metabolic process(GO:0006003) |
| 0.3 | 1.6 | GO:0033567 | DNA replication, Okazaki fragment processing(GO:0033567) |
| 0.3 | 1.3 | GO:0070358 | actin polymerization-dependent cell motility(GO:0070358) |
| 0.3 | 1.9 | GO:0031860 | telomeric 3' overhang formation(GO:0031860) |
| 0.3 | 0.3 | GO:0046514 | ceramide catabolic process(GO:0046514) |
| 0.3 | 1.6 | GO:0010757 | negative regulation of plasminogen activation(GO:0010757) |
| 0.3 | 0.3 | GO:0035720 | intraciliary anterograde transport(GO:0035720) |
| 0.3 | 1.3 | GO:0001971 | negative regulation of activation of membrane attack complex(GO:0001971) |
| 0.3 | 1.3 | GO:0044111 | development involved in symbiotic interaction(GO:0044111) |
| 0.3 | 0.8 | GO:0019287 | isopentenyl diphosphate biosynthetic process, mevalonate pathway(GO:0019287) |
| 0.3 | 1.3 | GO:0051892 | negative regulation of cardioblast differentiation(GO:0051892) regulation of cardiac muscle cell myoblast differentiation(GO:2000690) negative regulation of cardiac muscle cell myoblast differentiation(GO:2000691) |
| 0.3 | 1.3 | GO:0061762 | CAMKK-AMPK signaling cascade(GO:0061762) |
| 0.3 | 0.8 | GO:1900377 | negative regulation of melanin biosynthetic process(GO:0048022) negative regulation of secondary metabolite biosynthetic process(GO:1900377) |
| 0.3 | 0.3 | GO:1903939 | regulation of TORC2 signaling(GO:1903939) |
| 0.3 | 1.3 | GO:2001271 | negative regulation of cysteine-type endopeptidase activity involved in execution phase of apoptosis(GO:2001271) |
| 0.3 | 0.8 | GO:0070843 | misfolded protein transport(GO:0070843) polyubiquitinated protein transport(GO:0070844) polyubiquitinated misfolded protein transport(GO:0070845) Hsp90 deacetylation(GO:0070846) |
| 0.3 | 3.5 | GO:0030949 | positive regulation of vascular endothelial growth factor receptor signaling pathway(GO:0030949) |
| 0.3 | 2.0 | GO:0097052 | L-kynurenine metabolic process(GO:0097052) |
| 0.2 | 1.5 | GO:0006269 | DNA replication, synthesis of RNA primer(GO:0006269) |
| 0.2 | 1.0 | GO:0090598 | male genitalia morphogenesis(GO:0048808) male anatomical structure morphogenesis(GO:0090598) |
| 0.2 | 0.5 | GO:0002537 | nitric oxide production involved in inflammatory response(GO:0002537) |
| 0.2 | 1.0 | GO:0060741 | prostate gland stromal morphogenesis(GO:0060741) |
| 0.2 | 0.2 | GO:0006097 | glyoxylate cycle(GO:0006097) |
| 0.2 | 1.0 | GO:0051490 | negative regulation of filopodium assembly(GO:0051490) |
| 0.2 | 1.5 | GO:0033615 | mitochondrial proton-transporting ATP synthase complex assembly(GO:0033615) |
| 0.2 | 1.0 | GO:0003290 | septum secundum development(GO:0003285) atrial septum secundum morphogenesis(GO:0003290) |
| 0.2 | 0.7 | GO:0030327 | prenylated protein catabolic process(GO:0030327) |
| 0.2 | 2.7 | GO:0010739 | positive regulation of protein kinase A signaling(GO:0010739) |
| 0.2 | 1.2 | GO:0016095 | polyprenol catabolic process(GO:0016095) |
| 0.2 | 1.4 | GO:0044339 | canonical Wnt signaling pathway involved in osteoblast differentiation(GO:0044339) |
| 0.2 | 1.0 | GO:0006049 | UDP-N-acetylglucosamine catabolic process(GO:0006049) |
| 0.2 | 2.9 | GO:1902358 | sulfate transmembrane transport(GO:1902358) |
| 0.2 | 0.7 | GO:0060352 | cell adhesion molecule production(GO:0060352) |
| 0.2 | 1.0 | GO:0006272 | leading strand elongation(GO:0006272) |
| 0.2 | 1.0 | GO:1903173 | phytol metabolic process(GO:0033306) fatty alcohol metabolic process(GO:1903173) |
| 0.2 | 1.0 | GO:0032474 | otolith morphogenesis(GO:0032474) |
| 0.2 | 3.3 | GO:0035826 | rubidium ion transport(GO:0035826) regulation of rubidium ion transport(GO:2000680) |
| 0.2 | 0.7 | GO:0035405 | histone-threonine phosphorylation(GO:0035405) |
| 0.2 | 0.7 | GO:0038193 | thromboxane A2 signaling pathway(GO:0038193) |
| 0.2 | 1.4 | GO:0007079 | mitotic chromosome movement towards spindle pole(GO:0007079) |
| 0.2 | 1.9 | GO:0006013 | mannose metabolic process(GO:0006013) |
| 0.2 | 4.2 | GO:0034498 | early endosome to Golgi transport(GO:0034498) |
| 0.2 | 1.4 | GO:0048861 | leukemia inhibitory factor signaling pathway(GO:0048861) |
| 0.2 | 0.9 | GO:1904694 | negative regulation of vascular smooth muscle contraction(GO:1904694) |
| 0.2 | 0.7 | GO:0050992 | dimethylallyl diphosphate biosynthetic process(GO:0050992) dimethylallyl diphosphate metabolic process(GO:0050993) |
| 0.2 | 0.9 | GO:1900737 | regulation of proteinase activated receptor activity(GO:1900276) negative regulation of phospholipase C-activating G-protein coupled receptor signaling pathway(GO:1900737) |
| 0.2 | 0.7 | GO:0002540 | arachidonic acid metabolite production involved in inflammatory response(GO:0002538) leukotriene production involved in inflammatory response(GO:0002540) |
| 0.2 | 1.2 | GO:1902766 | skeletal muscle satellite cell migration(GO:1902766) |
| 0.2 | 0.5 | GO:1904378 | maintenance of unfolded protein(GO:0036506) maintenance of unfolded protein involved in ERAD pathway(GO:1904378) |
| 0.2 | 0.9 | GO:0034141 | positive regulation of toll-like receptor 3 signaling pathway(GO:0034141) |
| 0.2 | 0.5 | GO:0006335 | DNA replication-dependent nucleosome assembly(GO:0006335) DNA replication-dependent nucleosome organization(GO:0034723) |
| 0.2 | 0.7 | GO:1903976 | negative regulation of glial cell migration(GO:1903976) |
| 0.2 | 1.4 | GO:0001992 | regulation of systemic arterial blood pressure by vasopressin(GO:0001992) |
| 0.2 | 1.4 | GO:0038028 | insulin receptor signaling pathway via phosphatidylinositol 3-kinase(GO:0038028) |
| 0.2 | 1.4 | GO:0046086 | adenosine biosynthetic process(GO:0046086) |
| 0.2 | 2.3 | GO:0033578 | protein glycosylation in Golgi(GO:0033578) |
| 0.2 | 1.1 | GO:0086100 | endothelin receptor signaling pathway(GO:0086100) |
| 0.2 | 1.3 | GO:0051012 | microtubule sliding(GO:0051012) |
| 0.2 | 1.1 | GO:0023016 | signal transduction by trans-phosphorylation(GO:0023016) |
| 0.2 | 1.1 | GO:0032000 | positive regulation of fatty acid beta-oxidation(GO:0032000) |
| 0.2 | 0.2 | GO:0008356 | asymmetric cell division(GO:0008356) |
| 0.2 | 0.2 | GO:0061441 | renal artery morphogenesis(GO:0061441) |
| 0.2 | 1.8 | GO:0070091 | glucagon secretion(GO:0070091) regulation of glucagon secretion(GO:0070092) |
| 0.2 | 0.7 | GO:1904616 | regulation of actin filament binding(GO:1904529) regulation of actin binding(GO:1904616) |
| 0.2 | 0.9 | GO:0010430 | fatty acid omega-oxidation(GO:0010430) |
| 0.2 | 0.9 | GO:0036216 | response to stem cell factor(GO:0036215) cellular response to stem cell factor stimulus(GO:0036216) Kit signaling pathway(GO:0038109) |
| 0.2 | 2.8 | GO:0015939 | pantothenate metabolic process(GO:0015939) |
| 0.2 | 0.4 | GO:1900020 | regulation of protein kinase C activity(GO:1900019) positive regulation of protein kinase C activity(GO:1900020) |
| 0.2 | 0.4 | GO:0090135 | actin filament branching(GO:0090135) |
| 0.2 | 0.6 | GO:0060032 | notochord regression(GO:0060032) |
| 0.2 | 0.6 | GO:1901052 | sarcosine metabolic process(GO:1901052) sarcosine catabolic process(GO:1901053) |
| 0.2 | 0.9 | GO:0018032 | protein amidation(GO:0018032) |
| 0.2 | 1.1 | GO:1990262 | regulation of anti-Mullerian hormone signaling pathway(GO:1902612) negative regulation of anti-Mullerian hormone signaling pathway(GO:1902613) anti-Mullerian hormone signaling pathway(GO:1990262) |
| 0.2 | 1.1 | GO:0033058 | directional locomotion(GO:0033058) |
| 0.2 | 0.2 | GO:0046984 | regulation of hemoglobin biosynthetic process(GO:0046984) |
| 0.2 | 1.5 | GO:0045629 | negative regulation of T-helper 2 cell differentiation(GO:0045629) |
| 0.2 | 1.3 | GO:0006065 | UDP-glucuronate biosynthetic process(GO:0006065) |
| 0.2 | 1.7 | GO:0071798 | response to prostaglandin D(GO:0071798) cellular response to prostaglandin D stimulus(GO:0071799) |
| 0.2 | 1.5 | GO:0070537 | histone H2A K63-linked deubiquitination(GO:0070537) |
| 0.2 | 0.6 | GO:0006059 | hexitol metabolic process(GO:0006059) |
| 0.2 | 0.8 | GO:2001247 | positive regulation of phosphatidylcholine biosynthetic process(GO:2001247) |
| 0.2 | 0.4 | GO:0097676 | histone H3-K36 dimethylation(GO:0097676) |
| 0.2 | 0.6 | GO:0090234 | regulation of kinetochore assembly(GO:0090234) |
| 0.2 | 1.3 | GO:1900041 | negative regulation of interleukin-2 secretion(GO:1900041) |
| 0.2 | 0.6 | GO:0061551 | trigeminal ganglion development(GO:0061551) |
| 0.2 | 1.2 | GO:0071874 | cellular response to norepinephrine stimulus(GO:0071874) |
| 0.2 | 0.8 | GO:0032242 | regulation of nucleoside transport(GO:0032242) |
| 0.2 | 0.2 | GO:0090149 | mitochondrial membrane fission(GO:0090149) |
| 0.2 | 0.6 | GO:0042939 | glutathione transport(GO:0034635) tripeptide transport(GO:0042939) |
| 0.2 | 0.8 | GO:0018283 | metal incorporation into metallo-sulfur cluster(GO:0018282) iron incorporation into metallo-sulfur cluster(GO:0018283) |
| 0.2 | 0.6 | GO:0035509 | negative regulation of myosin-light-chain-phosphatase activity(GO:0035509) negative regulation of bicellular tight junction assembly(GO:1903347) |
| 0.2 | 1.4 | GO:0070672 | response to interleukin-15(GO:0070672) |
| 0.2 | 0.6 | GO:0033364 | mast cell secretory granule organization(GO:0033364) |
| 0.2 | 0.8 | GO:0098937 | dendritic transport(GO:0098935) anterograde dendritic transport(GO:0098937) |
| 0.2 | 0.6 | GO:0035494 | SNARE complex disassembly(GO:0035494) |
| 0.2 | 3.0 | GO:1905097 | regulation of guanyl-nucleotide exchange factor activity(GO:1905097) |
| 0.2 | 0.4 | GO:0021555 | midbrain-hindbrain boundary morphogenesis(GO:0021555) |
| 0.2 | 1.2 | GO:0002371 | dendritic cell cytokine production(GO:0002371) |
| 0.2 | 1.0 | GO:0071104 | response to interleukin-9(GO:0071104) |
| 0.2 | 0.4 | GO:0009631 | cold acclimation(GO:0009631) |
| 0.2 | 0.4 | GO:0072248 | metanephric glomerular epithelium development(GO:0072244) metanephric glomerular visceral epithelial cell differentiation(GO:0072248) metanephric glomerular visceral epithelial cell development(GO:0072249) metanephric glomerular epithelial cell differentiation(GO:0072312) metanephric glomerular epithelial cell development(GO:0072313) |
| 0.2 | 0.8 | GO:1903296 | regulation of glutamate secretion, neurotransmission(GO:1903294) positive regulation of glutamate secretion, neurotransmission(GO:1903296) |
| 0.2 | 2.0 | GO:0000414 | regulation of histone H3-K36 methylation(GO:0000414) |
| 0.2 | 1.6 | GO:1902748 | melanocyte migration(GO:0097324) positive regulation of lens fiber cell differentiation(GO:1902748) |
| 0.2 | 0.8 | GO:0009443 | pyridoxal 5'-phosphate salvage(GO:0009443) |
| 0.2 | 0.4 | GO:0090116 | C-5 methylation of cytosine(GO:0090116) |
| 0.2 | 1.4 | GO:0015798 | myo-inositol transport(GO:0015798) |
| 0.2 | 1.4 | GO:0006651 | diacylglycerol biosynthetic process(GO:0006651) |
| 0.2 | 2.6 | GO:0030043 | actin filament fragmentation(GO:0030043) |
| 0.2 | 1.6 | GO:0046146 | tetrahydrobiopterin biosynthetic process(GO:0006729) tetrahydrobiopterin metabolic process(GO:0046146) |
| 0.2 | 1.6 | GO:0044211 | CTP salvage(GO:0044211) |
| 0.2 | 2.0 | GO:0000101 | sulfur amino acid transport(GO:0000101) |
| 0.2 | 1.8 | GO:0060907 | positive regulation of macrophage cytokine production(GO:0060907) |
| 0.2 | 1.8 | GO:0022027 | interkinetic nuclear migration(GO:0022027) |
| 0.2 | 0.6 | GO:0031938 | regulation of chromatin silencing at telomere(GO:0031938) |
| 0.2 | 0.8 | GO:0098728 | germ-line stem cell division(GO:0042078) male germ-line stem cell asymmetric division(GO:0048133) germline stem cell asymmetric division(GO:0098728) |
| 0.2 | 0.2 | GO:1905123 | regulation of glucosylceramidase activity(GO:1905123) |
| 0.2 | 0.6 | GO:0019860 | uracil catabolic process(GO:0006212) uracil metabolic process(GO:0019860) |
| 0.2 | 1.0 | GO:0098838 | reduced folate transmembrane transport(GO:0098838) |
| 0.2 | 0.2 | GO:0009298 | GDP-mannose biosynthetic process(GO:0009298) |
| 0.2 | 0.2 | GO:1900262 | regulation of DNA-directed DNA polymerase activity(GO:1900262) positive regulation of DNA-directed DNA polymerase activity(GO:1900264) |
| 0.2 | 0.8 | GO:0021592 | fourth ventricle development(GO:0021592) |
| 0.2 | 0.6 | GO:0033133 | positive regulation of glucokinase activity(GO:0033133) positive regulation of hexokinase activity(GO:1903301) |
| 0.2 | 1.7 | GO:1901725 | regulation of histone deacetylase activity(GO:1901725) |
| 0.2 | 0.2 | GO:2000224 | regulation of testosterone biosynthetic process(GO:2000224) |
| 0.2 | 1.3 | GO:0043932 | ossification involved in bone remodeling(GO:0043932) |
| 0.2 | 0.9 | GO:0032058 | positive regulation of translational initiation in response to stress(GO:0032058) |
| 0.2 | 1.1 | GO:0008218 | bioluminescence(GO:0008218) |
| 0.2 | 0.2 | GO:1903756 | regulation of transcription from RNA polymerase II promoter by histone modification(GO:1903756) negative regulation of transcription from RNA polymerase II promoter by histone modification(GO:1903758) |
| 0.2 | 0.6 | GO:0014876 | response to injury involved in regulation of muscle adaptation(GO:0014876) |
| 0.2 | 0.2 | GO:0031508 | pericentric heterochromatin assembly(GO:0031508) |
| 0.2 | 0.7 | GO:0002182 | cytoplasmic translational elongation(GO:0002182) regulation of cytoplasmic translational elongation(GO:1900247) negative regulation of cytoplasmic translational elongation(GO:1900248) |
| 0.2 | 0.2 | GO:0036091 | positive regulation of transcription from RNA polymerase II promoter in response to oxidative stress(GO:0036091) |
| 0.2 | 1.3 | GO:0090235 | regulation of metaphase plate congression(GO:0090235) |
| 0.2 | 0.5 | GO:0030718 | germ-line stem cell population maintenance(GO:0030718) |
| 0.2 | 0.5 | GO:0051414 | response to cortisol(GO:0051414) |
| 0.2 | 0.5 | GO:0034421 | post-translational protein acetylation(GO:0034421) |
| 0.2 | 0.5 | GO:0000710 | meiotic mismatch repair(GO:0000710) |
| 0.2 | 2.5 | GO:0008090 | retrograde axonal transport(GO:0008090) |
| 0.2 | 1.6 | GO:2000124 | regulation of endocannabinoid signaling pathway(GO:2000124) |
| 0.2 | 0.7 | GO:0051580 | regulation of neurotransmitter uptake(GO:0051580) negative regulation of neurotransmitter uptake(GO:0051581) serotonin uptake(GO:0051610) regulation of serotonin uptake(GO:0051611) negative regulation of serotonin uptake(GO:0051612) |
| 0.2 | 0.2 | GO:0006679 | glucosylceramide biosynthetic process(GO:0006679) |
| 0.2 | 1.4 | GO:0021648 | vestibulocochlear nerve morphogenesis(GO:0021648) |
| 0.2 | 0.9 | GO:0035873 | lactate transport(GO:0015727) lactate transmembrane transport(GO:0035873) |
| 0.2 | 1.1 | GO:0033489 | cholesterol biosynthetic process via desmosterol(GO:0033489) cholesterol biosynthetic process via lathosterol(GO:0033490) |
| 0.2 | 3.2 | GO:0009437 | carnitine metabolic process(GO:0009437) |
| 0.2 | 0.7 | GO:2000110 | negative regulation of macrophage apoptotic process(GO:2000110) |
| 0.2 | 4.6 | GO:0071447 | cellular response to hydroperoxide(GO:0071447) |
| 0.2 | 0.9 | GO:0070278 | extracellular matrix constituent secretion(GO:0070278) |
| 0.2 | 0.9 | GO:2001034 | positive regulation of double-strand break repair via nonhomologous end joining(GO:2001034) |
| 0.2 | 0.7 | GO:0090131 | mesenchyme migration(GO:0090131) |
| 0.2 | 0.9 | GO:0033387 | putrescine biosynthetic process from ornithine(GO:0033387) |
| 0.2 | 1.4 | GO:0046598 | positive regulation of viral entry into host cell(GO:0046598) |
| 0.2 | 0.5 | GO:0048370 | lateral mesoderm morphogenesis(GO:0048369) lateral mesoderm formation(GO:0048370) |
| 0.2 | 1.2 | GO:1901295 | positive regulation of ephrin receptor signaling pathway(GO:1901189) regulation of canonical Wnt signaling pathway involved in cardiac muscle cell fate commitment(GO:1901295) positive regulation of canonical Wnt signaling pathway involved in cardiac muscle cell fate commitment(GO:1901297) regulation of canonical Wnt signaling pathway involved in heart development(GO:1905066) positive regulation of canonical Wnt signaling pathway involved in heart development(GO:1905068) |
| 0.2 | 1.2 | GO:0007161 | calcium-independent cell-matrix adhesion(GO:0007161) |
| 0.2 | 1.4 | GO:1902231 | positive regulation of intrinsic apoptotic signaling pathway in response to DNA damage(GO:1902231) |
| 0.2 | 0.2 | GO:0071930 | negative regulation of transcription involved in G1/S transition of mitotic cell cycle(GO:0071930) regulation of centromere complex assembly(GO:0090230) |
| 0.2 | 0.3 | GO:0002874 | regulation of chronic inflammatory response to antigenic stimulus(GO:0002874) positive regulation of chronic inflammatory response to antigenic stimulus(GO:0002876) |
| 0.2 | 0.5 | GO:0045829 | negative regulation of isotype switching(GO:0045829) |
| 0.2 | 1.7 | GO:1990034 | calcium ion export from cell(GO:1990034) |
| 0.2 | 1.0 | GO:0035105 | sterol regulatory element binding protein import into nucleus(GO:0035105) |
| 0.2 | 0.3 | GO:0036496 | regulation of translational initiation by eIF2 alpha dephosphorylation(GO:0036496) |
| 0.2 | 0.2 | GO:0046452 | dihydrofolate metabolic process(GO:0046452) |
| 0.2 | 0.8 | GO:0032898 | neurotrophin production(GO:0032898) nerve growth factor production(GO:0032902) |
| 0.2 | 0.5 | GO:0090187 | positive regulation of pancreatic juice secretion(GO:0090187) |
| 0.2 | 1.0 | GO:1904322 | response to forskolin(GO:1904321) cellular response to forskolin(GO:1904322) |
| 0.2 | 1.8 | GO:0085020 | protein K6-linked ubiquitination(GO:0085020) |
| 0.2 | 0.5 | GO:1904172 | regulation of bleb assembly(GO:1904170) positive regulation of bleb assembly(GO:1904172) |
| 0.2 | 1.2 | GO:1902857 | positive regulation of nonmotile primary cilium assembly(GO:1902857) |
| 0.2 | 0.5 | GO:0070634 | transepithelial ammonium transport(GO:0070634) |
| 0.2 | 1.3 | GO:2000781 | positive regulation of double-strand break repair(GO:2000781) |
| 0.2 | 0.5 | GO:0050653 | chondroitin sulfate proteoglycan biosynthetic process, polysaccharide chain biosynthetic process(GO:0050653) |
| 0.2 | 0.2 | GO:0019483 | beta-alanine biosynthetic process(GO:0019483) |
| 0.2 | 1.2 | GO:0051305 | chromosome movement towards spindle pole(GO:0051305) |
| 0.2 | 1.0 | GO:0036018 | cellular response to erythropoietin(GO:0036018) |
| 0.2 | 0.2 | GO:0031990 | mRNA export from nucleus in response to heat stress(GO:0031990) |
| 0.2 | 2.0 | GO:0030578 | PML body organization(GO:0030578) |
| 0.2 | 1.6 | GO:0090292 | nuclear matrix anchoring at nuclear membrane(GO:0090292) |
| 0.2 | 2.4 | GO:0046007 | negative regulation of activated T cell proliferation(GO:0046007) |
| 0.2 | 0.6 | GO:0006311 | meiotic gene conversion(GO:0006311) |
| 0.2 | 0.5 | GO:0016476 | regulation of embryonic cell shape(GO:0016476) |
| 0.2 | 0.5 | GO:1900042 | positive regulation of interleukin-2 secretion(GO:1900042) |
| 0.2 | 0.8 | GO:0032380 | regulation of intracellular lipid transport(GO:0032377) regulation of intracellular sterol transport(GO:0032380) regulation of intracellular cholesterol transport(GO:0032383) |
| 0.2 | 1.0 | GO:0006574 | valine catabolic process(GO:0006574) |
| 0.2 | 1.1 | GO:0021523 | somatic motor neuron differentiation(GO:0021523) |
| 0.2 | 1.0 | GO:0000973 | posttranscriptional tethering of RNA polymerase II gene DNA at nuclear periphery(GO:0000973) |
| 0.2 | 0.5 | GO:1990426 | homologous recombination-dependent replication fork processing(GO:1990426) |
| 0.2 | 0.2 | GO:0060068 | vagina development(GO:0060068) |
| 0.2 | 0.6 | GO:0000912 | assembly of actomyosin apparatus involved in cytokinesis(GO:0000912) actomyosin contractile ring assembly(GO:0000915) actomyosin contractile ring organization(GO:0044837) |
| 0.2 | 0.2 | GO:0030241 | skeletal muscle myosin thick filament assembly(GO:0030241) |
| 0.2 | 1.3 | GO:0035799 | ureter maturation(GO:0035799) |
| 0.2 | 1.1 | GO:0051684 | maintenance of Golgi location(GO:0051684) |
| 0.2 | 0.3 | GO:1905051 | regulation of base-excision repair(GO:1905051) positive regulation of base-excision repair(GO:1905053) |
| 0.2 | 0.9 | GO:0033632 | regulation of cell-cell adhesion mediated by integrin(GO:0033632) |
| 0.2 | 0.9 | GO:1990539 | fructose transport(GO:0015755) fructose import(GO:0032445) carbohydrate import into cell(GO:0097319) carbohydrate import across plasma membrane(GO:0098704) fructose import across plasma membrane(GO:1990539) |
| 0.2 | 0.6 | GO:0006408 | snRNA export from nucleus(GO:0006408) |
| 0.2 | 0.6 | GO:0044861 | protein transport into plasma membrane raft(GO:0044861) |
| 0.2 | 0.9 | GO:0070376 | regulation of ERK5 cascade(GO:0070376) |
| 0.2 | 1.1 | GO:0097350 | neutrophil clearance(GO:0097350) |
| 0.2 | 0.8 | GO:0097056 | selenocysteinyl-tRNA(Sec) biosynthetic process(GO:0097056) |
| 0.2 | 0.8 | GO:0042760 | very long-chain fatty acid catabolic process(GO:0042760) |
| 0.2 | 0.6 | GO:0006172 | ADP biosynthetic process(GO:0006172) |
| 0.2 | 0.6 | GO:1904977 | lymphatic endothelial cell migration(GO:1904977) |
| 0.2 | 1.1 | GO:0046618 | drug export(GO:0046618) |
| 0.2 | 0.9 | GO:2000671 | regulation of motor neuron apoptotic process(GO:2000671) |
| 0.2 | 0.5 | GO:0030951 | establishment or maintenance of microtubule cytoskeleton polarity(GO:0030951) |
| 0.2 | 0.5 | GO:0043328 | protein targeting to vacuole involved in ubiquitin-dependent protein catabolic process via the multivesicular body sorting pathway(GO:0043328) |
| 0.2 | 0.9 | GO:0050916 | sensory perception of sweet taste(GO:0050916) |
| 0.2 | 0.6 | GO:0046947 | hydroxylysine metabolic process(GO:0046946) hydroxylysine biosynthetic process(GO:0046947) |
| 0.2 | 0.6 | GO:1904117 | response to vasopressin(GO:1904116) cellular response to vasopressin(GO:1904117) |
| 0.2 | 0.6 | GO:0031161 | phosphatidylinositol catabolic process(GO:0031161) |
| 0.1 | 0.7 | GO:0006127 | glycerophosphate shuttle(GO:0006127) |
| 0.1 | 5.5 | GO:0071711 | basement membrane organization(GO:0071711) |
| 0.1 | 0.9 | GO:0097327 | response to antineoplastic agent(GO:0097327) |
| 0.1 | 0.7 | GO:0051167 | glucuronate catabolic process(GO:0006064) glucuronate catabolic process to xylulose 5-phosphate(GO:0019640) xylulose 5-phosphate metabolic process(GO:0051167) xylulose 5-phosphate biosynthetic process(GO:1901159) |
| 0.1 | 1.6 | GO:0010499 | proteasomal ubiquitin-independent protein catabolic process(GO:0010499) |
| 0.1 | 2.4 | GO:0007084 | mitotic nuclear envelope reassembly(GO:0007084) |
| 0.1 | 0.3 | GO:0097212 | lysosomal membrane organization(GO:0097212) |
| 0.1 | 1.6 | GO:0006975 | DNA damage induced protein phosphorylation(GO:0006975) |
| 0.1 | 7.9 | GO:0035735 | intraciliary transport involved in cilium morphogenesis(GO:0035735) |
| 0.1 | 0.7 | GO:0090402 | oncogene-induced cell senescence(GO:0090402) |
| 0.1 | 0.4 | GO:0006931 | substrate-dependent cell migration, cell attachment to substrate(GO:0006931) |
| 0.1 | 0.4 | GO:1903546 | protein localization to photoreceptor outer segment(GO:1903546) |
| 0.1 | 0.1 | GO:0099541 | trans-synaptic signaling by lipid(GO:0099541) trans-synaptic signaling by endocannabinoid(GO:0099542) |
| 0.1 | 0.6 | GO:0030961 | peptidyl-arginine hydroxylation(GO:0030961) |
| 0.1 | 1.3 | GO:0002051 | osteoblast fate commitment(GO:0002051) |
| 0.1 | 0.6 | GO:0048050 | post-embryonic eye morphogenesis(GO:0048050) |
| 0.1 | 0.9 | GO:0000707 | meiotic DNA recombinase assembly(GO:0000707) |
| 0.1 | 0.6 | GO:0061034 | olfactory bulb mitral cell layer development(GO:0061034) |
| 0.1 | 1.3 | GO:0033197 | response to vitamin E(GO:0033197) |
| 0.1 | 0.7 | GO:0045541 | negative regulation of cholesterol biosynthetic process(GO:0045541) negative regulation of cholesterol metabolic process(GO:0090206) |
| 0.1 | 1.0 | GO:0045144 | meiotic sister chromatid segregation(GO:0045144) |
| 0.1 | 1.2 | GO:0033227 | dsRNA transport(GO:0033227) |
| 0.1 | 0.1 | GO:0016340 | calcium-dependent cell-matrix adhesion(GO:0016340) |
| 0.1 | 0.4 | GO:0006667 | sphinganine metabolic process(GO:0006667) |
| 0.1 | 0.6 | GO:0019285 | glycine betaine biosynthetic process from choline(GO:0019285) glycine betaine metabolic process(GO:0031455) glycine betaine biosynthetic process(GO:0031456) |
| 0.1 | 0.7 | GO:0035234 | ectopic germ cell programmed cell death(GO:0035234) |
| 0.1 | 0.4 | GO:0002304 | gamma-delta intraepithelial T cell differentiation(GO:0002304) CD8-positive, gamma-delta intraepithelial T cell differentiation(GO:0002305) |
| 0.1 | 2.5 | GO:0034501 | protein localization to kinetochore(GO:0034501) |
| 0.1 | 2.1 | GO:0031274 | positive regulation of pseudopodium assembly(GO:0031274) |
| 0.1 | 0.8 | GO:0097062 | dendritic spine maintenance(GO:0097062) |
| 0.1 | 0.7 | GO:0061083 | regulation of protein refolding(GO:0061083) negative regulation of protein refolding(GO:0061084) |
| 0.1 | 0.3 | GO:1903978 | regulation of microglial cell activation(GO:1903978) |
| 0.1 | 0.6 | GO:0042450 | arginine biosynthetic process via ornithine(GO:0042450) |
| 0.1 | 0.4 | GO:1901675 | negative regulation of histone H3-K27 acetylation(GO:1901675) |
| 0.1 | 0.6 | GO:0009956 | radial pattern formation(GO:0009956) |
| 0.1 | 3.5 | GO:0034063 | stress granule assembly(GO:0034063) |
| 0.1 | 0.6 | GO:0043314 | negative regulation of neutrophil degranulation(GO:0043314) |
| 0.1 | 0.7 | GO:2000580 | regulation of ATP-dependent microtubule motor activity, plus-end-directed(GO:2000580) positive regulation of ATP-dependent microtubule motor activity, plus-end-directed(GO:2000582) |
| 0.1 | 0.1 | GO:1903490 | regulation of cytokinetic process(GO:0032954) regulation of mitotic cytokinetic process(GO:1903436) positive regulation of mitotic cytokinetic process(GO:1903438) positive regulation of mitotic cytokinesis(GO:1903490) |
| 0.1 | 1.4 | GO:0061087 | positive regulation of histone H3-K27 methylation(GO:0061087) |
| 0.1 | 0.5 | GO:0018008 | N-terminal peptidyl-glycine N-myristoylation(GO:0018008) |
| 0.1 | 0.5 | GO:0044210 | 'de novo' CTP biosynthetic process(GO:0044210) |
| 0.1 | 3.9 | GO:0050651 | dermatan sulfate proteoglycan biosynthetic process(GO:0050651) |
| 0.1 | 1.4 | GO:0070212 | protein poly-ADP-ribosylation(GO:0070212) |
| 0.1 | 0.4 | GO:0071921 | establishment of sister chromatid cohesion(GO:0034085) cohesin loading(GO:0071921) regulation of cohesin loading(GO:0071922) |
| 0.1 | 0.4 | GO:0003356 | regulation of cilium beat frequency(GO:0003356) |
| 0.1 | 0.3 | GO:0034402 | recruitment of 3'-end processing factors to RNA polymerase II holoenzyme complex(GO:0034402) |
| 0.1 | 0.7 | GO:0018076 | N-terminal peptidyl-lysine acetylation(GO:0018076) |
| 0.1 | 0.3 | GO:0071895 | odontoblast differentiation(GO:0071895) |
| 0.1 | 1.5 | GO:1903944 | regulation of hepatocyte apoptotic process(GO:1903943) negative regulation of hepatocyte apoptotic process(GO:1903944) |
| 0.1 | 0.4 | GO:2001274 | negative regulation of glucose import in response to insulin stimulus(GO:2001274) |
| 0.1 | 0.5 | GO:0051194 | positive regulation of cofactor metabolic process(GO:0051194) positive regulation of coenzyme metabolic process(GO:0051197) |
| 0.1 | 0.5 | GO:0002541 | activation of plasma proteins involved in acute inflammatory response(GO:0002541) |
| 0.1 | 0.4 | GO:0019520 | aldonic acid metabolic process(GO:0019520) D-gluconate metabolic process(GO:0019521) |
| 0.1 | 0.4 | GO:0042989 | sequestering of actin monomers(GO:0042989) |
| 0.1 | 4.3 | GO:0071173 | spindle assembly checkpoint(GO:0071173) |
| 0.1 | 0.4 | GO:0061580 | colon epithelial cell migration(GO:0061580) |
| 0.1 | 0.3 | GO:0010593 | negative regulation of lamellipodium assembly(GO:0010593) |
| 0.1 | 1.0 | GO:0051832 | evasion or tolerance of host defenses by virus(GO:0019049) avoidance of host defenses(GO:0044413) evasion or tolerance of host defenses(GO:0044415) avoidance of defenses of other organism involved in symbiotic interaction(GO:0051832) evasion or tolerance of defenses of other organism involved in symbiotic interaction(GO:0051834) |
| 0.1 | 0.6 | GO:1904059 | regulation of locomotor rhythm(GO:1904059) |
| 0.1 | 0.1 | GO:0010825 | positive regulation of centrosome duplication(GO:0010825) |
| 0.1 | 1.3 | GO:0035973 | aggrephagy(GO:0035973) |
| 0.1 | 0.1 | GO:0035822 | gene conversion(GO:0035822) |
| 0.1 | 0.3 | GO:0051036 | regulation of endosome size(GO:0051036) |
| 0.1 | 0.4 | GO:0090043 | tubulin deacetylation(GO:0090042) regulation of tubulin deacetylation(GO:0090043) |
| 0.1 | 1.1 | GO:1901687 | glutathione derivative metabolic process(GO:1901685) glutathione derivative biosynthetic process(GO:1901687) |
| 0.1 | 1.7 | GO:0006547 | histidine metabolic process(GO:0006547) |
| 0.1 | 1.6 | GO:0070734 | histone H3-K27 methylation(GO:0070734) |
| 0.1 | 0.5 | GO:2000984 | regulation of ATP citrate synthase activity(GO:2000983) negative regulation of ATP citrate synthase activity(GO:2000984) |
| 0.1 | 0.9 | GO:0060157 | urinary bladder development(GO:0060157) |
| 0.1 | 0.5 | GO:0052651 | monoacylglycerol metabolic process(GO:0046462) monoacylglycerol catabolic process(GO:0052651) |
| 0.1 | 1.1 | GO:0000395 | mRNA 5'-splice site recognition(GO:0000395) |
| 0.1 | 0.8 | GO:0007296 | vitellogenesis(GO:0007296) |
| 0.1 | 0.4 | GO:0002384 | hepatic immune response(GO:0002384) |
| 0.1 | 0.5 | GO:0005986 | sucrose biosynthetic process(GO:0005986) |
| 0.1 | 0.5 | GO:1901165 | positive regulation of trophoblast cell migration(GO:1901165) |
| 0.1 | 0.1 | GO:0032241 | positive regulation of nucleobase-containing compound transport(GO:0032241) |
| 0.1 | 0.1 | GO:1903542 | negative regulation of exosomal secretion(GO:1903542) |
| 0.1 | 0.2 | GO:0006114 | glycerol biosynthetic process(GO:0006114) alditol biosynthetic process(GO:0019401) |
| 0.1 | 0.1 | GO:0010520 | regulation of reciprocal meiotic recombination(GO:0010520) |
| 0.1 | 0.4 | GO:1901874 | negative regulation of post-translational protein modification(GO:1901874) |
| 0.1 | 0.7 | GO:0010032 | meiotic chromosome condensation(GO:0010032) |
| 0.1 | 1.2 | GO:0051988 | regulation of attachment of spindle microtubules to kinetochore(GO:0051988) |
| 0.1 | 0.4 | GO:1902544 | regulation of DNA N-glycosylase activity(GO:1902544) |
| 0.1 | 1.6 | GO:0090385 | phagosome-lysosome fusion(GO:0090385) |
| 0.1 | 0.2 | GO:1903826 | arginine transmembrane transport(GO:1903826) |
| 0.1 | 0.5 | GO:0018197 | peptidyl-aspartic acid modification(GO:0018197) peptidyl-aspartic acid hydroxylation(GO:0042264) |
| 0.1 | 4.4 | GO:0034080 | CENP-A containing nucleosome assembly(GO:0034080) CENP-A containing chromatin organization(GO:0061641) |
| 0.1 | 0.4 | GO:0097029 | mature conventional dendritic cell differentiation(GO:0097029) |
| 0.1 | 0.5 | GO:0006663 | platelet activating factor biosynthetic process(GO:0006663) |
| 0.1 | 0.2 | GO:0051944 | positive regulation of neurotransmitter uptake(GO:0051582) positive regulation of dopamine uptake involved in synaptic transmission(GO:0051586) positive regulation of catecholamine uptake involved in synaptic transmission(GO:0051944) |
| 0.1 | 0.5 | GO:0097084 | vascular smooth muscle cell development(GO:0097084) |
| 0.1 | 0.1 | GO:0045900 | negative regulation of translational elongation(GO:0045900) |
| 0.1 | 0.6 | GO:0016584 | nucleosome positioning(GO:0016584) |
| 0.1 | 1.8 | GO:0070934 | CRD-mediated mRNA stabilization(GO:0070934) |
| 0.1 | 2.9 | GO:1900037 | regulation of cellular response to hypoxia(GO:1900037) |
| 0.1 | 0.2 | GO:0044340 | canonical Wnt signaling pathway involved in regulation of cell proliferation(GO:0044340) |
| 0.1 | 0.4 | GO:0060151 | peroxisome localization(GO:0060151) microtubule-based peroxisome localization(GO:0060152) |
| 0.1 | 1.2 | GO:0033540 | fatty acid beta-oxidation using acyl-CoA oxidase(GO:0033540) |
| 0.1 | 0.2 | GO:2000643 | positive regulation of early endosome to late endosome transport(GO:2000643) |
| 0.1 | 1.9 | GO:0040032 | post-embryonic body morphogenesis(GO:0040032) regulation of parathyroid hormone secretion(GO:2000828) |
| 0.1 | 0.5 | GO:0036058 | filtration diaphragm assembly(GO:0036058) slit diaphragm assembly(GO:0036060) |
| 0.1 | 0.8 | GO:2000254 | regulation of male germ cell proliferation(GO:2000254) |
| 0.1 | 1.9 | GO:0010991 | negative regulation of SMAD protein complex assembly(GO:0010991) |
| 0.1 | 7.8 | GO:0036297 | interstrand cross-link repair(GO:0036297) |
| 0.1 | 3.3 | GO:0045663 | positive regulation of myoblast differentiation(GO:0045663) |
| 0.1 | 0.2 | GO:0044878 | mitotic cytokinesis checkpoint(GO:0044878) |
| 0.1 | 0.5 | GO:2000910 | negative regulation of very-low-density lipoprotein particle remodeling(GO:0010903) negative regulation of cholesterol import(GO:0060621) negative regulation of sterol import(GO:2000910) |
| 0.1 | 0.4 | GO:0045875 | negative regulation of sister chromatid cohesion(GO:0045875) |
| 0.1 | 0.8 | GO:0060398 | regulation of growth hormone receptor signaling pathway(GO:0060398) |
| 0.1 | 0.5 | GO:1904526 | regulation of microtubule binding(GO:1904526) |
| 0.1 | 0.7 | GO:0042796 | snRNA transcription from RNA polymerase III promoter(GO:0042796) |
| 0.1 | 4.3 | GO:0007035 | vacuolar acidification(GO:0007035) |
| 0.1 | 0.5 | GO:0009786 | regulation of asymmetric cell division(GO:0009786) |
| 0.1 | 0.1 | GO:0061738 | late endosomal microautophagy(GO:0061738) |
| 0.1 | 0.3 | GO:0060979 | vasculogenesis involved in coronary vascular morphogenesis(GO:0060979) |
| 0.1 | 0.6 | GO:1905225 | response to thyrotropin-releasing hormone(GO:1905225) |
| 0.1 | 0.3 | GO:1904479 | negative regulation of intestinal absorption(GO:1904479) |
| 0.1 | 0.2 | GO:1903348 | positive regulation of bicellular tight junction assembly(GO:1903348) |
| 0.1 | 0.8 | GO:0035934 | corticosterone secretion(GO:0035934) |
| 0.1 | 2.2 | GO:2000001 | regulation of DNA damage checkpoint(GO:2000001) |
| 0.1 | 1.2 | GO:0097396 | response to interleukin-17(GO:0097396) cellular response to interleukin-17(GO:0097398) |
| 0.1 | 0.6 | GO:0035751 | regulation of lysosomal lumen pH(GO:0035751) |
| 0.1 | 0.7 | GO:0016128 | ergosterol biosynthetic process(GO:0006696) ergosterol metabolic process(GO:0008204) phytosteroid metabolic process(GO:0016128) phytosteroid biosynthetic process(GO:0016129) |
| 0.1 | 0.2 | GO:1902732 | positive regulation of chondrocyte proliferation(GO:1902732) |
| 0.1 | 0.9 | GO:1905049 | negative regulation of metallopeptidase activity(GO:1905049) |
| 0.1 | 0.3 | GO:0072396 | response to cell cycle checkpoint signaling(GO:0072396) response to DNA integrity checkpoint signaling(GO:0072402) response to DNA damage checkpoint signaling(GO:0072423) |
| 0.1 | 0.5 | GO:0044240 | multicellular organism lipid catabolic process(GO:0044240) |
| 0.1 | 0.3 | GO:0048852 | diencephalon morphogenesis(GO:0048852) |
| 0.1 | 0.2 | GO:0006106 | fumarate metabolic process(GO:0006106) |
| 0.1 | 1.4 | GO:0098535 | de novo centriole assembly(GO:0098535) |
| 0.1 | 0.2 | GO:0051315 | attachment of mitotic spindle microtubules to kinetochore(GO:0051315) |
| 0.1 | 0.6 | GO:0018094 | protein polyglycylation(GO:0018094) |
| 0.1 | 0.1 | GO:0031630 | regulation of synaptic vesicle fusion to presynaptic membrane(GO:0031630) |
| 0.1 | 0.8 | GO:0000920 | cell separation after cytokinesis(GO:0000920) |
| 0.1 | 0.3 | GO:0051877 | pigment granule aggregation in cell center(GO:0051877) |
| 0.1 | 1.5 | GO:0043983 | histone H4-K12 acetylation(GO:0043983) |
| 0.1 | 0.4 | GO:1990108 | protein linear deubiquitination(GO:1990108) |
| 0.1 | 1.3 | GO:0006336 | DNA replication-independent nucleosome assembly(GO:0006336) |
| 0.1 | 1.0 | GO:0006290 | pyrimidine dimer repair(GO:0006290) |
| 0.1 | 0.6 | GO:0086053 | AV node cell to bundle of His cell communication by electrical coupling(GO:0086053) |
| 0.1 | 0.9 | GO:0061734 | parkin-mediated mitophagy in response to mitochondrial depolarization(GO:0061734) |
| 0.1 | 0.7 | GO:1903566 | positive regulation of protein localization to cilium(GO:1903566) |
| 0.1 | 0.2 | GO:1904869 | regulation of protein localization to Cajal body(GO:1904869) positive regulation of protein localization to Cajal body(GO:1904871) |
| 0.1 | 0.8 | GO:0060385 | axonogenesis involved in innervation(GO:0060385) |
| 0.1 | 3.3 | GO:0043968 | histone H2A acetylation(GO:0043968) |
| 0.1 | 0.5 | GO:0048318 | axial mesoderm development(GO:0048318) |
| 0.1 | 0.5 | GO:0051281 | positive regulation of release of sequestered calcium ion into cytosol(GO:0051281) |
| 0.1 | 1.3 | GO:0051014 | actin filament severing(GO:0051014) |
| 0.1 | 1.0 | GO:0033622 | integrin activation(GO:0033622) |
| 0.1 | 0.4 | GO:0008608 | attachment of spindle microtubules to kinetochore(GO:0008608) |
| 0.1 | 0.1 | GO:0061051 | positive regulation of cell growth involved in cardiac muscle cell development(GO:0061051) |
| 0.1 | 0.1 | GO:0010847 | regulation of chromatin assembly(GO:0010847) |
| 0.1 | 0.2 | GO:0030300 | regulation of intestinal cholesterol absorption(GO:0030300) regulation of intestinal lipid absorption(GO:1904729) |
| 0.1 | 0.5 | GO:0042023 | DNA endoreduplication(GO:0042023) |
| 0.1 | 0.5 | GO:1901202 | negative regulation of extracellular matrix assembly(GO:1901202) |
| 0.1 | 3.2 | GO:0043046 | DNA methylation involved in gamete generation(GO:0043046) |
| 0.1 | 1.4 | GO:0090110 | cargo loading into COPII-coated vesicle(GO:0090110) |
| 0.1 | 1.4 | GO:0001514 | selenocysteine incorporation(GO:0001514) translational readthrough(GO:0006451) |
| 0.1 | 0.6 | GO:0031536 | positive regulation of exit from mitosis(GO:0031536) |
| 0.1 | 0.7 | GO:1903593 | regulation of histamine secretion by mast cell(GO:1903593) |
| 0.1 | 0.9 | GO:0009157 | deoxyribonucleoside monophosphate biosynthetic process(GO:0009157) |
| 0.1 | 0.4 | GO:1990502 | dense core granule maturation(GO:1990502) |
| 0.1 | 0.4 | GO:0031296 | B cell costimulation(GO:0031296) |
| 0.1 | 0.2 | GO:0070213 | protein auto-ADP-ribosylation(GO:0070213) |
| 0.1 | 0.6 | GO:0051534 | negative regulation of NFAT protein import into nucleus(GO:0051534) |
| 0.1 | 0.4 | GO:0006556 | S-adenosylmethionine biosynthetic process(GO:0006556) |
| 0.1 | 0.1 | GO:1900748 | positive regulation of vascular endothelial growth factor signaling pathway(GO:1900748) |
| 0.1 | 0.8 | GO:0071267 | amino acid salvage(GO:0043102) L-methionine salvage(GO:0071267) |
| 0.1 | 0.5 | GO:1902626 | assembly of large subunit precursor of preribosome(GO:1902626) |
| 0.1 | 0.5 | GO:0010807 | regulation of synaptic vesicle priming(GO:0010807) |
| 0.1 | 0.7 | GO:0045007 | depurination(GO:0045007) |
| 0.1 | 0.3 | GO:1903278 | regulation of sodium ion export(GO:1903273) positive regulation of sodium ion export(GO:1903275) regulation of sodium ion export from cell(GO:1903276) positive regulation of sodium ion export from cell(GO:1903278) |
| 0.1 | 0.2 | GO:0016999 | antibiotic metabolic process(GO:0016999) |
| 0.1 | 0.1 | GO:0072011 | glomerular endothelium development(GO:0072011) |
| 0.1 | 1.6 | GO:0010569 | regulation of double-strand break repair via homologous recombination(GO:0010569) |
| 0.1 | 0.3 | GO:0045957 | regulation of complement activation, alternative pathway(GO:0030451) negative regulation of complement activation, alternative pathway(GO:0045957) |
| 0.1 | 0.2 | GO:2000562 | negative regulation of CD4-positive, alpha-beta T cell proliferation(GO:2000562) |
| 0.1 | 0.3 | GO:0032223 | negative regulation of synaptic transmission, cholinergic(GO:0032223) neurotransmitter receptor biosynthetic process(GO:0045212) |
| 0.1 | 0.2 | GO:0021913 | regulation of transcription from RNA polymerase II promoter involved in ventral spinal cord interneuron specification(GO:0021913) |
| 0.1 | 0.1 | GO:0042998 | positive regulation of Golgi to plasma membrane protein transport(GO:0042998) |
| 0.1 | 0.5 | GO:0048388 | endosomal lumen acidification(GO:0048388) |
| 0.1 | 0.3 | GO:0010587 | miRNA catabolic process(GO:0010587) |
| 0.1 | 2.1 | GO:0006488 | dolichol-linked oligosaccharide biosynthetic process(GO:0006488) |
| 0.1 | 0.3 | GO:1901355 | response to rapamycin(GO:1901355) |
| 0.1 | 0.7 | GO:0072592 | oxygen metabolic process(GO:0072592) |
| 0.1 | 0.2 | GO:0035811 | negative regulation of urine volume(GO:0035811) |
| 0.1 | 0.1 | GO:0032792 | negative regulation of CREB transcription factor activity(GO:0032792) |
| 0.1 | 0.8 | GO:0051418 | interphase microtubule nucleation by interphase microtubule organizing center(GO:0051415) microtubule nucleation by microtubule organizing center(GO:0051418) |
| 0.1 | 1.9 | GO:0046036 | CTP biosynthetic process(GO:0006241) CTP metabolic process(GO:0046036) |
| 0.1 | 0.3 | GO:0007227 | signal transduction downstream of smoothened(GO:0007227) |
| 0.1 | 0.1 | GO:0090370 | negative regulation of cholesterol efflux(GO:0090370) |
| 0.1 | 0.2 | GO:0010767 | regulation of transcription from RNA polymerase II promoter in response to UV-induced DNA damage(GO:0010767) |
| 0.1 | 0.8 | GO:0060394 | negative regulation of pathway-restricted SMAD protein phosphorylation(GO:0060394) |
| 0.1 | 1.0 | GO:0045292 | mRNA cis splicing, via spliceosome(GO:0045292) |
| 0.1 | 1.2 | GO:0033194 | response to hydroperoxide(GO:0033194) |
| 0.1 | 1.3 | GO:0040016 | embryonic cleavage(GO:0040016) |
| 0.1 | 0.3 | GO:0048250 | mitochondrial iron ion transport(GO:0048250) |
| 0.1 | 0.6 | GO:0070375 | ERK5 cascade(GO:0070375) |
| 0.1 | 0.3 | GO:0032455 | nerve growth factor processing(GO:0032455) |
| 0.1 | 1.1 | GO:0097150 | neuronal stem cell population maintenance(GO:0097150) |
| 0.1 | 0.4 | GO:0048733 | sebaceous gland development(GO:0048733) |
| 0.1 | 1.0 | GO:0060973 | cell migration involved in heart development(GO:0060973) |
| 0.1 | 0.4 | GO:0072393 | microtubule anchoring at microtubule organizing center(GO:0072393) |
| 0.1 | 0.1 | GO:0036090 | cleavage furrow ingression(GO:0036090) |
| 0.1 | 0.5 | GO:0045003 | DNA recombinase assembly(GO:0000730) double-strand break repair via synthesis-dependent strand annealing(GO:0045003) |
| 0.1 | 0.7 | GO:0048845 | venous blood vessel morphogenesis(GO:0048845) |
| 0.1 | 0.3 | GO:0072134 | nephrogenic mesenchyme morphogenesis(GO:0072134) |
| 0.1 | 0.2 | GO:0035721 | intraciliary retrograde transport(GO:0035721) |
| 0.1 | 0.1 | GO:1904674 | positive regulation of somatic stem cell population maintenance(GO:1904674) |
| 0.1 | 0.2 | GO:1902965 | regulation of protein localization to early endosome(GO:1902965) positive regulation of protein localization to early endosome(GO:1902966) |
| 0.1 | 0.4 | GO:2000313 | fibroblast growth factor receptor signaling pathway involved in neural plate anterior/posterior pattern formation(GO:0060825) regulation of neural crest formation(GO:0090299) negative regulation of neural crest formation(GO:0090301) regulation of fibroblast growth factor receptor signaling pathway involved in neural plate anterior/posterior pattern formation(GO:2000313) negative regulation of fibroblast growth factor receptor signaling pathway involved in neural plate anterior/posterior pattern formation(GO:2000314) |
| 0.1 | 2.8 | GO:0014850 | response to muscle activity(GO:0014850) |
| 0.1 | 0.5 | GO:0060370 | susceptibility to T cell mediated cytotoxicity(GO:0060370) |
| 0.1 | 2.4 | GO:0000042 | protein targeting to Golgi(GO:0000042) |
| 0.1 | 0.2 | GO:0043385 | mycotoxin metabolic process(GO:0043385) aflatoxin metabolic process(GO:0046222) organic heteropentacyclic compound metabolic process(GO:1901376) |
| 0.1 | 0.8 | GO:0048280 | vesicle fusion with Golgi apparatus(GO:0048280) |
| 0.1 | 0.5 | GO:0014049 | positive regulation of glutamate secretion(GO:0014049) |
| 0.1 | 0.3 | GO:0061107 | seminal vesicle development(GO:0061107) |
| 0.1 | 0.1 | GO:1902953 | positive regulation of ER to Golgi vesicle-mediated transport(GO:1902953) |
| 0.1 | 0.8 | GO:0045724 | positive regulation of cilium assembly(GO:0045724) |
| 0.1 | 0.4 | GO:0070781 | protein biotinylation(GO:0009305) response to biotin(GO:0070781) histone biotinylation(GO:0071110) |
| 0.1 | 0.2 | GO:0000732 | strand displacement(GO:0000732) |
| 0.1 | 0.2 | GO:0007206 | phospholipase C-activating G-protein coupled glutamate receptor signaling pathway(GO:0007206) |
| 0.1 | 0.4 | GO:0021678 | third ventricle development(GO:0021678) |
| 0.1 | 0.2 | GO:0071279 | cellular response to cobalt ion(GO:0071279) |
| 0.1 | 0.1 | GO:1903690 | negative regulation of wound healing, spreading of epidermal cells(GO:1903690) |
| 0.1 | 2.0 | GO:0002115 | store-operated calcium entry(GO:0002115) |
| 0.1 | 0.4 | GO:0006617 | SRP-dependent cotranslational protein targeting to membrane, signal sequence recognition(GO:0006617) |
| 0.1 | 1.2 | GO:0001542 | ovulation from ovarian follicle(GO:0001542) |
| 0.1 | 0.1 | GO:1902969 | mitotic DNA replication(GO:1902969) |
| 0.1 | 1.0 | GO:0043922 | negative regulation by host of viral transcription(GO:0043922) |
| 0.1 | 0.3 | GO:0009106 | lipoate metabolic process(GO:0009106) |
| 0.1 | 1.5 | GO:0071379 | cellular response to prostaglandin stimulus(GO:0071379) |
| 0.1 | 1.5 | GO:0018298 | protein-chromophore linkage(GO:0018298) |
| 0.1 | 0.7 | GO:0051694 | pointed-end actin filament capping(GO:0051694) |
| 0.1 | 1.0 | GO:0008635 | activation of cysteine-type endopeptidase activity involved in apoptotic process by cytochrome c(GO:0008635) |
| 0.1 | 0.1 | GO:0032661 | regulation of interleukin-18 production(GO:0032661) |
| 0.1 | 1.1 | GO:1900119 | positive regulation of execution phase of apoptosis(GO:1900119) |
| 0.1 | 1.0 | GO:0051531 | NFAT protein import into nucleus(GO:0051531) |
| 0.1 | 0.4 | GO:0030579 | ubiquitin-dependent SMAD protein catabolic process(GO:0030579) |
| 0.1 | 2.5 | GO:0051131 | chaperone-mediated protein complex assembly(GO:0051131) |
| 0.1 | 0.7 | GO:0006398 | mRNA 3'-end processing by stem-loop binding and cleavage(GO:0006398) |
| 0.1 | 1.1 | GO:0002315 | marginal zone B cell differentiation(GO:0002315) |
| 0.1 | 0.5 | GO:0048304 | positive regulation of isotype switching to IgG isotypes(GO:0048304) |
| 0.1 | 0.7 | GO:0006538 | glutamate catabolic process(GO:0006538) |
| 0.1 | 1.3 | GO:0046185 | aldehyde catabolic process(GO:0046185) |
| 0.1 | 0.1 | GO:0010730 | negative regulation of hydrogen peroxide biosynthetic process(GO:0010730) |
| 0.1 | 0.3 | GO:0036155 | acylglycerol acyl-chain remodeling(GO:0036155) |
| 0.1 | 0.7 | GO:0046684 | response to pyrethroid(GO:0046684) |
| 0.1 | 0.4 | GO:0032962 | positive regulation of inositol trisphosphate biosynthetic process(GO:0032962) |
| 0.1 | 0.2 | GO:0033594 | response to hydroxyisoflavone(GO:0033594) |
| 0.1 | 0.8 | GO:0046600 | negative regulation of centriole replication(GO:0046600) |
| 0.1 | 0.8 | GO:0070294 | renal sodium ion transport(GO:0003096) renal sodium ion absorption(GO:0070294) |
| 0.1 | 0.4 | GO:1902037 | negative regulation of hematopoietic stem cell differentiation(GO:1902037) |
| 0.1 | 0.3 | GO:1903070 | negative regulation of ER-associated ubiquitin-dependent protein catabolic process(GO:1903070) |
| 0.1 | 0.3 | GO:2000051 | negative regulation of non-canonical Wnt signaling pathway(GO:2000051) |
| 0.1 | 0.3 | GO:0008588 | release of cytoplasmic sequestered NF-kappaB(GO:0008588) |
| 0.1 | 0.1 | GO:1903895 | negative regulation of IRE1-mediated unfolded protein response(GO:1903895) |
| 0.1 | 0.2 | GO:1904640 | response to methionine(GO:1904640) |
| 0.1 | 0.1 | GO:1990637 | response to prolactin(GO:1990637) |
| 0.1 | 0.4 | GO:0006104 | succinyl-CoA metabolic process(GO:0006104) |
| 0.1 | 0.2 | GO:0043504 | mitochondrial DNA repair(GO:0043504) |
| 0.1 | 0.2 | GO:0006393 | termination of mitochondrial transcription(GO:0006393) |
| 0.1 | 3.7 | GO:2000144 | positive regulation of DNA-templated transcription, initiation(GO:2000144) |
| 0.1 | 0.1 | GO:0007183 | SMAD protein complex assembly(GO:0007183) |
| 0.1 | 1.0 | GO:0010528 | regulation of transposition(GO:0010528) negative regulation of transposition(GO:0010529) |
| 0.1 | 0.3 | GO:0019626 | short-chain fatty acid catabolic process(GO:0019626) |
| 0.1 | 0.2 | GO:0045002 | double-strand break repair via single-strand annealing(GO:0045002) |
| 0.1 | 0.3 | GO:0098908 | regulation of neuronal action potential(GO:0098908) |
| 0.1 | 1.3 | GO:0045721 | negative regulation of gluconeogenesis(GO:0045721) |
| 0.1 | 0.3 | GO:0006616 | SRP-dependent cotranslational protein targeting to membrane, translocation(GO:0006616) |
| 0.1 | 2.5 | GO:1903393 | positive regulation of adherens junction organization(GO:1903393) |
| 0.1 | 1.0 | GO:0006824 | cobalt ion transport(GO:0006824) |
| 0.1 | 0.9 | GO:0036159 | inner dynein arm assembly(GO:0036159) |
| 0.1 | 2.6 | GO:0006298 | mismatch repair(GO:0006298) |
| 0.1 | 0.3 | GO:0021897 | forebrain astrocyte differentiation(GO:0021896) forebrain astrocyte development(GO:0021897) |
| 0.1 | 0.8 | GO:0061088 | regulation of sequestering of zinc ion(GO:0061088) |
| 0.1 | 0.3 | GO:0021699 | cerebellum maturation(GO:0021590) cerebellar cortex maturation(GO:0021699) |
| 0.1 | 0.3 | GO:0001927 | exocyst assembly(GO:0001927) |
| 0.1 | 0.3 | GO:0039534 | negative regulation of MDA-5 signaling pathway(GO:0039534) |
| 0.1 | 0.7 | GO:0014827 | intestine smooth muscle contraction(GO:0014827) |
| 0.1 | 0.9 | GO:2000795 | negative regulation of epithelial cell proliferation involved in lung morphogenesis(GO:2000795) |
| 0.1 | 0.8 | GO:0001556 | oocyte maturation(GO:0001556) |
| 0.1 | 0.4 | GO:0010182 | hexose mediated signaling(GO:0009757) sugar mediated signaling pathway(GO:0010182) glucose mediated signaling pathway(GO:0010255) regulation of glucose mediated signaling pathway(GO:1902659) |
| 0.1 | 0.3 | GO:2001033 | negative regulation of double-strand break repair via nonhomologous end joining(GO:2001033) |
| 0.1 | 0.7 | GO:0007023 | post-chaperonin tubulin folding pathway(GO:0007023) |
| 0.1 | 0.1 | GO:0003162 | atrioventricular node development(GO:0003162) |
| 0.1 | 1.4 | GO:0072619 | interleukin-21 production(GO:0032625) interleukin-21 secretion(GO:0072619) |
| 0.1 | 0.2 | GO:0090071 | negative regulation of ribosome biogenesis(GO:0090071) |
| 0.1 | 1.3 | GO:0048172 | regulation of short-term neuronal synaptic plasticity(GO:0048172) |
| 0.1 | 0.2 | GO:0048549 | positive regulation of pinocytosis(GO:0048549) |
| 0.1 | 1.0 | GO:1990035 | calcium ion import across plasma membrane(GO:0098703) calcium ion import into cell(GO:1990035) |
| 0.1 | 1.0 | GO:0061635 | regulation of protein complex stability(GO:0061635) |
| 0.1 | 0.1 | GO:1903516 | regulation of single strand break repair(GO:1903516) |
| 0.1 | 0.9 | GO:0061162 | establishment of monopolar cell polarity(GO:0061162) |
| 0.1 | 0.2 | GO:1990173 | protein localization to nucleoplasm(GO:1990173) |
| 0.1 | 0.2 | GO:1902524 | positive regulation of protein K48-linked ubiquitination(GO:1902524) |
| 0.1 | 0.3 | GO:0046477 | glycosylceramide catabolic process(GO:0046477) |
| 0.1 | 0.2 | GO:2000583 | regulation of platelet-derived growth factor receptor-alpha signaling pathway(GO:2000583) negative regulation of platelet-derived growth factor receptor-alpha signaling pathway(GO:2000584) |
| 0.1 | 1.2 | GO:0060180 | female mating behavior(GO:0060180) |
| 0.1 | 2.6 | GO:0032012 | regulation of ARF protein signal transduction(GO:0032012) |
| 0.1 | 2.4 | GO:0046856 | phosphatidylinositol dephosphorylation(GO:0046856) |
| 0.1 | 0.1 | GO:0002589 | regulation of antigen processing and presentation of peptide antigen via MHC class I(GO:0002589) negative regulation of antigen processing and presentation of peptide antigen via MHC class I(GO:0002590) |
| 0.1 | 1.6 | GO:2000675 | negative regulation of type B pancreatic cell apoptotic process(GO:2000675) |
| 0.1 | 0.6 | GO:0009263 | deoxyribonucleotide biosynthetic process(GO:0009263) |
| 0.1 | 0.1 | GO:0072076 | nephrogenic mesenchyme development(GO:0072076) |
| 0.1 | 2.5 | GO:0016601 | Rac protein signal transduction(GO:0016601) |
| 0.1 | 0.1 | GO:0070253 | somatostatin secretion(GO:0070253) |
| 0.1 | 0.5 | GO:0070345 | negative regulation of fat cell proliferation(GO:0070345) |
| 0.1 | 0.6 | GO:0014041 | regulation of neuron maturation(GO:0014041) |
| 0.1 | 0.9 | GO:0051231 | mitotic spindle elongation(GO:0000022) spindle elongation(GO:0051231) |
| 0.1 | 0.5 | GO:2000394 | positive regulation of lamellipodium morphogenesis(GO:2000394) |
| 0.1 | 0.2 | GO:0045897 | positive regulation of transcription during mitosis(GO:0045897) |
| 0.1 | 0.6 | GO:0010216 | maintenance of DNA methylation(GO:0010216) |
| 0.1 | 0.4 | GO:0050428 | purine ribonucleoside bisphosphate biosynthetic process(GO:0034036) 3'-phosphoadenosine 5'-phosphosulfate biosynthetic process(GO:0050428) |
| 0.1 | 0.2 | GO:0097527 | necroptotic signaling pathway(GO:0097527) |
| 0.1 | 0.1 | GO:0051902 | negative regulation of mitochondrial depolarization(GO:0051902) |
| 0.1 | 0.7 | GO:0046784 | viral mRNA export from host cell nucleus(GO:0046784) |
| 0.1 | 2.9 | GO:0009250 | glycogen biosynthetic process(GO:0005978) glucan biosynthetic process(GO:0009250) |
| 0.1 | 0.7 | GO:0006002 | fructose 6-phosphate metabolic process(GO:0006002) |
| 0.1 | 0.5 | GO:0035810 | positive regulation of urine volume(GO:0035810) |
| 0.1 | 0.8 | GO:0071803 | positive regulation of podosome assembly(GO:0071803) |
| 0.1 | 1.5 | GO:1902603 | carnitine transmembrane transport(GO:1902603) |
| 0.1 | 0.3 | GO:0000972 | transcription-dependent tethering of RNA polymerase II gene DNA at nuclear periphery(GO:0000972) |
| 0.1 | 0.2 | GO:0090675 | intermicrovillar adhesion(GO:0090675) |
| 0.1 | 0.1 | GO:0035963 | cellular response to interleukin-13(GO:0035963) |
| 0.1 | 1.1 | GO:0000244 | spliceosomal tri-snRNP complex assembly(GO:0000244) |
| 0.1 | 1.0 | GO:0001778 | plasma membrane repair(GO:0001778) |
| 0.1 | 0.2 | GO:0002769 | natural killer cell inhibitory signaling pathway(GO:0002769) |
| 0.1 | 0.2 | GO:0032682 | negative regulation of chemokine production(GO:0032682) |
| 0.1 | 0.2 | GO:0003072 | regulation of blood vessel size by renin-angiotensin(GO:0002034) renal control of peripheral vascular resistance involved in regulation of systemic arterial blood pressure(GO:0003072) |
| 0.1 | 0.3 | GO:0097105 | presynaptic membrane assembly(GO:0097105) |
| 0.1 | 0.2 | GO:0070676 | intralumenal vesicle formation(GO:0070676) |
| 0.1 | 1.2 | GO:0017187 | peptidyl-glutamic acid carboxylation(GO:0017187) protein carboxylation(GO:0018214) |
| 0.1 | 0.2 | GO:0044539 | long-chain fatty acid import(GO:0044539) |
| 0.1 | 0.2 | GO:0002314 | germinal center B cell differentiation(GO:0002314) |
| 0.1 | 0.2 | GO:1903608 | protein localization to cytoplasmic stress granule(GO:1903608) |
| 0.1 | 0.3 | GO:0051037 | regulation of transcription involved in meiotic cell cycle(GO:0051037) |
| 0.1 | 1.7 | GO:0097369 | sodium ion import(GO:0097369) |
| 0.1 | 0.1 | GO:0002415 | immune response in mucosal-associated lymphoid tissue(GO:0002386) immunoglobulin transcytosis in epithelial cells mediated by polymeric immunoglobulin receptor(GO:0002415) |
| 0.1 | 0.2 | GO:0045338 | farnesyl diphosphate metabolic process(GO:0045338) |
| 0.1 | 0.9 | GO:0060020 | Bergmann glial cell differentiation(GO:0060020) |
| 0.1 | 0.4 | GO:0001302 | replicative cell aging(GO:0001302) |
| 0.1 | 0.7 | GO:0043402 | glucocorticoid mediated signaling pathway(GO:0043402) |
| 0.1 | 0.2 | GO:0090158 | endoplasmic reticulum membrane organization(GO:0090158) |
| 0.1 | 0.5 | GO:0060267 | positive regulation of respiratory burst(GO:0060267) |
| 0.1 | 0.5 | GO:1990592 | protein polyufmylation(GO:1990564) protein K69-linked ufmylation(GO:1990592) |
| 0.1 | 0.1 | GO:0001575 | globoside metabolic process(GO:0001575) |
| 0.1 | 0.1 | GO:0010728 | regulation of hydrogen peroxide biosynthetic process(GO:0010728) |
| 0.1 | 0.1 | GO:1901857 | positive regulation of cellular respiration(GO:1901857) |
| 0.1 | 3.0 | GO:0050690 | regulation of defense response to virus by virus(GO:0050690) |
| 0.1 | 0.4 | GO:0043418 | homocysteine catabolic process(GO:0043418) |
| 0.1 | 0.3 | GO:0010457 | centriole-centriole cohesion(GO:0010457) |
| 0.1 | 0.5 | GO:0035518 | histone H2A monoubiquitination(GO:0035518) |
| 0.1 | 0.6 | GO:0042428 | serotonin metabolic process(GO:0042428) |
| 0.1 | 0.4 | GO:0006750 | glutathione biosynthetic process(GO:0006750) |
| 0.1 | 0.4 | GO:0048793 | pronephros development(GO:0048793) |
| 0.1 | 3.3 | GO:0032784 | regulation of DNA-templated transcription, elongation(GO:0032784) |
| 0.1 | 0.2 | GO:1902683 | regulation of receptor localization to synapse(GO:1902683) |
| 0.1 | 0.4 | GO:0072711 | cellular response to hydroxyurea(GO:0072711) |
| 0.1 | 0.5 | GO:0098722 | asymmetric neuroblast division(GO:0055059) asymmetric stem cell division(GO:0098722) |
| 0.1 | 0.4 | GO:0061760 | antifungal innate immune response(GO:0061760) |
| 0.1 | 0.6 | GO:0070914 | UV-damage excision repair(GO:0070914) |
| 0.1 | 0.1 | GO:0007501 | mesodermal cell fate specification(GO:0007501) |
| 0.1 | 1.7 | GO:0071392 | cellular response to estradiol stimulus(GO:0071392) |
| 0.1 | 0.3 | GO:0097267 | omega-hydroxylase P450 pathway(GO:0097267) |
| 0.1 | 0.7 | GO:0021877 | forebrain neuron fate commitment(GO:0021877) commitment of neuronal cell to specific neuron type in forebrain(GO:0021902) |
| 0.1 | 0.1 | GO:0072300 | positive regulation of metanephric glomerulus development(GO:0072300) |
| 0.1 | 0.1 | GO:0035928 | rRNA import into mitochondrion(GO:0035928) |
| 0.1 | 1.2 | GO:0036066 | protein O-linked fucosylation(GO:0036066) |
| 0.1 | 0.2 | GO:0009258 | 10-formyltetrahydrofolate catabolic process(GO:0009258) |
| 0.1 | 0.7 | GO:0031468 | nuclear envelope reassembly(GO:0031468) |
| 0.1 | 2.6 | GO:0018345 | protein palmitoylation(GO:0018345) |
| 0.1 | 0.6 | GO:2000346 | negative regulation of hepatocyte proliferation(GO:2000346) |
| 0.1 | 0.4 | GO:1901419 | regulation of response to alcohol(GO:1901419) |
| 0.1 | 0.1 | GO:0042538 | hyperosmotic salinity response(GO:0042538) |
| 0.1 | 0.1 | GO:0034124 | regulation of MyD88-dependent toll-like receptor signaling pathway(GO:0034124) |
| 0.1 | 0.1 | GO:0090119 | vesicle-mediated cholesterol transport(GO:0090119) |
| 0.1 | 0.5 | GO:1903874 | ferrous iron transport(GO:0015684) ferrous iron transmembrane transport(GO:1903874) |
| 0.1 | 2.5 | GO:0051983 | regulation of chromosome segregation(GO:0051983) |
| 0.1 | 0.2 | GO:0014810 | positive regulation of skeletal muscle contraction by regulation of release of sequestered calcium ion(GO:0014810) |
| 0.1 | 0.1 | GO:1903056 | regulation of melanosome organization(GO:1903056) |
| 0.1 | 0.3 | GO:0006550 | isoleucine catabolic process(GO:0006550) |
| 0.1 | 0.2 | GO:0099558 | maintenance of synapse structure(GO:0099558) |
| 0.1 | 0.1 | GO:1903333 | negative regulation of protein folding(GO:1903333) |
| 0.1 | 0.7 | GO:0007076 | mitotic chromosome condensation(GO:0007076) |
| 0.1 | 0.3 | GO:0010387 | COP9 signalosome assembly(GO:0010387) |
| 0.1 | 5.3 | GO:0006890 | retrograde vesicle-mediated transport, Golgi to ER(GO:0006890) |
| 0.1 | 0.7 | GO:0036444 | calcium ion transmembrane import into mitochondrion(GO:0036444) |
| 0.1 | 0.3 | GO:1904428 | negative regulation of tubulin deacetylation(GO:1904428) |
| 0.1 | 0.1 | GO:0046596 | regulation of viral entry into host cell(GO:0046596) |
| 0.1 | 0.3 | GO:0006177 | GMP biosynthetic process(GO:0006177) |
| 0.1 | 0.2 | GO:0046416 | D-amino acid metabolic process(GO:0046416) |
| 0.1 | 0.1 | GO:0007135 | meiosis II(GO:0007135) |
| 0.1 | 0.3 | GO:0048496 | maintenance of organ identity(GO:0048496) |
| 0.1 | 0.8 | GO:0072307 | metanephric nephron tubule epithelial cell differentiation(GO:0072257) regulation of metanephric nephron tubule epithelial cell differentiation(GO:0072307) |
| 0.1 | 0.4 | GO:0051005 | negative regulation of lipoprotein lipase activity(GO:0051005) |
| 0.1 | 3.2 | GO:0006270 | DNA replication initiation(GO:0006270) |
| 0.1 | 1.1 | GO:0070932 | histone H3 deacetylation(GO:0070932) |
| 0.1 | 0.1 | GO:0006287 | base-excision repair, gap-filling(GO:0006287) |
| 0.1 | 0.7 | GO:0090286 | cytoskeletal anchoring at nuclear membrane(GO:0090286) |
| 0.1 | 1.5 | GO:0048026 | positive regulation of mRNA splicing, via spliceosome(GO:0048026) |
| 0.1 | 0.6 | GO:0006528 | asparagine metabolic process(GO:0006528) |
| 0.1 | 0.3 | GO:0030638 | polyketide metabolic process(GO:0030638) daunorubicin metabolic process(GO:0044597) doxorubicin metabolic process(GO:0044598) |
| 0.1 | 0.4 | GO:0035865 | cellular response to potassium ion(GO:0035865) |
| 0.1 | 0.1 | GO:0050917 | sensory perception of umami taste(GO:0050917) |
| 0.1 | 0.4 | GO:0071394 | cellular response to testosterone stimulus(GO:0071394) |
| 0.1 | 0.3 | GO:0051295 | establishment of meiotic spindle localization(GO:0051295) formin-nucleated actin cable assembly(GO:0070649) |
| 0.1 | 0.3 | GO:0048254 | snoRNA localization(GO:0048254) |
| 0.1 | 0.1 | GO:0044691 | tooth eruption(GO:0044691) |
| 0.1 | 1.1 | GO:0006851 | mitochondrial calcium ion transport(GO:0006851) |
| 0.1 | 2.7 | GO:0000768 | syncytium formation by plasma membrane fusion(GO:0000768) |
| 0.1 | 1.9 | GO:0031572 | G2 DNA damage checkpoint(GO:0031572) |
| 0.1 | 0.3 | GO:0072367 | regulation of lipid transport by regulation of transcription from RNA polymerase II promoter(GO:0072367) |
| 0.1 | 0.2 | GO:0071878 | negative regulation of adrenergic receptor signaling pathway(GO:0071878) |
| 0.1 | 0.4 | GO:0071461 | cellular response to redox state(GO:0071461) |
| 0.1 | 0.3 | GO:1903527 | positive regulation of membrane tubulation(GO:1903527) |
| 0.1 | 0.1 | GO:1901029 | negative regulation of mitochondrial outer membrane permeabilization involved in apoptotic signaling pathway(GO:1901029) |
| 0.1 | 0.1 | GO:0061009 | common bile duct development(GO:0061009) |
| 0.1 | 0.3 | GO:0030238 | male sex determination(GO:0030238) |
| 0.1 | 0.4 | GO:0043316 | cytotoxic T cell degranulation(GO:0043316) regulation of constitutive secretory pathway(GO:1903433) positive regulation of constitutive secretory pathway(GO:1903435) |
| 0.1 | 0.1 | GO:0071677 | positive regulation of mononuclear cell migration(GO:0071677) |
| 0.1 | 0.5 | GO:0060059 | embryonic retina morphogenesis in camera-type eye(GO:0060059) |
| 0.1 | 0.1 | GO:1900126 | negative regulation of hyaluronan biosynthetic process(GO:1900126) |
| 0.1 | 0.3 | GO:0015015 | heparan sulfate proteoglycan biosynthetic process, enzymatic modification(GO:0015015) |
| 0.1 | 0.3 | GO:0045835 | negative regulation of meiotic nuclear division(GO:0045835) |
| 0.1 | 1.6 | GO:0060292 | long term synaptic depression(GO:0060292) |
| 0.1 | 0.2 | GO:0046338 | phosphatidylethanolamine catabolic process(GO:0046338) |
| 0.1 | 0.2 | GO:0046349 | amino sugar biosynthetic process(GO:0046349) |
| 0.1 | 0.1 | GO:0019249 | lactate biosynthetic process(GO:0019249) |
| 0.1 | 0.1 | GO:0031064 | negative regulation of histone deacetylation(GO:0031064) |
| 0.1 | 0.3 | GO:0060221 | retinal rod cell differentiation(GO:0060221) |
| 0.1 | 0.2 | GO:0002184 | cytoplasmic translational termination(GO:0002184) |
| 0.1 | 0.3 | GO:1904783 | positive regulation of NMDA glutamate receptor activity(GO:1904783) |
| 0.1 | 0.2 | GO:0001983 | regulation of systemic arterial blood pressure by carotid sinus baroreceptor feedback(GO:0001978) baroreceptor response to increased systemic arterial blood pressure(GO:0001983) |
| 0.1 | 0.1 | GO:0070072 | proton-transporting V-type ATPase complex assembly(GO:0070070) vacuolar proton-transporting V-type ATPase complex assembly(GO:0070072) |
| 0.1 | 0.4 | GO:0021834 | chemorepulsion involved in embryonic olfactory bulb interneuron precursor migration(GO:0021834) |
| 0.1 | 1.3 | GO:0060539 | diaphragm development(GO:0060539) |
| 0.1 | 1.7 | GO:0046597 | negative regulation of viral entry into host cell(GO:0046597) |
| 0.1 | 0.2 | GO:0034392 | negative regulation of smooth muscle cell apoptotic process(GO:0034392) |
| 0.1 | 0.3 | GO:0060158 | phospholipase C-activating dopamine receptor signaling pathway(GO:0060158) |
| 0.1 | 0.1 | GO:1904885 | beta-catenin destruction complex assembly(GO:1904885) |
| 0.1 | 0.1 | GO:0034164 | negative regulation of toll-like receptor 9 signaling pathway(GO:0034164) |
| 0.1 | 0.2 | GO:0042091 | interleukin-10 biosynthetic process(GO:0042091) regulation of interleukin-10 biosynthetic process(GO:0045074) |
| 0.1 | 0.1 | GO:0097534 | lymphoid lineage cell migration(GO:0097534) lymphoid lineage cell migration into thymus(GO:0097535) |
| 0.1 | 0.1 | GO:0070859 | positive regulation of bile acid biosynthetic process(GO:0070859) positive regulation of bile acid metabolic process(GO:1904253) |
| 0.1 | 0.3 | GO:0017196 | N-terminal peptidyl-methionine acetylation(GO:0017196) |
| 0.1 | 0.2 | GO:0090656 | t-circle formation(GO:0090656) |
| 0.1 | 0.1 | GO:0014724 | regulation of twitch skeletal muscle contraction(GO:0014724) |
| 0.1 | 0.4 | GO:0042539 | hypotonic salinity response(GO:0042539) cellular hypotonic salinity response(GO:0071477) |
| 0.1 | 2.0 | GO:0072378 | blood coagulation, fibrin clot formation(GO:0072378) |
| 0.1 | 0.1 | GO:1903998 | regulation of eating behavior(GO:1903998) |
| 0.1 | 3.9 | GO:1902653 | cholesterol biosynthetic process(GO:0006695) secondary alcohol biosynthetic process(GO:1902653) |
| 0.1 | 0.1 | GO:2000170 | positive regulation of peptidyl-cysteine S-nitrosylation(GO:2000170) |
| 0.1 | 0.2 | GO:0002925 | positive regulation of humoral immune response mediated by circulating immunoglobulin(GO:0002925) |
| 0.1 | 0.3 | GO:0015985 | energy coupled proton transport, down electrochemical gradient(GO:0015985) ATP synthesis coupled proton transport(GO:0015986) |
| 0.1 | 0.2 | GO:0010756 | positive regulation of plasminogen activation(GO:0010756) |
| 0.1 | 0.2 | GO:0046322 | negative regulation of fatty acid oxidation(GO:0046322) |
| 0.1 | 0.1 | GO:0006294 | nucleotide-excision repair, preincision complex assembly(GO:0006294) |
| 0.1 | 1.4 | GO:0006607 | NLS-bearing protein import into nucleus(GO:0006607) |
| 0.1 | 0.2 | GO:2000616 | negative regulation of histone H3-K9 acetylation(GO:2000616) |
| 0.1 | 0.1 | GO:2000301 | negative regulation of synaptic vesicle exocytosis(GO:2000301) |
| 0.1 | 0.2 | GO:0001826 | inner cell mass cell differentiation(GO:0001826) |
| 0.1 | 0.1 | GO:1901668 | regulation of superoxide dismutase activity(GO:1901668) |
| 0.1 | 0.2 | GO:2000035 | regulation of stem cell division(GO:2000035) |
| 0.1 | 0.7 | GO:0006285 | base-excision repair, AP site formation(GO:0006285) |
| 0.1 | 0.2 | GO:0061624 | fructose catabolic process(GO:0006001) fructose catabolic process to hydroxyacetone phosphate and glyceraldehyde-3-phosphate(GO:0061624) |
| 0.1 | 0.8 | GO:0048227 | plasma membrane to endosome transport(GO:0048227) |
| 0.1 | 0.4 | GO:0051013 | microtubule severing(GO:0051013) |
| 0.1 | 0.3 | GO:1904354 | negative regulation of telomere capping(GO:1904354) |
| 0.1 | 0.4 | GO:0033131 | regulation of glucokinase activity(GO:0033131) negative regulation of glucokinase activity(GO:0033132) regulation of hexokinase activity(GO:1903299) negative regulation of hexokinase activity(GO:1903300) |
| 0.1 | 0.1 | GO:0060932 | cardiac pacemaker cell development(GO:0060926) sinoatrial node cell development(GO:0060931) His-Purkinje system cell differentiation(GO:0060932) |
| 0.1 | 0.2 | GO:0008616 | queuosine biosynthetic process(GO:0008616) queuosine metabolic process(GO:0046116) |
| 0.1 | 9.4 | GO:0007286 | spermatid development(GO:0007286) |
| 0.1 | 0.2 | GO:1902630 | regulation of membrane hyperpolarization(GO:1902630) |
| 0.1 | 0.1 | GO:0044313 | protein K6-linked deubiquitination(GO:0044313) |
| 0.1 | 0.1 | GO:0006264 | mitochondrial DNA replication(GO:0006264) |
| 0.1 | 2.6 | GO:0007339 | binding of sperm to zona pellucida(GO:0007339) |
| 0.1 | 1.5 | GO:0060765 | regulation of androgen receptor signaling pathway(GO:0060765) |
| 0.1 | 0.3 | GO:0071898 | regulation of estrogen receptor binding(GO:0071898) negative regulation of estrogen receptor binding(GO:0071899) |
| 0.1 | 0.7 | GO:1902514 | regulation of calcium ion transmembrane transport via high voltage-gated calcium channel(GO:1902514) |
| 0.1 | 0.1 | GO:0021539 | subthalamus development(GO:0021539) |
| 0.1 | 0.1 | GO:0032011 | ARF protein signal transduction(GO:0032011) |
| 0.1 | 0.5 | GO:0090625 | mRNA cleavage involved in gene silencing by siRNA(GO:0090625) |
| 0.1 | 1.5 | GO:0044458 | motile cilium assembly(GO:0044458) |
| 0.1 | 0.2 | GO:0038060 | nitric oxide-cGMP-mediated signaling pathway(GO:0038060) |
| 0.1 | 0.2 | GO:0034316 | negative regulation of Arp2/3 complex-mediated actin nucleation(GO:0034316) |
| 0.1 | 0.5 | GO:0010288 | response to lead ion(GO:0010288) |
| 0.1 | 0.1 | GO:1900222 | negative regulation of beta-amyloid clearance(GO:1900222) |
| 0.1 | 0.3 | GO:0036123 | histone H3-K9 dimethylation(GO:0036123) |
| 0.1 | 0.3 | GO:0060136 | embryonic process involved in female pregnancy(GO:0060136) |
| 0.1 | 0.3 | GO:0097070 | ductus arteriosus closure(GO:0097070) |
| 0.1 | 0.3 | GO:0097039 | protein linear polyubiquitination(GO:0097039) |
| 0.1 | 0.9 | GO:0090084 | negative regulation of inclusion body assembly(GO:0090084) |
| 0.1 | 0.9 | GO:0043248 | proteasome assembly(GO:0043248) |
| 0.1 | 0.3 | GO:0043951 | negative regulation of cAMP-mediated signaling(GO:0043951) |
| 0.1 | 0.4 | GO:0045086 | positive regulation of interleukin-2 biosynthetic process(GO:0045086) |
| 0.1 | 0.4 | GO:2000270 | negative regulation of fibroblast apoptotic process(GO:2000270) |
| 0.1 | 0.2 | GO:0036233 | glycine import(GO:0036233) |
| 0.1 | 0.2 | GO:0071963 | establishment or maintenance of cell polarity regulating cell shape(GO:0071963) |
| 0.1 | 0.6 | GO:0034755 | iron ion transmembrane transport(GO:0034755) |
| 0.1 | 0.1 | GO:0070221 | sulfide oxidation(GO:0019418) sulfide oxidation, using sulfide:quinone oxidoreductase(GO:0070221) |
| 0.1 | 0.2 | GO:0030070 | insulin processing(GO:0030070) |
| 0.1 | 0.4 | GO:0030422 | production of siRNA involved in RNA interference(GO:0030422) |
| 0.1 | 0.2 | GO:0098974 | postsynaptic actin cytoskeleton organization(GO:0098974) |
| 0.1 | 0.2 | GO:0045065 | cytotoxic T cell differentiation(GO:0045065) |
| 0.1 | 4.4 | GO:0007052 | mitotic spindle organization(GO:0007052) |
| 0.1 | 0.1 | GO:0033184 | positive regulation of histone ubiquitination(GO:0033184) regulation of histone H2B ubiquitination(GO:2001166) positive regulation of histone H2B ubiquitination(GO:2001168) |
| 0.1 | 0.1 | GO:0033091 | positive regulation of immature T cell proliferation(GO:0033091) |
| 0.1 | 0.2 | GO:0048743 | positive regulation of skeletal muscle fiber development(GO:0048743) |
| 0.1 | 3.0 | GO:0043966 | histone H3 acetylation(GO:0043966) |
| 0.1 | 0.3 | GO:0060297 | regulation of sarcomere organization(GO:0060297) |
| 0.1 | 0.9 | GO:0071539 | protein localization to centrosome(GO:0071539) |
| 0.1 | 0.2 | GO:0031573 | intra-S DNA damage checkpoint(GO:0031573) |
| 0.1 | 0.3 | GO:0052055 | modulation by symbiont of host molecular function(GO:0052055) modulation of catalytic activity in other organism involved in symbiotic interaction(GO:0052203) modulation by host of symbiont catalytic activity(GO:0052422) |
| 0.1 | 1.2 | GO:0046337 | phosphatidylethanolamine metabolic process(GO:0046337) |
| 0.1 | 2.6 | GO:0043171 | peptide catabolic process(GO:0043171) |
| 0.1 | 0.2 | GO:0060316 | positive regulation of ryanodine-sensitive calcium-release channel activity(GO:0060316) |
| 0.1 | 0.4 | GO:0046485 | ether lipid metabolic process(GO:0046485) |
| 0.1 | 0.2 | GO:1904252 | negative regulation of bile acid biosynthetic process(GO:0070858) negative regulation of bile acid metabolic process(GO:1904252) |
| 0.1 | 2.2 | GO:0010501 | RNA secondary structure unwinding(GO:0010501) |
| 0.1 | 0.4 | GO:0098840 | protein transport along microtubule(GO:0098840) |
| 0.1 | 2.0 | GO:0045879 | negative regulation of smoothened signaling pathway(GO:0045879) |
| 0.1 | 0.6 | GO:0071787 | endoplasmic reticulum tubular network assembly(GO:0071787) |
| 0.1 | 1.1 | GO:1901799 | negative regulation of proteasomal protein catabolic process(GO:1901799) |
| 0.1 | 0.1 | GO:0000350 | generation of catalytic spliceosome for second transesterification step(GO:0000350) |
| 0.1 | 0.2 | GO:0060628 | regulation of ER to Golgi vesicle-mediated transport(GO:0060628) |
| 0.1 | 0.3 | GO:0006284 | base-excision repair(GO:0006284) |
| 0.1 | 0.2 | GO:0036079 | GDP-fucose transport(GO:0015783) purine nucleotide-sugar transport(GO:0036079) |
| 0.1 | 0.2 | GO:0015838 | amino-acid betaine transport(GO:0015838) |
| 0.1 | 0.7 | GO:0097435 | fibril organization(GO:0097435) |
| 0.1 | 0.2 | GO:0097112 | gamma-aminobutyric acid receptor clustering(GO:0097112) |
| 0.1 | 0.5 | GO:0043985 | histone H4-R3 methylation(GO:0043985) |
| 0.1 | 0.4 | GO:0001672 | regulation of chromatin assembly or disassembly(GO:0001672) |
| 0.0 | 0.1 | GO:0021849 | neuroblast division in subventricular zone(GO:0021849) |
| 0.0 | 0.1 | GO:0045836 | positive regulation of meiotic nuclear division(GO:0045836) |
| 0.0 | 0.2 | GO:0019276 | UDP-N-acetylgalactosamine metabolic process(GO:0019276) |
| 0.0 | 0.0 | GO:0036245 | cellular response to menadione(GO:0036245) |
| 0.0 | 0.1 | GO:0046586 | regulation of calcium-dependent cell-cell adhesion(GO:0046586) |
| 0.0 | 0.1 | GO:1900191 | biofilm formation(GO:0042710) single-species biofilm formation(GO:0044010) single-species biofilm formation in or on host organism(GO:0044407) regulation of single-species biofilm formation(GO:1900190) negative regulation of single-species biofilm formation(GO:1900191) regulation of single-species biofilm formation in or on host organism(GO:1900228) negative regulation of single-species biofilm formation in or on host organism(GO:1900229) |
| 0.0 | 0.0 | GO:0007113 | endomitotic cell cycle(GO:0007113) |
| 0.0 | 0.2 | GO:0045060 | negative thymic T cell selection(GO:0045060) |
| 0.0 | 0.2 | GO:0035977 | protein deglycosylation involved in glycoprotein catabolic process(GO:0035977) glycoprotein ERAD pathway(GO:0097466) mannose trimming involved in glycoprotein ERAD pathway(GO:1904382) |
| 0.0 | 0.1 | GO:2000574 | regulation of microtubule motor activity(GO:2000574) |
| 0.0 | 1.9 | GO:0061620 | NADH regeneration(GO:0006735) glycolytic process through fructose-6-phosphate(GO:0061615) glycolytic process through glucose-6-phosphate(GO:0061620) canonical glycolysis(GO:0061621) glucose catabolic process to pyruvate(GO:0061718) |
| 0.0 | 1.4 | GO:0071431 | tRNA export from nucleus(GO:0006409) tRNA-containing ribonucleoprotein complex export from nucleus(GO:0071431) |
| 0.0 | 0.1 | GO:0002572 | pro-T cell differentiation(GO:0002572) |
| 0.0 | 0.0 | GO:0016576 | histone dephosphorylation(GO:0016576) |
| 0.0 | 0.1 | GO:0075044 | autophagy of host cells involved in interaction with symbiont(GO:0075044) autophagy involved in symbiotic interaction(GO:0075071) |
| 0.0 | 0.3 | GO:1901374 | acetate ester transport(GO:1901374) |
| 0.0 | 0.2 | GO:0000301 | retrograde transport, vesicle recycling within Golgi(GO:0000301) |
| 0.0 | 0.4 | GO:0008343 | adult feeding behavior(GO:0008343) |
| 0.0 | 0.3 | GO:0060613 | fat pad development(GO:0060613) |
| 0.0 | 0.1 | GO:0030806 | negative regulation of cyclic nucleotide catabolic process(GO:0030806) negative regulation of cAMP catabolic process(GO:0030821) negative regulation of purine nucleotide catabolic process(GO:0033122) |
| 0.0 | 1.0 | GO:0006517 | protein deglycosylation(GO:0006517) |
| 0.0 | 0.1 | GO:0034695 | response to prostaglandin E(GO:0034695) |
| 0.0 | 0.5 | GO:0030050 | vesicle transport along actin filament(GO:0030050) |
| 0.0 | 0.4 | GO:0060159 | regulation of dopamine receptor signaling pathway(GO:0060159) |
| 0.0 | 0.1 | GO:0019878 | lysine biosynthetic process(GO:0009085) lysine biosynthetic process via aminoadipic acid(GO:0019878) |
| 0.0 | 0.0 | GO:0006490 | oligosaccharide-lipid intermediate biosynthetic process(GO:0006490) |
| 0.0 | 0.9 | GO:0043949 | regulation of cAMP-mediated signaling(GO:0043949) |
| 0.0 | 0.5 | GO:0070389 | chaperone cofactor-dependent protein refolding(GO:0070389) |
| 0.0 | 0.1 | GO:0007089 | traversing start control point of mitotic cell cycle(GO:0007089) |
| 0.0 | 0.3 | GO:0007549 | dosage compensation(GO:0007549) dosage compensation by inactivation of X chromosome(GO:0009048) |
| 0.0 | 0.1 | GO:0046356 | acetyl-CoA catabolic process(GO:0046356) |
| 0.0 | 0.1 | GO:0006041 | glucosamine metabolic process(GO:0006041) |
| 0.0 | 0.1 | GO:0090080 | positive regulation of MAPKKK cascade by fibroblast growth factor receptor signaling pathway(GO:0090080) |
| 0.0 | 0.0 | GO:0061316 | canonical Wnt signaling pathway involved in heart development(GO:0061316) canonical Wnt signaling pathway involved in cardiac muscle cell fate commitment(GO:0061317) |
| 0.0 | 0.2 | GO:0036116 | medium-chain fatty-acyl-CoA catabolic process(GO:0036114) long-chain fatty-acyl-CoA catabolic process(GO:0036116) palmitic acid metabolic process(GO:1900533) palmitic acid biosynthetic process(GO:1900535) |
| 0.0 | 0.4 | GO:0006659 | phosphatidylserine biosynthetic process(GO:0006659) |
| 0.0 | 0.0 | GO:1901858 | regulation of mitochondrial DNA metabolic process(GO:1901858) |
| 0.0 | 0.2 | GO:0035513 | oxidative RNA demethylation(GO:0035513) oxidative single-stranded RNA demethylation(GO:0035553) |
| 0.0 | 0.2 | GO:0006449 | regulation of translational termination(GO:0006449) |
| 0.0 | 0.7 | GO:0031116 | positive regulation of microtubule polymerization(GO:0031116) |
| 0.0 | 0.6 | GO:1904424 | regulation of GTP binding(GO:1904424) |
| 0.0 | 1.2 | GO:0051225 | spindle assembly(GO:0051225) |
| 0.0 | 0.3 | GO:0032057 | negative regulation of translational initiation in response to stress(GO:0032057) |
| 0.0 | 0.2 | GO:0045872 | regulation of rhodopsin gene expression(GO:0007468) positive regulation of rhodopsin gene expression(GO:0045872) |
| 0.0 | 1.1 | GO:0032467 | positive regulation of cytokinesis(GO:0032467) |
| 0.0 | 0.3 | GO:0032914 | positive regulation of transforming growth factor beta1 production(GO:0032914) |
| 0.0 | 0.3 | GO:1900383 | regulation of synaptic plasticity by receptor localization to synapse(GO:1900383) |
| 0.0 | 0.2 | GO:0090394 | negative regulation of excitatory postsynaptic potential(GO:0090394) |
| 0.0 | 2.2 | GO:0007214 | gamma-aminobutyric acid signaling pathway(GO:0007214) |
| 0.0 | 0.1 | GO:0045005 | DNA-dependent DNA replication maintenance of fidelity(GO:0045005) |
| 0.0 | 0.1 | GO:2000644 | regulation of receptor catabolic process(GO:2000644) |
| 0.0 | 0.1 | GO:1990022 | RNA polymerase II complex import to nucleus(GO:0044376) RNA polymerase III complex localization to nucleus(GO:1990022) |
| 0.0 | 0.4 | GO:0070862 | negative regulation of protein exit from endoplasmic reticulum(GO:0070862) negative regulation of retrograde protein transport, ER to cytosol(GO:1904153) |
| 0.0 | 0.4 | GO:0021534 | cell proliferation in hindbrain(GO:0021534) |
| 0.0 | 0.1 | GO:1900113 | negative regulation of histone H3-K9 trimethylation(GO:1900113) |
| 0.0 | 0.1 | GO:0046325 | negative regulation of glucose import(GO:0046325) |
| 0.0 | 0.9 | GO:0044065 | regulation of respiratory system process(GO:0044065) |
| 0.0 | 0.2 | GO:1903361 | protein localization to basolateral plasma membrane(GO:1903361) |
| 0.0 | 0.3 | GO:0035814 | negative regulation of renal sodium excretion(GO:0035814) |
| 0.0 | 2.0 | GO:0032392 | DNA geometric change(GO:0032392) |
| 0.0 | 0.1 | GO:0021503 | neural fold bending(GO:0021503) |
| 0.0 | 2.5 | GO:0042147 | retrograde transport, endosome to Golgi(GO:0042147) |
| 0.0 | 0.1 | GO:0036451 | cap mRNA methylation(GO:0036451) |
| 0.0 | 0.2 | GO:0019336 | phenol-containing compound catabolic process(GO:0019336) |
| 0.0 | 0.3 | GO:0072502 | cellular phosphate ion homeostasis(GO:0030643) cellular divalent inorganic anion homeostasis(GO:0072501) cellular trivalent inorganic anion homeostasis(GO:0072502) |
| 0.0 | 0.1 | GO:0050968 | detection of chemical stimulus involved in sensory perception of pain(GO:0050968) |
| 0.0 | 0.1 | GO:0017185 | peptidyl-lysine hydroxylation(GO:0017185) |
| 0.0 | 0.1 | GO:0097698 | base-excision repair, base-free sugar-phosphate removal(GO:0006286) telomere maintenance via base-excision repair(GO:0097698) |
| 0.0 | 0.2 | GO:0071651 | positive regulation of chemokine (C-C motif) ligand 5 production(GO:0071651) |
| 0.0 | 0.2 | GO:0019856 | 'de novo' pyrimidine nucleobase biosynthetic process(GO:0006207) pyrimidine nucleobase biosynthetic process(GO:0019856) |
| 0.0 | 1.2 | GO:0006376 | mRNA splice site selection(GO:0006376) |
| 0.0 | 0.2 | GO:0038030 | non-canonical Wnt signaling pathway via MAPK cascade(GO:0038030) |
| 0.0 | 0.0 | GO:0000733 | DNA strand renaturation(GO:0000733) |
| 0.0 | 0.1 | GO:0045113 | integrin biosynthetic process(GO:0045112) regulation of integrin biosynthetic process(GO:0045113) |
| 0.0 | 1.2 | GO:0001578 | microtubule bundle formation(GO:0001578) |
| 0.0 | 1.4 | GO:1901099 | negative regulation of signal transduction in absence of ligand(GO:1901099) negative regulation of extrinsic apoptotic signaling pathway in absence of ligand(GO:2001240) |
| 0.0 | 0.7 | GO:0006895 | Golgi to endosome transport(GO:0006895) |
| 0.0 | 0.1 | GO:0015746 | tricarboxylic acid transport(GO:0006842) citrate transport(GO:0015746) |
| 0.0 | 0.1 | GO:0048478 | replication fork protection(GO:0048478) |
| 0.0 | 0.1 | GO:1903376 | neuron intrinsic apoptotic signaling pathway in response to oxidative stress(GO:0036480) regulation of oxidative stress-induced neuron intrinsic apoptotic signaling pathway(GO:1903376) |
| 0.0 | 0.3 | GO:1904627 | response to phorbol 13-acetate 12-myristate(GO:1904627) cellular response to phorbol 13-acetate 12-myristate(GO:1904628) |
| 0.0 | 0.2 | GO:0045634 | regulation of melanocyte differentiation(GO:0045634) |
| 0.0 | 0.2 | GO:0031914 | negative regulation of synaptic plasticity(GO:0031914) |
| 0.0 | 0.0 | GO:1904933 | regulation of cell proliferation in midbrain(GO:1904933) |
| 0.0 | 0.2 | GO:0071157 | negative regulation of cell cycle arrest(GO:0071157) |
| 0.0 | 0.1 | GO:1904717 | excitatory chemical synaptic transmission(GO:0098976) regulation of AMPA glutamate receptor clustering(GO:1904717) positive regulation of AMPA glutamate receptor clustering(GO:1904719) |
| 0.0 | 0.3 | GO:0032486 | Rap protein signal transduction(GO:0032486) |
| 0.0 | 0.1 | GO:0018312 | peptidyl-serine ADP-ribosylation(GO:0018312) |
| 0.0 | 0.2 | GO:0006102 | isocitrate metabolic process(GO:0006102) |
| 0.0 | 7.1 | GO:0060271 | cilium morphogenesis(GO:0060271) |
| 0.0 | 1.2 | GO:0000725 | recombinational repair(GO:0000725) |
| 0.0 | 0.1 | GO:0018201 | peptidyl-glycine modification(GO:0018201) |
| 0.0 | 0.2 | GO:0032581 | ER-dependent peroxisome organization(GO:0032581) |
| 0.0 | 0.1 | GO:0031247 | actin rod assembly(GO:0031247) |
| 0.0 | 0.3 | GO:1900364 | negative regulation of mRNA polyadenylation(GO:1900364) |
| 0.0 | 0.0 | GO:0000722 | telomere maintenance via recombination(GO:0000722) |
| 0.0 | 0.6 | GO:0043162 | ubiquitin-dependent protein catabolic process via the multivesicular body sorting pathway(GO:0043162) |
| 0.0 | 1.4 | GO:0070979 | protein K11-linked ubiquitination(GO:0070979) |
| 0.0 | 0.1 | GO:1905244 | regulation of modification of synaptic structure(GO:1905244) |
| 0.0 | 0.2 | GO:0043128 | regulation of 1-phosphatidylinositol 4-kinase activity(GO:0043126) positive regulation of 1-phosphatidylinositol 4-kinase activity(GO:0043128) |
| 0.0 | 0.9 | GO:0045948 | positive regulation of translational initiation(GO:0045948) |
| 0.0 | 0.1 | GO:0008215 | spermine metabolic process(GO:0008215) |
| 0.0 | 0.3 | GO:0045919 | positive regulation of cytolysis(GO:0045919) |
| 0.0 | 0.0 | GO:0080154 | regulation of fertilization(GO:0080154) |
| 0.0 | 0.1 | GO:0045084 | positive regulation of interleukin-12 biosynthetic process(GO:0045084) |
| 0.0 | 0.1 | GO:0006990 | positive regulation of transcription from RNA polymerase II promoter involved in unfolded protein response(GO:0006990) |
| 0.0 | 0.2 | GO:0051697 | protein delipidation(GO:0051697) |
| 0.0 | 0.0 | GO:2000705 | dense core granule biogenesis(GO:0061110) regulation of dense core granule biogenesis(GO:2000705) |
| 0.0 | 0.0 | GO:1904338 | regulation of dopaminergic neuron differentiation(GO:1904338) |
| 0.0 | 0.8 | GO:0097066 | response to thyroid hormone(GO:0097066) |
| 0.0 | 0.1 | GO:0034384 | high-density lipoprotein particle clearance(GO:0034384) |
| 0.0 | 0.0 | GO:0031548 | regulation of brain-derived neurotrophic factor receptor signaling pathway(GO:0031548) |
| 0.0 | 2.3 | GO:0010508 | positive regulation of autophagy(GO:0010508) |
| 0.0 | 0.4 | GO:0042276 | error-prone translesion synthesis(GO:0042276) |
| 0.0 | 0.1 | GO:1902255 | positive regulation of intrinsic apoptotic signaling pathway by p53 class mediator(GO:1902255) |
| 0.0 | 0.4 | GO:0000290 | deadenylation-dependent decapping of nuclear-transcribed mRNA(GO:0000290) |
| 0.0 | 1.1 | GO:0006706 | steroid catabolic process(GO:0006706) |
| 0.0 | 0.3 | GO:0033120 | positive regulation of RNA splicing(GO:0033120) |
| 0.0 | 0.8 | GO:0009235 | cobalamin metabolic process(GO:0009235) |
| 0.0 | 0.1 | GO:0035261 | external genitalia morphogenesis(GO:0035261) |
| 0.0 | 0.2 | GO:0042364 | water-soluble vitamin biosynthetic process(GO:0042364) |
| 0.0 | 0.1 | GO:0060263 | regulation of respiratory burst(GO:0060263) |
| 0.0 | 0.1 | GO:1904100 | regulation of protein O-linked glycosylation(GO:1904098) positive regulation of protein O-linked glycosylation(GO:1904100) |
| 0.0 | 0.1 | GO:1902075 | cellular response to salt(GO:1902075) |
| 0.0 | 0.4 | GO:0033234 | negative regulation of protein sumoylation(GO:0033234) |
| 0.0 | 0.5 | GO:0097354 | protein prenylation(GO:0018342) prenylation(GO:0097354) |
| 0.0 | 0.1 | GO:0003050 | regulation of systemic arterial blood pressure by atrial natriuretic peptide(GO:0003050) |
| 0.0 | 0.1 | GO:0042494 | detection of bacterial lipoprotein(GO:0042494) |
| 0.0 | 0.1 | GO:0061357 | positive regulation of Wnt protein secretion(GO:0061357) |
| 0.0 | 0.1 | GO:0030321 | transepithelial chloride transport(GO:0030321) |
| 0.0 | 0.1 | GO:0060126 | somatotropin secreting cell differentiation(GO:0060126) somatotropin secreting cell development(GO:0060133) |
| 0.0 | 0.2 | GO:0071985 | multivesicular body sorting pathway(GO:0071985) |
| 0.0 | 0.9 | GO:1904659 | hexose transmembrane transport(GO:0035428) glucose transmembrane transport(GO:1904659) |
| 0.0 | 0.3 | GO:0034035 | purine ribonucleoside bisphosphate metabolic process(GO:0034035) 3'-phosphoadenosine 5'-phosphosulfate metabolic process(GO:0050427) |
| 0.0 | 0.0 | GO:0019852 | L-ascorbic acid metabolic process(GO:0019852) |
| 0.0 | 0.0 | GO:0060435 | bronchiole development(GO:0060435) |
| 0.0 | 0.4 | GO:0043691 | reverse cholesterol transport(GO:0043691) |
| 0.0 | 0.2 | GO:0006420 | arginyl-tRNA aminoacylation(GO:0006420) |
| 0.0 | 0.5 | GO:0051560 | mitochondrial calcium ion homeostasis(GO:0051560) |
| 0.0 | 0.2 | GO:0051775 | response to redox state(GO:0051775) |
| 0.0 | 0.2 | GO:0090190 | positive regulation of branching involved in ureteric bud morphogenesis(GO:0090190) |
| 0.0 | 0.1 | GO:0072069 | DCT cell differentiation(GO:0072069) metanephric DCT cell differentiation(GO:0072240) |
| 0.0 | 0.4 | GO:0036475 | neuron death in response to oxidative stress(GO:0036475) |
| 0.0 | 0.1 | GO:0050893 | sensory processing(GO:0050893) |
| 0.0 | 0.1 | GO:0015891 | iron chelate transport(GO:0015688) siderophore transport(GO:0015891) |
| 0.0 | 0.4 | GO:0044342 | type B pancreatic cell proliferation(GO:0044342) |
| 0.0 | 0.1 | GO:0060480 | lung goblet cell differentiation(GO:0060480) |
| 0.0 | 0.3 | GO:0036257 | multivesicular body organization(GO:0036257) |
| 0.0 | 0.0 | GO:0051389 | inactivation of MAPKK activity(GO:0051389) |
| 0.0 | 0.1 | GO:1901387 | positive regulation of voltage-gated calcium channel activity(GO:1901387) |
| 0.0 | 0.0 | GO:0018307 | enzyme active site formation(GO:0018307) |
| 0.0 | 0.1 | GO:2000196 | positive regulation of female gonad development(GO:2000196) |
| 0.0 | 0.1 | GO:0051344 | negative regulation of cyclic-nucleotide phosphodiesterase activity(GO:0051344) |
| 0.0 | 0.2 | GO:0010992 | ubiquitin homeostasis(GO:0010992) |
| 0.0 | 0.3 | GO:0001996 | positive regulation of heart rate by epinephrine-norepinephrine(GO:0001996) |
| 0.0 | 1.7 | GO:0006334 | nucleosome assembly(GO:0006334) |
| 0.0 | 0.1 | GO:0051383 | kinetochore organization(GO:0051383) |
| 0.0 | 0.4 | GO:0090141 | positive regulation of mitochondrial fission(GO:0090141) |
| 0.0 | 0.1 | GO:0060573 | ventral spinal cord interneuron specification(GO:0021521) cell fate specification involved in pattern specification(GO:0060573) |
| 0.0 | 0.1 | GO:0002191 | cap-dependent translational initiation(GO:0002191) |
| 0.0 | 0.0 | GO:0019482 | beta-alanine metabolic process(GO:0019482) |
| 0.0 | 0.1 | GO:0046340 | diacylglycerol catabolic process(GO:0046340) |
| 0.0 | 0.2 | GO:0033539 | fatty acid beta-oxidation using acyl-CoA dehydrogenase(GO:0033539) |
| 0.0 | 0.1 | GO:0002071 | glandular epithelial cell maturation(GO:0002071) |
| 0.0 | 0.4 | GO:0048011 | neurotrophin TRK receptor signaling pathway(GO:0048011) |
| 0.0 | 0.4 | GO:2001199 | negative regulation of dendritic cell differentiation(GO:2001199) |
| 0.0 | 0.0 | GO:1902445 | regulation of mitochondrial membrane permeability involved in programmed necrotic cell death(GO:1902445) |
| 0.0 | 0.1 | GO:2001013 | epithelial cell proliferation involved in renal tubule morphogenesis(GO:2001013) |
| 0.0 | 0.1 | GO:0007097 | nuclear migration(GO:0007097) |
| 0.0 | 1.4 | GO:0007062 | sister chromatid cohesion(GO:0007062) |
| 0.0 | 0.1 | GO:1902283 | negative regulation of primary amine oxidase activity(GO:1902283) |
| 0.0 | 0.3 | GO:0034162 | toll-like receptor 9 signaling pathway(GO:0034162) |
| 0.0 | 0.5 | GO:0060325 | face morphogenesis(GO:0060325) |
| 0.0 | 0.2 | GO:0014052 | regulation of gamma-aminobutyric acid secretion(GO:0014052) |
| 0.0 | 0.1 | GO:0060040 | retinal bipolar neuron differentiation(GO:0060040) |
| 0.0 | 0.3 | GO:0002175 | protein localization to paranode region of axon(GO:0002175) |
| 0.0 | 0.0 | GO:0099587 | inorganic cation import into cell(GO:0098659) inorganic ion import into cell(GO:0099587) |
| 0.0 | 0.1 | GO:1990416 | cellular response to brain-derived neurotrophic factor stimulus(GO:1990416) |
| 0.0 | 0.0 | GO:0010225 | response to UV-C(GO:0010225) |
| 0.0 | 0.3 | GO:0035970 | peptidyl-threonine dephosphorylation(GO:0035970) |
| 0.0 | 0.0 | GO:0060456 | positive regulation of digestive system process(GO:0060456) |
| 0.0 | 0.3 | GO:0046085 | adenosine metabolic process(GO:0046085) |
| 0.0 | 0.5 | GO:0003322 | pancreatic A cell development(GO:0003322) |
| 0.0 | 0.1 | GO:0051866 | general adaptation syndrome(GO:0051866) |
| 0.0 | 0.1 | GO:0090107 | regulation of high-density lipoprotein particle assembly(GO:0090107) |
| 0.0 | 0.2 | GO:0071763 | nuclear membrane organization(GO:0071763) |
| 0.0 | 0.3 | GO:0000715 | nucleotide-excision repair, DNA damage recognition(GO:0000715) |
| 0.0 | 0.1 | GO:0010624 | regulation of Schwann cell proliferation(GO:0010624) negative regulation of Schwann cell proliferation(GO:0010626) |
| 0.0 | 0.1 | GO:1903385 | regulation of homophilic cell adhesion(GO:1903385) |
| 0.0 | 0.1 | GO:0006216 | cytidine catabolic process(GO:0006216) cytidine deamination(GO:0009972) cytidine metabolic process(GO:0046087) |
| 0.0 | 0.1 | GO:0048484 | enteric nervous system development(GO:0048484) |
| 0.0 | 0.3 | GO:0034033 | nucleoside bisphosphate biosynthetic process(GO:0033866) ribonucleoside bisphosphate biosynthetic process(GO:0034030) purine nucleoside bisphosphate biosynthetic process(GO:0034033) |
| 0.0 | 0.2 | GO:0010459 | negative regulation of heart rate(GO:0010459) |
| 0.0 | 0.1 | GO:0007619 | courtship behavior(GO:0007619) |
| 0.0 | 0.0 | GO:0045077 | negative regulation of interferon-gamma biosynthetic process(GO:0045077) |
| 0.0 | 0.2 | GO:0034154 | toll-like receptor 7 signaling pathway(GO:0034154) |
| 0.0 | 0.1 | GO:0098746 | fast, calcium ion-dependent exocytosis of neurotransmitter(GO:0098746) |
| 0.0 | 0.1 | GO:0070940 | dephosphorylation of RNA polymerase II C-terminal domain(GO:0070940) |
| 0.0 | 0.1 | GO:0032571 | response to vitamin K(GO:0032571) |
| 0.0 | 0.8 | GO:0051496 | positive regulation of stress fiber assembly(GO:0051496) |
| 0.0 | 0.0 | GO:0060300 | regulation of cytokine activity(GO:0060300) |
| 0.0 | 0.1 | GO:0061343 | cell adhesion involved in heart morphogenesis(GO:0061343) |
| 0.0 | 0.1 | GO:0010643 | cell communication by chemical coupling(GO:0010643) |
| 0.0 | 0.1 | GO:0002414 | immunoglobulin transcytosis in epithelial cells(GO:0002414) |
| 0.0 | 0.1 | GO:1902463 | protein localization to cell leading edge(GO:1902463) |
| 0.0 | 0.1 | GO:0051563 | smooth endoplasmic reticulum calcium ion homeostasis(GO:0051563) |
| 0.0 | 0.6 | GO:0042133 | neurotransmitter metabolic process(GO:0042133) |
| 0.0 | 0.2 | GO:0006891 | intra-Golgi vesicle-mediated transport(GO:0006891) |
| 0.0 | 0.6 | GO:0001937 | negative regulation of endothelial cell proliferation(GO:0001937) |
| 0.0 | 0.1 | GO:0046952 | ketone body catabolic process(GO:0046952) |
| 0.0 | 1.7 | GO:0006910 | phagocytosis, recognition(GO:0006910) |
| 0.0 | 0.1 | GO:0038178 | complement component C5a signaling pathway(GO:0038178) |
| 0.0 | 0.1 | GO:0071712 | ER-associated misfolded protein catabolic process(GO:0071712) |
| 0.0 | 0.0 | GO:0070365 | hepatocyte differentiation(GO:0070365) |
| 0.0 | 0.1 | GO:0015722 | canalicular bile acid transport(GO:0015722) |
| 0.0 | 0.6 | GO:0034314 | Arp2/3 complex-mediated actin nucleation(GO:0034314) |
| 0.0 | 0.2 | GO:0006983 | ER overload response(GO:0006983) |
| 0.0 | 0.1 | GO:0007494 | midgut development(GO:0007494) |
| 0.0 | 0.0 | GO:0046487 | glyoxylate metabolic process(GO:0046487) |
| 0.0 | 0.0 | GO:1902774 | late endosome to lysosome transport(GO:1902774) |
| 0.0 | 0.1 | GO:0031053 | primary miRNA processing(GO:0031053) |
| 0.0 | 0.2 | GO:0071397 | cellular response to cholesterol(GO:0071397) |
| 0.0 | 0.0 | GO:0061364 | apoptotic process involved in luteolysis(GO:0061364) |
| 0.0 | 0.0 | GO:1902093 | positive regulation of sperm motility(GO:1902093) |
| 0.0 | 0.1 | GO:0035112 | genitalia morphogenesis(GO:0035112) |
| 0.0 | 0.6 | GO:0044275 | cellular carbohydrate catabolic process(GO:0044275) |
| 0.0 | 0.5 | GO:0051764 | actin crosslink formation(GO:0051764) |
| 0.0 | 0.0 | GO:0000965 | mitochondrial RNA 3'-end processing(GO:0000965) |
| 0.0 | 0.0 | GO:0006007 | glucose catabolic process(GO:0006007) |
| 0.0 | 0.0 | GO:0097167 | circadian regulation of translation(GO:0097167) |
| 0.0 | 0.1 | GO:2000152 | regulation of ubiquitin-specific protease activity(GO:2000152) positive regulation of ubiquitin-specific protease activity(GO:2000158) |
| 0.0 | 0.0 | GO:2000275 | regulation of oxidative phosphorylation uncoupler activity(GO:2000275) |
| 0.0 | 0.1 | GO:0061470 | T follicular helper cell differentiation(GO:0061470) |
| 0.0 | 0.2 | GO:0006189 | 'de novo' IMP biosynthetic process(GO:0006189) |
| 0.0 | 0.0 | GO:0061055 | myotome development(GO:0061055) |
| 0.0 | 1.0 | GO:0045652 | regulation of megakaryocyte differentiation(GO:0045652) |
| 0.0 | 0.0 | GO:0032471 | negative regulation of endoplasmic reticulum calcium ion concentration(GO:0032471) |
| 0.0 | 0.3 | GO:0036309 | protein localization to M-band(GO:0036309) |
| 0.0 | 0.2 | GO:0010039 | response to iron ion(GO:0010039) |
| 0.0 | 0.0 | GO:0071211 | protein targeting to vacuole involved in autophagy(GO:0071211) |
| 0.0 | 0.0 | GO:1904293 | negative regulation of ERAD pathway(GO:1904293) |
| 0.0 | 0.0 | GO:1905165 | regulation of lysosomal protein catabolic process(GO:1905165) |
| 0.0 | 0.0 | GO:0090201 | negative regulation of release of cytochrome c from mitochondria(GO:0090201) |
| 0.0 | 0.0 | GO:1904383 | response to sodium phosphate(GO:1904383) |
| 0.0 | 0.0 | GO:0072733 | response to staurosporine(GO:0072733) cellular response to staurosporine(GO:0072734) |
| 0.0 | 0.0 | GO:0070309 | lens fiber cell morphogenesis(GO:0070309) |
| 0.0 | 1.2 | GO:0000413 | protein peptidyl-prolyl isomerization(GO:0000413) |
| 0.0 | 0.0 | GO:0031340 | positive regulation of vesicle fusion(GO:0031340) |
| 0.0 | 0.2 | GO:0007263 | nitric oxide mediated signal transduction(GO:0007263) |
| 0.0 | 0.1 | GO:0098779 | mitophagy in response to mitochondrial depolarization(GO:0098779) |
| 0.0 | 0.0 | GO:0009438 | methylglyoxal metabolic process(GO:0009438) |
| 0.0 | 0.0 | GO:0042418 | epinephrine biosynthetic process(GO:0042418) |
| 0.0 | 0.1 | GO:0035356 | cellular triglyceride homeostasis(GO:0035356) |
| 0.0 | 0.1 | GO:0045743 | positive regulation of fibroblast growth factor receptor signaling pathway(GO:0045743) |
| 0.0 | 0.0 | GO:0010826 | negative regulation of centrosome duplication(GO:0010826) |
| 0.0 | 0.1 | GO:0035965 | cardiolipin acyl-chain remodeling(GO:0035965) |
| 0.0 | 0.5 | GO:0061077 | chaperone-mediated protein folding(GO:0061077) |
| 0.0 | 0.1 | GO:0051001 | negative regulation of nitric-oxide synthase activity(GO:0051001) |
| 0.0 | 0.1 | GO:0022616 | DNA strand elongation(GO:0022616) |
| 0.0 | 0.1 | GO:0099525 | presynaptic dense core granule exocytosis(GO:0099525) |
| 0.0 | 0.1 | GO:0006566 | threonine metabolic process(GO:0006566) |
| 0.0 | 0.4 | GO:0006388 | tRNA splicing, via endonucleolytic cleavage and ligation(GO:0006388) |
| 0.0 | 0.2 | GO:0017062 | respiratory chain complex III assembly(GO:0017062) mitochondrial respiratory chain complex III assembly(GO:0034551) mitochondrial respiratory chain complex III biogenesis(GO:0097033) |
| 0.0 | 0.0 | GO:1901097 | negative regulation of autophagosome maturation(GO:1901097) |
| 0.0 | 0.1 | GO:1900225 | regulation of NLRP3 inflammasome complex assembly(GO:1900225) |
| 0.0 | 0.0 | GO:1902949 | positive regulation of tau-protein kinase activity(GO:1902949) |
| 0.0 | 0.0 | GO:0006532 | aspartate biosynthetic process(GO:0006532) |
| 0.0 | 0.1 | GO:0006662 | glycerol ether metabolic process(GO:0006662) |
| 0.0 | 0.2 | GO:1902751 | positive regulation of cell cycle G2/M phase transition(GO:1902751) |
| 0.0 | 0.1 | GO:0001812 | regulation of type I hypersensitivity(GO:0001810) positive regulation of type I hypersensitivity(GO:0001812) type I hypersensitivity(GO:0016068) |
| 0.0 | 0.1 | GO:0010266 | response to vitamin B1(GO:0010266) |
| 0.0 | 0.2 | GO:0031958 | corticosteroid receptor signaling pathway(GO:0031958) |
| 0.0 | 0.1 | GO:0050942 | positive regulation of pigment cell differentiation(GO:0050942) |
| 0.0 | 0.2 | GO:0001731 | formation of translation preinitiation complex(GO:0001731) |
| 0.0 | 0.4 | GO:0006749 | glutathione metabolic process(GO:0006749) |
| 0.0 | 0.3 | GO:0006379 | mRNA cleavage(GO:0006379) |
| 0.0 | 0.1 | GO:0072319 | vesicle uncoating(GO:0072319) |
| 0.0 | 0.3 | GO:0071294 | cellular response to zinc ion(GO:0071294) |
| 0.0 | 0.1 | GO:1901626 | regulation of postsynaptic membrane organization(GO:1901626) |
| 0.0 | 0.0 | GO:0010871 | negative regulation of receptor biosynthetic process(GO:0010871) |
| 0.0 | 0.1 | GO:0019377 | glycolipid catabolic process(GO:0019377) |
| 0.0 | 0.1 | GO:0060318 | definitive erythrocyte differentiation(GO:0060318) |
| 0.0 | 0.1 | GO:0035280 | miRNA loading onto RISC involved in gene silencing by miRNA(GO:0035280) |
| 0.0 | 0.6 | GO:0001580 | detection of chemical stimulus involved in sensory perception of bitter taste(GO:0001580) |
| 0.0 | 0.5 | GO:0030521 | androgen receptor signaling pathway(GO:0030521) |
| 0.0 | 0.2 | GO:2000480 | negative regulation of cAMP-dependent protein kinase activity(GO:2000480) |
| 0.0 | 0.1 | GO:0030576 | Cajal body organization(GO:0030576) |
| 0.0 | 0.4 | GO:0006369 | termination of RNA polymerase II transcription(GO:0006369) |
| 0.0 | 0.1 | GO:0018095 | protein polyglutamylation(GO:0018095) |
| 0.0 | 0.1 | GO:0051661 | maintenance of centrosome location(GO:0051661) |
| 0.0 | 0.1 | GO:0070681 | glutaminyl-tRNAGln biosynthesis via transamidation(GO:0070681) |
| 0.0 | 0.0 | GO:0000729 | DNA double-strand break processing(GO:0000729) |
| 0.0 | 0.2 | GO:0017183 | peptidyl-diphthamide metabolic process(GO:0017182) peptidyl-diphthamide biosynthetic process from peptidyl-histidine(GO:0017183) peptidyl-histidine modification(GO:0018202) |
| 0.0 | 0.1 | GO:0007221 | positive regulation of transcription of Notch receptor target(GO:0007221) |
| 0.0 | 0.0 | GO:0010824 | regulation of centrosome duplication(GO:0010824) |
| 0.0 | 0.2 | GO:0006384 | transcription initiation from RNA polymerase III promoter(GO:0006384) |
| 0.0 | 0.1 | GO:0030450 | regulation of complement activation, classical pathway(GO:0030450) negative regulation of complement activation, classical pathway(GO:0045959) |
| 0.0 | 0.1 | GO:0060372 | regulation of atrial cardiac muscle cell membrane repolarization(GO:0060372) |
| 0.0 | 0.1 | GO:0097498 | endothelial tube lumen extension(GO:0097498) |
| 0.0 | 0.1 | GO:0051934 | dopamine uptake involved in synaptic transmission(GO:0051583) catecholamine uptake involved in synaptic transmission(GO:0051934) catecholamine uptake(GO:0090493) dopamine uptake(GO:0090494) |
| 0.0 | 0.1 | GO:0090070 | positive regulation of ribosome biogenesis(GO:0090070) positive regulation of rRNA processing(GO:2000234) |
| 0.0 | 0.1 | GO:0006295 | nucleotide-excision repair, DNA incision, 3'-to lesion(GO:0006295) |
| 0.0 | 0.0 | GO:0051835 | positive regulation of synapse structural plasticity(GO:0051835) |
| 0.0 | 0.1 | GO:0006669 | sphinganine-1-phosphate biosynthetic process(GO:0006669) |
| 0.0 | 0.0 | GO:0045625 | regulation of T-helper 1 cell differentiation(GO:0045625) |
| 0.0 | 1.9 | GO:0009410 | response to xenobiotic stimulus(GO:0009410) |
| 0.0 | 0.2 | GO:0046825 | regulation of protein export from nucleus(GO:0046825) |
| 0.0 | 0.1 | GO:1990822 | basic amino acid transmembrane transport(GO:1990822) |
| 0.0 | 0.1 | GO:0008053 | mitochondrial fusion(GO:0008053) |
| 0.0 | 0.1 | GO:0001967 | suckling behavior(GO:0001967) |
| 0.0 | 0.1 | GO:0010623 | programmed cell death involved in cell development(GO:0010623) |
| 0.0 | 0.0 | GO:1901164 | negative regulation of trophoblast cell migration(GO:1901164) |
| 0.0 | 0.2 | GO:0006303 | double-strand break repair via nonhomologous end joining(GO:0006303) |
| 0.0 | 0.1 | GO:0045345 | positive regulation of MHC class I biosynthetic process(GO:0045345) |
| 0.0 | 0.1 | GO:1902884 | positive regulation of response to oxidative stress(GO:1902884) |
| 0.0 | 0.1 | GO:0030502 | negative regulation of bone mineralization(GO:0030502) |
| 0.0 | 0.4 | GO:0000245 | spliceosomal complex assembly(GO:0000245) |
| 0.0 | 0.0 | GO:0043686 | co-translational protein modification(GO:0043686) |
| 0.0 | 0.0 | GO:0021764 | amygdala development(GO:0021764) |
| 0.0 | 0.0 | GO:0070124 | mitochondrial translational initiation(GO:0070124) |
| 0.0 | 0.0 | GO:1903413 | cellular response to bile acid(GO:1903413) |
| 0.0 | 0.1 | GO:0097688 | AMPA glutamate receptor clustering(GO:0097113) glutamate receptor clustering(GO:0097688) |
| 0.0 | 0.9 | GO:0006120 | mitochondrial electron transport, NADH to ubiquinone(GO:0006120) |
| 0.0 | 0.1 | GO:0097050 | type B pancreatic cell apoptotic process(GO:0097050) regulation of type B pancreatic cell apoptotic process(GO:2000674) |
| 0.0 | 0.0 | GO:0072218 | ascending thin limb development(GO:0072021) thick ascending limb development(GO:0072023) metanephric ascending thin limb development(GO:0072218) metanephric thick ascending limb development(GO:0072233) |
| 0.0 | 0.0 | GO:0042118 | endothelial cell activation(GO:0042118) |
| 0.0 | 0.1 | GO:0006546 | glycine catabolic process(GO:0006546) glycine decarboxylation via glycine cleavage system(GO:0019464) |
| 0.0 | 0.1 | GO:0045793 | positive regulation of cell size(GO:0045793) |
| 0.0 | 0.0 | GO:1990167 | protein K27-linked deubiquitination(GO:1990167) |
| 0.0 | 0.2 | GO:0061684 | chaperone-mediated autophagy(GO:0061684) |
| 0.0 | 0.7 | GO:0006406 | mRNA export from nucleus(GO:0006406) mRNA-containing ribonucleoprotein complex export from nucleus(GO:0071427) |
| 0.0 | 0.1 | GO:0051971 | positive regulation of transmission of nerve impulse(GO:0051971) |
| 0.0 | 0.1 | GO:0060536 | cartilage morphogenesis(GO:0060536) |
| 0.0 | 0.2 | GO:0070816 | phosphorylation of RNA polymerase II C-terminal domain(GO:0070816) |
| 0.0 | 0.0 | GO:0042483 | negative regulation of odontogenesis(GO:0042483) |
| 0.0 | 0.2 | GO:0051156 | glucose 6-phosphate metabolic process(GO:0051156) |
| 0.0 | 0.0 | GO:0019262 | N-acetylneuraminate catabolic process(GO:0019262) |
| 0.0 | 0.5 | GO:0010507 | negative regulation of autophagy(GO:0010507) |
| 0.0 | 0.0 | GO:1903365 | regulation of fear response(GO:1903365) regulation of behavioral fear response(GO:2000822) |
| 0.0 | 0.1 | GO:0035458 | cellular response to interferon-beta(GO:0035458) |
| 0.0 | 0.1 | GO:0006432 | phenylalanyl-tRNA aminoacylation(GO:0006432) |
| 0.0 | 0.1 | GO:0032097 | positive regulation of response to food(GO:0032097) positive regulation of appetite(GO:0032100) |
| 0.0 | 0.0 | GO:0014005 | microglia differentiation(GO:0014004) microglia development(GO:0014005) |
| 0.0 | 0.1 | GO:1900245 | positive regulation of MDA-5 signaling pathway(GO:1900245) |
| 0.0 | 0.1 | GO:0035750 | protein localization to myelin sheath abaxonal region(GO:0035750) |
| 0.0 | 0.1 | GO:0055129 | L-proline biosynthetic process(GO:0055129) |
| 0.0 | 0.1 | GO:0051725 | protein de-ADP-ribosylation(GO:0051725) |
| 0.0 | 0.0 | GO:1904823 | pyrimidine nucleobase transport(GO:0015855) purine nucleobase transmembrane transport(GO:1904823) |
| 0.0 | 0.0 | GO:0042701 | progesterone secretion(GO:0042701) |
| 0.0 | 0.1 | GO:0045945 | positive regulation of transcription from RNA polymerase III promoter(GO:0045945) |
| 0.0 | 0.0 | GO:0048293 | isotype switching to IgE isotypes(GO:0048289) regulation of isotype switching to IgE isotypes(GO:0048293) |
| 0.0 | 0.1 | GO:0032483 | regulation of Rab protein signal transduction(GO:0032483) |
| 0.0 | 0.2 | GO:0045947 | negative regulation of translational initiation(GO:0045947) |
| 0.0 | 0.0 | GO:0006561 | proline biosynthetic process(GO:0006561) |
| 0.0 | 0.0 | GO:0009146 | purine nucleoside triphosphate catabolic process(GO:0009146) |
| 0.0 | 1.4 | GO:0006457 | protein folding(GO:0006457) |
| 0.0 | 0.1 | GO:0006702 | androgen biosynthetic process(GO:0006702) |
| 0.0 | 0.0 | GO:0002036 | regulation of L-glutamate transport(GO:0002036) |
| 0.0 | 0.0 | GO:0034776 | response to histamine(GO:0034776) |
| 0.0 | 0.2 | GO:0050910 | detection of mechanical stimulus involved in sensory perception of sound(GO:0050910) |
| 0.0 | 0.0 | GO:0006015 | 5-phosphoribose 1-diphosphate biosynthetic process(GO:0006015) 5-phosphoribose 1-diphosphate metabolic process(GO:0046391) |
| 0.0 | 0.1 | GO:0033599 | regulation of mammary gland epithelial cell proliferation(GO:0033599) |
| 0.0 | 0.1 | GO:0048096 | chromatin-mediated maintenance of transcription(GO:0048096) |
| 0.0 | 0.1 | GO:0051923 | sulfation(GO:0051923) |
| 0.0 | 0.1 | GO:0046498 | S-adenosylhomocysteine metabolic process(GO:0046498) |
| 0.0 | 0.0 | GO:0071376 | response to corticotropin-releasing hormone(GO:0043435) cellular response to corticotropin-releasing hormone stimulus(GO:0071376) |
| 0.0 | 0.1 | GO:2000507 | positive regulation of energy homeostasis(GO:2000507) |
| 0.0 | 0.1 | GO:0042340 | keratan sulfate catabolic process(GO:0042340) |
| 0.0 | 0.0 | GO:0048677 | axon extension involved in regeneration(GO:0048677) sprouting of injured axon(GO:0048682) |
Gene overrepresentation in cellular component category:
| Log-likelihood per target | Total log-likelihood | Term | Description |
|---|---|---|---|
| 2.5 | 7.5 | GO:0060987 | lipid tube(GO:0060987) |
| 1.1 | 3.3 | GO:0034753 | nuclear aryl hydrocarbon receptor complex(GO:0034753) |
| 1.0 | 8.9 | GO:0071953 | elastic fiber(GO:0071953) |
| 0.7 | 2.1 | GO:0097135 | cyclin E2-CDK2 complex(GO:0097135) |
| 0.5 | 2.0 | GO:1990356 | sumoylated E2 ligase complex(GO:1990356) |
| 0.5 | 5.9 | GO:0005589 | collagen type VI trimer(GO:0005589) collagen beaded filament(GO:0098647) |
| 0.4 | 1.3 | GO:0097636 | intrinsic component of autophagosome membrane(GO:0097636) integral component of autophagosome membrane(GO:0097637) |
| 0.4 | 2.4 | GO:0071547 | piP-body(GO:0071547) |
| 0.4 | 2.4 | GO:0031673 | H zone(GO:0031673) |
| 0.4 | 2.3 | GO:0032299 | ribonuclease H2 complex(GO:0032299) |
| 0.4 | 1.5 | GO:1990578 | perinuclear endoplasmic reticulum membrane(GO:1990578) |
| 0.4 | 1.1 | GO:0035525 | NF-kappaB p50/p65 complex(GO:0035525) |
| 0.4 | 3.3 | GO:0000125 | PCAF complex(GO:0000125) |
| 0.4 | 2.1 | GO:0048787 | presynaptic active zone membrane(GO:0048787) |
| 0.3 | 1.0 | GO:0043293 | apoptosome(GO:0043293) |
| 0.3 | 2.0 | GO:0001652 | granular component(GO:0001652) |
| 0.3 | 1.7 | GO:0043291 | RAVE complex(GO:0043291) |
| 0.3 | 6.3 | GO:0031088 | platelet dense granule membrane(GO:0031088) |
| 0.3 | 1.6 | GO:0031436 | BRCA1-BARD1 complex(GO:0031436) |
| 0.3 | 1.5 | GO:0042643 | actomyosin, actin portion(GO:0042643) |
| 0.3 | 4.5 | GO:0005862 | muscle thin filament tropomyosin(GO:0005862) |
| 0.3 | 0.9 | GO:0044753 | amphisome(GO:0044753) |
| 0.3 | 0.9 | GO:0043260 | laminin-11 complex(GO:0043260) |
| 0.3 | 1.7 | GO:0016035 | zeta DNA polymerase complex(GO:0016035) |
| 0.3 | 2.3 | GO:0000110 | nucleotide-excision repair factor 1 complex(GO:0000110) |
| 0.3 | 0.8 | GO:0030312 | external encapsulating structure(GO:0030312) |
| 0.3 | 1.4 | GO:0031302 | intrinsic component of endosome membrane(GO:0031302) |
| 0.3 | 0.8 | GO:0097058 | CRLF-CLCF1 complex(GO:0097058) |
| 0.3 | 0.8 | GO:0034677 | integrin alpha7-beta1 complex(GO:0034677) |
| 0.3 | 1.4 | GO:0045160 | myosin I complex(GO:0045160) |
| 0.3 | 1.3 | GO:0031523 | Myb complex(GO:0031523) |
| 0.3 | 1.5 | GO:0097149 | centralspindlin complex(GO:0097149) |
| 0.3 | 0.8 | GO:0016939 | kinesin II complex(GO:0016939) |
| 0.3 | 4.5 | GO:1990023 | mitotic spindle midzone(GO:1990023) |
| 0.2 | 0.7 | GO:0033167 | ARC complex(GO:0033167) |
| 0.2 | 0.7 | GO:0035189 | Rb-E2F complex(GO:0035189) |
| 0.2 | 0.7 | GO:0070044 | synaptobrevin 2-SNAP-25-syntaxin-1a complex(GO:0070044) |
| 0.2 | 0.9 | GO:0039713 | viral factory(GO:0039713) cytoplasmic viral factory(GO:0039714) host cell viral assembly compartment(GO:0072517) |
| 0.2 | 1.2 | GO:0097454 | Schwann cell microvillus(GO:0097454) |
| 0.2 | 5.0 | GO:0097539 | ciliary transition fiber(GO:0097539) |
| 0.2 | 2.3 | GO:0097443 | sorting endosome(GO:0097443) |
| 0.2 | 0.9 | GO:0090498 | extrinsic component of Golgi membrane(GO:0090498) |
| 0.2 | 0.7 | GO:1990667 | PCSK9-AnxA2 complex(GO:1990667) |
| 0.2 | 2.2 | GO:0000015 | phosphopyruvate hydratase complex(GO:0000015) |
| 0.2 | 1.1 | GO:0005726 | perichromatin fibrils(GO:0005726) |
| 0.2 | 0.7 | GO:0000939 | condensed chromosome inner kinetochore(GO:0000939) |
| 0.2 | 28.2 | GO:0005901 | caveola(GO:0005901) |
| 0.2 | 4.7 | GO:0001527 | microfibril(GO:0001527) fibril(GO:0043205) |
| 0.2 | 1.3 | GO:0005594 | collagen type IX trimer(GO:0005594) |
| 0.2 | 1.4 | GO:0032133 | chromosome passenger complex(GO:0032133) |
| 0.2 | 1.4 | GO:0031467 | Cul7-RING ubiquitin ligase complex(GO:0031467) |
| 0.2 | 0.6 | GO:0035354 | Toll-like receptor 1-Toll-like receptor 2 protein complex(GO:0035354) |
| 0.2 | 0.6 | GO:0005588 | collagen type V trimer(GO:0005588) |
| 0.2 | 1.8 | GO:0070531 | BRCA1-A complex(GO:0070531) |
| 0.2 | 0.2 | GO:0002139 | stereocilia coupling link(GO:0002139) |
| 0.2 | 1.9 | GO:0032541 | cortical endoplasmic reticulum(GO:0032541) |
| 0.2 | 1.9 | GO:0005664 | origin recognition complex(GO:0000808) nuclear origin of replication recognition complex(GO:0005664) |
| 0.2 | 1.9 | GO:0042567 | insulin-like growth factor ternary complex(GO:0042567) |
| 0.2 | 0.6 | GO:0070701 | mucus layer(GO:0070701) |
| 0.2 | 0.5 | GO:0036387 | nuclear pre-replicative complex(GO:0005656) pre-replicative complex(GO:0036387) |
| 0.2 | 0.5 | GO:0033565 | ESCRT-0 complex(GO:0033565) |
| 0.2 | 1.8 | GO:0051286 | cell tip(GO:0051286) |
| 0.2 | 0.5 | GO:1990723 | cytoplasmic periphery of the nuclear pore complex(GO:1990723) |
| 0.2 | 0.9 | GO:0005971 | ribonucleoside-diphosphate reductase complex(GO:0005971) |
| 0.2 | 1.4 | GO:0000796 | condensin complex(GO:0000796) |
| 0.2 | 2.2 | GO:0097136 | Bcl-2 family protein complex(GO:0097136) |
| 0.2 | 0.3 | GO:0097129 | cyclin D2-CDK4 complex(GO:0097129) |
| 0.2 | 1.9 | GO:0070852 | cell body fiber(GO:0070852) |
| 0.2 | 2.7 | GO:0017146 | NMDA selective glutamate receptor complex(GO:0017146) |
| 0.2 | 0.7 | GO:0033186 | CAF-1 complex(GO:0033186) |
| 0.2 | 0.7 | GO:0005595 | collagen type XII trimer(GO:0005595) |
| 0.2 | 2.4 | GO:0030478 | actin cap(GO:0030478) |
| 0.2 | 1.6 | GO:0005964 | phosphorylase kinase complex(GO:0005964) |
| 0.2 | 0.3 | GO:0060187 | cell pole(GO:0060187) |
| 0.2 | 0.3 | GO:0030981 | cortical microtubule cytoskeleton(GO:0030981) |
| 0.2 | 0.5 | GO:0033593 | BRCA2-MAGE-D1 complex(GO:0033593) |
| 0.2 | 3.4 | GO:0031588 | nucleotide-activated protein kinase complex(GO:0031588) |
| 0.2 | 0.5 | GO:0071006 | U2-type catalytic step 1 spliceosome(GO:0071006) |
| 0.2 | 0.6 | GO:0044614 | nuclear pore cytoplasmic filaments(GO:0044614) |
| 0.2 | 0.6 | GO:0009328 | phenylalanine-tRNA ligase complex(GO:0009328) |
| 0.2 | 1.4 | GO:1990761 | growth cone lamellipodium(GO:1990761) |
| 0.2 | 0.5 | GO:0000814 | ESCRT II complex(GO:0000814) |
| 0.2 | 0.9 | GO:0032311 | angiogenin-PRI complex(GO:0032311) |
| 0.1 | 0.6 | GO:0032937 | SREBP-SCAP-Insig complex(GO:0032937) |
| 0.1 | 2.5 | GO:0033179 | proton-transporting V-type ATPase, V0 domain(GO:0033179) |
| 0.1 | 2.4 | GO:0016461 | unconventional myosin complex(GO:0016461) |
| 0.1 | 1.0 | GO:0044305 | calyx of Held(GO:0044305) |
| 0.1 | 1.0 | GO:0071546 | pi-body(GO:0071546) |
| 0.1 | 2.4 | GO:0099634 | postsynaptic specialization membrane(GO:0099634) |
| 0.1 | 0.4 | GO:0044615 | nuclear pore nuclear basket(GO:0044615) |
| 0.1 | 0.9 | GO:0000788 | nuclear nucleosome(GO:0000788) |
| 0.1 | 2.9 | GO:0097440 | apical dendrite(GO:0097440) |
| 0.1 | 2.0 | GO:0016342 | catenin complex(GO:0016342) |
| 0.1 | 0.3 | GO:0030934 | anchoring collagen complex(GO:0030934) |
| 0.1 | 0.4 | GO:0010009 | cytoplasmic side of endosome membrane(GO:0010009) |
| 0.1 | 0.9 | GO:0031262 | Ndc80 complex(GO:0031262) |
| 0.1 | 0.4 | GO:0071148 | TEAD-1-YAP complex(GO:0071148) |
| 0.1 | 2.1 | GO:0042575 | DNA polymerase complex(GO:0042575) |
| 0.1 | 1.6 | GO:0031595 | nuclear proteasome complex(GO:0031595) |
| 0.1 | 0.6 | GO:0000923 | equatorial microtubule organizing center(GO:0000923) |
| 0.1 | 1.7 | GO:0032059 | bleb(GO:0032059) |
| 0.1 | 0.1 | GO:0005943 | phosphatidylinositol 3-kinase complex, class IA(GO:0005943) |
| 0.1 | 0.4 | GO:0097224 | sperm connecting piece(GO:0097224) |
| 0.1 | 1.1 | GO:0030915 | Smc5-Smc6 complex(GO:0030915) |
| 0.1 | 0.4 | GO:0048269 | methionine adenosyltransferase complex(GO:0048269) |
| 0.1 | 0.6 | GO:0008275 | gamma-tubulin small complex(GO:0008275) |
| 0.1 | 5.9 | GO:0035861 | site of double-strand break(GO:0035861) |
| 0.1 | 0.5 | GO:1990730 | VCP-NSFL1C complex(GO:1990730) |
| 0.1 | 0.8 | GO:0036449 | microtubule minus-end(GO:0036449) |
| 0.1 | 0.5 | GO:1990876 | cytoplasmic side of nuclear pore(GO:1990876) |
| 0.1 | 0.8 | GO:0009331 | glycerol-3-phosphate dehydrogenase complex(GO:0009331) |
| 0.1 | 2.0 | GO:0071203 | WASH complex(GO:0071203) |
| 0.1 | 0.7 | GO:0045272 | plasma membrane respiratory chain complex I(GO:0045272) |
| 0.1 | 1.5 | GO:0042587 | glycogen granule(GO:0042587) |
| 0.1 | 0.5 | GO:0071817 | MMXD complex(GO:0071817) |
| 0.1 | 0.4 | GO:0033596 | TSC1-TSC2 complex(GO:0033596) |
| 0.1 | 0.4 | GO:0031166 | integral component of vacuolar membrane(GO:0031166) |
| 0.1 | 0.7 | GO:0097513 | myosin II filament(GO:0097513) |
| 0.1 | 3.4 | GO:0031264 | death-inducing signaling complex(GO:0031264) |
| 0.1 | 0.1 | GO:0000805 | X chromosome(GO:0000805) |
| 0.1 | 0.8 | GO:1990246 | uniplex complex(GO:1990246) |
| 0.1 | 1.0 | GO:0032777 | Piccolo NuA4 histone acetyltransferase complex(GO:0032777) |
| 0.1 | 0.4 | GO:0097543 | ciliary inversin compartment(GO:0097543) |
| 0.1 | 2.9 | GO:0046930 | pore complex(GO:0046930) |
| 0.1 | 1.4 | GO:0031464 | Cul4A-RING E3 ubiquitin ligase complex(GO:0031464) |
| 0.1 | 5.0 | GO:0000421 | autophagosome membrane(GO:0000421) |
| 0.1 | 5.4 | GO:0034451 | centriolar satellite(GO:0034451) |
| 0.1 | 0.6 | GO:0032301 | MutSalpha complex(GO:0032301) |
| 0.1 | 0.5 | GO:0045180 | basal cortex(GO:0045180) |
| 0.1 | 1.1 | GO:0070937 | CRD-mediated mRNA stability complex(GO:0070937) |
| 0.1 | 1.7 | GO:0036057 | filtration diaphragm(GO:0036056) slit diaphragm(GO:0036057) |
| 0.1 | 0.2 | GO:0016222 | procollagen-proline 4-dioxygenase complex(GO:0016222) |
| 0.1 | 4.5 | GO:0043596 | nuclear replication fork(GO:0043596) |
| 0.1 | 0.6 | GO:0070761 | pre-snoRNP complex(GO:0070761) |
| 0.1 | 2.2 | GO:0032591 | dendritic spine membrane(GO:0032591) |
| 0.1 | 0.5 | GO:0034991 | nuclear meiotic cohesin complex(GO:0034991) |
| 0.1 | 1.9 | GO:0043240 | Fanconi anaemia nuclear complex(GO:0043240) |
| 0.1 | 7.7 | GO:0005876 | spindle microtubule(GO:0005876) |
| 0.1 | 8.2 | GO:0032154 | cleavage furrow(GO:0032154) cell surface furrow(GO:0097610) |
| 0.1 | 1.4 | GO:0000940 | condensed chromosome outer kinetochore(GO:0000940) |
| 0.1 | 0.6 | GO:0032280 | symmetric synapse(GO:0032280) |
| 0.1 | 1.9 | GO:0034993 | microtubule organizing center attachment site(GO:0034992) LINC complex(GO:0034993) |
| 0.1 | 0.1 | GO:0034667 | integrin alpha3-beta1 complex(GO:0034667) |
| 0.1 | 1.2 | GO:0035686 | sperm fibrous sheath(GO:0035686) |
| 0.1 | 1.8 | GO:0030126 | COPI vesicle coat(GO:0030126) |
| 0.1 | 0.8 | GO:0033063 | Rad51B-Rad51C-Rad51D-XRCC2 complex(GO:0033063) |
| 0.1 | 0.6 | GO:0005896 | interleukin-6 receptor complex(GO:0005896) |
| 0.1 | 3.5 | GO:0030992 | intraciliary transport particle B(GO:0030992) |
| 0.1 | 1.2 | GO:0034464 | BBSome(GO:0034464) |
| 0.1 | 3.2 | GO:0035327 | transcriptionally active chromatin(GO:0035327) |
| 0.1 | 0.2 | GO:0005606 | laminin-1 complex(GO:0005606) |
| 0.1 | 1.1 | GO:0070652 | HAUS complex(GO:0070652) |
| 0.1 | 1.2 | GO:0030991 | intraciliary transport particle A(GO:0030991) |
| 0.1 | 1.2 | GO:0005638 | lamin filament(GO:0005638) |
| 0.1 | 1.1 | GO:0098645 | network-forming collagen trimer(GO:0098642) collagen network(GO:0098645) |
| 0.1 | 1.6 | GO:0008385 | IkappaB kinase complex(GO:0008385) |
| 0.1 | 0.6 | GO:0031597 | cytosolic proteasome complex(GO:0031597) |
| 0.1 | 0.3 | GO:0070578 | RISC-loading complex(GO:0070578) |
| 0.1 | 0.4 | GO:0005846 | nuclear cap binding complex(GO:0005846) |
| 0.1 | 1.3 | GO:0005883 | neurofilament(GO:0005883) |
| 0.1 | 0.6 | GO:0031232 | extrinsic component of external side of plasma membrane(GO:0031232) |
| 0.1 | 0.4 | GO:0045323 | interleukin-1 receptor complex(GO:0045323) |
| 0.1 | 0.3 | GO:0043159 | acrosomal matrix(GO:0043159) |
| 0.1 | 9.4 | GO:0005581 | collagen trimer(GO:0005581) |
| 0.1 | 0.8 | GO:0044327 | dendritic spine head(GO:0044327) |
| 0.1 | 1.2 | GO:0071204 | histone pre-mRNA 3'end processing complex(GO:0071204) |
| 0.1 | 0.2 | GO:0001674 | female germ cell nucleus(GO:0001674) |
| 0.1 | 0.2 | GO:1990075 | periciliary membrane compartment(GO:1990075) |
| 0.1 | 0.2 | GO:0044308 | axonal spine(GO:0044308) |
| 0.1 | 1.6 | GO:0030008 | TRAPP complex(GO:0030008) |
| 0.1 | 6.9 | GO:0031907 | peroxisomal matrix(GO:0005782) microbody lumen(GO:0031907) |
| 0.1 | 0.5 | GO:0070022 | transforming growth factor beta receptor homodimeric complex(GO:0070022) |
| 0.1 | 1.2 | GO:0000124 | SAGA complex(GO:0000124) |
| 0.1 | 0.8 | GO:0043196 | varicosity(GO:0043196) |
| 0.1 | 3.3 | GO:0035145 | exon-exon junction complex(GO:0035145) |
| 0.1 | 0.4 | GO:0035517 | PR-DUB complex(GO:0035517) |
| 0.1 | 0.4 | GO:0035068 | micro-ribonucleoprotein complex(GO:0035068) |
| 0.1 | 1.2 | GO:0044300 | cerebellar mossy fiber(GO:0044300) |
| 0.1 | 1.0 | GO:0008290 | F-actin capping protein complex(GO:0008290) |
| 0.1 | 2.7 | GO:0030904 | retromer complex(GO:0030904) |
| 0.1 | 0.1 | GO:0034274 | Atg12-Atg5-Atg16 complex(GO:0034274) |
| 0.1 | 0.5 | GO:0031205 | endoplasmic reticulum Sec complex(GO:0031205) |
| 0.1 | 1.8 | GO:0035371 | microtubule plus-end(GO:0035371) |
| 0.1 | 1.6 | GO:0044233 | ER-mitochondrion membrane contact site(GO:0044233) |
| 0.1 | 0.6 | GO:0097442 | CA3 pyramidal cell dendrite(GO:0097442) |
| 0.1 | 0.3 | GO:0036028 | protein C inhibitor-TMPRSS7 complex(GO:0036024) protein C inhibitor-TMPRSS11E complex(GO:0036025) protein C inhibitor-PLAT complex(GO:0036026) protein C inhibitor-PLAU complex(GO:0036027) protein C inhibitor-thrombin complex(GO:0036028) protein C inhibitor-KLK3 complex(GO:0036029) protein C inhibitor-plasma kallikrein complex(GO:0036030) serine protease inhibitor complex(GO:0097180) protein C inhibitor-coagulation factor V complex(GO:0097181) protein C inhibitor-coagulation factor Xa complex(GO:0097182) protein C inhibitor-coagulation factor XI complex(GO:0097183) |
| 0.1 | 0.6 | GO:0090571 | RNA polymerase II transcription repressor complex(GO:0090571) |
| 0.1 | 1.3 | GO:0097542 | ciliary tip(GO:0097542) |
| 0.1 | 0.1 | GO:0031261 | DNA replication preinitiation complex(GO:0031261) |
| 0.1 | 0.4 | GO:0032798 | Swi5-Sfr1 complex(GO:0032798) |
| 0.1 | 1.3 | GO:0044815 | DNA packaging complex(GO:0044815) |
| 0.1 | 0.3 | GO:0070931 | Golgi-associated vesicle lumen(GO:0070931) |
| 0.1 | 0.3 | GO:0036195 | muscle cell projection(GO:0036194) muscle cell projection membrane(GO:0036195) |
| 0.1 | 0.1 | GO:0071920 | cleavage body(GO:0071920) |
| 0.1 | 0.8 | GO:0043083 | synaptic cleft(GO:0043083) |
| 0.1 | 0.5 | GO:0044294 | dendrite terminus(GO:0044292) dendritic growth cone(GO:0044294) |
| 0.1 | 0.3 | GO:0034657 | GID complex(GO:0034657) |
| 0.1 | 0.1 | GO:0005682 | U5 snRNP(GO:0005682) |
| 0.1 | 0.8 | GO:0070765 | gamma-secretase complex(GO:0070765) |
| 0.1 | 0.1 | GO:0035692 | macrophage migration inhibitory factor receptor complex(GO:0035692) |
| 0.1 | 0.1 | GO:0000930 | gamma-tubulin complex(GO:0000930) |
| 0.1 | 0.6 | GO:0033503 | HULC complex(GO:0033503) |
| 0.1 | 3.0 | GO:0030132 | clathrin coat of coated pit(GO:0030132) |
| 0.1 | 4.4 | GO:0043034 | costamere(GO:0043034) |
| 0.1 | 0.7 | GO:0005851 | eukaryotic translation initiation factor 2B complex(GO:0005851) |
| 0.1 | 0.3 | GO:0070876 | SOSS complex(GO:0070876) |
| 0.1 | 0.1 | GO:0070522 | ERCC4-ERCC1 complex(GO:0070522) |
| 0.1 | 2.2 | GO:0009925 | basal plasma membrane(GO:0009925) |
| 0.1 | 0.6 | GO:0030062 | mitochondrial tricarboxylic acid cycle enzyme complex(GO:0030062) |
| 0.1 | 2.1 | GO:0090545 | NuRD complex(GO:0016581) CHD-type complex(GO:0090545) |
| 0.1 | 2.1 | GO:0071782 | endoplasmic reticulum tubular network(GO:0071782) |
| 0.1 | 4.4 | GO:0090544 | BAF-type complex(GO:0090544) |
| 0.1 | 0.3 | GO:0008537 | proteasome activator complex(GO:0008537) |
| 0.1 | 0.8 | GO:0016593 | Cdc73/Paf1 complex(GO:0016593) |
| 0.1 | 1.6 | GO:0042622 | photoreceptor outer segment membrane(GO:0042622) |
| 0.1 | 0.9 | GO:0005671 | Ada2/Gcn5/Ada3 transcription activator complex(GO:0005671) |
| 0.1 | 0.2 | GO:1990298 | mitotic checkpoint complex(GO:0033597) bub1-bub3 complex(GO:1990298) |
| 0.1 | 0.6 | GO:0098575 | lumenal side of lysosomal membrane(GO:0098575) |
| 0.1 | 0.2 | GO:0031933 | telomeric heterochromatin(GO:0031933) |
| 0.1 | 5.3 | GO:0031519 | PcG protein complex(GO:0031519) |
| 0.1 | 0.2 | GO:0034669 | integrin alpha4-beta7 complex(GO:0034669) |
| 0.1 | 0.8 | GO:0005853 | eukaryotic translation elongation factor 1 complex(GO:0005853) |
| 0.1 | 1.5 | GO:0033202 | Ino80 complex(GO:0031011) DNA helicase complex(GO:0033202) |
| 0.1 | 0.4 | GO:0033263 | CORVET complex(GO:0033263) |
| 0.1 | 0.3 | GO:0005968 | Rab-protein geranylgeranyltransferase complex(GO:0005968) |
| 0.1 | 1.4 | GO:0032045 | guanyl-nucleotide exchange factor complex(GO:0032045) |
| 0.1 | 0.2 | GO:0005674 | transcription factor TFIIF complex(GO:0005674) |
| 0.1 | 0.4 | GO:0048179 | activin receptor complex(GO:0048179) |
| 0.1 | 0.2 | GO:0044609 | DBIRD complex(GO:0044609) |
| 0.1 | 0.7 | GO:0072669 | tRNA-splicing ligase complex(GO:0072669) |
| 0.1 | 0.2 | GO:0097232 | lamellar body membrane(GO:0097232) alveolar lamellar body membrane(GO:0097233) |
| 0.1 | 0.1 | GO:0016942 | insulin-like growth factor binding protein complex(GO:0016942) growth factor complex(GO:0036454) |
| 0.1 | 0.4 | GO:0002177 | manchette(GO:0002177) |
| 0.1 | 0.4 | GO:0032044 | DSIF complex(GO:0032044) |
| 0.1 | 0.2 | GO:0032302 | MutSbeta complex(GO:0032302) |
| 0.1 | 1.2 | GO:0097517 | stress fiber(GO:0001725) contractile actin filament bundle(GO:0097517) |
| 0.1 | 0.1 | GO:0042584 | chromaffin granule membrane(GO:0042584) |
| 0.1 | 0.2 | GO:0071752 | dimeric IgA immunoglobulin complex(GO:0071750) secretory dimeric IgA immunoglobulin complex(GO:0071752) |
| 0.1 | 1.5 | GO:0005614 | interstitial matrix(GO:0005614) |
| 0.1 | 1.9 | GO:0005868 | cytoplasmic dynein complex(GO:0005868) |
| 0.1 | 1.0 | GO:0008091 | spectrin(GO:0008091) |
| 0.1 | 0.3 | GO:0031618 | nuclear pericentric heterochromatin(GO:0031618) |
| 0.1 | 0.4 | GO:0005797 | Golgi medial cisterna(GO:0005797) |
| 0.1 | 0.5 | GO:0016589 | NURF complex(GO:0016589) |
| 0.1 | 1.8 | GO:0043189 | NuA4 histone acetyltransferase complex(GO:0035267) H4/H2A histone acetyltransferase complex(GO:0043189) H4 histone acetyltransferase complex(GO:1902562) |
| 0.1 | 0.8 | GO:0000322 | storage vacuole(GO:0000322) |
| 0.1 | 3.0 | GO:0008180 | COP9 signalosome(GO:0008180) |
| 0.1 | 0.2 | GO:1990917 | sperm head plasma membrane(GO:1990913) ooplasm(GO:1990917) |
| 0.1 | 0.3 | GO:0097255 | R2TP complex(GO:0097255) |
| 0.1 | 0.1 | GO:0031905 | early endosome lumen(GO:0031905) |
| 0.1 | 2.0 | GO:0070971 | endoplasmic reticulum exit site(GO:0070971) |
| 0.1 | 1.4 | GO:0032391 | photoreceptor connecting cilium(GO:0032391) |
| 0.1 | 8.0 | GO:0005814 | centriole(GO:0005814) |
| 0.1 | 0.6 | GO:0035749 | myelin sheath adaxonal region(GO:0035749) |
| 0.1 | 0.6 | GO:0043190 | ATP-binding cassette (ABC) transporter complex(GO:0043190) |
| 0.1 | 0.6 | GO:0008541 | proteasome regulatory particle, lid subcomplex(GO:0008541) |
| 0.1 | 0.4 | GO:0097013 | phagocytic vesicle lumen(GO:0097013) |
| 0.1 | 3.3 | GO:0016460 | myosin II complex(GO:0016460) |
| 0.1 | 5.8 | GO:0031903 | peroxisomal membrane(GO:0005778) microbody membrane(GO:0031903) |
| 0.1 | 5.4 | GO:0000777 | condensed chromosome kinetochore(GO:0000777) |
| 0.1 | 4.1 | GO:0031093 | platelet alpha granule lumen(GO:0031093) |
| 0.1 | 0.1 | GO:0005958 | DNA-dependent protein kinase-DNA ligase 4 complex(GO:0005958) |
| 0.1 | 0.7 | GO:0030137 | COPI-coated vesicle(GO:0030137) |
| 0.1 | 0.8 | GO:0031931 | TORC1 complex(GO:0031931) |
| 0.1 | 1.9 | GO:0005680 | anaphase-promoting complex(GO:0005680) |
| 0.1 | 2.5 | GO:1902711 | GABA-A receptor complex(GO:1902711) |
| 0.1 | 0.2 | GO:0018444 | translation release factor complex(GO:0018444) |
| 0.1 | 0.1 | GO:0071598 | neuronal ribonucleoprotein granule(GO:0071598) |
| 0.1 | 0.1 | GO:0048500 | signal recognition particle(GO:0048500) |
| 0.1 | 9.4 | GO:0030496 | midbody(GO:0030496) |
| 0.1 | 0.5 | GO:0071439 | clathrin complex(GO:0071439) |
| 0.1 | 1.7 | GO:0032809 | neuronal cell body membrane(GO:0032809) cell body membrane(GO:0044298) |
| 0.1 | 1.9 | GO:0071339 | MLL1/2 complex(GO:0044665) MLL1 complex(GO:0071339) |
| 0.1 | 0.2 | GO:0035370 | UBC13-UEV1A complex(GO:0035370) |
| 0.1 | 1.2 | GO:0071141 | SMAD protein complex(GO:0071141) |
| 0.1 | 0.1 | GO:1902636 | kinociliary basal body(GO:1902636) |
| 0.1 | 1.1 | GO:0030660 | Golgi-associated vesicle membrane(GO:0030660) |
| 0.1 | 0.2 | GO:0020016 | ciliary pocket(GO:0020016) ciliary pocket membrane(GO:0020018) |
| 0.1 | 0.8 | GO:0031209 | SCAR complex(GO:0031209) |
| 0.1 | 0.4 | GO:0000408 | EKC/KEOPS complex(GO:0000408) |
| 0.1 | 0.5 | GO:0002193 | MAML1-RBP-Jkappa- ICN1 complex(GO:0002193) |
| 0.1 | 0.8 | GO:0019773 | proteasome core complex, alpha-subunit complex(GO:0019773) |
| 0.1 | 0.2 | GO:0032807 | DNA ligase IV complex(GO:0032807) |
| 0.1 | 4.0 | GO:0048475 | membrane coat(GO:0030117) coated membrane(GO:0048475) |
| 0.1 | 0.2 | GO:0071062 | alphav-beta3 integrin-vitronectin complex(GO:0071062) |
| 0.1 | 0.3 | GO:0071458 | integral component of cytoplasmic side of endoplasmic reticulum membrane(GO:0071458) |
| 0.1 | 0.2 | GO:0031390 | Ctf18 RFC-like complex(GO:0031390) |
| 0.1 | 1.5 | GO:0031430 | M band(GO:0031430) |
| 0.1 | 0.2 | GO:0097414 | glial cytoplasmic inclusion(GO:0097409) classical Lewy body(GO:0097414) Lewy neurite(GO:0097462) Lewy body corona(GO:1990038) |
| 0.1 | 0.5 | GO:0065010 | extracellular membrane-bounded organelle(GO:0065010) |
| 0.1 | 0.2 | GO:0000126 | transcription factor TFIIIB complex(GO:0000126) |
| 0.1 | 0.4 | GO:0016272 | prefoldin complex(GO:0016272) |
| 0.1 | 0.1 | GO:0070939 | Dsl1p complex(GO:0070939) |
| 0.1 | 0.1 | GO:0097425 | smooth endoplasmic reticulum membrane(GO:0030868) smooth endoplasmic reticulum part(GO:0097425) |
| 0.1 | 1.3 | GO:0032839 | dendrite cytoplasm(GO:0032839) |
| 0.1 | 9.3 | GO:0043197 | dendritic spine(GO:0043197) |
| 0.1 | 0.1 | GO:0001939 | female pronucleus(GO:0001939) |
| 0.1 | 0.6 | GO:0005786 | signal recognition particle, endoplasmic reticulum targeting(GO:0005786) |
| 0.1 | 0.2 | GO:0031010 | ISWI-type complex(GO:0031010) |
| 0.1 | 0.2 | GO:0097452 | GAIT complex(GO:0097452) |
| 0.1 | 0.2 | GO:0048476 | Holliday junction resolvase complex(GO:0048476) |
| 0.1 | 0.3 | GO:0016011 | dystroglycan complex(GO:0016011) |
| 0.1 | 0.7 | GO:0033270 | paranode region of axon(GO:0033270) |
| 0.1 | 0.5 | GO:0032590 | dendrite membrane(GO:0032590) |
| 0.1 | 1.0 | GO:0031332 | RISC complex(GO:0016442) RNAi effector complex(GO:0031332) |
| 0.1 | 3.6 | GO:0017053 | transcriptional repressor complex(GO:0017053) |
| 0.1 | 3.3 | GO:0031228 | intrinsic component of Golgi membrane(GO:0031228) |
| 0.1 | 0.2 | GO:0030689 | Noc complex(GO:0030689) |
| 0.0 | 0.3 | GO:0033643 | host cell part(GO:0033643) |
| 0.0 | 0.1 | GO:0042788 | polysomal ribosome(GO:0042788) |
| 0.0 | 1.0 | GO:0001518 | voltage-gated sodium channel complex(GO:0001518) |
| 0.0 | 0.2 | GO:0098554 | cytoplasmic side of endoplasmic reticulum membrane(GO:0098554) |
| 0.0 | 2.3 | GO:0042571 | immunoglobulin complex, circulating(GO:0042571) |
| 0.0 | 0.0 | GO:1990635 | proximal dendrite(GO:1990635) |
| 0.0 | 8.5 | GO:0090575 | RNA polymerase II transcription factor complex(GO:0090575) |
| 0.0 | 0.6 | GO:0005652 | nuclear lamina(GO:0005652) |
| 0.0 | 0.5 | GO:0034366 | spherical high-density lipoprotein particle(GO:0034366) |
| 0.0 | 0.2 | GO:0005715 | late recombination nodule(GO:0005715) |
| 0.0 | 0.2 | GO:0031616 | spindle pole centrosome(GO:0031616) |
| 0.0 | 0.4 | GO:0000800 | lateral element(GO:0000800) |
| 0.0 | 0.7 | GO:0030140 | trans-Golgi network transport vesicle(GO:0030140) |
| 0.0 | 0.1 | GO:0031371 | ubiquitin conjugating enzyme complex(GO:0031371) |
| 0.0 | 0.2 | GO:0005873 | plus-end kinesin complex(GO:0005873) |
| 0.0 | 0.4 | GO:0030870 | Mre11 complex(GO:0030870) |
| 0.0 | 1.0 | GO:0035869 | ciliary transition zone(GO:0035869) |
| 0.0 | 0.1 | GO:0032982 | myosin filament(GO:0032982) |
| 0.0 | 2.2 | GO:0005777 | peroxisome(GO:0005777) microbody(GO:0042579) |
| 0.0 | 0.5 | GO:0001741 | XY body(GO:0001741) |
| 0.0 | 0.3 | GO:0034673 | inhibin-betaglycan-ActRII complex(GO:0034673) |
| 0.0 | 2.7 | GO:0000118 | histone deacetylase complex(GO:0000118) |
| 0.0 | 3.2 | GO:0010494 | cytoplasmic stress granule(GO:0010494) |
| 0.0 | 0.2 | GO:0032593 | insulin-responsive compartment(GO:0032593) |
| 0.0 | 1.0 | GO:0031083 | BLOC-1 complex(GO:0031083) |
| 0.0 | 1.7 | GO:0005881 | cytoplasmic microtubule(GO:0005881) |
| 0.0 | 0.3 | GO:0005885 | Arp2/3 protein complex(GO:0005885) |
| 0.0 | 0.5 | GO:0071438 | invadopodium membrane(GO:0071438) |
| 0.0 | 25.6 | GO:0005925 | focal adhesion(GO:0005925) |
| 0.0 | 0.3 | GO:0071797 | LUBAC complex(GO:0071797) |
| 0.0 | 0.0 | GO:0042721 | mitochondrial inner membrane protein insertion complex(GO:0042721) |
| 0.0 | 0.1 | GO:0031510 | SUMO activating enzyme complex(GO:0031510) |
| 0.0 | 0.6 | GO:0005657 | replication fork(GO:0005657) |
| 0.0 | 0.5 | GO:0042555 | MCM complex(GO:0042555) |
| 0.0 | 0.9 | GO:0031307 | integral component of mitochondrial outer membrane(GO:0031307) |
| 0.0 | 0.6 | GO:0005833 | hemoglobin complex(GO:0005833) |
| 0.0 | 0.2 | GO:0002079 | inner acrosomal membrane(GO:0002079) |
| 0.0 | 0.1 | GO:0098837 | postsynaptic recycling endosome(GO:0098837) |
| 0.0 | 2.3 | GO:0000502 | proteasome complex(GO:0000502) |
| 0.0 | 0.0 | GO:0042583 | chromaffin granule(GO:0042583) |
| 0.0 | 0.5 | GO:0043194 | axon initial segment(GO:0043194) |
| 0.0 | 0.1 | GO:1990726 | Lsm1-7-Pat1 complex(GO:1990726) |
| 0.0 | 2.3 | GO:0000775 | chromosome, centromeric region(GO:0000775) |
| 0.0 | 0.4 | GO:0000347 | THO complex(GO:0000347) THO complex part of transcription export complex(GO:0000445) |
| 0.0 | 0.1 | GO:0032584 | growth cone membrane(GO:0032584) |
| 0.0 | 2.4 | GO:0005811 | lipid particle(GO:0005811) |
| 0.0 | 1.5 | GO:0016235 | aggresome(GO:0016235) |
| 0.0 | 0.3 | GO:0005677 | chromatin silencing complex(GO:0005677) |
| 0.0 | 0.3 | GO:0043073 | male germ cell nucleus(GO:0001673) germ cell nucleus(GO:0043073) |
| 0.0 | 0.7 | GO:0060077 | inhibitory synapse(GO:0060077) |
| 0.0 | 0.1 | GO:0061574 | ASAP complex(GO:0061574) |
| 0.0 | 0.2 | GO:1990769 | proximal neuron projection(GO:1990769) |
| 0.0 | 2.3 | GO:0018995 | host(GO:0018995) host cell(GO:0043657) |
| 0.0 | 0.3 | GO:0032838 | cell projection cytoplasm(GO:0032838) axon cytoplasm(GO:1904115) |
| 0.0 | 0.0 | GO:0055087 | Ski complex(GO:0055087) |
| 0.0 | 0.0 | GO:0035867 | alphav-beta3 integrin-IGF-1-IGF1R complex(GO:0035867) |
| 0.0 | 0.1 | GO:0034751 | aryl hydrocarbon receptor complex(GO:0034751) |
| 0.0 | 0.1 | GO:0098553 | integral component of lumenal side of endoplasmic reticulum membrane(GO:0071556) lumenal side of endoplasmic reticulum membrane(GO:0098553) |
| 0.0 | 0.2 | GO:0044530 | supraspliceosomal complex(GO:0044530) |
| 0.0 | 0.0 | GO:0070381 | endosome to plasma membrane transport vesicle(GO:0070381) |
| 0.0 | 0.3 | GO:0033093 | Weibel-Palade body(GO:0033093) |
| 0.0 | 0.1 | GO:0048237 | rough endoplasmic reticulum lumen(GO:0048237) |
| 0.0 | 1.2 | GO:0008023 | transcription elongation factor complex(GO:0008023) |
| 0.0 | 1.9 | GO:0005834 | heterotrimeric G-protein complex(GO:0005834) |
| 0.0 | 0.2 | GO:0070545 | PeBoW complex(GO:0070545) |
| 0.0 | 0.2 | GO:0036021 | endolysosome lumen(GO:0036021) |
| 0.0 | 0.2 | GO:0060171 | stereocilium membrane(GO:0060171) |
| 0.0 | 0.1 | GO:0097431 | mitotic spindle pole(GO:0097431) |
| 0.0 | 5.0 | GO:0005667 | transcription factor complex(GO:0005667) |
| 0.0 | 3.1 | GO:0005758 | mitochondrial intermembrane space(GO:0005758) |
| 0.0 | 4.5 | GO:0005819 | spindle(GO:0005819) |
| 0.0 | 0.3 | GO:0000164 | protein phosphatase type 1 complex(GO:0000164) |
| 0.0 | 3.1 | GO:0031901 | early endosome membrane(GO:0031901) |
| 0.0 | 0.2 | GO:0046696 | lipopolysaccharide receptor complex(GO:0046696) |
| 0.0 | 0.1 | GO:0002945 | cyclin K-CDK13 complex(GO:0002945) |
| 0.0 | 0.7 | GO:0080008 | Cul4-RING E3 ubiquitin ligase complex(GO:0080008) |
| 0.0 | 6.2 | GO:0005681 | spliceosomal complex(GO:0005681) |
| 0.0 | 2.0 | GO:0005791 | rough endoplasmic reticulum(GO:0005791) |
| 0.0 | 0.2 | GO:0005798 | Golgi-associated vesicle(GO:0005798) |
| 0.0 | 0.3 | GO:0031462 | Cul2-RING ubiquitin ligase complex(GO:0031462) |
| 0.0 | 0.7 | GO:0031091 | platelet alpha granule(GO:0031091) |
| 0.0 | 0.2 | GO:0070419 | nonhomologous end joining complex(GO:0070419) |
| 0.0 | 1.5 | GO:0000784 | nuclear chromosome, telomeric region(GO:0000784) |
| 0.0 | 1.1 | GO:0000123 | histone acetyltransferase complex(GO:0000123) |
| 0.0 | 8.2 | GO:0005788 | endoplasmic reticulum lumen(GO:0005788) |
| 0.0 | 0.2 | GO:0043541 | UDP-N-acetylglucosamine transferase complex(GO:0043541) |
| 0.0 | 0.2 | GO:0036157 | outer dynein arm(GO:0036157) |
| 0.0 | 0.2 | GO:0001520 | outer dense fiber(GO:0001520) |
| 0.0 | 0.7 | GO:0030665 | clathrin-coated vesicle membrane(GO:0030665) |
| 0.0 | 0.1 | GO:0032144 | 4-aminobutyrate transaminase complex(GO:0032144) |
| 0.0 | 0.9 | GO:0016592 | mediator complex(GO:0016592) |
| 0.0 | 0.3 | GO:0016281 | eukaryotic translation initiation factor 4F complex(GO:0016281) |
| 0.0 | 0.2 | GO:0005890 | sodium:potassium-exchanging ATPase complex(GO:0005890) |
| 0.0 | 0.1 | GO:0030532 | small nuclear ribonucleoprotein complex(GO:0030532) |
| 0.0 | 0.0 | GO:0097504 | Gemini of coiled bodies(GO:0097504) |
| 0.0 | 0.1 | GO:0031251 | PAN complex(GO:0031251) |
| 0.0 | 1.3 | GO:0000793 | condensed chromosome(GO:0000793) |
| 0.0 | 0.1 | GO:0097413 | Lewy body(GO:0097413) |
| 0.0 | 0.5 | GO:0097381 | photoreceptor disc membrane(GO:0097381) |
| 0.0 | 7.3 | GO:0016607 | nuclear speck(GO:0016607) |
| 0.0 | 0.4 | GO:0002080 | acrosomal membrane(GO:0002080) |
| 0.0 | 0.2 | GO:0044666 | MLL3/4 complex(GO:0044666) |
| 0.0 | 0.0 | GO:0000974 | Prp19 complex(GO:0000974) |
| 0.0 | 0.1 | GO:0000172 | ribonuclease MRP complex(GO:0000172) |
| 0.0 | 0.3 | GO:0098563 | integral component of synaptic vesicle membrane(GO:0030285) intrinsic component of synaptic vesicle membrane(GO:0098563) |
| 0.0 | 0.1 | GO:0017102 | methionyl glutamyl tRNA synthetase complex(GO:0017102) |
| 0.0 | 0.1 | GO:0034719 | SMN-Sm protein complex(GO:0034719) |
| 0.0 | 0.1 | GO:0000308 | cytoplasmic cyclin-dependent protein kinase holoenzyme complex(GO:0000308) |
| 0.0 | 7.3 | GO:0005694 | chromosome(GO:0005694) |
| 0.0 | 0.5 | GO:0000159 | protein phosphatase type 2A complex(GO:0000159) |
| 0.0 | 0.1 | GO:0031084 | BLOC-2 complex(GO:0031084) |
| 0.0 | 0.4 | GO:0031235 | intrinsic component of the cytoplasmic side of the plasma membrane(GO:0031235) |
| 0.0 | 0.6 | GO:0031305 | intrinsic component of mitochondrial inner membrane(GO:0031304) integral component of mitochondrial inner membrane(GO:0031305) |
| 0.0 | 5.6 | GO:0098852 | lysosomal membrane(GO:0005765) lytic vacuole membrane(GO:0098852) |
| 0.0 | 0.3 | GO:0005832 | chaperonin-containing T-complex(GO:0005832) |
| 0.0 | 0.1 | GO:0030956 | glutamyl-tRNA(Gln) amidotransferase complex(GO:0030956) |
| 0.0 | 1.5 | GO:0034704 | calcium channel complex(GO:0034704) |
| 0.0 | 0.1 | GO:0044307 | dendritic branch(GO:0044307) |
| 0.0 | 0.2 | GO:0005787 | signal peptidase complex(GO:0005787) |
| 0.0 | 0.1 | GO:0044217 | other organism(GO:0044215) other organism cell(GO:0044216) other organism part(GO:0044217) |
| 0.0 | 0.1 | GO:0000815 | ESCRT III complex(GO:0000815) |
| 0.0 | 0.3 | GO:0000178 | exosome (RNase complex)(GO:0000178) |
| 0.0 | 0.0 | GO:0036452 | ESCRT complex(GO:0036452) |
| 0.0 | 0.5 | GO:0022627 | cytosolic small ribosomal subunit(GO:0022627) |
| 0.0 | 0.1 | GO:0033588 | Elongator holoenzyme complex(GO:0033588) |
| 0.0 | 0.1 | GO:0042765 | GPI-anchor transamidase complex(GO:0042765) |
| 0.0 | 0.1 | GO:0060091 | kinocilium(GO:0060091) |
| 0.0 | 0.3 | GO:0030687 | preribosome, large subunit precursor(GO:0030687) |
Gene overrepresentation in molecular function category:
| Log-likelihood per target | Total log-likelihood | Term | Description |
|---|---|---|---|
| 1.3 | 12.9 | GO:0060072 | large conductance calcium-activated potassium channel activity(GO:0060072) |
| 1.2 | 3.6 | GO:0005289 | high-affinity basic amino acid transmembrane transporter activity(GO:0005287) high-affinity arginine transmembrane transporter activity(GO:0005289) high-affinity lysine transmembrane transporter activity(GO:0005292) |
| 1.1 | 4.3 | GO:0005169 | neurotrophin TRKB receptor binding(GO:0005169) |
| 1.1 | 3.2 | GO:0004356 | glutamate-ammonia ligase activity(GO:0004356) ammonia ligase activity(GO:0016211) acid-ammonia (or amide) ligase activity(GO:0016880) |
| 1.0 | 4.1 | GO:0032560 | dGTPase activity(GO:0008832) triphosphoric monoester hydrolase activity(GO:0016793) guanyl deoxyribonucleotide binding(GO:0032560) dGTP binding(GO:0032567) |
| 0.8 | 3.8 | GO:0004370 | glycerol kinase activity(GO:0004370) |
| 0.7 | 2.0 | GO:0005519 | cytoskeletal regulatory protein binding(GO:0005519) |
| 0.7 | 2.7 | GO:0035402 | histone kinase activity (H3-T11 specific)(GO:0035402) |
| 0.7 | 2.0 | GO:0070704 | C-5 sterol desaturase activity(GO:0000248) sterol desaturase activity(GO:0070704) |
| 0.7 | 2.0 | GO:0004958 | prostaglandin F receptor activity(GO:0004958) |
| 0.7 | 2.6 | GO:0019770 | IgG receptor activity(GO:0019770) |
| 0.6 | 6.9 | GO:0050692 | DBD domain binding(GO:0050692) |
| 0.6 | 7.9 | GO:0036122 | BMP binding(GO:0036122) |
| 0.6 | 2.4 | GO:0004306 | ethanolamine-phosphate cytidylyltransferase activity(GO:0004306) |
| 0.6 | 2.4 | GO:0004505 | phenylalanine 4-monooxygenase activity(GO:0004505) |
| 0.6 | 5.2 | GO:0035727 | lysophosphatidic acid binding(GO:0035727) |
| 0.6 | 1.7 | GO:0004336 | galactosylceramidase activity(GO:0004336) |
| 0.6 | 2.8 | GO:0016404 | 15-hydroxyprostaglandin dehydrogenase (NAD+) activity(GO:0016404) |
| 0.6 | 0.6 | GO:0005017 | platelet-derived growth factor-activated receptor activity(GO:0005017) |
| 0.6 | 2.8 | GO:0097108 | hedgehog family protein binding(GO:0097108) |
| 0.5 | 3.8 | GO:0004957 | prostaglandin E receptor activity(GO:0004957) |
| 0.5 | 2.1 | GO:0008513 | secondary active organic cation transmembrane transporter activity(GO:0008513) |
| 0.5 | 2.6 | GO:0070051 | fibrinogen binding(GO:0070051) |
| 0.5 | 2.0 | GO:0061656 | SUMO conjugating enzyme activity(GO:0061656) |
| 0.5 | 2.5 | GO:0050693 | LBD domain binding(GO:0050693) |
| 0.5 | 2.0 | GO:0004360 | glutamine-fructose-6-phosphate transaminase (isomerizing) activity(GO:0004360) |
| 0.5 | 1.4 | GO:0042284 | sphingolipid delta-4 desaturase activity(GO:0042284) |
| 0.5 | 2.4 | GO:0070573 | metallodipeptidase activity(GO:0070573) |
| 0.5 | 1.9 | GO:0004909 | interleukin-1, Type I, activating receptor activity(GO:0004909) |
| 0.5 | 5.6 | GO:0031995 | insulin-like growth factor II binding(GO:0031995) |
| 0.5 | 1.4 | GO:0031696 | alpha-2C adrenergic receptor binding(GO:0031696) |
| 0.4 | 1.3 | GO:0042781 | 3'-tRNA processing endoribonuclease activity(GO:0042781) |
| 0.4 | 1.3 | GO:0004782 | sulfinoalanine decarboxylase activity(GO:0004782) |
| 0.4 | 1.8 | GO:0004773 | steryl-sulfatase activity(GO:0004773) |
| 0.4 | 3.1 | GO:0043812 | phosphatidylinositol-4-phosphate phosphatase activity(GO:0043812) |
| 0.4 | 2.6 | GO:0042806 | fucose binding(GO:0042806) |
| 0.4 | 3.9 | GO:0033743 | peptide-methionine (R)-S-oxide reductase activity(GO:0033743) |
| 0.4 | 1.3 | GO:0050613 | delta14-sterol reductase activity(GO:0050613) |
| 0.4 | 1.3 | GO:0033142 | progesterone receptor binding(GO:0033142) |
| 0.4 | 1.3 | GO:0008893 | guanosine-3',5'-bis(diphosphate) 3'-diphosphatase activity(GO:0008893) diphosphoric monoester hydrolase activity(GO:0016794) |
| 0.4 | 2.1 | GO:0042030 | ATPase inhibitor activity(GO:0042030) |
| 0.4 | 1.7 | GO:0046592 | polyamine oxidase activity(GO:0046592) spermine:oxygen oxidoreductase (spermidine-forming) activity(GO:0052901) |
| 0.4 | 1.6 | GO:0047676 | arachidonate-CoA ligase activity(GO:0047676) |
| 0.4 | 1.6 | GO:0000026 | alpha-1,2-mannosyltransferase activity(GO:0000026) |
| 0.4 | 1.2 | GO:0015189 | L-lysine transmembrane transporter activity(GO:0015189) |
| 0.4 | 2.0 | GO:0043515 | kinetochore binding(GO:0043515) |
| 0.4 | 1.5 | GO:0016418 | S-acetyltransferase activity(GO:0016418) |
| 0.4 | 3.4 | GO:0030023 | extracellular matrix constituent conferring elasticity(GO:0030023) |
| 0.4 | 4.5 | GO:0051434 | BH3 domain binding(GO:0051434) |
| 0.4 | 1.5 | GO:0038085 | vascular endothelial growth factor binding(GO:0038085) |
| 0.4 | 1.5 | GO:0016215 | stearoyl-CoA 9-desaturase activity(GO:0004768) acyl-CoA desaturase activity(GO:0016215) |
| 0.4 | 0.7 | GO:0098640 | integrin binding involved in cell-matrix adhesion(GO:0098640) |
| 0.4 | 4.4 | GO:0048407 | platelet-derived growth factor binding(GO:0048407) |
| 0.4 | 1.1 | GO:0008523 | sodium-dependent multivitamin transmembrane transporter activity(GO:0008523) |
| 0.4 | 1.4 | GO:0004341 | gluconolactonase activity(GO:0004341) |
| 0.4 | 1.1 | GO:0060001 | minus-end directed microfilament motor activity(GO:0060001) |
| 0.4 | 3.2 | GO:0043426 | MRF binding(GO:0043426) |
| 0.4 | 2.5 | GO:0048495 | Roundabout binding(GO:0048495) |
| 0.3 | 2.4 | GO:0070513 | death domain binding(GO:0070513) |
| 0.3 | 1.0 | GO:0045145 | single-stranded DNA 5'-3' exodeoxyribonuclease activity(GO:0045145) |
| 0.3 | 1.6 | GO:0003896 | DNA primase activity(GO:0003896) |
| 0.3 | 3.9 | GO:0015129 | lactate transmembrane transporter activity(GO:0015129) |
| 0.3 | 1.6 | GO:0008321 | Ral guanyl-nucleotide exchange factor activity(GO:0008321) |
| 0.3 | 2.2 | GO:0004137 | deoxycytidine kinase activity(GO:0004137) |
| 0.3 | 0.9 | GO:0047315 | kynurenine-glyoxylate transaminase activity(GO:0047315) |
| 0.3 | 1.9 | GO:0045134 | uridine-diphosphatase activity(GO:0045134) |
| 0.3 | 1.2 | GO:0004923 | leukemia inhibitory factor receptor activity(GO:0004923) |
| 0.3 | 0.9 | GO:0003941 | L-serine ammonia-lyase activity(GO:0003941) |
| 0.3 | 3.1 | GO:0004523 | RNA-DNA hybrid ribonuclease activity(GO:0004523) |
| 0.3 | 2.4 | GO:0005000 | vasopressin receptor activity(GO:0005000) |
| 0.3 | 1.5 | GO:0050833 | pyruvate transmembrane transporter activity(GO:0050833) |
| 0.3 | 2.3 | GO:0003910 | DNA ligase (ATP) activity(GO:0003910) |
| 0.3 | 0.9 | GO:0004798 | thymidylate kinase activity(GO:0004798) |
| 0.3 | 0.9 | GO:0046577 | long-chain-alcohol oxidase activity(GO:0046577) |
| 0.3 | 1.1 | GO:0035373 | chondroitin sulfate proteoglycan binding(GO:0035373) |
| 0.3 | 1.1 | GO:0031531 | thyrotropin-releasing hormone receptor binding(GO:0031531) |
| 0.3 | 0.9 | GO:0030350 | iron-responsive element binding(GO:0030350) |
| 0.3 | 0.8 | GO:0031071 | cysteine desulfurase activity(GO:0031071) |
| 0.3 | 2.2 | GO:1990599 | 3' overhang single-stranded DNA endodeoxyribonuclease activity(GO:1990599) |
| 0.3 | 0.8 | GO:0005127 | ciliary neurotrophic factor receptor binding(GO:0005127) |
| 0.3 | 1.9 | GO:0008853 | exodeoxyribonuclease III activity(GO:0008853) |
| 0.3 | 1.1 | GO:0033765 | 3-oxo-5-alpha-steroid 4-dehydrogenase activity(GO:0003865) steroid dehydrogenase activity, acting on the CH-CH group of donors(GO:0033765) cholestenone 5-alpha-reductase activity(GO:0047751) |
| 0.3 | 0.3 | GO:0031493 | nucleosomal histone binding(GO:0031493) |
| 0.3 | 0.3 | GO:0015235 | cobalamin transporter activity(GO:0015235) |
| 0.3 | 1.6 | GO:0003873 | 6-phosphofructo-2-kinase activity(GO:0003873) |
| 0.3 | 0.8 | GO:0070336 | flap-structured DNA binding(GO:0070336) |
| 0.3 | 7.3 | GO:0048156 | tau protein binding(GO:0048156) |
| 0.3 | 1.1 | GO:0036137 | kynurenine-oxoglutarate transaminase activity(GO:0016212) kynurenine aminotransferase activity(GO:0036137) |
| 0.3 | 4.3 | GO:0004028 | 3-chloroallyl aldehyde dehydrogenase activity(GO:0004028) |
| 0.3 | 2.7 | GO:0019531 | oxalate transmembrane transporter activity(GO:0019531) |
| 0.3 | 0.8 | GO:0004450 | isocitrate dehydrogenase (NADP+) activity(GO:0004450) |
| 0.3 | 2.3 | GO:0043237 | laminin-1 binding(GO:0043237) |
| 0.3 | 0.8 | GO:0072590 | N-acetyl-L-aspartate-L-glutamate ligase activity(GO:0072590) |
| 0.3 | 0.8 | GO:0008746 | NAD(P)+ transhydrogenase activity(GO:0008746) oxidoreductase activity, acting on NAD(P)H, NAD(P) as acceptor(GO:0016652) |
| 0.3 | 1.0 | GO:0010861 | thyroid hormone receptor activator activity(GO:0010861) thyroid hormone receptor coactivator activity(GO:0030375) |
| 0.3 | 0.8 | GO:0035663 | Toll-like receptor 2 binding(GO:0035663) |
| 0.2 | 0.2 | GO:0008967 | phosphoglycolate phosphatase activity(GO:0008967) |
| 0.2 | 0.2 | GO:0097642 | calcitonin family receptor activity(GO:0097642) |
| 0.2 | 1.0 | GO:0008798 | beta-aspartyl-peptidase activity(GO:0008798) |
| 0.2 | 2.4 | GO:0097100 | supercoiled DNA binding(GO:0097100) |
| 0.2 | 1.0 | GO:0003827 | alpha-1,3-mannosylglycoprotein 2-beta-N-acetylglucosaminyltransferase activity(GO:0003827) |
| 0.2 | 0.7 | GO:0004157 | dihydropyrimidinase activity(GO:0004157) |
| 0.2 | 0.2 | GO:0004797 | thymidine kinase activity(GO:0004797) |
| 0.2 | 0.7 | GO:0004961 | thromboxane receptor activity(GO:0004960) thromboxane A2 receptor activity(GO:0004961) |
| 0.2 | 0.7 | GO:0008502 | melatonin receptor activity(GO:0008502) |
| 0.2 | 1.6 | GO:0015057 | thrombin receptor activity(GO:0015057) |
| 0.2 | 2.4 | GO:0046974 | histone methyltransferase activity (H3-K9 specific)(GO:0046974) |
| 0.2 | 0.9 | GO:0004031 | aldehyde oxidase activity(GO:0004031) |
| 0.2 | 0.7 | GO:0004452 | isopentenyl-diphosphate delta-isomerase activity(GO:0004452) |
| 0.2 | 0.7 | GO:0004051 | arachidonate 5-lipoxygenase activity(GO:0004051) |
| 0.2 | 1.8 | GO:0031432 | titin binding(GO:0031432) |
| 0.2 | 0.9 | GO:0045127 | N-acetylglucosamine kinase activity(GO:0045127) |
| 0.2 | 0.9 | GO:0004616 | phosphogluconate dehydrogenase (decarboxylating) activity(GO:0004616) |
| 0.2 | 0.7 | GO:0008330 | protein tyrosine/threonine phosphatase activity(GO:0008330) |
| 0.2 | 1.8 | GO:0046923 | ER retention sequence binding(GO:0046923) |
| 0.2 | 1.1 | GO:0004962 | endothelin receptor activity(GO:0004962) |
| 0.2 | 0.9 | GO:0044378 | non-sequence-specific DNA binding, bending(GO:0044378) |
| 0.2 | 0.7 | GO:0097493 | structural molecule activity conferring elasticity(GO:0097493) |
| 0.2 | 0.2 | GO:0015141 | succinate transmembrane transporter activity(GO:0015141) |
| 0.2 | 1.3 | GO:0004095 | carnitine O-palmitoyltransferase activity(GO:0004095) |
| 0.2 | 2.2 | GO:0004634 | phosphopyruvate hydratase activity(GO:0004634) |
| 0.2 | 0.7 | GO:0032427 | GBD domain binding(GO:0032427) |
| 0.2 | 3.3 | GO:0045159 | myosin II binding(GO:0045159) |
| 0.2 | 1.3 | GO:0005315 | inorganic phosphate transmembrane transporter activity(GO:0005315) |
| 0.2 | 1.1 | GO:0035673 | oligopeptide transmembrane transporter activity(GO:0035673) |
| 0.2 | 0.9 | GO:0001069 | regulatory region RNA binding(GO:0001069) |
| 0.2 | 0.9 | GO:0032440 | 2-alkenal reductase [NAD(P)] activity(GO:0032440) |
| 0.2 | 0.2 | GO:0015181 | arginine transmembrane transporter activity(GO:0015181) |
| 0.2 | 0.6 | GO:0008480 | sarcosine dehydrogenase activity(GO:0008480) |
| 0.2 | 0.9 | GO:0004504 | peptidylglycine monooxygenase activity(GO:0004504) peptidylamidoglycolate lyase activity(GO:0004598) |
| 0.2 | 1.3 | GO:0004656 | procollagen-proline 4-dioxygenase activity(GO:0004656) |
| 0.2 | 0.6 | GO:0032093 | SAM domain binding(GO:0032093) |
| 0.2 | 1.0 | GO:0043813 | phosphatidylinositol-3,5-bisphosphate 5-phosphatase activity(GO:0043813) |
| 0.2 | 1.3 | GO:0015137 | citrate transmembrane transporter activity(GO:0015137) tricarboxylic acid transmembrane transporter activity(GO:0015142) |
| 0.2 | 1.5 | GO:0004594 | pantothenate kinase activity(GO:0004594) |
| 0.2 | 0.8 | GO:0016639 | oxidoreductase activity, acting on the CH-NH2 group of donors, NAD or NADP as acceptor(GO:0016639) |
| 0.2 | 1.6 | GO:0061133 | endopeptidase activator activity(GO:0061133) |
| 0.2 | 1.0 | GO:0004803 | transposase activity(GO:0004803) |
| 0.2 | 0.8 | GO:0015199 | amino-acid betaine transmembrane transporter activity(GO:0015199) carnitine transmembrane transporter activity(GO:0015226) |
| 0.2 | 0.6 | GO:0016649 | electron-transferring-flavoprotein dehydrogenase activity(GO:0004174) oxidoreductase activity, acting on the CH-NH group of donors, quinone or similar compound as acceptor(GO:0016649) |
| 0.2 | 0.2 | GO:0070538 | oleic acid binding(GO:0070538) |
| 0.2 | 0.8 | GO:0008427 | calcium-dependent protein kinase inhibitor activity(GO:0008427) |
| 0.2 | 0.6 | GO:0000253 | 3-keto sterol reductase activity(GO:0000253) |
| 0.2 | 0.8 | GO:0047391 | alkylglycerophosphoethanolamine phosphodiesterase activity(GO:0047391) |
| 0.2 | 0.8 | GO:0008478 | pyridoxal kinase activity(GO:0008478) |
| 0.2 | 0.6 | GO:0034584 | piRNA binding(GO:0034584) |
| 0.2 | 0.8 | GO:0052590 | sn-glycerol-3-phosphate:ubiquinone oxidoreductase activity(GO:0052590) sn-glycerol-3-phosphate:ubiquinone-8 oxidoreductase activity(GO:0052591) |
| 0.2 | 1.0 | GO:0008518 | reduced folate carrier activity(GO:0008518) |
| 0.2 | 1.5 | GO:0035312 | 5'-3' exodeoxyribonuclease activity(GO:0035312) |
| 0.2 | 0.6 | GO:0004056 | argininosuccinate lyase activity(GO:0004056) |
| 0.2 | 2.8 | GO:0033613 | activating transcription factor binding(GO:0033613) |
| 0.2 | 1.5 | GO:0015184 | L-cystine transmembrane transporter activity(GO:0015184) |
| 0.2 | 1.8 | GO:0070569 | uridylyltransferase activity(GO:0070569) |
| 0.2 | 1.5 | GO:0005087 | Ran guanyl-nucleotide exchange factor activity(GO:0005087) |
| 0.2 | 0.5 | GO:0030156 | benzodiazepine receptor binding(GO:0030156) |
| 0.2 | 1.1 | GO:0008454 | alpha-1,3-mannosylglycoprotein 4-beta-N-acetylglucosaminyltransferase activity(GO:0008454) |
| 0.2 | 0.5 | GO:0004345 | glucose-6-phosphate dehydrogenase activity(GO:0004345) |
| 0.2 | 1.1 | GO:0015307 | drug:proton antiporter activity(GO:0015307) |
| 0.2 | 1.4 | GO:0008172 | S-methyltransferase activity(GO:0008172) |
| 0.2 | 0.9 | GO:0034988 | Fc-gamma receptor I complex binding(GO:0034988) |
| 0.2 | 1.1 | GO:0004525 | ribonuclease III activity(GO:0004525) double-stranded RNA-specific ribonuclease activity(GO:0032296) |
| 0.2 | 0.7 | GO:0070320 | inward rectifier potassium channel inhibitor activity(GO:0070320) |
| 0.2 | 0.4 | GO:0004528 | phosphodiesterase I activity(GO:0004528) |
| 0.2 | 0.9 | GO:0004392 | heme oxygenase (decyclizing) activity(GO:0004392) |
| 0.2 | 2.8 | GO:0005225 | volume-sensitive anion channel activity(GO:0005225) |
| 0.2 | 0.9 | GO:0004748 | ribonucleoside-diphosphate reductase activity, thioredoxin disulfide as acceptor(GO:0004748) oxidoreductase activity, acting on CH or CH2 groups, disulfide as acceptor(GO:0016728) ribonucleoside-diphosphate reductase activity(GO:0061731) |
| 0.2 | 1.9 | GO:0030020 | extracellular matrix structural constituent conferring tensile strength(GO:0030020) |
| 0.2 | 0.5 | GO:0003955 | NAD(P)H dehydrogenase (quinone) activity(GO:0003955) |
| 0.2 | 3.6 | GO:0008253 | 5'-nucleotidase activity(GO:0008253) |
| 0.2 | 1.5 | GO:0008597 | calcium-dependent protein serine/threonine phosphatase regulator activity(GO:0008597) |
| 0.2 | 0.7 | GO:0016812 | hydrolase activity, acting on carbon-nitrogen (but not peptide) bonds, in cyclic amides(GO:0016812) |
| 0.2 | 2.7 | GO:0001206 | transcriptional repressor activity, RNA polymerase II distal enhancer sequence-specific binding(GO:0001206) |
| 0.2 | 0.7 | GO:0004335 | galactokinase activity(GO:0004335) |
| 0.2 | 0.3 | GO:0005534 | galactose binding(GO:0005534) |
| 0.2 | 1.0 | GO:0052658 | inositol-1,4,5-trisphosphate 5-phosphatase activity(GO:0052658) |
| 0.2 | 0.7 | GO:1904408 | dihydronicotinamide riboside quinone reductase activity(GO:0001512) melatonin binding(GO:1904408) |
| 0.2 | 1.9 | GO:0042301 | phosphate ion binding(GO:0042301) |
| 0.2 | 0.7 | GO:0004487 | methylenetetrahydrofolate dehydrogenase (NAD+) activity(GO:0004487) |
| 0.2 | 1.5 | GO:0016670 | oxidoreductase activity, acting on a sulfur group of donors, oxygen as acceptor(GO:0016670) |
| 0.2 | 0.3 | GO:0016406 | carnitine O-acyltransferase activity(GO:0016406) |
| 0.2 | 1.8 | GO:0070181 | small ribosomal subunit rRNA binding(GO:0070181) |
| 0.2 | 2.7 | GO:0016290 | palmitoyl-CoA hydrolase activity(GO:0016290) |
| 0.2 | 1.8 | GO:0035014 | phosphatidylinositol 3-kinase regulator activity(GO:0035014) |
| 0.2 | 3.2 | GO:0035173 | histone kinase activity(GO:0035173) |
| 0.2 | 0.7 | GO:0008158 | hedgehog receptor activity(GO:0008158) |
| 0.2 | 1.2 | GO:1990050 | phosphatidic acid transporter activity(GO:1990050) |
| 0.2 | 0.8 | GO:0031750 | D3 dopamine receptor binding(GO:0031750) |
| 0.2 | 4.3 | GO:0017166 | vinculin binding(GO:0017166) |
| 0.2 | 1.6 | GO:0004689 | phosphorylase kinase activity(GO:0004689) |
| 0.2 | 1.0 | GO:0004614 | phosphoglucomutase activity(GO:0004614) |
| 0.2 | 1.9 | GO:0042975 | peroxisome proliferator activated receptor binding(GO:0042975) |
| 0.2 | 1.8 | GO:0004849 | uridine kinase activity(GO:0004849) |
| 0.2 | 0.5 | GO:0000099 | sulfur amino acid transmembrane transporter activity(GO:0000099) |
| 0.2 | 3.9 | GO:0008191 | metalloendopeptidase inhibitor activity(GO:0008191) |
| 0.2 | 0.5 | GO:0019957 | C-C chemokine binding(GO:0019957) |
| 0.2 | 4.4 | GO:0051010 | microtubule plus-end binding(GO:0051010) |
| 0.2 | 0.9 | GO:0005353 | fructose transmembrane transporter activity(GO:0005353) |
| 0.2 | 0.8 | GO:0016402 | pristanoyl-CoA oxidase activity(GO:0016402) |
| 0.2 | 0.6 | GO:0033823 | procollagen-lysine 5-dioxygenase activity(GO:0008475) procollagen glucosyltransferase activity(GO:0033823) |
| 0.2 | 2.4 | GO:0003995 | acyl-CoA dehydrogenase activity(GO:0003995) |
| 0.1 | 0.1 | GO:0015229 | L-ascorbate:sodium symporter activity(GO:0008520) L-ascorbic acid transporter activity(GO:0015229) sodium-dependent L-ascorbate transmembrane transporter activity(GO:0070890) |
| 0.1 | 0.1 | GO:0071837 | HMG box domain binding(GO:0071837) |
| 0.1 | 0.7 | GO:0005502 | 11-cis retinal binding(GO:0005502) |
| 0.1 | 0.3 | GO:0016634 | oxidoreductase activity, acting on the CH-CH group of donors, oxygen as acceptor(GO:0016634) |
| 0.1 | 0.4 | GO:0047012 | C-3 sterol dehydrogenase (C-4 sterol decarboxylase) activity(GO:0000252) sterol-4-alpha-carboxylate 3-dehydrogenase (decarboxylating) activity(GO:0047012) |
| 0.1 | 2.6 | GO:0003680 | AT DNA binding(GO:0003680) |
| 0.1 | 2.2 | GO:1901612 | cardiolipin binding(GO:1901612) |
| 0.1 | 0.4 | GO:0004346 | glucose-6-phosphatase activity(GO:0004346) sugar-terminal-phosphatase activity(GO:0050309) |
| 0.1 | 1.0 | GO:0031871 | proteinase activated receptor binding(GO:0031871) |
| 0.1 | 5.7 | GO:0017075 | syntaxin-1 binding(GO:0017075) |
| 0.1 | 0.7 | GO:0016453 | C-acetyltransferase activity(GO:0016453) |
| 0.1 | 0.6 | GO:0032422 | purine-rich negative regulatory element binding(GO:0032422) |
| 0.1 | 0.4 | GO:0004421 | hydroxymethylglutaryl-CoA synthase activity(GO:0004421) |
| 0.1 | 0.4 | GO:0044594 | 3alpha,7alpha,12alpha-trihydroxy-5beta-cholest-24-enoyl-CoA hydratase activity(GO:0033989) 17-beta-hydroxysteroid dehydrogenase (NAD+) activity(GO:0044594) |
| 0.1 | 1.1 | GO:0035368 | selenocysteine insertion sequence binding(GO:0035368) |
| 0.1 | 1.1 | GO:0004468 | lysine N-acetyltransferase activity, acting on acetyl phosphate as donor(GO:0004468) |
| 0.1 | 0.6 | GO:0035877 | death effector domain binding(GO:0035877) |
| 0.1 | 1.4 | GO:0042799 | histone methyltransferase activity (H4-K20 specific)(GO:0042799) |
| 0.1 | 0.7 | GO:0046912 | transferase activity, transferring acyl groups, acyl groups converted into alkyl on transfer(GO:0046912) |
| 0.1 | 1.7 | GO:0004679 | AMP-activated protein kinase activity(GO:0004679) |
| 0.1 | 0.3 | GO:0005010 | insulin-like growth factor-activated receptor activity(GO:0005010) |
| 0.1 | 0.5 | GO:0019107 | glycylpeptide N-tetradecanoyltransferase activity(GO:0004379) myristoyltransferase activity(GO:0019107) |
| 0.1 | 1.0 | GO:0046976 | histone methyltransferase activity (H3-K27 specific)(GO:0046976) |
| 0.1 | 2.5 | GO:0000062 | fatty-acyl-CoA binding(GO:0000062) |
| 0.1 | 0.3 | GO:0031749 | D2 dopamine receptor binding(GO:0031749) |
| 0.1 | 0.4 | GO:0008511 | sodium:potassium:chloride symporter activity(GO:0008511) |
| 0.1 | 0.5 | GO:0003883 | CTP synthase activity(GO:0003883) |
| 0.1 | 0.4 | GO:0008431 | vitamin E binding(GO:0008431) |
| 0.1 | 0.7 | GO:0003875 | ADP-ribosylarginine hydrolase activity(GO:0003875) |
| 0.1 | 0.7 | GO:0048030 | lactose binding(GO:0030395) disaccharide binding(GO:0048030) |
| 0.1 | 0.4 | GO:0090541 | MIT domain binding(GO:0090541) |
| 0.1 | 0.3 | GO:0043398 | HLH domain binding(GO:0043398) |
| 0.1 | 0.5 | GO:0008192 | RNA guanylyltransferase activity(GO:0008192) |
| 0.1 | 0.4 | GO:0071207 | histone pre-mRNA stem-loop binding(GO:0071207) |
| 0.1 | 0.9 | GO:0004771 | sterol esterase activity(GO:0004771) |
| 0.1 | 0.8 | GO:0047237 | glucuronylgalactosylproteoglycan 4-beta-N-acetylgalactosaminyltransferase activity(GO:0047237) |
| 0.1 | 0.7 | GO:0016230 | sphingomyelin phosphodiesterase activator activity(GO:0016230) |
| 0.1 | 4.6 | GO:0032266 | phosphatidylinositol-3-phosphate binding(GO:0032266) |
| 0.1 | 0.3 | GO:0016890 | site-specific endodeoxyribonuclease activity, specific for altered base(GO:0016890) |
| 0.1 | 1.6 | GO:0050291 | sphingosine N-acyltransferase activity(GO:0050291) |
| 0.1 | 0.4 | GO:0008670 | 2,4-dienoyl-CoA reductase (NADPH) activity(GO:0008670) |
| 0.1 | 2.2 | GO:0000150 | recombinase activity(GO:0000150) |
| 0.1 | 0.8 | GO:0004694 | eukaryotic translation initiation factor 2alpha kinase activity(GO:0004694) |
| 0.1 | 1.3 | GO:0010859 | calcium-dependent cysteine-type endopeptidase inhibitor activity(GO:0010859) |
| 0.1 | 2.3 | GO:0047372 | acylglycerol lipase activity(GO:0047372) |
| 0.1 | 1.0 | GO:0016403 | dimethylargininase activity(GO:0016403) |
| 0.1 | 0.4 | GO:0004577 | N-acetylglucosaminyldiphosphodolichol N-acetylglucosaminyltransferase activity(GO:0004577) |
| 0.1 | 0.6 | GO:0050436 | microfibril binding(GO:0050436) |
| 0.1 | 2.5 | GO:0043495 | protein anchor(GO:0043495) |
| 0.1 | 0.4 | GO:0044713 | GTP diphosphatase activity(GO:0036219) 2-hydroxy-adenosine triphosphate pyrophosphatase activity(GO:0044713) 2-hydroxy-(deoxy)adenosine-triphosphate pyrophosphatase activity(GO:0044714) ATP diphosphatase activity(GO:0047693) |
| 0.1 | 0.9 | GO:0031419 | cobalamin binding(GO:0031419) |
| 0.1 | 0.5 | GO:0016262 | protein N-acetylglucosaminyltransferase activity(GO:0016262) |
| 0.1 | 2.4 | GO:0008179 | adenylate cyclase binding(GO:0008179) |
| 0.1 | 3.4 | GO:0000030 | mannosyltransferase activity(GO:0000030) |
| 0.1 | 0.9 | GO:0047057 | oxidoreductase activity, acting on the CH-OH group of donors, disulfide as acceptor(GO:0016900) vitamin-K-epoxide reductase (warfarin-sensitive) activity(GO:0047057) |
| 0.1 | 2.6 | GO:0102391 | decanoate--CoA ligase activity(GO:0102391) |
| 0.1 | 1.9 | GO:0004559 | alpha-mannosidase activity(GO:0004559) |
| 0.1 | 0.4 | GO:0070119 | interleukin-6 receptor activity(GO:0004915) interleukin-6 binding(GO:0019981) ciliary neurotrophic factor binding(GO:0070119) |
| 0.1 | 0.1 | GO:0034186 | apolipoprotein A-I binding(GO:0034186) |
| 0.1 | 0.9 | GO:0001727 | lipid kinase activity(GO:0001727) |
| 0.1 | 0.5 | GO:0042132 | fructose 1,6-bisphosphate 1-phosphatase activity(GO:0042132) |
| 0.1 | 0.6 | GO:0004104 | cholinesterase activity(GO:0004104) |
| 0.1 | 6.6 | GO:0005158 | insulin receptor binding(GO:0005158) |
| 0.1 | 0.6 | GO:0086062 | voltage-gated sodium channel activity involved in Purkinje myocyte action potential(GO:0086062) |
| 0.1 | 0.4 | GO:0043739 | G/U mismatch-specific uracil-DNA glycosylase activity(GO:0043739) |
| 0.1 | 0.6 | GO:1903135 | cupric ion binding(GO:1903135) |
| 0.1 | 2.7 | GO:0004185 | serine-type carboxypeptidase activity(GO:0004185) |
| 0.1 | 0.9 | GO:0004035 | alkaline phosphatase activity(GO:0004035) |
| 0.1 | 0.5 | GO:0004597 | peptide-aspartate beta-dioxygenase activity(GO:0004597) |
| 0.1 | 0.5 | GO:0071987 | WD40-repeat domain binding(GO:0071987) |
| 0.1 | 0.6 | GO:0032143 | single thymine insertion binding(GO:0032143) |
| 0.1 | 0.8 | GO:0016840 | carbon-nitrogen lyase activity(GO:0016840) |
| 0.1 | 0.1 | GO:0034040 | lipid-transporting ATPase activity(GO:0034040) sterol-transporting ATPase activity(GO:0034041) |
| 0.1 | 1.1 | GO:0010997 | anaphase-promoting complex binding(GO:0010997) |
| 0.1 | 1.0 | GO:0030291 | protein serine/threonine kinase inhibitor activity(GO:0030291) |
| 0.1 | 3.7 | GO:0097200 | cysteine-type endopeptidase activity involved in execution phase of apoptosis(GO:0097200) |
| 0.1 | 0.6 | GO:0005168 | neurotrophin TRKA receptor binding(GO:0005168) |
| 0.1 | 1.4 | GO:0015386 | potassium:proton antiporter activity(GO:0015386) |
| 0.1 | 2.7 | GO:0070628 | proteasome binding(GO:0070628) |
| 0.1 | 0.1 | GO:0038181 | bile acid receptor activity(GO:0038181) |
| 0.1 | 0.8 | GO:0015232 | heme transporter activity(GO:0015232) |
| 0.1 | 0.4 | GO:0008384 | IkappaB kinase activity(GO:0008384) |
| 0.1 | 0.6 | GO:0061676 | importin-alpha family protein binding(GO:0061676) |
| 0.1 | 0.6 | GO:0004882 | androgen receptor activity(GO:0004882) |
| 0.1 | 0.8 | GO:0036402 | proteasome-activating ATPase activity(GO:0036402) |
| 0.1 | 1.7 | GO:0032036 | myosin heavy chain binding(GO:0032036) |
| 0.1 | 0.7 | GO:0004310 | farnesyl-diphosphate farnesyltransferase activity(GO:0004310) squalene synthase activity(GO:0051996) |
| 0.1 | 0.6 | GO:0070735 | protein-glycine ligase activity(GO:0070735) |
| 0.1 | 0.7 | GO:0090554 | phosphatidylcholine-translocating ATPase activity(GO:0090554) |
| 0.1 | 0.3 | GO:0071209 | U7 snRNA binding(GO:0071209) |
| 0.1 | 0.4 | GO:0019237 | centromeric DNA binding(GO:0019237) |
| 0.1 | 0.6 | GO:0086077 | gap junction channel activity involved in AV node cell-bundle of His cell electrical coupling(GO:0086077) |
| 0.1 | 0.3 | GO:0030158 | protein xylosyltransferase activity(GO:0030158) |
| 0.1 | 0.6 | GO:0047844 | deoxycytidine deaminase activity(GO:0047844) |
| 0.1 | 0.3 | GO:0005163 | nerve growth factor receptor binding(GO:0005163) |
| 0.1 | 2.0 | GO:0005522 | profilin binding(GO:0005522) |
| 0.1 | 0.7 | GO:0004534 | 5'-3' exoribonuclease activity(GO:0004534) |
| 0.1 | 1.1 | GO:0047429 | nucleoside-triphosphate diphosphatase activity(GO:0047429) |
| 0.1 | 0.9 | GO:0030368 | interleukin-17 receptor activity(GO:0030368) |
| 0.1 | 0.8 | GO:0102344 | 3-hydroxy-behenoyl-CoA dehydratase activity(GO:0102344) 3-hydroxy-lignoceroyl-CoA dehydratase activity(GO:0102345) |
| 0.1 | 0.1 | GO:0016312 | inositol bisphosphate phosphatase activity(GO:0016312) |
| 0.1 | 0.5 | GO:0032184 | SUMO polymer binding(GO:0032184) |
| 0.1 | 0.5 | GO:0030298 | receptor signaling protein tyrosine kinase activator activity(GO:0030298) |
| 0.1 | 6.6 | GO:0030374 | ligand-dependent nuclear receptor transcription coactivator activity(GO:0030374) |
| 0.1 | 0.4 | GO:0031826 | type 2A serotonin receptor binding(GO:0031826) |
| 0.1 | 1.0 | GO:0008409 | 5'-3' exonuclease activity(GO:0008409) |
| 0.1 | 0.5 | GO:0008508 | bile acid:sodium symporter activity(GO:0008508) |
| 0.1 | 0.3 | GO:0030229 | very-low-density lipoprotein particle receptor activity(GO:0030229) |
| 0.1 | 0.8 | GO:0050815 | phosphoserine binding(GO:0050815) |
| 0.1 | 0.4 | GO:0003953 | NAD+ nucleosidase activity(GO:0003953) |
| 0.1 | 3.4 | GO:0005092 | GDP-dissociation inhibitor activity(GO:0005092) |
| 0.1 | 0.3 | GO:0030337 | DNA polymerase processivity factor activity(GO:0030337) |
| 0.1 | 0.6 | GO:0039552 | RIG-I binding(GO:0039552) |
| 0.1 | 0.4 | GO:0043273 | CTPase activity(GO:0043273) |
| 0.1 | 0.7 | GO:0000293 | ferric-chelate reductase activity(GO:0000293) |
| 0.1 | 0.9 | GO:0099580 | ion antiporter activity involved in regulation of postsynaptic membrane potential(GO:0099580) |
| 0.1 | 0.3 | GO:0004877 | complement component C4b receptor activity(GO:0001861) complement component C3b receptor activity(GO:0004877) |
| 0.1 | 0.3 | GO:0003829 | beta-1,3-galactosyl-O-glycosyl-glycoprotein beta-1,6-N-acetylglucosaminyltransferase activity(GO:0003829) |
| 0.1 | 1.2 | GO:0008603 | cAMP-dependent protein kinase regulator activity(GO:0008603) |
| 0.1 | 0.3 | GO:0046921 | glycoprotein 6-alpha-L-fucosyltransferase activity(GO:0008424) alpha-(1->6)-fucosyltransferase activity(GO:0046921) |
| 0.1 | 0.3 | GO:0008466 | glycogenin glucosyltransferase activity(GO:0008466) |
| 0.1 | 0.2 | GO:0070568 | guanylyltransferase activity(GO:0070568) |
| 0.1 | 0.8 | GO:0048039 | ubiquinone binding(GO:0048039) |
| 0.1 | 1.4 | GO:0046790 | virion binding(GO:0046790) |
| 0.1 | 1.3 | GO:1990247 | N6-methyladenosine-containing RNA binding(GO:1990247) |
| 0.1 | 0.3 | GO:0004874 | aryl hydrocarbon receptor activity(GO:0004874) |
| 0.1 | 0.6 | GO:0070008 | serine-type exopeptidase activity(GO:0070008) |
| 0.1 | 0.3 | GO:1901611 | phosphatidylglycerol binding(GO:1901611) |
| 0.1 | 0.4 | GO:0061628 | H3K27me3 modified histone binding(GO:0061628) |
| 0.1 | 1.4 | GO:0055056 | D-glucose transmembrane transporter activity(GO:0055056) |
| 0.1 | 1.0 | GO:0043023 | ribosomal large subunit binding(GO:0043023) |
| 0.1 | 0.5 | GO:0004883 | glucocorticoid receptor activity(GO:0004883) glucocorticoid-activated RNA polymerase II transcription factor binding transcription factor activity(GO:0038051) |
| 0.1 | 2.3 | GO:0016641 | oxidoreductase activity, acting on the CH-NH2 group of donors, oxygen as acceptor(GO:0016641) |
| 0.1 | 0.4 | GO:0017089 | glycolipid transporter activity(GO:0017089) |
| 0.1 | 0.5 | GO:0070653 | high-density lipoprotein particle receptor binding(GO:0070653) |
| 0.1 | 0.5 | GO:0033857 | diphosphoinositol-pentakisphosphate kinase activity(GO:0033857) |
| 0.1 | 0.6 | GO:0070996 | type 1 melanocortin receptor binding(GO:0070996) |
| 0.1 | 0.3 | GO:0035035 | histone acetyltransferase binding(GO:0035035) |
| 0.1 | 0.3 | GO:0048256 | flap endonuclease activity(GO:0048256) |
| 0.1 | 0.5 | GO:0004774 | succinate-CoA ligase activity(GO:0004774) |
| 0.1 | 0.7 | GO:0016361 | activin receptor activity, type I(GO:0016361) |
| 0.1 | 0.2 | GO:0000822 | inositol hexakisphosphate binding(GO:0000822) |
| 0.1 | 0.4 | GO:0050262 | ribosylnicotinamide kinase activity(GO:0050262) ribosylnicotinate kinase activity(GO:0061769) |
| 0.1 | 0.6 | GO:0051032 | nucleic acid transmembrane transporter activity(GO:0051032) RNA transmembrane transporter activity(GO:0051033) |
| 0.1 | 0.4 | GO:0004146 | dihydrofolate reductase activity(GO:0004146) |
| 0.1 | 0.7 | GO:0015299 | solute:proton antiporter activity(GO:0015299) |
| 0.1 | 0.4 | GO:0004078 | biotin-[acetyl-CoA-carboxylase] ligase activity(GO:0004077) biotin-[methylcrotonoyl-CoA-carboxylase] ligase activity(GO:0004078) biotin-[methylmalonyl-CoA-carboxytransferase] ligase activity(GO:0004079) biotin-[propionyl-CoA-carboxylase (ATP-hydrolyzing)] ligase activity(GO:0004080) biotin-protein ligase activity(GO:0018271) |
| 0.1 | 3.3 | GO:0070273 | phosphatidylinositol-4-phosphate binding(GO:0070273) |
| 0.1 | 0.7 | GO:0000400 | four-way junction DNA binding(GO:0000400) |
| 0.1 | 0.6 | GO:0008948 | oxaloacetate decarboxylase activity(GO:0008948) |
| 0.1 | 1.5 | GO:0051787 | misfolded protein binding(GO:0051787) |
| 0.1 | 0.5 | GO:0036033 | mediator complex binding(GO:0036033) |
| 0.1 | 2.4 | GO:0017160 | Ral GTPase binding(GO:0017160) |
| 0.1 | 0.5 | GO:0030346 | protein phosphatase 2B binding(GO:0030346) |
| 0.1 | 1.4 | GO:0004438 | phosphatidylinositol-3-phosphatase activity(GO:0004438) phosphatidylinositol monophosphate phosphatase activity(GO:0052744) |
| 0.1 | 1.3 | GO:0016884 | carbon-nitrogen ligase activity, with glutamine as amido-N-donor(GO:0016884) |
| 0.1 | 8.2 | GO:0008307 | structural constituent of muscle(GO:0008307) |
| 0.1 | 1.6 | GO:0043295 | glutathione binding(GO:0043295) |
| 0.1 | 1.9 | GO:0035497 | cAMP response element binding(GO:0035497) |
| 0.1 | 0.5 | GO:0051373 | FATZ binding(GO:0051373) |
| 0.1 | 0.3 | GO:0008534 | oxidized purine nucleobase lesion DNA N-glycosylase activity(GO:0008534) |
| 0.1 | 0.4 | GO:0016774 | phosphotransferase activity, carboxyl group as acceptor(GO:0016774) |
| 0.1 | 0.2 | GO:0031716 | calcitonin receptor binding(GO:0031716) |
| 0.1 | 0.4 | GO:0051021 | GDP-dissociation inhibitor binding(GO:0051021) Rho GDP-dissociation inhibitor binding(GO:0051022) |
| 0.1 | 0.2 | GO:0016715 | oxidoreductase activity, acting on paired donors, with incorporation or reduction of molecular oxygen, reduced ascorbate as one donor, and incorporation of one atom of oxygen(GO:0016715) |
| 0.1 | 1.8 | GO:0043325 | phosphatidylinositol-3,4-bisphosphate binding(GO:0043325) |
| 0.1 | 0.3 | GO:0050119 | N-acetylglucosamine deacetylase activity(GO:0050119) |
| 0.1 | 6.8 | GO:0035255 | ionotropic glutamate receptor binding(GO:0035255) |
| 0.1 | 2.3 | GO:0015278 | calcium-release channel activity(GO:0015278) ligand-gated calcium channel activity(GO:0099604) |
| 0.1 | 1.0 | GO:0034713 | type I transforming growth factor beta receptor binding(GO:0034713) |
| 0.1 | 0.8 | GO:0005068 | transmembrane receptor protein tyrosine kinase adaptor activity(GO:0005068) |
| 0.1 | 1.3 | GO:0008140 | cAMP response element binding protein binding(GO:0008140) |
| 0.1 | 1.8 | GO:0019789 | SUMO transferase activity(GO:0019789) |
| 0.1 | 0.6 | GO:0005134 | interleukin-2 receptor binding(GO:0005134) |
| 0.1 | 0.1 | GO:0005119 | smoothened binding(GO:0005119) |
| 0.1 | 0.4 | GO:0001165 | RNA polymerase I upstream control element sequence-specific DNA binding(GO:0001165) |
| 0.1 | 0.3 | GO:0015056 | corticotrophin-releasing factor receptor activity(GO:0015056) |
| 0.1 | 0.3 | GO:0038049 | transcription factor activity, ligand-activated RNA polymerase II transcription factor binding(GO:0038049) |
| 0.1 | 0.2 | GO:0019777 | Atg12 transferase activity(GO:0019777) |
| 0.1 | 0.3 | GO:0004949 | cannabinoid receptor activity(GO:0004949) |
| 0.1 | 2.5 | GO:0046961 | ATPase activity, coupled to transmembrane movement of ions, rotational mechanism(GO:0044769) proton-transporting ATPase activity, rotational mechanism(GO:0046961) |
| 0.1 | 0.2 | GO:0000386 | second spliceosomal transesterification activity(GO:0000386) |
| 0.1 | 0.7 | GO:1990226 | histone methyltransferase binding(GO:1990226) |
| 0.1 | 0.6 | GO:1990380 | Lys48-specific deubiquitinase activity(GO:1990380) |
| 0.1 | 2.3 | GO:0050431 | transforming growth factor beta binding(GO:0050431) |
| 0.1 | 0.8 | GO:1990948 | ligase inhibitor activity(GO:0055104) ubiquitin ligase inhibitor activity(GO:1990948) |
| 0.1 | 1.0 | GO:0016671 | oxidoreductase activity, acting on a sulfur group of donors, disulfide as acceptor(GO:0016671) |
| 0.1 | 0.2 | GO:0016855 | racemase and epimerase activity, acting on amino acids and derivatives(GO:0016855) racemase activity, acting on amino acids and derivatives(GO:0036361) amino-acid racemase activity(GO:0047661) |
| 0.1 | 0.3 | GO:0008035 | high-density lipoprotein particle binding(GO:0008035) |
| 0.1 | 0.1 | GO:0034739 | histone deacetylase activity (H4-K16 specific)(GO:0034739) |
| 0.1 | 0.4 | GO:0046964 | 3'-phosphoadenosine 5'-phosphosulfate transmembrane transporter activity(GO:0046964) |
| 0.1 | 0.3 | GO:0004420 | hydroxymethylglutaryl-CoA reductase (NADPH) activity(GO:0004420) hydroxymethylglutaryl-CoA reductase activity(GO:0042282) |
| 0.1 | 0.8 | GO:0050811 | GABA receptor binding(GO:0050811) |
| 0.1 | 0.4 | GO:0042954 | lipoprotein transporter activity(GO:0042954) |
| 0.1 | 0.5 | GO:0003988 | acetyl-CoA C-acyltransferase activity(GO:0003988) |
| 0.1 | 6.0 | GO:0035064 | methylated histone binding(GO:0035064) |
| 0.1 | 0.2 | GO:0050571 | 1,5-anhydro-D-fructose reductase activity(GO:0050571) |
| 0.1 | 1.8 | GO:0031418 | L-ascorbic acid binding(GO:0031418) |
| 0.1 | 0.4 | GO:0004800 | thyroxine 5'-deiodinase activity(GO:0004800) |
| 0.1 | 0.5 | GO:0001594 | trace-amine receptor activity(GO:0001594) |
| 0.1 | 0.2 | GO:0031711 | bradykinin receptor binding(GO:0031711) |
| 0.1 | 2.2 | GO:0070530 | K63-linked polyubiquitin binding(GO:0070530) |
| 0.1 | 0.5 | GO:0003998 | acylphosphatase activity(GO:0003998) |
| 0.1 | 0.5 | GO:0004862 | cAMP-dependent protein kinase inhibitor activity(GO:0004862) |
| 0.1 | 0.2 | GO:0005483 | soluble NSF attachment protein activity(GO:0005483) |
| 0.1 | 0.2 | GO:0004301 | epoxide hydrolase activity(GO:0004301) |
| 0.1 | 0.2 | GO:0004638 | phosphoribosylaminoimidazole carboxylase activity(GO:0004638) phosphoribosylaminoimidazolesuccinocarboxamide synthase activity(GO:0004639) |
| 0.1 | 6.3 | GO:0004004 | ATP-dependent RNA helicase activity(GO:0004004) |
| 0.1 | 0.1 | GO:0086059 | voltage-gated calcium channel activity involved SA node cell action potential(GO:0086059) |
| 0.1 | 0.3 | GO:0032453 | histone demethylase activity (H3-K4 specific)(GO:0032453) |
| 0.1 | 0.8 | GO:1990825 | sequence-specific mRNA binding(GO:1990825) |
| 0.1 | 0.1 | GO:0019763 | immunoglobulin receptor activity(GO:0019763) |
| 0.1 | 1.1 | GO:0031681 | G-protein beta-subunit binding(GO:0031681) |
| 0.1 | 0.5 | GO:0010484 | H3 histone acetyltransferase activity(GO:0010484) |
| 0.1 | 0.8 | GO:0051011 | microtubule minus-end binding(GO:0051011) |
| 0.1 | 0.3 | GO:0003943 | N-acetylgalactosamine-4-sulfatase activity(GO:0003943) |
| 0.1 | 0.8 | GO:0004972 | NMDA glutamate receptor activity(GO:0004972) |
| 0.1 | 2.8 | GO:0005086 | ARF guanyl-nucleotide exchange factor activity(GO:0005086) |
| 0.1 | 0.8 | GO:0097371 | MDM2/MDM4 family protein binding(GO:0097371) |
| 0.1 | 0.3 | GO:0047757 | chondroitin-glucuronate 5-epimerase activity(GO:0047757) |
| 0.1 | 1.0 | GO:0019104 | DNA N-glycosylase activity(GO:0019104) |
| 0.1 | 0.2 | GO:0047783 | steroid 11-beta-monooxygenase activity(GO:0004507) corticosterone 18-monooxygenase activity(GO:0047783) |
| 0.1 | 2.5 | GO:0071617 | 1-acylglycerol-3-phosphate O-acyltransferase activity(GO:0003841) lysophosphatidic acid acyltransferase activity(GO:0042171) lysophospholipid acyltransferase activity(GO:0071617) |
| 0.1 | 1.0 | GO:0045504 | dynein heavy chain binding(GO:0045504) |
| 0.1 | 6.6 | GO:0008080 | N-acetyltransferase activity(GO:0008080) |
| 0.1 | 0.1 | GO:0044729 | hemi-methylated DNA-binding(GO:0044729) |
| 0.1 | 1.6 | GO:0008195 | phosphatidate phosphatase activity(GO:0008195) |
| 0.1 | 0.2 | GO:0016155 | formyltetrahydrofolate dehydrogenase activity(GO:0016155) |
| 0.1 | 0.1 | GO:0035276 | ethanol binding(GO:0035276) |
| 0.1 | 1.4 | GO:0070577 | lysine-acetylated histone binding(GO:0070577) |
| 0.1 | 0.3 | GO:0004996 | thyroid-stimulating hormone receptor activity(GO:0004996) |
| 0.1 | 0.2 | GO:0032139 | dinucleotide insertion or deletion binding(GO:0032139) |
| 0.1 | 0.1 | GO:0036505 | prosaposin receptor activity(GO:0036505) |
| 0.1 | 0.9 | GO:0001103 | RNA polymerase II repressing transcription factor binding(GO:0001103) |
| 0.1 | 3.0 | GO:0004890 | GABA-A receptor activity(GO:0004890) |
| 0.1 | 1.6 | GO:0044548 | S100 protein binding(GO:0044548) |
| 0.1 | 3.2 | GO:0051539 | 4 iron, 4 sulfur cluster binding(GO:0051539) |
| 0.1 | 0.5 | GO:0044323 | retinoic acid-responsive element binding(GO:0044323) |
| 0.1 | 0.6 | GO:0031697 | beta-1 adrenergic receptor binding(GO:0031697) |
| 0.1 | 0.3 | GO:0008821 | crossover junction endodeoxyribonuclease activity(GO:0008821) |
| 0.1 | 0.8 | GO:0008020 | G-protein coupled photoreceptor activity(GO:0008020) |
| 0.1 | 0.2 | GO:0004583 | dolichyl-phosphate-glucose-glycolipid alpha-glucosyltransferase activity(GO:0004583) |
| 0.1 | 0.3 | GO:1990254 | keratin filament binding(GO:1990254) |
| 0.1 | 2.9 | GO:0008094 | DNA-dependent ATPase activity(GO:0008094) |
| 0.1 | 0.3 | GO:0032795 | heterotrimeric G-protein binding(GO:0032795) |
| 0.1 | 1.0 | GO:0061578 | Lys63-specific deubiquitinase activity(GO:0061578) |
| 0.1 | 1.3 | GO:0008266 | poly(U) RNA binding(GO:0008266) |
| 0.1 | 0.2 | GO:0043035 | chromatin insulator sequence binding(GO:0043035) |
| 0.1 | 0.5 | GO:0008479 | queuine tRNA-ribosyltransferase activity(GO:0008479) |
| 0.1 | 1.0 | GO:0000774 | adenyl-nucleotide exchange factor activity(GO:0000774) |
| 0.1 | 0.7 | GO:0005412 | glucose:sodium symporter activity(GO:0005412) |
| 0.1 | 0.3 | GO:0001094 | TFIID-class transcription factor binding(GO:0001094) |
| 0.1 | 0.3 | GO:0016934 | inhibitory extracellular ligand-gated ion channel activity(GO:0005237) extracellular-glycine-gated ion channel activity(GO:0016933) extracellular-glycine-gated chloride channel activity(GO:0016934) |
| 0.1 | 1.6 | GO:0097602 | cullin family protein binding(GO:0097602) |
| 0.1 | 0.6 | GO:0008379 | thioredoxin peroxidase activity(GO:0008379) |
| 0.1 | 0.6 | GO:0015277 | kainate selective glutamate receptor activity(GO:0015277) |
| 0.1 | 0.2 | GO:0035605 | peptidyl-cysteine S-nitrosylase activity(GO:0035605) |
| 0.1 | 0.2 | GO:0071535 | RING-like zinc finger domain binding(GO:0071535) |
| 0.1 | 0.5 | GO:0070492 | oligosaccharide binding(GO:0070492) |
| 0.1 | 0.7 | GO:0015288 | porin activity(GO:0015288) |
| 0.1 | 0.5 | GO:0008443 | phosphofructokinase activity(GO:0008443) |
| 0.1 | 0.1 | GO:0008665 | 2'-phosphotransferase activity(GO:0008665) |
| 0.1 | 0.4 | GO:0004873 | asialoglycoprotein receptor activity(GO:0004873) |
| 0.1 | 0.6 | GO:0038036 | sphingosine-1-phosphate receptor activity(GO:0038036) |
| 0.1 | 0.1 | GO:0035033 | histone deacetylase regulator activity(GO:0035033) |
| 0.1 | 0.4 | GO:0016778 | diphosphotransferase activity(GO:0016778) |
| 0.1 | 1.4 | GO:0031005 | filamin binding(GO:0031005) |
| 0.1 | 0.3 | GO:0051731 | polynucleotide 5'-hydroxyl-kinase activity(GO:0051731) |
| 0.1 | 1.0 | GO:0045294 | alpha-catenin binding(GO:0045294) |
| 0.1 | 0.6 | GO:0035613 | RNA stem-loop binding(GO:0035613) |
| 0.1 | 0.3 | GO:0001156 | TFIIIC-class transcription factor binding(GO:0001156) |
| 0.1 | 0.1 | GO:1904713 | beta-catenin destruction complex binding(GO:1904713) |
| 0.1 | 1.2 | GO:0001104 | RNA polymerase II transcription cofactor activity(GO:0001104) |
| 0.1 | 0.2 | GO:0004127 | cytidylate kinase activity(GO:0004127) |
| 0.1 | 0.5 | GO:0031730 | CCR5 chemokine receptor binding(GO:0031730) |
| 0.1 | 0.6 | GO:0016206 | catechol O-methyltransferase activity(GO:0016206) |
| 0.1 | 2.4 | GO:0004180 | carboxypeptidase activity(GO:0004180) |
| 0.1 | 2.0 | GO:0004707 | MAP kinase activity(GO:0004707) |
| 0.1 | 0.4 | GO:0016427 | tRNA (cytosine) methyltransferase activity(GO:0016427) |
| 0.1 | 0.2 | GO:0030550 | acetylcholine receptor inhibitor activity(GO:0030550) |
| 0.1 | 0.4 | GO:0035473 | lipase binding(GO:0035473) |
| 0.1 | 0.5 | GO:0097157 | pre-mRNA intronic binding(GO:0097157) |
| 0.1 | 1.1 | GO:0070717 | poly-purine tract binding(GO:0070717) |
| 0.1 | 0.5 | GO:0042731 | PH domain binding(GO:0042731) |
| 0.1 | 0.2 | GO:0035515 | oxidative RNA demethylase activity(GO:0035515) |
| 0.1 | 0.1 | GO:1990763 | arrestin family protein binding(GO:1990763) |
| 0.1 | 0.1 | GO:0044547 | DNA topoisomerase binding(GO:0044547) |
| 0.1 | 0.5 | GO:0034235 | GPI anchor binding(GO:0034235) |
| 0.1 | 0.2 | GO:0002094 | polyprenyltransferase activity(GO:0002094) |
| 0.1 | 0.3 | GO:0004966 | galanin receptor activity(GO:0004966) |
| 0.1 | 2.6 | GO:0008139 | nuclear localization sequence binding(GO:0008139) |
| 0.1 | 0.1 | GO:0032767 | copper-dependent protein binding(GO:0032767) |
| 0.1 | 1.1 | GO:0015467 | G-protein activated inward rectifier potassium channel activity(GO:0015467) |
| 0.1 | 0.3 | GO:0016941 | natriuretic peptide receptor activity(GO:0016941) |
| 0.1 | 0.2 | GO:0047708 | biotinidase activity(GO:0047708) |
| 0.1 | 0.2 | GO:0008422 | beta-glucosidase activity(GO:0008422) |
| 0.1 | 0.9 | GO:0043422 | protein kinase B binding(GO:0043422) |
| 0.1 | 0.2 | GO:0005173 | stem cell factor receptor binding(GO:0005173) |
| 0.1 | 0.2 | GO:0003986 | acetyl-CoA hydrolase activity(GO:0003986) |
| 0.1 | 0.3 | GO:0030109 | HLA-B specific inhibitory MHC class I receptor activity(GO:0030109) |
| 0.1 | 0.2 | GO:0004886 | 9-cis retinoic acid receptor activity(GO:0004886) |
| 0.1 | 0.2 | GO:0010698 | acetyltransferase activator activity(GO:0010698) |
| 0.1 | 0.2 | GO:0051431 | corticotropin-releasing hormone receptor 2 binding(GO:0051431) |
| 0.1 | 3.6 | GO:0050681 | androgen receptor binding(GO:0050681) |
| 0.1 | 0.3 | GO:0004839 | ubiquitin activating enzyme activity(GO:0004839) |
| 0.1 | 0.3 | GO:0034603 | pyruvate dehydrogenase activity(GO:0004738) pyruvate dehydrogenase [NAD(P)+] activity(GO:0034603) pyruvate dehydrogenase (NAD+) activity(GO:0034604) |
| 0.1 | 3.1 | GO:0003678 | DNA helicase activity(GO:0003678) |
| 0.1 | 0.4 | GO:0003960 | NADPH:quinone reductase activity(GO:0003960) |
| 0.1 | 1.4 | GO:0000339 | RNA cap binding(GO:0000339) |
| 0.1 | 0.2 | GO:0003923 | GPI-anchor transamidase activity(GO:0003923) |
| 0.1 | 1.3 | GO:0070742 | C2H2 zinc finger domain binding(GO:0070742) |
| 0.1 | 1.3 | GO:0046966 | thyroid hormone receptor binding(GO:0046966) |
| 0.1 | 0.2 | GO:0098918 | structural constituent of synapse(GO:0098918) structural constituent of postsynaptic actin cytoskeleton(GO:0098973) |
| 0.1 | 0.9 | GO:0008536 | Ran GTPase binding(GO:0008536) |
| 0.1 | 0.4 | GO:0001222 | transcription corepressor binding(GO:0001222) |
| 0.1 | 0.2 | GO:0005137 | interleukin-5 receptor binding(GO:0005137) |
| 0.1 | 0.4 | GO:0019863 | IgE binding(GO:0019863) |
| 0.1 | 0.1 | GO:0004999 | vasoactive intestinal polypeptide receptor activity(GO:0004999) |
| 0.1 | 0.2 | GO:0004563 | beta-N-acetylhexosaminidase activity(GO:0004563) |
| 0.1 | 0.4 | GO:0043199 | sulfate binding(GO:0043199) |
| 0.1 | 0.2 | GO:0004448 | isocitrate dehydrogenase activity(GO:0004448) isocitrate dehydrogenase (NAD+) activity(GO:0004449) |
| 0.1 | 0.4 | GO:0004735 | pyrroline-5-carboxylate reductase activity(GO:0004735) |
| 0.1 | 0.2 | GO:0003826 | alpha-ketoacid dehydrogenase activity(GO:0003826) 3-methyl-2-oxobutanoate dehydrogenase (2-methylpropanoyl-transferring) activity(GO:0003863) |
| 0.1 | 0.6 | GO:0030618 | transforming growth factor beta receptor, pathway-specific cytoplasmic mediator activity(GO:0030618) |
| 0.1 | 0.5 | GO:0004032 | alditol:NADP+ 1-oxidoreductase activity(GO:0004032) |
| 0.1 | 0.5 | GO:0016004 | phospholipase activator activity(GO:0016004) |
| 0.1 | 0.2 | GO:0036080 | GDP-fucose transmembrane transporter activity(GO:0005457) purine nucleotide-sugar transmembrane transporter activity(GO:0036080) |
| 0.1 | 0.6 | GO:1990459 | transferrin receptor binding(GO:1990459) |
| 0.1 | 0.2 | GO:0003692 | left-handed Z-DNA binding(GO:0003692) |
| 0.0 | 0.5 | GO:0008428 | ribonuclease inhibitor activity(GO:0008428) |
| 0.0 | 2.7 | GO:0034987 | immunoglobulin receptor binding(GO:0034987) |
| 0.0 | 0.4 | GO:0046870 | cadmium ion binding(GO:0046870) |
| 0.0 | 0.2 | GO:0004348 | glucosylceramidase activity(GO:0004348) |
| 0.0 | 1.3 | GO:0070006 | metalloaminopeptidase activity(GO:0070006) |
| 0.0 | 0.8 | GO:0051059 | NF-kappaB binding(GO:0051059) |
| 0.0 | 0.0 | GO:0016922 | ligand-dependent nuclear receptor binding(GO:0016922) |
| 0.0 | 1.8 | GO:0016538 | cyclin-dependent protein serine/threonine kinase regulator activity(GO:0016538) |
| 0.0 | 0.1 | GO:0004132 | dCMP deaminase activity(GO:0004132) |
| 0.0 | 0.2 | GO:0070139 | ubiquitin-like protein-specific endopeptidase activity(GO:0070137) SUMO-specific endopeptidase activity(GO:0070139) |
| 0.0 | 0.4 | GO:0030345 | extracellular matrix structural constituent conferring compression resistance(GO:0030021) structural constituent of tooth enamel(GO:0030345) |
| 0.0 | 1.2 | GO:0001221 | transcription cofactor binding(GO:0001221) |
| 0.0 | 0.0 | GO:0016647 | oxidoreductase activity, acting on the CH-NH group of donors, oxygen as acceptor(GO:0016647) |
| 0.0 | 0.5 | GO:0070061 | fructose binding(GO:0070061) |
| 0.0 | 0.6 | GO:0008312 | 7S RNA binding(GO:0008312) |
| 0.0 | 0.1 | GO:0030549 | acetylcholine receptor activator activity(GO:0030549) |
| 0.0 | 0.2 | GO:0043522 | leucine zipper domain binding(GO:0043522) |
| 0.0 | 2.1 | GO:0048487 | beta-tubulin binding(GO:0048487) |
| 0.0 | 2.6 | GO:0004407 | histone deacetylase activity(GO:0004407) |
| 0.0 | 1.0 | GO:0004535 | poly(A)-specific ribonuclease activity(GO:0004535) |
| 0.0 | 0.2 | GO:0031208 | POZ domain binding(GO:0031208) |
| 0.0 | 0.1 | GO:0004998 | transferrin receptor activity(GO:0004998) |
| 0.0 | 1.0 | GO:0008574 | ATP-dependent microtubule motor activity, plus-end-directed(GO:0008574) |
| 0.0 | 0.0 | GO:0004119 | cGMP-inhibited cyclic-nucleotide phosphodiesterase activity(GO:0004119) |
| 0.0 | 0.6 | GO:0005381 | iron ion transmembrane transporter activity(GO:0005381) |
| 0.0 | 0.2 | GO:0004677 | DNA-dependent protein kinase activity(GO:0004677) |
| 0.0 | 0.2 | GO:0019826 | oxygen sensor activity(GO:0019826) |
| 0.0 | 0.2 | GO:0032137 | guanine/thymine mispair binding(GO:0032137) |
| 0.0 | 0.3 | GO:0016868 | intramolecular transferase activity, phosphotransferases(GO:0016868) |
| 0.0 | 1.1 | GO:0005528 | macrolide binding(GO:0005527) FK506 binding(GO:0005528) |
| 0.0 | 0.5 | GO:0019206 | nucleoside kinase activity(GO:0019206) |
| 0.0 | 4.6 | GO:0042393 | histone binding(GO:0042393) |
| 0.0 | 0.1 | GO:0031862 | prostanoid receptor binding(GO:0031862) |
| 0.0 | 0.1 | GO:0035197 | siRNA binding(GO:0035197) |
| 0.0 | 0.2 | GO:0097016 | L27 domain binding(GO:0097016) |
| 0.0 | 0.4 | GO:0072542 | protein phosphatase activator activity(GO:0072542) |
| 0.0 | 0.5 | GO:0004723 | calcium-dependent protein serine/threonine phosphatase activity(GO:0004723) |
| 0.0 | 0.3 | GO:0031402 | sodium ion binding(GO:0031402) |
| 0.0 | 0.6 | GO:0005487 | nucleocytoplasmic transporter activity(GO:0005487) |
| 0.0 | 0.1 | GO:0004483 | mRNA (nucleoside-2'-O-)-methyltransferase activity(GO:0004483) |
| 0.0 | 0.1 | GO:0048408 | epidermal growth factor binding(GO:0048408) |
| 0.0 | 0.3 | GO:0005324 | long-chain fatty acid transporter activity(GO:0005324) |
| 0.0 | 1.6 | GO:0031491 | nucleosome binding(GO:0031491) |
| 0.0 | 0.1 | GO:0070506 | high-density lipoprotein particle receptor activity(GO:0070506) |
| 0.0 | 0.3 | GO:0031849 | olfactory receptor binding(GO:0031849) |
| 0.0 | 0.8 | GO:0071949 | FAD binding(GO:0071949) |
| 0.0 | 0.0 | GO:0019166 | trans-2-enoyl-CoA reductase (NADPH) activity(GO:0019166) |
| 0.0 | 0.3 | GO:0046527 | glucosyltransferase activity(GO:0046527) |
| 0.0 | 0.3 | GO:0009008 | DNA-methyltransferase activity(GO:0009008) |
| 0.0 | 0.2 | GO:0004792 | thiosulfate sulfurtransferase activity(GO:0004792) |
| 0.0 | 0.1 | GO:0034714 | type III transforming growth factor beta receptor binding(GO:0034714) |
| 0.0 | 1.0 | GO:1990841 | promoter-specific chromatin binding(GO:1990841) |
| 0.0 | 0.2 | GO:0004337 | dimethylallyltranstransferase activity(GO:0004161) geranyltranstransferase activity(GO:0004337) |
| 0.0 | 0.1 | GO:0008267 | poly-glutamine tract binding(GO:0008267) |
| 0.0 | 0.2 | GO:0019862 | IgA binding(GO:0019862) |
| 0.0 | 0.2 | GO:0030628 | pre-mRNA 3'-splice site binding(GO:0030628) |
| 0.0 | 0.2 | GO:0003870 | 5-aminolevulinate synthase activity(GO:0003870) N-succinyltransferase activity(GO:0016749) |
| 0.0 | 0.0 | GO:0042809 | vitamin D receptor binding(GO:0042809) |
| 0.0 | 0.8 | GO:0016493 | C-C chemokine receptor activity(GO:0016493) |
| 0.0 | 0.2 | GO:0048273 | mitogen-activated protein kinase p38 binding(GO:0048273) |
| 0.0 | 0.3 | GO:0070402 | NADPH binding(GO:0070402) |
| 0.0 | 0.1 | GO:0004492 | methylmalonyl-CoA decarboxylase activity(GO:0004492) |
| 0.0 | 1.4 | GO:0004364 | glutathione transferase activity(GO:0004364) |
| 0.0 | 0.1 | GO:0071885 | N-terminal protein N-methyltransferase activity(GO:0071885) |
| 0.0 | 2.1 | GO:0061631 | ubiquitin conjugating enzyme activity(GO:0061631) |
| 0.0 | 1.3 | GO:0004198 | calcium-dependent cysteine-type endopeptidase activity(GO:0004198) |
| 0.0 | 0.1 | GO:0051380 | beta-adrenergic receptor activity(GO:0004939) norepinephrine binding(GO:0051380) |
| 0.0 | 0.4 | GO:0008318 | protein prenyltransferase activity(GO:0008318) |
| 0.0 | 0.2 | GO:0030197 | extracellular matrix constituent, lubricant activity(GO:0030197) |
| 0.0 | 0.1 | GO:0031626 | beta-endorphin binding(GO:0031626) |
| 0.0 | 0.2 | GO:0070883 | pre-miRNA binding(GO:0070883) |
| 0.0 | 0.2 | GO:0008353 | RNA polymerase II carboxy-terminal domain kinase activity(GO:0008353) |
| 0.0 | 0.5 | GO:0050700 | CARD domain binding(GO:0050700) |
| 0.0 | 0.2 | GO:0003854 | 3-beta-hydroxy-delta5-steroid dehydrogenase activity(GO:0003854) |
| 0.0 | 1.4 | GO:0018024 | histone-lysine N-methyltransferase activity(GO:0018024) |
| 0.0 | 0.3 | GO:0030235 | nitric-oxide synthase regulator activity(GO:0030235) |
| 0.0 | 0.7 | GO:0004385 | guanylate kinase activity(GO:0004385) |
| 0.0 | 0.1 | GO:0005047 | signal recognition particle binding(GO:0005047) |
| 0.0 | 0.1 | GO:0019150 | D-ribulokinase activity(GO:0019150) |
| 0.0 | 3.7 | GO:0008565 | protein transporter activity(GO:0008565) |
| 0.0 | 0.4 | GO:0015925 | galactosidase activity(GO:0015925) |
| 0.0 | 0.9 | GO:0003887 | DNA-directed DNA polymerase activity(GO:0003887) |
| 0.0 | 0.4 | GO:0015038 | glutathione disulfide oxidoreductase activity(GO:0015038) |
| 0.0 | 1.2 | GO:0001105 | RNA polymerase II transcription coactivator activity(GO:0001105) |
| 0.0 | 0.2 | GO:0008332 | low voltage-gated calcium channel activity(GO:0008332) |
| 0.0 | 0.7 | GO:0008239 | dipeptidyl-peptidase activity(GO:0008239) |
| 0.0 | 0.1 | GO:0005124 | scavenger receptor binding(GO:0005124) |
| 0.0 | 0.3 | GO:0032027 | myosin light chain binding(GO:0032027) |
| 0.0 | 0.1 | GO:0032138 | single base insertion or deletion binding(GO:0032138) |
| 0.0 | 0.1 | GO:0036435 | K48-linked polyubiquitin binding(GO:0036435) |
| 0.0 | 0.2 | GO:0050998 | nitric-oxide synthase binding(GO:0050998) |
| 0.0 | 1.0 | GO:0008327 | methyl-CpG binding(GO:0008327) |
| 0.0 | 0.1 | GO:0034191 | apolipoprotein A-I receptor binding(GO:0034191) |
| 0.0 | 0.3 | GO:0035198 | miRNA binding(GO:0035198) |
| 0.0 | 0.3 | GO:0015272 | ATP-activated inward rectifier potassium channel activity(GO:0015272) |
| 0.0 | 0.1 | GO:0004878 | complement component C5a receptor activity(GO:0004878) |
| 0.0 | 0.1 | GO:0033592 | RNA strand annealing activity(GO:0033592) |
| 0.0 | 0.2 | GO:0004814 | arginine-tRNA ligase activity(GO:0004814) |
| 0.0 | 0.7 | GO:0035615 | clathrin adaptor activity(GO:0035615) endocytic adaptor activity(GO:0098748) |
| 0.0 | 0.7 | GO:0008494 | translation activator activity(GO:0008494) |
| 0.0 | 0.3 | GO:0000213 | tRNA-intron endonuclease activity(GO:0000213) |
| 0.0 | 0.2 | GO:0008142 | oxysterol binding(GO:0008142) |
| 0.0 | 0.1 | GO:0017162 | aryl hydrocarbon receptor binding(GO:0017162) |
| 0.0 | 1.5 | GO:0070412 | R-SMAD binding(GO:0070412) |
| 0.0 | 0.2 | GO:0016520 | growth hormone-releasing hormone receptor activity(GO:0016520) |
| 0.0 | 0.2 | GO:0042500 | aspartic endopeptidase activity, intramembrane cleaving(GO:0042500) |
| 0.0 | 0.3 | GO:0031698 | beta-2 adrenergic receptor binding(GO:0031698) |
| 0.0 | 0.2 | GO:0016744 | transferase activity, transferring aldehyde or ketonic groups(GO:0016744) |
| 0.0 | 0.1 | GO:0070259 | tyrosyl-DNA phosphodiesterase activity(GO:0070259) |
| 0.0 | 0.1 | GO:0034602 | oxoglutarate dehydrogenase (NAD+) activity(GO:0034602) |
| 0.0 | 0.2 | GO:0016805 | dipeptidase activity(GO:0016805) |
| 0.0 | 0.1 | GO:0051717 | inositol-1,3,4,5-tetrakisphosphate 3-phosphatase activity(GO:0051717) |
| 0.0 | 0.2 | GO:1990829 | C-rich single-stranded DNA binding(GO:1990829) |
| 0.0 | 0.8 | GO:0000993 | RNA polymerase II core binding(GO:0000993) |
| 0.0 | 0.1 | GO:0042296 | ISG15 transferase activity(GO:0042296) |
| 0.0 | 0.1 | GO:0033878 | hormone-sensitive lipase activity(GO:0033878) |
| 0.0 | 0.4 | GO:0043531 | ADP binding(GO:0043531) |
| 0.0 | 0.2 | GO:0008453 | alanine-glyoxylate transaminase activity(GO:0008453) |
| 0.0 | 0.2 | GO:0043120 | tumor necrosis factor binding(GO:0043120) |
| 0.0 | 0.1 | GO:0008336 | gamma-butyrobetaine dioxygenase activity(GO:0008336) |
| 0.0 | 0.8 | GO:0051879 | Hsp90 protein binding(GO:0051879) |
| 0.0 | 0.1 | GO:0042974 | retinoic acid receptor binding(GO:0042974) |
| 0.0 | 0.4 | GO:0016278 | lysine N-methyltransferase activity(GO:0016278) |
| 0.0 | 0.1 | GO:0070053 | thrombospondin receptor activity(GO:0070053) |
| 0.0 | 0.1 | GO:0035800 | deubiquitinase activator activity(GO:0035800) |
| 0.0 | 3.5 | GO:0005518 | collagen binding(GO:0005518) |
| 0.0 | 0.0 | GO:0004887 | thyroid hormone receptor activity(GO:0004887) |
| 0.0 | 1.7 | GO:0001191 | transcriptional repressor activity, RNA polymerase II transcription factor binding(GO:0001191) |
| 0.0 | 0.7 | GO:0005388 | calcium-transporting ATPase activity(GO:0005388) |
| 0.0 | 0.4 | GO:0015643 | toxic substance binding(GO:0015643) |
| 0.0 | 1.7 | GO:0015405 | primary active transmembrane transporter activity(GO:0015399) P-P-bond-hydrolysis-driven transmembrane transporter activity(GO:0015405) |
| 0.0 | 0.1 | GO:0009881 | photoreceptor activity(GO:0009881) |
| 0.0 | 0.2 | GO:0050733 | RS domain binding(GO:0050733) |
| 0.0 | 1.3 | GO:0016409 | palmitoyltransferase activity(GO:0016409) |
| 0.0 | 0.2 | GO:0005280 | hydrogen:amino acid symporter activity(GO:0005280) |
| 0.0 | 0.3 | GO:0055131 | C3HC4-type RING finger domain binding(GO:0055131) |
| 0.0 | 0.1 | GO:0004074 | biliverdin reductase activity(GO:0004074) |
| 0.0 | 0.1 | GO:0005042 | netrin receptor activity(GO:0005042) |
| 0.0 | 0.4 | GO:0030331 | estrogen receptor binding(GO:0030331) |
| 0.0 | 0.1 | GO:0061714 | methotrexate binding(GO:0051870) folic acid receptor activity(GO:0061714) |
| 0.0 | 0.5 | GO:0042609 | CD4 receptor binding(GO:0042609) |
| 0.0 | 0.7 | GO:0005540 | hyaluronic acid binding(GO:0005540) |
| 0.0 | 0.2 | GO:0070491 | repressing transcription factor binding(GO:0070491) |
| 0.0 | 1.3 | GO:0008238 | exopeptidase activity(GO:0008238) |
| 0.0 | 0.2 | GO:0070290 | N-acylphosphatidylethanolamine-specific phospholipase D activity(GO:0070290) |
| 0.0 | 0.2 | GO:0004430 | 1-phosphatidylinositol 4-kinase activity(GO:0004430) |
| 0.0 | 0.2 | GO:0016846 | carbon-sulfur lyase activity(GO:0016846) |
| 0.0 | 0.2 | GO:0008568 | microtubule-severing ATPase activity(GO:0008568) |
| 0.0 | 0.1 | GO:0003989 | acetyl-CoA carboxylase activity(GO:0003989) |
| 0.0 | 0.3 | GO:0051378 | amine binding(GO:0043176) serotonin binding(GO:0051378) |
| 0.0 | 0.1 | GO:0008900 | hydrogen:potassium-exchanging ATPase activity(GO:0008900) |
| 0.0 | 0.1 | GO:0047298 | 4-aminobutyrate transaminase activity(GO:0003867) succinate-semialdehyde dehydrogenase binding(GO:0032145) (S)-3-amino-2-methylpropionate transaminase activity(GO:0047298) |
| 0.0 | 1.0 | GO:0004386 | helicase activity(GO:0004386) |
| 0.0 | 0.2 | GO:0098960 | postsynaptic neurotransmitter receptor activity(GO:0098960) neurotransmitter receptor activity involved in regulation of postsynaptic cytosolic calcium ion concentration(GO:0099583) |
| 0.0 | 2.8 | GO:0016887 | ATPase activity(GO:0016887) |
| 0.0 | 0.5 | GO:0003684 | damaged DNA binding(GO:0003684) |
| 0.0 | 0.0 | GO:0016979 | lipoate-protein ligase activity(GO:0016979) |
| 0.0 | 3.8 | GO:0051015 | actin filament binding(GO:0051015) |
| 0.0 | 0.1 | GO:0004522 | ribonuclease A activity(GO:0004522) |
| 0.0 | 0.1 | GO:0071566 | UFM1 activating enzyme activity(GO:0071566) |
| 0.0 | 0.5 | GO:0019992 | diacylglycerol binding(GO:0019992) |
| 0.0 | 0.6 | GO:0045505 | dynein intermediate chain binding(GO:0045505) |
| 0.0 | 0.2 | GO:0034596 | phosphatidylinositol phosphate 4-phosphatase activity(GO:0034596) |
| 0.0 | 2.0 | GO:0004722 | protein serine/threonine phosphatase activity(GO:0004722) |
| 0.0 | 1.0 | GO:0097472 | cyclin-dependent protein kinase activity(GO:0097472) |
| 0.0 | 0.0 | GO:1904455 | ubiquitin-specific protease activity involved in negative regulation of ERAD pathway(GO:1904455) |
| 0.0 | 0.4 | GO:0015197 | peptide transporter activity(GO:0015197) |
| 0.0 | 0.1 | GO:0004556 | alpha-amylase activity(GO:0004556) |
| 0.0 | 0.8 | GO:0003785 | actin monomer binding(GO:0003785) |
| 0.0 | 1.6 | GO:0031072 | heat shock protein binding(GO:0031072) |
| 0.0 | 0.4 | GO:0015280 | ligand-gated sodium channel activity(GO:0015280) |
| 0.0 | 0.1 | GO:0019776 | Atg8 ligase activity(GO:0019776) |
| 0.0 | 0.0 | GO:0046848 | hydroxyapatite binding(GO:0046848) |
| 0.0 | 0.3 | GO:0016849 | phosphorus-oxygen lyase activity(GO:0016849) |
| 0.0 | 0.1 | GO:0004853 | uroporphyrinogen decarboxylase activity(GO:0004853) |
| 0.0 | 0.4 | GO:0048027 | mRNA 5'-UTR binding(GO:0048027) |
| 0.0 | 0.2 | GO:0008269 | JAK pathway signal transduction adaptor activity(GO:0008269) |
| 0.0 | 0.1 | GO:0017077 | oxidative phosphorylation uncoupler activity(GO:0017077) |
| 0.0 | 1.0 | GO:0015485 | cholesterol binding(GO:0015485) |
| 0.0 | 0.4 | GO:0016765 | transferase activity, transferring alkyl or aryl (other than methyl) groups(GO:0016765) |
| 0.0 | 0.2 | GO:0051371 | muscle alpha-actinin binding(GO:0051371) |
| 0.0 | 0.2 | GO:0000146 | microfilament motor activity(GO:0000146) |
| 0.0 | 0.1 | GO:0015321 | sodium-dependent phosphate transmembrane transporter activity(GO:0015321) |
| 0.0 | 0.2 | GO:0019864 | IgG binding(GO:0019864) |
| 0.0 | 0.4 | GO:0005344 | oxygen transporter activity(GO:0005344) |
| 0.0 | 0.1 | GO:0003860 | 3-hydroxyisobutyryl-CoA hydrolase activity(GO:0003860) |
| 0.0 | 0.1 | GO:0033981 | D-dopachrome decarboxylase activity(GO:0033981) |
| 0.0 | 0.2 | GO:0005234 | extracellular-glutamate-gated ion channel activity(GO:0005234) |
| 0.0 | 0.0 | GO:0009383 | rRNA (cytosine-C5-)-methyltransferase activity(GO:0009383) |
| 0.0 | 1.5 | GO:0019003 | GDP binding(GO:0019003) |
| 0.0 | 0.6 | GO:0001530 | lipopolysaccharide binding(GO:0001530) |
| 0.0 | 0.2 | GO:0030292 | protein tyrosine kinase inhibitor activity(GO:0030292) |
| 0.0 | 0.0 | GO:0070087 | chromo shadow domain binding(GO:0070087) |
| 0.0 | 0.4 | GO:0004298 | threonine-type endopeptidase activity(GO:0004298) threonine-type peptidase activity(GO:0070003) |
| 0.0 | 0.1 | GO:0019865 | immunoglobulin binding(GO:0019865) |
| 0.0 | 0.0 | GO:0005330 | dopamine:sodium symporter activity(GO:0005330) |
| 0.0 | 0.0 | GO:0043559 | insulin binding(GO:0043559) |
| 0.0 | 0.2 | GO:0015379 | potassium:chloride symporter activity(GO:0015379) potassium ion symporter activity(GO:0022820) |
| 0.0 | 0.2 | GO:0016286 | small conductance calcium-activated potassium channel activity(GO:0016286) |
| 0.0 | 0.1 | GO:0047280 | nicotinamide phosphoribosyltransferase activity(GO:0047280) |
| 0.0 | 0.1 | GO:0019855 | calcium channel inhibitor activity(GO:0019855) |
| 0.0 | 0.2 | GO:0016628 | oxidoreductase activity, acting on the CH-CH group of donors, NAD or NADP as acceptor(GO:0016628) |
| 0.0 | 0.1 | GO:0003857 | 3-hydroxyacyl-CoA dehydrogenase activity(GO:0003857) |
| 0.0 | 0.0 | GO:0032810 | sterol response element binding(GO:0032810) |
| 0.0 | 0.0 | GO:0001026 | TFIIIB-type transcription factor activity(GO:0001026) |
| 0.0 | 0.2 | GO:0047760 | butyrate-CoA ligase activity(GO:0047760) |
| 0.0 | 0.0 | GO:0033265 | choline binding(GO:0033265) |
| 0.0 | 0.1 | GO:0016713 | oxidoreductase activity, acting on paired donors, with incorporation or reduction of molecular oxygen, reduced iron-sulfur protein as one donor, and incorporation of one atom of oxygen(GO:0016713) |
| 0.0 | 0.0 | GO:0004955 | prostaglandin receptor activity(GO:0004955) |
| 0.0 | 0.1 | GO:0008109 | N-acetyllactosaminide beta-1,6-N-acetylglucosaminyltransferase activity(GO:0008109) |
| 0.0 | 0.1 | GO:0004743 | pyruvate kinase activity(GO:0004743) |
| 0.0 | 0.8 | GO:0016655 | oxidoreductase activity, acting on NAD(P)H, quinone or similar compound as acceptor(GO:0016655) |
| 0.0 | 0.6 | GO:0000049 | tRNA binding(GO:0000049) |
| 0.0 | 0.0 | GO:0001228 | transcriptional activator activity, RNA polymerase II transcription regulatory region sequence-specific binding(GO:0001228) |
| 0.0 | 0.3 | GO:0008190 | eukaryotic initiation factor 4E binding(GO:0008190) |
| 0.0 | 0.1 | GO:0016783 | sulfurtransferase activity(GO:0016783) |
| 0.0 | 0.1 | GO:0005415 | nucleoside:sodium symporter activity(GO:0005415) |
| 0.0 | 0.3 | GO:0008527 | taste receptor activity(GO:0008527) |
| 0.0 | 0.1 | GO:0008823 | cupric reductase activity(GO:0008823) ferric-chelate reductase (NADPH) activity(GO:0052851) |
| 0.0 | 0.0 | GO:0018812 | 3-hydroxyacyl-CoA dehydratase activity(GO:0018812) |
| 0.0 | 0.4 | GO:0016859 | cis-trans isomerase activity(GO:0016859) |
| 0.0 | 0.0 | GO:0001098 | basal transcription machinery binding(GO:0001098) basal RNA polymerase II transcription machinery binding(GO:0001099) |
| 0.0 | 0.1 | GO:0016494 | C-X-C chemokine receptor activity(GO:0016494) |
| 0.0 | 0.1 | GO:0001591 | dopamine neurotransmitter receptor activity, coupled via Gi/Go(GO:0001591) |
| 0.0 | 0.1 | GO:0004126 | cytidine deaminase activity(GO:0004126) |
| 0.0 | 0.2 | GO:0030306 | ADP-ribosylation factor binding(GO:0030306) |
| 0.0 | 0.0 | GO:0038052 | RNA polymerase II transcription factor activity, estrogen-activated sequence-specific DNA binding(GO:0038052) |
| 0.0 | 0.9 | GO:0003713 | transcription coactivator activity(GO:0003713) |
| 0.0 | 0.1 | GO:0004969 | histamine receptor activity(GO:0004969) |
| 0.0 | 0.1 | GO:0022850 | serotonin-gated cation channel activity(GO:0022850) |
| 0.0 | 0.1 | GO:0000217 | DNA secondary structure binding(GO:0000217) |
| 0.0 | 0.1 | GO:0004826 | phenylalanine-tRNA ligase activity(GO:0004826) |
| 0.0 | 0.2 | GO:0001848 | complement binding(GO:0001848) |
| 0.0 | 0.1 | GO:0003828 | alpha-N-acetylneuraminate alpha-2,8-sialyltransferase activity(GO:0003828) |
| 0.0 | 0.0 | GO:0004667 | prostaglandin-D synthase activity(GO:0004667) |
| 0.0 | 0.0 | GO:0001134 | transcription factor activity, transcription factor recruiting(GO:0001134) |
| 0.0 | 0.1 | GO:0060002 | plus-end directed microfilament motor activity(GO:0060002) |
| 0.0 | 0.0 | GO:0008457 | beta-galactosyl-N-acetylglucosaminylgalactosylglucosyl-ceramide beta-1,3-acetylglucosaminyltransferase activity(GO:0008457) lactosylceramide 1,3-N-acetyl-beta-D-glucosaminyltransferase activity(GO:0047256) |
| 0.0 | 0.0 | GO:0016997 | exo-alpha-sialidase activity(GO:0004308) alpha-sialidase activity(GO:0016997) |
| 0.0 | 0.3 | GO:0031369 | translation initiation factor binding(GO:0031369) |
| 0.0 | 0.1 | GO:0004576 | oligosaccharyl transferase activity(GO:0004576) dolichyl-diphosphooligosaccharide-protein glycotransferase activity(GO:0004579) |
| 0.0 | 28.9 | GO:0003677 | DNA binding(GO:0003677) |
| 0.0 | 0.0 | GO:0016936 | galactoside binding(GO:0016936) |
| 0.0 | 0.1 | GO:0032393 | MHC class I receptor activity(GO:0032393) |
| 0.0 | 0.1 | GO:0015166 | polyol transmembrane transporter activity(GO:0015166) |
| 0.0 | 0.1 | GO:1902444 | riboflavin binding(GO:1902444) |
| 0.0 | 0.1 | GO:0001515 | opioid peptide activity(GO:0001515) |
Gene overrepresentation in curated gene sets: canonical pathways category:
| Log-likelihood per target | Total log-likelihood | Term | Description |
|---|---|---|---|
| 0.3 | 0.7 | PID IL12 STAT4 PATHWAY | IL12 signaling mediated by STAT4 |
| 0.3 | 0.7 | PID S1P S1P1 PATHWAY | S1P1 pathway |
| 0.3 | 5.0 | PID P38 GAMMA DELTA PATHWAY | Signaling mediated by p38-gamma and p38-delta |
| 0.2 | 14.4 | NABA COLLAGENS | Genes encoding collagen proteins |
| 0.2 | 0.4 | PID GLYPICAN 1PATHWAY | Glypican 1 network |
| 0.2 | 4.5 | SA PROGRAMMED CELL DEATH | Programmed cell death, or apoptosis, eliminates damaged or unneeded cells. |
| 0.2 | 1.2 | ST GRANULE CELL SURVIVAL PATHWAY | Granule Cell Survival Pathway is a specific case of more general PAC1 Receptor Pathway. |
| 0.2 | 1.6 | SA PTEN PATHWAY | PTEN is a tumor suppressor that dephosphorylates the lipid messenger phosphatidylinositol triphosphate. |
| 0.2 | 0.3 | PID ER NONGENOMIC PATHWAY | Plasma membrane estrogen receptor signaling |
| 0.2 | 1.8 | PID INTEGRIN A9B1 PATHWAY | Alpha9 beta1 integrin signaling events |
| 0.2 | 10.8 | PID NCADHERIN PATHWAY | N-cadherin signaling events |
| 0.1 | 11.2 | PID PLK1 PATHWAY | PLK1 signaling events |
| 0.1 | 1.3 | PID ARF6 DOWNSTREAM PATHWAY | Arf6 downstream pathway |
| 0.1 | 4.0 | PID ARF 3PATHWAY | Arf1 pathway |
| 0.1 | 9.6 | PID ARF6 TRAFFICKING PATHWAY | Arf6 trafficking events |
| 0.1 | 5.2 | ST GA13 PATHWAY | G alpha 13 Pathway |
| 0.1 | 3.8 | PID RET PATHWAY | Signaling events regulated by Ret tyrosine kinase |
| 0.1 | 2.5 | PID PI3K PLC TRK PATHWAY | Trk receptor signaling mediated by PI3K and PLC-gamma |
| 0.1 | 1.9 | PID LYMPH ANGIOGENESIS PATHWAY | VEGFR3 signaling in lymphatic endothelium |
| 0.1 | 2.5 | PID S1P S1P3 PATHWAY | S1P3 pathway |
| 0.1 | 9.6 | PID AR TF PATHWAY | Regulation of Androgen receptor activity |
| 0.1 | 0.1 | PID PI3KCI AKT PATHWAY | Class I PI3K signaling events mediated by Akt |
| 0.1 | 1.8 | SIG CD40PATHWAYMAP | Genes related to CD40 signaling |
| 0.1 | 0.7 | ST T CELL SIGNAL TRANSDUCTION | T Cell Signal Transduction |
| 0.1 | 1.2 | PID FOXM1 PATHWAY | FOXM1 transcription factor network |
| 0.1 | 10.6 | SIG INSULIN RECEPTOR PATHWAY IN CARDIAC MYOCYTES | Genes related to the insulin receptor pathway |
| 0.1 | 2.6 | PID RANBP2 PATHWAY | Sumoylation by RanBP2 regulates transcriptional repression |
| 0.1 | 4.6 | PID ERBB1 INTERNALIZATION PATHWAY | Internalization of ErbB1 |
| 0.1 | 8.5 | PID CDC42 REG PATHWAY | Regulation of CDC42 activity |
| 0.1 | 1.0 | PID P38 MKK3 6PATHWAY | p38 MAPK signaling pathway |
| 0.1 | 1.1 | PID CXCR4 PATHWAY | CXCR4-mediated signaling events |
| 0.1 | 2.5 | PID FAK PATHWAY | Signaling events mediated by focal adhesion kinase |
| 0.1 | 1.2 | ST IL 13 PATHWAY | Interleukin 13 (IL-13) Pathway |
| 0.1 | 5.5 | PID FANCONI PATHWAY | Fanconi anemia pathway |
| 0.1 | 2.2 | PID SYNDECAN 2 PATHWAY | Syndecan-2-mediated signaling events |
| 0.1 | 2.6 | PID SYNDECAN 3 PATHWAY | Syndecan-3-mediated signaling events |
| 0.1 | 2.8 | SA FAS SIGNALING | The TNF-type receptor Fas induces apoptosis on ligand binding. |
| 0.1 | 3.0 | PID BARD1 PATHWAY | BARD1 signaling events |
| 0.1 | 3.2 | PID TOLL ENDOGENOUS PATHWAY | Endogenous TLR signaling |
| 0.1 | 4.7 | PID AURORA B PATHWAY | Aurora B signaling |
| 0.1 | 1.4 | PID TCR JNK PATHWAY | JNK signaling in the CD4+ TCR pathway |
| 0.1 | 4.4 | PID ECADHERIN NASCENT AJ PATHWAY | E-cadherin signaling in the nascent adherens junction |
| 0.1 | 3.9 | PID NETRIN PATHWAY | Netrin-mediated signaling events |
| 0.1 | 9.2 | PID RB 1PATHWAY | Regulation of retinoblastoma protein |
| 0.1 | 1.0 | ST PAC1 RECEPTOR PATHWAY | PAC1 Receptor Pathway |
| 0.1 | 5.4 | PID ILK PATHWAY | Integrin-linked kinase signaling |
| 0.1 | 5.4 | PID BMP PATHWAY | BMP receptor signaling |
| 0.1 | 3.2 | PID HDAC CLASSII PATHWAY | Signaling events mediated by HDAC Class II |
| 0.1 | 1.2 | PID DELTA NP63 PATHWAY | Validated transcriptional targets of deltaNp63 isoforms |
| 0.1 | 3.4 | PID RAC1 REG PATHWAY | Regulation of RAC1 activity |
| 0.1 | 20.2 | NABA ECM GLYCOPROTEINS | Genes encoding structural ECM glycoproteins |
| 0.1 | 1.3 | PID VEGFR1 PATHWAY | VEGFR1 specific signals |
| 0.1 | 0.1 | PID NEPHRIN NEPH1 PATHWAY | Nephrin/Neph1 signaling in the kidney podocyte |
| 0.1 | 1.0 | PID BETA CATENIN DEG PATHWAY | Degradation of beta catenin |
| 0.1 | 1.2 | PID ATR PATHWAY | ATR signaling pathway |
| 0.1 | 0.4 | PID NECTIN PATHWAY | Nectin adhesion pathway |
| 0.1 | 4.9 | PID CASPASE PATHWAY | Caspase cascade in apoptosis |
| 0.1 | 0.2 | PID IL2 PI3K PATHWAY | IL2 signaling events mediated by PI3K |
| 0.1 | 1.4 | PID SYNDECAN 4 PATHWAY | Syndecan-4-mediated signaling events |
| 0.1 | 2.9 | PID P53 REGULATION PATHWAY | p53 pathway |
| 0.1 | 2.6 | ST JNK MAPK PATHWAY | JNK MAPK Pathway |
| 0.1 | 0.6 | PID HIV NEF PATHWAY | HIV-1 Nef: Negative effector of Fas and TNF-alpha |
| 0.1 | 2.9 | PID SHP2 PATHWAY | SHP2 signaling |
| 0.0 | 0.4 | ST INTEGRIN SIGNALING PATHWAY | Integrin Signaling Pathway |
| 0.0 | 1.2 | PID ATF2 PATHWAY | ATF-2 transcription factor network |
| 0.0 | 1.1 | PID THROMBIN PAR1 PATHWAY | PAR1-mediated thrombin signaling events |
| 0.0 | 1.1 | PID ATM PATHWAY | ATM pathway |
| 0.0 | 0.7 | PID RHOA PATHWAY | RhoA signaling pathway |
| 0.0 | 3.1 | PID E2F PATHWAY | E2F transcription factor network |
| 0.0 | 1.2 | PID LYSOPHOSPHOLIPID PATHWAY | LPA receptor mediated events |
| 0.0 | 0.2 | PID EPO PATHWAY | EPO signaling pathway |
| 0.0 | 0.2 | ST PHOSPHOINOSITIDE 3 KINASE PATHWAY | PI3K Pathway |
| 0.0 | 0.1 | PID TCR RAS PATHWAY | Ras signaling in the CD4+ TCR pathway |
| 0.0 | 1.8 | PID TCR CALCIUM PATHWAY | Calcium signaling in the CD4+ TCR pathway |
| 0.0 | 1.2 | PID HEDGEHOG GLI PATHWAY | Hedgehog signaling events mediated by Gli proteins |
| 0.0 | 0.4 | PID HIF1A PATHWAY | Hypoxic and oxygen homeostasis regulation of HIF-1-alpha |
| 0.0 | 0.9 | PID PRL SIGNALING EVENTS PATHWAY | Signaling events mediated by PRL |
| 0.0 | 2.1 | PID HNF3A PATHWAY | FOXA1 transcription factor network |
| 0.0 | 3.3 | PID HIF1 TFPATHWAY | HIF-1-alpha transcription factor network |
| 0.0 | 0.1 | SIG PIP3 SIGNALING IN B LYMPHOCYTES | Genes related to PIP3 signaling in B lymphocytes |
| 0.0 | 1.0 | PID INTEGRIN2 PATHWAY | Beta2 integrin cell surface interactions |
| 0.0 | 0.9 | PID HEDGEHOG 2PATHWAY | Signaling events mediated by the Hedgehog family |
| 0.0 | 1.7 | PID HNF3B PATHWAY | FOXA2 and FOXA3 transcription factor networks |
| 0.0 | 1.3 | PID AR PATHWAY | Coregulation of Androgen receptor activity |
| 0.0 | 0.1 | PID IL2 STAT5 PATHWAY | IL2 signaling events mediated by STAT5 |
| 0.0 | 0.1 | PID AVB3 INTEGRIN PATHWAY | Integrins in angiogenesis |
| 0.0 | 0.0 | PID THROMBIN PAR4 PATHWAY | PAR4-mediated thrombin signaling events |
| 0.0 | 0.3 | PID AURORA A PATHWAY | Aurora A signaling |
| 0.0 | 1.8 | PID ERA GENOMIC PATHWAY | Validated nuclear estrogen receptor alpha network |
| 0.0 | 1.1 | PID TAP63 PATHWAY | Validated transcriptional targets of TAp63 isoforms |
| 0.0 | 0.1 | PID EPHA2 FWD PATHWAY | EPHA2 forward signaling |
| 0.0 | 0.1 | ST INTERFERON GAMMA PATHWAY | Interferon gamma pathway. |
| 0.0 | 0.3 | ST DIFFERENTIATION PATHWAY IN PC12 CELLS | Differentiation Pathway in PC12 Cells; this is a specific case of PAC1 Receptor Pathway. |
| 0.0 | 0.3 | PID CIRCADIAN PATHWAY | Circadian rhythm pathway |
| 0.0 | 0.5 | PID MYC PATHWAY | C-MYC pathway |
| 0.0 | 0.2 | PID CERAMIDE PATHWAY | Ceramide signaling pathway |
| 0.0 | 0.0 | PID IFNG PATHWAY | IFN-gamma pathway |
| 0.0 | 1.0 | PID LKB1 PATHWAY | LKB1 signaling events |
| 0.0 | 0.5 | PID CDC42 PATHWAY | CDC42 signaling events |
| 0.0 | 0.3 | PID HDAC CLASSIII PATHWAY | Signaling events mediated by HDAC Class III |
| 0.0 | 0.2 | PID IL2 1PATHWAY | IL2-mediated signaling events |
| 0.0 | 0.0 | PID ERB GENOMIC PATHWAY | Validated nuclear estrogen receptor beta network |
| 0.0 | 0.3 | PID UPA UPAR PATHWAY | Urokinase-type plasminogen activator (uPA) and uPAR-mediated signaling |
| 0.0 | 0.2 | PID AP1 PATHWAY | AP-1 transcription factor network |
Gene overrepresentation in curated gene sets: REACTOME pathways category:
| Log-likelihood per target | Total log-likelihood | Term | Description |
|---|---|---|---|
| 0.5 | 6.5 | REACTOME PROSTANOID LIGAND RECEPTORS | Genes involved in Prostanoid ligand receptors |
| 0.4 | 6.6 | REACTOME ROLE OF DCC IN REGULATING APOPTOSIS | Genes involved in Role of DCC in regulating apoptosis |
| 0.3 | 6.0 | REACTOME ALPHA LINOLENIC ACID ALA METABOLISM | Genes involved in alpha-linolenic acid (ALA) metabolism |
| 0.3 | 7.4 | REACTOME NOTCH HLH TRANSCRIPTION PATHWAY | Genes involved in Notch-HLH transcription pathway |
| 0.3 | 0.6 | REACTOME IL 2 SIGNALING | Genes involved in Interleukin-2 signaling |
| 0.3 | 5.9 | REACTOME SIGNAL ATTENUATION | Genes involved in Signal attenuation |
| 0.3 | 6.6 | REACTOME REGULATION OF INSULIN LIKE GROWTH FACTOR IGF ACTIVITY BY INSULIN LIKE GROWTH FACTOR BINDING PROTEINS IGFBPS | Genes involved in Regulation of Insulin-like Growth Factor (IGF) Activity by Insulin-like Growth Factor Binding Proteins (IGFBPs) |
| 0.2 | 3.8 | REACTOME SYNTHESIS OF SUBSTRATES IN N GLYCAN BIOSYTHESIS | Genes involved in Synthesis of substrates in N-glycan biosythesis |
| 0.2 | 4.6 | REACTOME BILE SALT AND ORGANIC ANION SLC TRANSPORTERS | Genes involved in Bile salt and organic anion SLC transporters |
| 0.2 | 17.2 | REACTOME COLLAGEN FORMATION | Genes involved in Collagen formation |
| 0.2 | 2.5 | REACTOME COPI MEDIATED TRANSPORT | Genes involved in COPI Mediated Transport |
| 0.2 | 7.1 | REACTOME CASPASE MEDIATED CLEAVAGE OF CYTOSKELETAL PROTEINS | Genes involved in Caspase-mediated cleavage of cytoskeletal proteins |
| 0.2 | 7.3 | REACTOME YAP1 AND WWTR1 TAZ STIMULATED GENE EXPRESSION | Genes involved in YAP1- and WWTR1 (TAZ)-stimulated gene expression |
| 0.2 | 0.2 | REACTOME CIRCADIAN REPRESSION OF EXPRESSION BY REV ERBA | Genes involved in Circadian Repression of Expression by REV-ERBA |
| 0.2 | 3.9 | REACTOME SYNTHESIS OF PE | Genes involved in Synthesis of PE |
| 0.2 | 7.3 | REACTOME CHOLESTEROL BIOSYNTHESIS | Genes involved in Cholesterol biosynthesis |
| 0.2 | 3.0 | REACTOME VITAMIN B5 PANTOTHENATE METABOLISM | Genes involved in Vitamin B5 (pantothenate) metabolism |
| 0.2 | 9.6 | REACTOME SMOOTH MUSCLE CONTRACTION | Genes involved in Smooth Muscle Contraction |
| 0.2 | 0.2 | REACTOME APC C CDC20 MEDIATED DEGRADATION OF MITOTIC PROTEINS | Genes involved in APC/C:Cdc20 mediated degradation of mitotic proteins |
| 0.2 | 2.8 | REACTOME IL 6 SIGNALING | Genes involved in Interleukin-6 signaling |
| 0.2 | 1.4 | REACTOME SCF BETA TRCP MEDIATED DEGRADATION OF EMI1 | Genes involved in SCF-beta-TrCP mediated degradation of Emi1 |
| 0.2 | 3.1 | REACTOME SIGNALING BY ACTIVATED POINT MUTANTS OF FGFR1 | Genes involved in Signaling by activated point mutants of FGFR1 |
| 0.2 | 2.2 | REACTOME IKK COMPLEX RECRUITMENT MEDIATED BY RIP1 | Genes involved in IKK complex recruitment mediated by RIP1 |
| 0.2 | 1.1 | REACTOME REPAIR SYNTHESIS FOR GAP FILLING BY DNA POL IN TC NER | Genes involved in Repair synthesis for gap-filling by DNA polymerase in TC-NER |
| 0.2 | 1.7 | REACTOME APOBEC3G MEDIATED RESISTANCE TO HIV1 INFECTION | Genes involved in APOBEC3G mediated resistance to HIV-1 infection |
| 0.1 | 4.9 | REACTOME CELL EXTRACELLULAR MATRIX INTERACTIONS | Genes involved in Cell-extracellular matrix interactions |
| 0.1 | 0.7 | REACTOME REGULATION OF THE FANCONI ANEMIA PATHWAY | Genes involved in Regulation of the Fanconi anemia pathway |
| 0.1 | 4.3 | REACTOME INSULIN SYNTHESIS AND PROCESSING | Genes involved in Insulin Synthesis and Processing |
| 0.1 | 6.1 | REACTOME PYRIMIDINE METABOLISM | Genes involved in Pyrimidine metabolism |
| 0.1 | 7.0 | REACTOME SYNTHESIS OF PIPS AT THE PLASMA MEMBRANE | Genes involved in Synthesis of PIPs at the plasma membrane |
| 0.1 | 5.3 | REACTOME SPHINGOLIPID DE NOVO BIOSYNTHESIS | Genes involved in Sphingolipid de novo biosynthesis |
| 0.1 | 2.3 | REACTOME PRE NOTCH TRANSCRIPTION AND TRANSLATION | Genes involved in Pre-NOTCH Transcription and Translation |
| 0.1 | 0.9 | REACTOME NFKB IS ACTIVATED AND SIGNALS SURVIVAL | Genes involved in NF-kB is activated and signals survival |
| 0.1 | 4.4 | REACTOME ACTIVATED AMPK STIMULATES FATTY ACID OXIDATION IN MUSCLE | Genes involved in Activated AMPK stimulates fatty-acid oxidation in muscle |
| 0.1 | 2.0 | REACTOME ENDOGENOUS STEROLS | Genes involved in Endogenous sterols |
| 0.1 | 2.0 | REACTOME REMOVAL OF THE FLAP INTERMEDIATE FROM THE C STRAND | Genes involved in Removal of the Flap Intermediate from the C-strand |
| 0.1 | 4.6 | REACTOME SYNTHESIS AND INTERCONVERSION OF NUCLEOTIDE DI AND TRIPHOSPHATES | Genes involved in Synthesis and interconversion of nucleotide di- and triphosphates |
| 0.1 | 4.6 | REACTOME HORMONE SENSITIVE LIPASE HSL MEDIATED TRIACYLGLYCEROL HYDROLYSIS | Genes involved in Hormone-sensitive lipase (HSL)-mediated triacylglycerol hydrolysis |
| 0.1 | 2.3 | REACTOME SEMA3A PLEXIN REPULSION SIGNALING BY INHIBITING INTEGRIN ADHESION | Genes involved in SEMA3A-Plexin repulsion signaling by inhibiting Integrin adhesion |
| 0.1 | 0.8 | REACTOME LAGGING STRAND SYNTHESIS | Genes involved in Lagging Strand Synthesis |
| 0.1 | 3.0 | REACTOME PEROXISOMAL LIPID METABOLISM | Genes involved in Peroxisomal lipid metabolism |
| 0.1 | 0.1 | REACTOME CDK MEDIATED PHOSPHORYLATION AND REMOVAL OF CDC6 | Genes involved in CDK-mediated phosphorylation and removal of Cdc6 |
| 0.1 | 1.9 | REACTOME PROSTACYCLIN SIGNALLING THROUGH PROSTACYCLIN RECEPTOR | Genes involved in Prostacyclin signalling through prostacyclin receptor |
| 0.1 | 3.2 | REACTOME POST CHAPERONIN TUBULIN FOLDING PATHWAY | Genes involved in Post-chaperonin tubulin folding pathway |
| 0.1 | 0.3 | REACTOME PHOSPHORYLATION OF CD3 AND TCR ZETA CHAINS | Genes involved in Phosphorylation of CD3 and TCR zeta chains |
| 0.1 | 2.8 | REACTOME DOWNREGULATION OF TGF BETA RECEPTOR SIGNALING | Genes involved in Downregulation of TGF-beta receptor signaling |
| 0.1 | 4.2 | REACTOME G BETA GAMMA SIGNALLING THROUGH PI3KGAMMA | Genes involved in G beta:gamma signalling through PI3Kgamma |
| 0.1 | 1.0 | REACTOME SYNTHESIS OF BILE ACIDS AND BILE SALTS VIA 24 HYDROXYCHOLESTEROL | Genes involved in Synthesis of bile acids and bile salts via 24-hydroxycholesterol |
| 0.1 | 1.9 | REACTOME BIOSYNTHESIS OF THE N GLYCAN PRECURSOR DOLICHOL LIPID LINKED OLIGOSACCHARIDE LLO AND TRANSFER TO A NASCENT PROTEIN | Genes involved in Biosynthesis of the N-glycan precursor (dolichol lipid-linked oligosaccharide, LLO) and transfer to a nascent protein |
| 0.1 | 1.2 | REACTOME ANDROGEN BIOSYNTHESIS | Genes involved in Androgen biosynthesis |
| 0.1 | 6.4 | REACTOME MEIOTIC SYNAPSIS | Genes involved in Meiotic Synapsis |
| 0.1 | 0.3 | REACTOME AKT PHOSPHORYLATES TARGETS IN THE CYTOSOL | Genes involved in AKT phosphorylates targets in the cytosol |
| 0.1 | 3.7 | REACTOME DEGRADATION OF THE EXTRACELLULAR MATRIX | Genes involved in Degradation of the extracellular matrix |
| 0.1 | 5.1 | REACTOME GLYCOLYSIS | Genes involved in Glycolysis |
| 0.1 | 1.3 | REACTOME TRAF6 MEDIATED IRF7 ACTIVATION IN TLR7 8 OR 9 SIGNALING | Genes involved in TRAF6 mediated IRF7 activation in TLR7/8 or 9 signaling |
| 0.1 | 2.1 | REACTOME METABOLISM OF POLYAMINES | Genes involved in Metabolism of polyamines |
| 0.1 | 1.4 | REACTOME REGULATION OF INSULIN SECRETION BY ACETYLCHOLINE | Genes involved in Regulation of Insulin Secretion by Acetylcholine |
| 0.1 | 3.0 | REACTOME FORMATION OF INCISION COMPLEX IN GG NER | Genes involved in Formation of incision complex in GG-NER |
| 0.1 | 3.8 | REACTOME SEMA4D IN SEMAPHORIN SIGNALING | Genes involved in Sema4D in semaphorin signaling |
| 0.1 | 1.8 | REACTOME MITOCHONDRIAL FATTY ACID BETA OXIDATION | Genes involved in Mitochondrial Fatty Acid Beta-Oxidation |
| 0.1 | 0.2 | REACTOME REGULATION OF APOPTOSIS | Genes involved in Regulation of Apoptosis |
| 0.1 | 11.9 | REACTOME MITOTIC PROMETAPHASE | Genes involved in Mitotic Prometaphase |
| 0.1 | 0.6 | REACTOME ADP SIGNALLING THROUGH P2RY1 | Genes involved in ADP signalling through P2Y purinoceptor 1 |
| 0.1 | 1.8 | REACTOME HOMOLOGOUS RECOMBINATION REPAIR OF REPLICATION INDEPENDENT DOUBLE STRAND BREAKS | Genes involved in Homologous recombination repair of replication-independent double-strand breaks |
| 0.1 | 0.2 | REACTOME INHIBITION OF REPLICATION INITIATION OF DAMAGED DNA BY RB1 E2F1 | Genes involved in Inhibition of replication initiation of damaged DNA by RB1/E2F1 |
| 0.1 | 3.2 | REACTOME SIGNALING BY NODAL | Genes involved in Signaling by NODAL |
| 0.1 | 1.0 | REACTOME FANCONI ANEMIA PATHWAY | Genes involved in Fanconi Anemia pathway |
| 0.1 | 2.9 | REACTOME INFLAMMASOMES | Genes involved in Inflammasomes |
| 0.1 | 0.9 | REACTOME MICRORNA MIRNA BIOGENESIS | Genes involved in MicroRNA (miRNA) Biogenesis |
| 0.1 | 2.6 | REACTOME CS DS DEGRADATION | Genes involved in CS/DS degradation |
| 0.1 | 1.2 | REACTOME OPSINS | Genes involved in Opsins |
| 0.1 | 1.5 | REACTOME DNA STRAND ELONGATION | Genes involved in DNA strand elongation |
| 0.1 | 1.1 | REACTOME TRYPTOPHAN CATABOLISM | Genes involved in Tryptophan catabolism |
| 0.1 | 2.6 | REACTOME NEP NS2 INTERACTS WITH THE CELLULAR EXPORT MACHINERY | Genes involved in NEP/NS2 Interacts with the Cellular Export Machinery |
| 0.1 | 2.3 | REACTOME CITRIC ACID CYCLE TCA CYCLE | Genes involved in Citric acid cycle (TCA cycle) |
| 0.1 | 0.3 | REACTOME REGULATION OF AMPK ACTIVITY VIA LKB1 | Genes involved in Regulation of AMPK activity via LKB1 |
| 0.1 | 1.3 | REACTOME THROMBIN SIGNALLING THROUGH PROTEINASE ACTIVATED RECEPTORS PARS | Genes involved in Thrombin signalling through proteinase activated receptors (PARs) |
| 0.1 | 3.8 | REACTOME ABC FAMILY PROTEINS MEDIATED TRANSPORT | Genes involved in ABC-family proteins mediated transport |
| 0.1 | 0.4 | REACTOME REGULATION OF RHEB GTPASE ACTIVITY BY AMPK | Genes involved in Regulation of Rheb GTPase activity by AMPK |
| 0.1 | 1.5 | REACTOME NONSENSE MEDIATED DECAY ENHANCED BY THE EXON JUNCTION COMPLEX | Genes involved in Nonsense Mediated Decay Enhanced by the Exon Junction Complex |
| 0.1 | 2.2 | REACTOME INHIBITION OF THE PROTEOLYTIC ACTIVITY OF APC C REQUIRED FOR THE ONSET OF ANAPHASE BY MITOTIC SPINDLE CHECKPOINT COMPONENTS | Genes involved in Inhibition of the proteolytic activity of APC/C required for the onset of anaphase by mitotic spindle checkpoint components |
| 0.1 | 2.2 | REACTOME AMINO ACID SYNTHESIS AND INTERCONVERSION TRANSAMINATION | Genes involved in Amino acid synthesis and interconversion (transamination) |
| 0.1 | 9.1 | REACTOME PPARA ACTIVATES GENE EXPRESSION | Genes involved in PPARA Activates Gene Expression |
| 0.1 | 1.3 | REACTOME RECRUITMENT OF NUMA TO MITOTIC CENTROSOMES | Genes involved in Recruitment of NuMA to mitotic centrosomes |
| 0.1 | 0.2 | REACTOME VIRAL MESSENGER RNA SYNTHESIS | Genes involved in Viral Messenger RNA Synthesis |
| 0.1 | 1.1 | REACTOME DEPOSITION OF NEW CENPA CONTAINING NUCLEOSOMES AT THE CENTROMERE | Genes involved in Deposition of New CENPA-containing Nucleosomes at the Centromere |
| 0.1 | 1.6 | REACTOME MITOTIC M M G1 PHASES | Genes involved in Mitotic M-M/G1 phases |
| 0.1 | 1.1 | REACTOME CALNEXIN CALRETICULIN CYCLE | Genes involved in Calnexin/calreticulin cycle |
| 0.1 | 1.6 | REACTOME ORGANIC CATION ANION ZWITTERION TRANSPORT | Genes involved in Organic cation/anion/zwitterion transport |
| 0.1 | 5.5 | REACTOME LOSS OF NLP FROM MITOTIC CENTROSOMES | Genes involved in Loss of Nlp from mitotic centrosomes |
| 0.1 | 1.1 | REACTOME CRMPS IN SEMA3A SIGNALING | Genes involved in CRMPs in Sema3A signaling |
| 0.1 | 0.9 | REACTOME ACTIVATION OF ATR IN RESPONSE TO REPLICATION STRESS | Genes involved in Activation of ATR in response to replication stress |
| 0.1 | 0.4 | REACTOME RNA POL I PROMOTER OPENING | Genes involved in RNA Polymerase I Promoter Opening |
| 0.1 | 0.8 | REACTOME SEMA3A PAK DEPENDENT AXON REPULSION | Genes involved in Sema3A PAK dependent Axon repulsion |
| 0.1 | 2.2 | REACTOME LYSOSOME VESICLE BIOGENESIS | Genes involved in Lysosome Vesicle Biogenesis |
| 0.1 | 3.9 | REACTOME NETRIN1 SIGNALING | Genes involved in Netrin-1 signaling |
| 0.1 | 2.5 | REACTOME GABA A RECEPTOR ACTIVATION | Genes involved in GABA A receptor activation |
| 0.1 | 3.9 | REACTOME GLYCOSPHINGOLIPID METABOLISM | Genes involved in Glycosphingolipid metabolism |
| 0.1 | 1.4 | REACTOME GAP JUNCTION DEGRADATION | Genes involved in Gap junction degradation |
| 0.1 | 2.4 | REACTOME FATTY ACYL COA BIOSYNTHESIS | Genes involved in Fatty Acyl-CoA Biosynthesis |
| 0.1 | 4.8 | REACTOME P53 DEPENDENT G1 DNA DAMAGE RESPONSE | Genes involved in p53-Dependent G1 DNA Damage Response |
| 0.1 | 0.2 | REACTOME GLUTAMATE NEUROTRANSMITTER RELEASE CYCLE | Genes involved in Glutamate Neurotransmitter Release Cycle |
| 0.1 | 1.7 | REACTOME EGFR DOWNREGULATION | Genes involved in EGFR downregulation |
| 0.1 | 2.6 | REACTOME DAG AND IP3 SIGNALING | Genes involved in DAG and IP3 signaling |
| 0.1 | 0.2 | REACTOME REGULATION OF GLUCOKINASE BY GLUCOKINASE REGULATORY PROTEIN | Genes involved in Regulation of Glucokinase by Glucokinase Regulatory Protein |
| 0.1 | 2.5 | REACTOME FATTY ACID TRIACYLGLYCEROL AND KETONE BODY METABOLISM | Genes involved in Fatty acid, triacylglycerol, and ketone body metabolism |
| 0.1 | 1.2 | REACTOME GLUCURONIDATION | Genes involved in Glucuronidation |
| 0.1 | 1.3 | REACTOME FACILITATIVE NA INDEPENDENT GLUCOSE TRANSPORTERS | Genes involved in Facilitative Na+-independent glucose transporters |
| 0.1 | 0.2 | REACTOME TRANSPORT OF RIBONUCLEOPROTEINS INTO THE HOST NUCLEUS | Genes involved in Transport of Ribonucleoproteins into the Host Nucleus |
| 0.1 | 1.2 | REACTOME GLYCOGEN BREAKDOWN GLYCOGENOLYSIS | Genes involved in Glycogen breakdown (glycogenolysis) |
| 0.1 | 0.8 | REACTOME GAMMA CARBOXYLATION TRANSPORT AND AMINO TERMINAL CLEAVAGE OF PROTEINS | Genes involved in Gamma-carboxylation, transport, and amino-terminal cleavage of proteins |
| 0.1 | 24.1 | REACTOME GENERIC TRANSCRIPTION PATHWAY | Genes involved in Generic Transcription Pathway |
| 0.1 | 0.5 | REACTOME VEGF LIGAND RECEPTOR INTERACTIONS | Genes involved in VEGF ligand-receptor interactions |
| 0.1 | 0.6 | REACTOME MEMBRANE BINDING AND TARGETTING OF GAG PROTEINS | Genes involved in Membrane binding and targetting of GAG proteins |
| 0.1 | 1.5 | REACTOME METABOLISM OF PORPHYRINS | Genes involved in Metabolism of porphyrins |
| 0.1 | 0.8 | REACTOME SLBP DEPENDENT PROCESSING OF REPLICATION DEPENDENT HISTONE PRE MRNAS | Genes involved in SLBP Dependent Processing of Replication-Dependent Histone Pre-mRNAs |
| 0.1 | 1.6 | REACTOME ERK MAPK TARGETS | Genes involved in ERK/MAPK targets |
| 0.1 | 1.6 | REACTOME PLATELET CALCIUM HOMEOSTASIS | Genes involved in Platelet calcium homeostasis |
| 0.1 | 1.0 | REACTOME SULFUR AMINO ACID METABOLISM | Genes involved in Sulfur amino acid metabolism |
| 0.1 | 0.7 | REACTOME SEROTONIN RECEPTORS | Genes involved in Serotonin receptors |
| 0.0 | 1.1 | REACTOME INHIBITION OF VOLTAGE GATED CA2 CHANNELS VIA GBETA GAMMA SUBUNITS | Genes involved in Inhibition of voltage gated Ca2+ channels via Gbeta/gamma subunits |
| 0.0 | 1.8 | REACTOME SYNTHESIS SECRETION AND INACTIVATION OF GIP | Genes involved in Synthesis, Secretion, and Inactivation of Glucose-dependent Insulinotropic Polypeptide (GIP) |
| 0.0 | 0.4 | REACTOME CHYLOMICRON MEDIATED LIPID TRANSPORT | Genes involved in Chylomicron-mediated lipid transport |
| 0.0 | 0.7 | REACTOME PURINE RIBONUCLEOSIDE MONOPHOSPHATE BIOSYNTHESIS | Genes involved in Purine ribonucleoside monophosphate biosynthesis |
| 0.0 | 0.5 | REACTOME REGULATED PROTEOLYSIS OF P75NTR | Genes involved in Regulated proteolysis of p75NTR |
| 0.0 | 0.4 | REACTOME FORMATION OF RNA POL II ELONGATION COMPLEX | Genes involved in Formation of RNA Pol II elongation complex |
| 0.0 | 0.2 | REACTOME DESTABILIZATION OF MRNA BY TRISTETRAPROLIN TTP | Genes involved in Destabilization of mRNA by Tristetraprolin (TTP) |
| 0.0 | 0.4 | REACTOME LIGAND GATED ION CHANNEL TRANSPORT | Genes involved in Ligand-gated ion channel transport |
| 0.0 | 0.9 | REACTOME G ALPHA Z SIGNALLING EVENTS | Genes involved in G alpha (z) signalling events |
| 0.0 | 3.0 | REACTOME DNA REPAIR | Genes involved in DNA Repair |
| 0.0 | 0.4 | REACTOME APOPTOSIS INDUCED DNA FRAGMENTATION | Genes involved in Apoptosis induced DNA fragmentation |
| 0.0 | 0.9 | REACTOME ACETYLCHOLINE NEUROTRANSMITTER RELEASE CYCLE | Genes involved in Acetylcholine Neurotransmitter Release Cycle |
| 0.0 | 0.3 | REACTOME INWARDLY RECTIFYING K CHANNELS | Genes involved in Inwardly rectifying K+ channels |
| 0.0 | 1.9 | REACTOME GLUTATHIONE CONJUGATION | Genes involved in Glutathione conjugation |
| 0.0 | 0.9 | REACTOME MRNA DECAY BY 5 TO 3 EXORIBONUCLEASE | Genes involved in mRNA Decay by 5' to 3' Exoribonuclease |
| 0.0 | 0.1 | REACTOME DESTABILIZATION OF MRNA BY BRF1 | Genes involved in Destabilization of mRNA by Butyrate Response Factor 1 (BRF1) |
| 0.0 | 0.6 | REACTOME SYNTHESIS OF PIPS AT THE LATE ENDOSOME MEMBRANE | Genes involved in Synthesis of PIPs at the late endosome membrane |
| 0.0 | 0.2 | REACTOME CROSS PRESENTATION OF SOLUBLE EXOGENOUS ANTIGENS ENDOSOMES | Genes involved in Cross-presentation of soluble exogenous antigens (endosomes) |
| 0.0 | 0.1 | REACTOME SYNTHESIS OF BILE ACIDS AND BILE SALTS | Genes involved in Synthesis of bile acids and bile salts |
| 0.0 | 3.7 | REACTOME RESPONSE TO ELEVATED PLATELET CYTOSOLIC CA2 | Genes involved in Response to elevated platelet cytosolic Ca2+ |
| 0.0 | 0.1 | REACTOME ADVANCED GLYCOSYLATION ENDPRODUCT RECEPTOR SIGNALING | Genes involved in Advanced glycosylation endproduct receptor signaling |
| 0.0 | 0.7 | REACTOME CLASS C 3 METABOTROPIC GLUTAMATE PHEROMONE RECEPTORS | Genes involved in Class C/3 (Metabotropic glutamate/pheromone receptors) |
| 0.0 | 0.5 | REACTOME PURINE CATABOLISM | Genes involved in Purine catabolism |
| 0.0 | 2.1 | REACTOME METABOLISM OF VITAMINS AND COFACTORS | Genes involved in Metabolism of vitamins and cofactors |
| 0.0 | 2.0 | REACTOME MYOGENESIS | Genes involved in Myogenesis |
| 0.0 | 0.9 | REACTOME BRANCHED CHAIN AMINO ACID CATABOLISM | Genes involved in Branched-chain amino acid catabolism |
| 0.0 | 0.1 | REACTOME SIGNALLING TO P38 VIA RIT AND RIN | Genes involved in Signalling to p38 via RIT and RIN |
| 0.0 | 0.6 | REACTOME GLUCAGON TYPE LIGAND RECEPTORS | Genes involved in Glucagon-type ligand receptors |
| 0.0 | 1.2 | REACTOME NOTCH1 INTRACELLULAR DOMAIN REGULATES TRANSCRIPTION | Genes involved in NOTCH1 Intracellular Domain Regulates Transcription |
| 0.0 | 0.1 | REACTOME SYNTHESIS OF PA | Genes involved in Synthesis of PA |
| 0.0 | 5.8 | REACTOME ANTIGEN PROCESSING UBIQUITINATION PROTEASOME DEGRADATION | Genes involved in Antigen processing: Ubiquitination & Proteasome degradation |
| 0.0 | 0.5 | REACTOME ENDOSOMAL SORTING COMPLEX REQUIRED FOR TRANSPORT ESCRT | Genes involved in Endosomal Sorting Complex Required For Transport (ESCRT) |
| 0.0 | 0.2 | REACTOME P130CAS LINKAGE TO MAPK SIGNALING FOR INTEGRINS | Genes involved in p130Cas linkage to MAPK signaling for integrins |
| 0.0 | 0.1 | REACTOME SIGNAL REGULATORY PROTEIN SIRP FAMILY INTERACTIONS | Genes involved in Signal regulatory protein (SIRP) family interactions |
| 0.0 | 0.5 | REACTOME HYALURONAN UPTAKE AND DEGRADATION | Genes involved in Hyaluronan uptake and degradation |
| 0.0 | 0.4 | REACTOME MRNA SPLICING MINOR PATHWAY | Genes involved in mRNA Splicing - Minor Pathway |
| 0.0 | 0.4 | REACTOME SIGNAL TRANSDUCTION BY L1 | Genes involved in Signal transduction by L1 |
| 0.0 | 2.8 | REACTOME MRNA SPLICING | Genes involved in mRNA Splicing |
| 0.0 | 0.1 | REACTOME ANTIGEN PRESENTATION FOLDING ASSEMBLY AND PEPTIDE LOADING OF CLASS I MHC | Genes involved in Antigen Presentation: Folding, assembly and peptide loading of class I MHC |
| 0.0 | 1.3 | REACTOME TRANSPORT TO THE GOLGI AND SUBSEQUENT MODIFICATION | Genes involved in Transport to the Golgi and subsequent modification |
| 0.0 | 0.4 | REACTOME METABOLISM OF NON CODING RNA | Genes involved in Metabolism of non-coding RNA |
| 0.0 | 0.5 | REACTOME OTHER SEMAPHORIN INTERACTIONS | Genes involved in Other semaphorin interactions |
| 0.0 | 1.0 | REACTOME PROTEIN FOLDING | Genes involved in Protein folding |
| 0.0 | 0.0 | REACTOME TRANSPORT OF MATURE TRANSCRIPT TO CYTOPLASM | Genes involved in Transport of Mature Transcript to Cytoplasm |
| 0.0 | 0.0 | REACTOME NEF MEDIATES DOWN MODULATION OF CELL SURFACE RECEPTORS BY RECRUITING THEM TO CLATHRIN ADAPTERS | Genes involved in Nef-mediates down modulation of cell surface receptors by recruiting them to clathrin adapters |
| 0.0 | 0.2 | REACTOME RNA POL III TRANSCRIPTION INITIATION FROM TYPE 3 PROMOTER | Genes involved in RNA Polymerase III Transcription Initiation From Type 3 Promoter |
| 0.0 | 0.2 | REACTOME SYNTHESIS OF PIPS AT THE GOLGI MEMBRANE | Genes involved in Synthesis of PIPs at the Golgi membrane |
| 0.0 | 0.1 | REACTOME CONVERSION FROM APC C CDC20 TO APC C CDH1 IN LATE ANAPHASE | Genes involved in Conversion from APC/C:Cdc20 to APC/C:Cdh1 in late anaphase |
| 0.0 | 0.2 | REACTOME GLUCOSE TRANSPORT | Genes involved in Glucose transport |
| 0.0 | 0.5 | REACTOME ACETYLCHOLINE BINDING AND DOWNSTREAM EVENTS | Genes involved in Acetylcholine Binding And Downstream Events |
| 0.0 | 0.5 | REACTOME BETA DEFENSINS | Genes involved in Beta defensins |
| 0.0 | 0.5 | REACTOME EXTRINSIC PATHWAY FOR APOPTOSIS | Genes involved in Extrinsic Pathway for Apoptosis |
| 0.0 | 0.9 | REACTOME ACTIVATION OF CHAPERONE GENES BY XBP1S | Genes involved in Activation of Chaperone Genes by XBP1(S) |
| 0.0 | 0.6 | REACTOME GENERATION OF SECOND MESSENGER MOLECULES | Genes involved in Generation of second messenger molecules |
| 0.0 | 0.1 | REACTOME ACYL CHAIN REMODELLING OF PI | Genes involved in Acyl chain remodelling of PI |
| 0.0 | 0.1 | REACTOME INFLUENZA VIRAL RNA TRANSCRIPTION AND REPLICATION | Genes involved in Influenza Viral RNA Transcription and Replication |
| 0.0 | 0.5 | REACTOME PHASE II CONJUGATION | Genes involved in Phase II conjugation |
| 0.0 | 0.7 | REACTOME IRON UPTAKE AND TRANSPORT | Genes involved in Iron uptake and transport |
| 0.0 | 0.3 | REACTOME DEADENYLATION OF MRNA | Genes involved in Deadenylation of mRNA |
| 0.0 | 0.2 | REACTOME PEPTIDE HORMONE BIOSYNTHESIS | Genes involved in Peptide hormone biosynthesis |
| 0.0 | 0.1 | REACTOME TRIF MEDIATED TLR3 SIGNALING | Genes involved in TRIF mediated TLR3 signaling |
| 0.0 | 0.2 | REACTOME DIGESTION OF DIETARY CARBOHYDRATE | Genes involved in Digestion of dietary carbohydrate |
| 0.0 | 0.3 | REACTOME INTRINSIC PATHWAY FOR APOPTOSIS | Genes involved in Intrinsic Pathway for Apoptosis |
| 0.0 | 0.2 | REACTOME ACYL CHAIN REMODELLING OF PG | Genes involved in Acyl chain remodelling of PG |
| 0.0 | 0.4 | REACTOME LATE PHASE OF HIV LIFE CYCLE | Genes involved in Late Phase of HIV Life Cycle |
| 0.0 | 0.2 | REACTOME REGULATION OF COMPLEMENT CASCADE | Genes involved in Regulation of Complement cascade |
| 0.0 | 0.3 | REACTOME FORMATION OF FIBRIN CLOT CLOTTING CASCADE | Genes involved in Formation of Fibrin Clot (Clotting Cascade) |
| 0.0 | 0.0 | REACTOME INCRETIN SYNTHESIS SECRETION AND INACTIVATION | Genes involved in Incretin Synthesis, Secretion, and Inactivation |
| 0.0 | 0.8 | REACTOME CELL DEATH SIGNALLING VIA NRAGE NRIF AND NADE | Genes involved in Cell death signalling via NRAGE, NRIF and NADE |