Project
avrg: Epithelial-Mesenchymal Transition, human (Scheel, 2011)
Navigation
Downloads
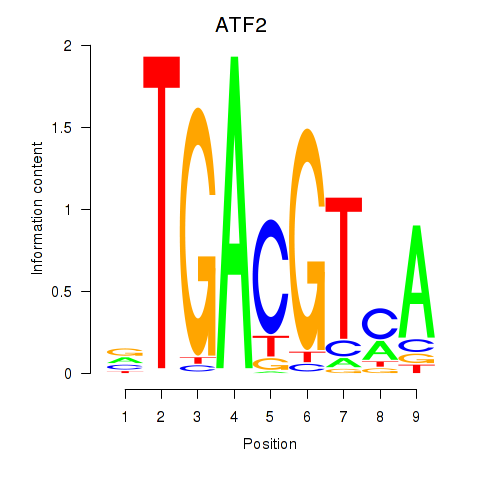
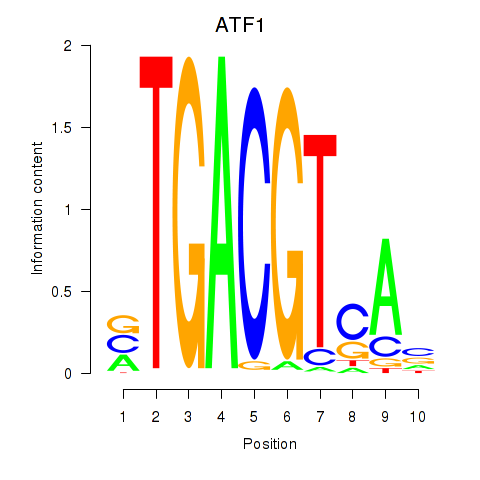
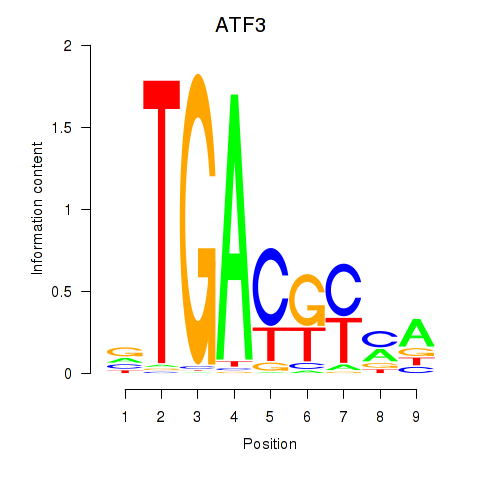
Results for ATF2_ATF1_ATF3
Z-value: 0.65
Motif logo
Transcription factors associated with ATF2_ATF1_ATF3
| Gene Symbol | Gene ID | Gene Info |
|---|---|---|
|
ATF2
|
ENSG00000115966.17 | activating transcription factor 2 |
|
ATF1
|
ENSG00000123268.9 | activating transcription factor 1 |
|
ATF3
|
ENSG00000162772.17 | activating transcription factor 3 |
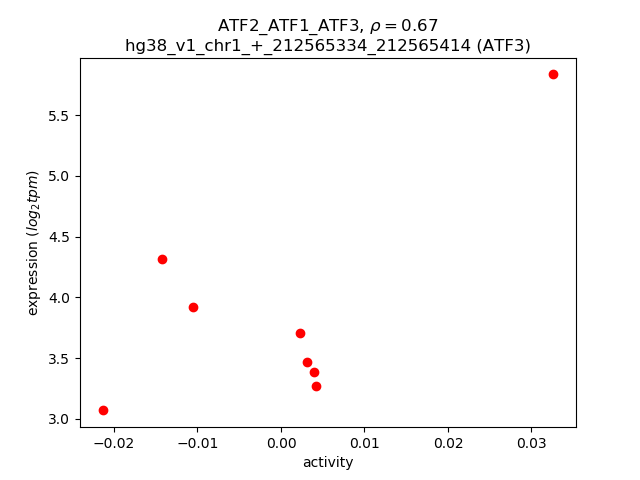
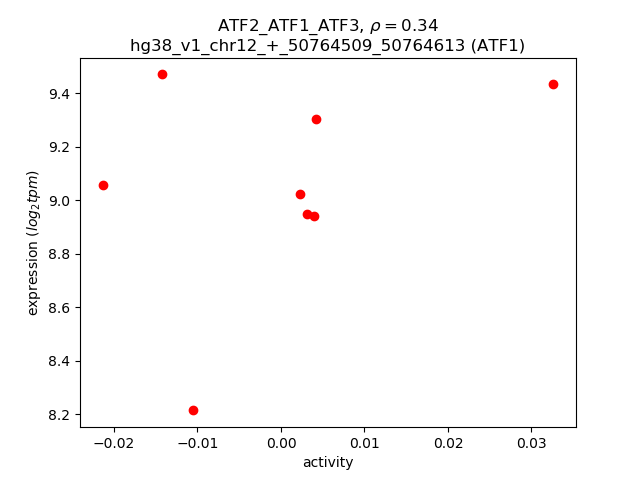
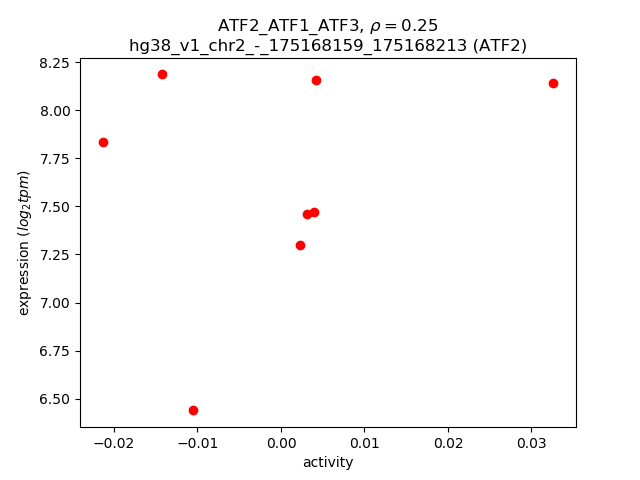
Activity-expression correlation:
| Gene | Promoter | Pearson corr. coef. | P-value | Plot |
|---|---|---|---|---|
| ATF3 | hg38_v1_chr1_+_212565334_212565414 | 0.67 | 6.8e-02 | Click! |
| ATF1 | hg38_v1_chr12_+_50764509_50764613 | 0.34 | 4.1e-01 | Click! |
| ATF2 | hg38_v1_chr2_-_175168159_175168213 | 0.25 | 5.5e-01 | Click! |
Activity profile of ATF2_ATF1_ATF3 motif
Sorted Z-values of ATF2_ATF1_ATF3 motif
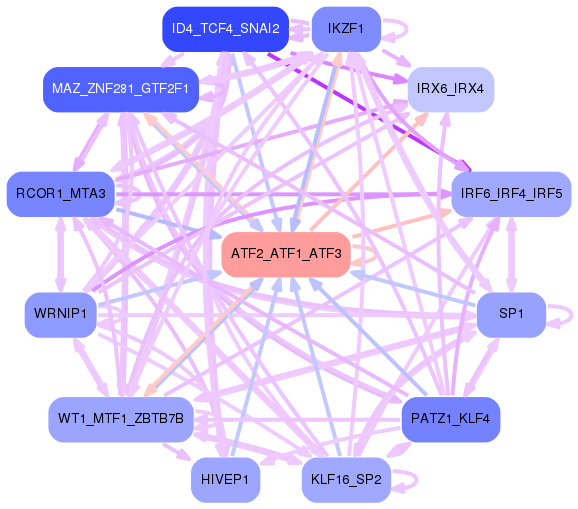
Network of associatons between targets according to the STRING database.

First level regulatory network of ATF2_ATF1_ATF3
Gene Ontology Analysis
Gene overrepresentation in biological process category:
| Log-likelihood per target | Total log-likelihood | Term | Description |
|---|---|---|---|
| 0.3 | 0.9 | GO:0051463 | negative regulation of cortisol secretion(GO:0051463) |
| 0.2 | 0.9 | GO:0061034 | olfactory bulb mitral cell layer development(GO:0061034) |
| 0.2 | 0.8 | GO:0006288 | base-excision repair, DNA ligation(GO:0006288) |
| 0.2 | 0.6 | GO:0070512 | regulation of histone H4-K20 methylation(GO:0070510) positive regulation of histone H4-K20 methylation(GO:0070512) |
| 0.2 | 1.4 | GO:0060744 | thelarche(GO:0042695) mammary gland branching involved in thelarche(GO:0060744) epithelial cell proliferation involved in mammary gland duct elongation(GO:0060750) |
| 0.2 | 0.5 | GO:0035498 | carnosine metabolic process(GO:0035498) |
| 0.1 | 0.4 | GO:0035574 | histone H4-K20 demethylation(GO:0035574) |
| 0.1 | 0.6 | GO:1904799 | negative regulation of dendrite extension(GO:1903860) regulation of neuron remodeling(GO:1904799) negative regulation of neuron remodeling(GO:1904800) negative regulation of branching morphogenesis of a nerve(GO:2000173) |
| 0.1 | 0.4 | GO:0009720 | detection of hormone stimulus(GO:0009720) |
| 0.1 | 0.4 | GO:0048560 | establishment of anatomical structure orientation(GO:0048560) |
| 0.1 | 0.4 | GO:0034471 | endonucleolytic cleavage to generate mature 5'-end of SSU-rRNA from (SSU-rRNA, 5.8S rRNA, LSU-rRNA)(GO:0000472) rRNA 5'-end processing(GO:0000967) ncRNA 5'-end processing(GO:0034471) |
| 0.1 | 1.3 | GO:0061052 | negative regulation of cell growth involved in cardiac muscle cell development(GO:0061052) |
| 0.1 | 1.5 | GO:0015820 | leucine transport(GO:0015820) |
| 0.1 | 0.5 | GO:0001897 | cytolysis by symbiont of host cells(GO:0001897) |
| 0.1 | 0.3 | GO:0070407 | oxidation-dependent protein catabolic process(GO:0070407) |
| 0.1 | 1.3 | GO:0019344 | cysteine biosynthetic process(GO:0019344) |
| 0.1 | 0.4 | GO:1903575 | cornified envelope assembly(GO:1903575) |
| 0.1 | 0.4 | GO:1904744 | positive regulation of telomeric DNA binding(GO:1904744) |
| 0.1 | 0.3 | GO:0009106 | lipoate metabolic process(GO:0009106) |
| 0.1 | 0.3 | GO:0018160 | peptidyl-pyrromethane cofactor linkage(GO:0018160) |
| 0.1 | 0.3 | GO:0071314 | cellular response to cocaine(GO:0071314) |
| 0.1 | 0.4 | GO:1901842 | negative regulation of high voltage-gated calcium channel activity(GO:1901842) |
| 0.1 | 0.3 | GO:0003221 | right ventricular cardiac muscle tissue morphogenesis(GO:0003221) |
| 0.1 | 0.3 | GO:0045013 | carbon catabolite repression of transcription(GO:0045013) negative regulation of transcription by glucose(GO:0045014) |
| 0.1 | 0.3 | GO:0046066 | dGDP metabolic process(GO:0046066) |
| 0.1 | 0.4 | GO:0045658 | regulation of neutrophil differentiation(GO:0045658) negative regulation of neutrophil differentiation(GO:0045659) |
| 0.1 | 0.4 | GO:0045204 | MAPK export from nucleus(GO:0045204) |
| 0.1 | 0.7 | GO:0002943 | tRNA dihydrouridine synthesis(GO:0002943) |
| 0.1 | 1.4 | GO:0000050 | urea cycle(GO:0000050) |
| 0.1 | 0.4 | GO:0097021 | Peyer's patch morphogenesis(GO:0061146) lymphocyte migration into lymphoid organs(GO:0097021) |
| 0.1 | 2.2 | GO:0006744 | ubiquinone biosynthetic process(GO:0006744) quinone biosynthetic process(GO:1901663) |
| 0.1 | 0.7 | GO:0010825 | positive regulation of centrosome duplication(GO:0010825) |
| 0.1 | 0.2 | GO:0018057 | peptidyl-lysine oxidation(GO:0018057) |
| 0.1 | 0.2 | GO:0009386 | translational attenuation(GO:0009386) |
| 0.1 | 0.2 | GO:1904781 | positive regulation of protein localization to centrosome(GO:1904781) |
| 0.1 | 0.4 | GO:1904925 | positive regulation of macromitophagy(GO:1901526) positive regulation of mitophagy in response to mitochondrial depolarization(GO:1904925) |
| 0.1 | 0.1 | GO:0002025 | vasodilation by norepinephrine-epinephrine involved in regulation of systemic arterial blood pressure(GO:0002025) |
| 0.1 | 0.4 | GO:2000234 | positive regulation of ribosome biogenesis(GO:0090070) positive regulation of rRNA processing(GO:2000234) |
| 0.1 | 0.2 | GO:1903774 | positive regulation of viral budding via host ESCRT complex(GO:1903774) |
| 0.1 | 0.2 | GO:0021896 | forebrain astrocyte differentiation(GO:0021896) forebrain astrocyte development(GO:0021897) |
| 0.1 | 0.2 | GO:0042418 | phthalate metabolic process(GO:0018963) epinephrine biosynthetic process(GO:0042418) |
| 0.1 | 0.2 | GO:1903538 | meiotic spindle elongation(GO:0051232) meiotic cell cycle process involved in oocyte maturation(GO:1903537) regulation of meiotic cell cycle process involved in oocyte maturation(GO:1903538) |
| 0.1 | 0.4 | GO:0030035 | microspike assembly(GO:0030035) |
| 0.1 | 0.3 | GO:1904640 | response to methionine(GO:1904640) |
| 0.1 | 0.2 | GO:1901876 | regulation of calcium ion binding(GO:1901876) negative regulation of calcium ion binding(GO:1901877) |
| 0.1 | 0.3 | GO:0000738 | DNA catabolic process, exonucleolytic(GO:0000738) |
| 0.1 | 0.2 | GO:0060382 | regulation of DNA strand elongation(GO:0060382) |
| 0.1 | 0.2 | GO:0038043 | interleukin-5-mediated signaling pathway(GO:0038043) interleukin-3-mediated signaling pathway(GO:0038156) |
| 0.1 | 0.2 | GO:0071962 | mitotic sister chromatid cohesion, centromeric(GO:0071962) |
| 0.1 | 0.8 | GO:0046940 | nucleoside monophosphate phosphorylation(GO:0046940) |
| 0.1 | 0.2 | GO:0070662 | positive regulation of Fc receptor mediated stimulatory signaling pathway(GO:0060369) mast cell proliferation(GO:0070662) |
| 0.1 | 0.3 | GO:0006408 | snRNA export from nucleus(GO:0006408) positive regulation of RNA export from nucleus(GO:0046833) |
| 0.1 | 0.2 | GO:0060279 | positive regulation of ovulation(GO:0060279) |
| 0.1 | 0.2 | GO:0060708 | spongiotrophoblast differentiation(GO:0060708) |
| 0.1 | 0.1 | GO:0019046 | release from viral latency(GO:0019046) |
| 0.1 | 0.4 | GO:0010032 | meiotic chromosome condensation(GO:0010032) |
| 0.1 | 0.4 | GO:0046340 | diacylglycerol catabolic process(GO:0046340) |
| 0.1 | 0.1 | GO:0044205 | 'de novo' UMP biosynthetic process(GO:0044205) |
| 0.1 | 0.2 | GO:0043605 | cellular amide catabolic process(GO:0043605) |
| 0.1 | 0.8 | GO:0006600 | creatine metabolic process(GO:0006600) |
| 0.1 | 0.2 | GO:2000118 | regulation of sodium-dependent phosphate transport(GO:2000118) |
| 0.1 | 0.3 | GO:0039689 | negative stranded viral RNA replication(GO:0039689) multi-organism biosynthetic process(GO:0044034) |
| 0.1 | 0.4 | GO:0060373 | regulation of ventricular cardiac muscle cell membrane depolarization(GO:0060373) |
| 0.1 | 0.4 | GO:1903026 | negative regulation of RNA polymerase II regulatory region sequence-specific DNA binding(GO:1903026) |
| 0.1 | 0.2 | GO:0007499 | ectoderm and mesoderm interaction(GO:0007499) |
| 0.1 | 0.4 | GO:0007000 | nucleolus organization(GO:0007000) |
| 0.1 | 0.2 | GO:0061394 | regulation of transcription from RNA polymerase II promoter in response to arsenic-containing substance(GO:0061394) |
| 0.1 | 0.2 | GO:0002949 | tRNA threonylcarbamoyladenosine modification(GO:0002949) |
| 0.1 | 0.2 | GO:0032765 | positive regulation of mast cell cytokine production(GO:0032765) |
| 0.1 | 0.2 | GO:0003099 | positive regulation of the force of heart contraction by chemical signal(GO:0003099) |
| 0.1 | 0.3 | GO:1901536 | regulation of DNA demethylation(GO:1901535) negative regulation of DNA demethylation(GO:1901536) regulation of genetic imprinting(GO:2000653) |
| 0.1 | 0.3 | GO:0034140 | negative regulation of toll-like receptor 3 signaling pathway(GO:0034140) |
| 0.1 | 0.2 | GO:1902568 | positive regulation of eosinophil degranulation(GO:0043311) positive regulation of eosinophil activation(GO:1902568) |
| 0.1 | 0.2 | GO:0000912 | assembly of actomyosin apparatus involved in cytokinesis(GO:0000912) actomyosin contractile ring assembly(GO:0000915) actomyosin contractile ring organization(GO:0044837) |
| 0.0 | 0.1 | GO:1901491 | axial mesoderm formation(GO:0048320) negative regulation of lymphangiogenesis(GO:1901491) |
| 0.0 | 1.2 | GO:0010867 | positive regulation of triglyceride biosynthetic process(GO:0010867) |
| 0.0 | 0.3 | GO:0002318 | myeloid progenitor cell differentiation(GO:0002318) |
| 0.0 | 0.1 | GO:0032826 | natural killer cell differentiation involved in immune response(GO:0002325) negative regulation of natural killer cell differentiation(GO:0032824) regulation of natural killer cell differentiation involved in immune response(GO:0032826) negative regulation of natural killer cell differentiation involved in immune response(GO:0032827) |
| 0.0 | 0.8 | GO:1902224 | ketone body metabolic process(GO:1902224) |
| 0.0 | 0.4 | GO:0031642 | negative regulation of myelination(GO:0031642) |
| 0.0 | 1.0 | GO:0031268 | pseudopodium organization(GO:0031268) |
| 0.0 | 1.0 | GO:0006646 | phosphatidylethanolamine biosynthetic process(GO:0006646) |
| 0.0 | 0.0 | GO:0060775 | mediolateral intercalation(GO:0060031) planar cell polarity pathway involved in gastrula mediolateral intercalation(GO:0060775) |
| 0.0 | 0.2 | GO:1902775 | mitochondrial large ribosomal subunit assembly(GO:1902775) |
| 0.0 | 0.2 | GO:0007206 | phospholipase C-activating G-protein coupled glutamate receptor signaling pathway(GO:0007206) |
| 0.0 | 0.1 | GO:1902310 | positive regulation of peptidyl-serine dephosphorylation(GO:1902310) |
| 0.0 | 0.1 | GO:0036245 | cellular response to menadione(GO:0036245) |
| 0.0 | 0.2 | GO:0048073 | regulation of eye pigmentation(GO:0048073) |
| 0.0 | 0.2 | GO:0006432 | phenylalanyl-tRNA aminoacylation(GO:0006432) |
| 0.0 | 0.1 | GO:0070837 | dehydroascorbic acid transport(GO:0070837) |
| 0.0 | 0.4 | GO:0006657 | CDP-choline pathway(GO:0006657) |
| 0.0 | 0.1 | GO:1902269 | positive regulation of polyamine transmembrane transport(GO:1902269) |
| 0.0 | 0.3 | GO:0048014 | Tie signaling pathway(GO:0048014) |
| 0.0 | 0.1 | GO:0002581 | negative regulation of antigen processing and presentation of peptide or polysaccharide antigen via MHC class II(GO:0002581) |
| 0.0 | 0.2 | GO:1904073 | regulation of trophectodermal cell proliferation(GO:1904073) positive regulation of trophectodermal cell proliferation(GO:1904075) |
| 0.0 | 0.2 | GO:0071918 | urea transmembrane transport(GO:0071918) |
| 0.0 | 0.4 | GO:0060136 | embryonic process involved in female pregnancy(GO:0060136) |
| 0.0 | 0.0 | GO:1903978 | regulation of microglial cell activation(GO:1903978) |
| 0.0 | 0.3 | GO:0051122 | hepoxilin metabolic process(GO:0051121) hepoxilin biosynthetic process(GO:0051122) |
| 0.0 | 0.1 | GO:0071921 | establishment of sister chromatid cohesion(GO:0034085) cohesin loading(GO:0071921) regulation of cohesin loading(GO:0071922) |
| 0.0 | 0.1 | GO:0006669 | sphinganine-1-phosphate biosynthetic process(GO:0006669) |
| 0.0 | 0.2 | GO:0000480 | endonucleolytic cleavage in 5'-ETS of tricistronic rRNA transcript (SSU-rRNA, 5.8S rRNA, LSU-rRNA)(GO:0000480) |
| 0.0 | 0.3 | GO:0034723 | DNA replication-dependent nucleosome assembly(GO:0006335) DNA replication-dependent nucleosome organization(GO:0034723) |
| 0.0 | 0.1 | GO:0060010 | Sertoli cell fate commitment(GO:0060010) |
| 0.0 | 0.2 | GO:0000960 | mitochondrial RNA catabolic process(GO:0000957) regulation of mitochondrial RNA catabolic process(GO:0000960) |
| 0.0 | 0.2 | GO:0035519 | protein K29-linked ubiquitination(GO:0035519) |
| 0.0 | 0.1 | GO:0002901 | mature B cell apoptotic process(GO:0002901) regulation of mature B cell apoptotic process(GO:0002905) negative regulation of mature B cell apoptotic process(GO:0002906) |
| 0.0 | 0.1 | GO:1904924 | negative regulation of mitophagy in response to mitochondrial depolarization(GO:1904924) |
| 0.0 | 0.1 | GO:0002143 | tRNA wobble position uridine thiolation(GO:0002143) |
| 0.0 | 0.0 | GO:0098905 | regulation of bundle of His cell action potential(GO:0098905) |
| 0.0 | 0.1 | GO:1903288 | positive regulation of potassium ion import(GO:1903288) |
| 0.0 | 0.2 | GO:0051012 | microtubule sliding(GO:0051012) |
| 0.0 | 0.1 | GO:2000687 | negative regulation of rubidium ion transport(GO:2000681) negative regulation of rubidium ion transmembrane transporter activity(GO:2000687) |
| 0.0 | 0.3 | GO:0007135 | meiosis II(GO:0007135) |
| 0.0 | 0.1 | GO:0098971 | anterograde dendritic transport of neurotransmitter receptor complex(GO:0098971) |
| 0.0 | 0.2 | GO:0043988 | histone H3-S28 phosphorylation(GO:0043988) |
| 0.0 | 0.1 | GO:0003290 | septum secundum development(GO:0003285) atrial septum secundum morphogenesis(GO:0003290) |
| 0.0 | 0.2 | GO:0019264 | glycine biosynthetic process from serine(GO:0019264) |
| 0.0 | 0.2 | GO:0045653 | negative regulation of megakaryocyte differentiation(GO:0045653) |
| 0.0 | 0.1 | GO:0018125 | peptidyl-cysteine methylation(GO:0018125) |
| 0.0 | 0.1 | GO:1904692 | positive regulation of type B pancreatic cell proliferation(GO:1904692) |
| 0.0 | 0.1 | GO:0001732 | formation of cytoplasmic translation initiation complex(GO:0001732) |
| 0.0 | 0.1 | GO:1902626 | assembly of large subunit precursor of preribosome(GO:1902626) |
| 0.0 | 0.1 | GO:0061760 | antifungal innate immune response(GO:0061760) |
| 0.0 | 0.1 | GO:1990426 | negative regulation of mammary gland epithelial cell proliferation(GO:0033600) homologous recombination-dependent replication fork processing(GO:1990426) |
| 0.0 | 0.1 | GO:0030221 | basophil differentiation(GO:0030221) |
| 0.0 | 0.1 | GO:1904580 | proepicardium development(GO:0003342) septum transversum development(GO:0003343) regulation of intracellular mRNA localization(GO:1904580) positive regulation of intracellular mRNA localization(GO:1904582) |
| 0.0 | 0.1 | GO:1901350 | cell-cell signaling involved in cell-cell junction organization(GO:1901350) |
| 0.0 | 0.2 | GO:1902412 | regulation of mitotic cytokinesis(GO:1902412) |
| 0.0 | 0.2 | GO:2000348 | regulation of CD40 signaling pathway(GO:2000348) |
| 0.0 | 0.4 | GO:0010614 | negative regulation of cardiac muscle hypertrophy(GO:0010614) |
| 0.0 | 0.1 | GO:0000451 | rRNA 2'-O-methylation(GO:0000451) |
| 0.0 | 0.1 | GO:0010933 | macrophage tolerance induction(GO:0010931) regulation of macrophage tolerance induction(GO:0010932) positive regulation of macrophage tolerance induction(GO:0010933) |
| 0.0 | 0.2 | GO:0016926 | protein desumoylation(GO:0016926) |
| 0.0 | 0.1 | GO:0021773 | striatal medium spiny neuron differentiation(GO:0021773) |
| 0.0 | 0.1 | GO:1902512 | positive regulation of apoptotic DNA fragmentation(GO:1902512) |
| 0.0 | 0.1 | GO:0071442 | positive regulation of histone H3-K14 acetylation(GO:0071442) |
| 0.0 | 0.1 | GO:0002159 | desmosome assembly(GO:0002159) |
| 0.0 | 0.1 | GO:0010044 | response to aluminum ion(GO:0010044) |
| 0.0 | 0.1 | GO:0006663 | platelet activating factor biosynthetic process(GO:0006663) |
| 0.0 | 0.6 | GO:0046838 | phosphorylated carbohydrate dephosphorylation(GO:0046838) inositol phosphate dephosphorylation(GO:0046855) |
| 0.0 | 0.2 | GO:0070164 | negative regulation of adiponectin secretion(GO:0070164) |
| 0.0 | 0.6 | GO:1904262 | negative regulation of TORC1 signaling(GO:1904262) |
| 0.0 | 0.1 | GO:1902164 | mRNA localization resulting in posttranscriptional regulation of gene expression(GO:0010609) platelet alpha granule organization(GO:0070889) regulation of DNA damage response, signal transduction by p53 class mediator resulting in transcription of p21 class mediator(GO:1902162) positive regulation of DNA damage response, signal transduction by p53 class mediator resulting in transcription of p21 class mediator(GO:1902164) |
| 0.0 | 0.4 | GO:0045475 | locomotor rhythm(GO:0045475) |
| 0.0 | 1.2 | GO:0051123 | RNA polymerase II transcriptional preinitiation complex assembly(GO:0051123) |
| 0.0 | 0.1 | GO:0045875 | negative regulation of sister chromatid cohesion(GO:0045875) |
| 0.0 | 0.1 | GO:1904045 | cellular response to aldosterone(GO:1904045) |
| 0.0 | 0.0 | GO:0003140 | determination of left/right asymmetry in lateral mesoderm(GO:0003140) |
| 0.0 | 0.4 | GO:0045793 | positive regulation of cell size(GO:0045793) |
| 0.0 | 0.1 | GO:0038098 | sequestering of BMP from receptor via BMP binding(GO:0038098) |
| 0.0 | 0.3 | GO:1902218 | regulation of intrinsic apoptotic signaling pathway in response to osmotic stress(GO:1902218) |
| 0.0 | 0.2 | GO:0046146 | tetrahydrobiopterin biosynthetic process(GO:0006729) tetrahydrobiopterin metabolic process(GO:0046146) |
| 0.0 | 0.2 | GO:0002329 | pre-B cell differentiation(GO:0002329) |
| 0.0 | 0.1 | GO:0098957 | anterograde axonal transport of mitochondrion(GO:0098957) |
| 0.0 | 0.3 | GO:1903690 | negative regulation of wound healing, spreading of epidermal cells(GO:1903690) |
| 0.0 | 0.5 | GO:0034356 | NAD biosynthesis via nicotinamide riboside salvage pathway(GO:0034356) |
| 0.0 | 0.4 | GO:0035020 | regulation of Rac protein signal transduction(GO:0035020) |
| 0.0 | 0.1 | GO:1903348 | positive regulation of bicellular tight junction assembly(GO:1903348) |
| 0.0 | 0.1 | GO:0046886 | positive regulation of hormone biosynthetic process(GO:0046886) |
| 0.0 | 0.2 | GO:0070475 | rRNA base methylation(GO:0070475) |
| 0.0 | 0.1 | GO:0046368 | GDP-L-fucose metabolic process(GO:0046368) |
| 0.0 | 0.2 | GO:0060261 | positive regulation of transcription initiation from RNA polymerase II promoter(GO:0060261) |
| 0.0 | 0.1 | GO:0006499 | N-terminal protein myristoylation(GO:0006499) |
| 0.0 | 0.0 | GO:0002268 | follicular dendritic cell differentiation(GO:0002268) |
| 0.0 | 0.1 | GO:0033132 | negative regulation of glucokinase activity(GO:0033132) negative regulation of hexokinase activity(GO:1903300) |
| 0.0 | 0.4 | GO:0014029 | neural crest formation(GO:0014029) |
| 0.0 | 0.0 | GO:0090296 | regulation of mitochondrial DNA replication(GO:0090296) negative regulation of mitochondrial DNA replication(GO:0090298) negative regulation of mitochondrial DNA metabolic process(GO:1901859) |
| 0.0 | 0.4 | GO:0001829 | trophectodermal cell differentiation(GO:0001829) |
| 0.0 | 0.2 | GO:1990481 | mRNA pseudouridine synthesis(GO:1990481) |
| 0.0 | 0.1 | GO:0009644 | response to high light intensity(GO:0009644) |
| 0.0 | 0.2 | GO:0019375 | galactosylceramide biosynthetic process(GO:0006682) galactolipid biosynthetic process(GO:0019375) |
| 0.0 | 0.1 | GO:0044027 | hypermethylation of CpG island(GO:0044027) |
| 0.0 | 0.1 | GO:0046379 | extracellular polysaccharide biosynthetic process(GO:0045226) extracellular polysaccharide metabolic process(GO:0046379) |
| 0.0 | 0.1 | GO:0090666 | scaRNA localization to Cajal body(GO:0090666) |
| 0.0 | 0.7 | GO:0030488 | tRNA methylation(GO:0030488) |
| 0.0 | 0.1 | GO:0036414 | protein citrullination(GO:0018101) histone citrullination(GO:0036414) |
| 0.0 | 0.5 | GO:0038092 | nodal signaling pathway(GO:0038092) |
| 0.0 | 0.1 | GO:0030860 | regulation of polarized epithelial cell differentiation(GO:0030860) |
| 0.0 | 0.2 | GO:0098881 | exocytic insertion of neurotransmitter receptor to plasma membrane(GO:0098881) exocytic insertion of neurotransmitter receptor to postsynaptic membrane(GO:0098967) |
| 0.0 | 0.1 | GO:0030174 | regulation of DNA-dependent DNA replication initiation(GO:0030174) |
| 0.0 | 0.1 | GO:1902410 | mitotic cytokinetic process(GO:1902410) |
| 0.0 | 0.0 | GO:0000022 | mitotic spindle elongation(GO:0000022) |
| 0.0 | 0.1 | GO:1904862 | inhibitory synapse assembly(GO:1904862) |
| 0.0 | 0.1 | GO:1901675 | negative regulation of histone H3-K27 acetylation(GO:1901675) |
| 0.0 | 0.1 | GO:0006781 | succinyl-CoA pathway(GO:0006781) |
| 0.0 | 0.2 | GO:0032790 | ribosome disassembly(GO:0032790) |
| 0.0 | 0.1 | GO:1901093 | regulation of protein tetramerization(GO:1901090) negative regulation of protein tetramerization(GO:1901091) regulation of protein homotetramerization(GO:1901093) negative regulation of protein homotetramerization(GO:1901094) |
| 0.0 | 0.1 | GO:0060448 | dichotomous subdivision of terminal units involved in lung branching(GO:0060448) |
| 0.0 | 0.1 | GO:0035553 | oxidative RNA demethylation(GO:0035513) oxidative single-stranded RNA demethylation(GO:0035553) |
| 0.0 | 0.3 | GO:0035360 | positive regulation of peroxisome proliferator activated receptor signaling pathway(GO:0035360) |
| 0.0 | 0.3 | GO:0051255 | spindle midzone assembly(GO:0051255) |
| 0.0 | 0.3 | GO:0071481 | cellular response to X-ray(GO:0071481) |
| 0.0 | 0.2 | GO:0051599 | response to hydrostatic pressure(GO:0051599) |
| 0.0 | 0.1 | GO:0061358 | negative regulation of Wnt protein secretion(GO:0061358) |
| 0.0 | 0.3 | GO:0006610 | ribosomal protein import into nucleus(GO:0006610) |
| 0.0 | 0.2 | GO:0097052 | L-kynurenine metabolic process(GO:0097052) |
| 0.0 | 0.1 | GO:1902299 | pre-replicative complex assembly involved in nuclear cell cycle DNA replication(GO:0006267) regulation of chromatin silencing at telomere(GO:0031938) pre-replicative complex assembly(GO:0036388) pre-replicative complex assembly involved in cell cycle DNA replication(GO:1902299) |
| 0.0 | 0.3 | GO:0016998 | cell wall macromolecule catabolic process(GO:0016998) |
| 0.0 | 0.2 | GO:0045054 | constitutive secretory pathway(GO:0045054) |
| 0.0 | 0.1 | GO:1903527 | positive regulation of membrane tubulation(GO:1903527) |
| 0.0 | 0.2 | GO:0044829 | positive regulation by host of viral genome replication(GO:0044829) |
| 0.0 | 0.1 | GO:2000639 | regulation of SREBP signaling pathway(GO:2000638) negative regulation of SREBP signaling pathway(GO:2000639) |
| 0.0 | 0.5 | GO:0060644 | mammary gland epithelial cell differentiation(GO:0060644) |
| 0.0 | 0.1 | GO:0003408 | optic cup formation involved in camera-type eye development(GO:0003408) |
| 0.0 | 0.2 | GO:0007258 | JUN phosphorylation(GO:0007258) |
| 0.0 | 0.1 | GO:0090166 | Golgi disassembly(GO:0090166) |
| 0.0 | 0.1 | GO:1900264 | regulation of DNA-directed DNA polymerase activity(GO:1900262) positive regulation of DNA-directed DNA polymerase activity(GO:1900264) |
| 0.0 | 0.1 | GO:0036483 | neuron intrinsic apoptotic signaling pathway in response to endoplasmic reticulum stress(GO:0036483) regulation of endoplasmic reticulum stress-induced neuron intrinsic apoptotic signaling pathway(GO:1903381) negative regulation of endoplasmic reticulum stress-induced neuron intrinsic apoptotic signaling pathway(GO:1903382) |
| 0.0 | 0.2 | GO:0042532 | negative regulation of tyrosine phosphorylation of STAT protein(GO:0042532) |
| 0.0 | 0.0 | GO:0045645 | regulation of eosinophil differentiation(GO:0045643) positive regulation of eosinophil differentiation(GO:0045645) |
| 0.0 | 0.1 | GO:0036324 | vascular endothelial growth factor receptor-2 signaling pathway(GO:0036324) |
| 0.0 | 0.1 | GO:0010513 | positive regulation of phosphatidylinositol biosynthetic process(GO:0010513) |
| 0.0 | 0.2 | GO:0006537 | glutamate biosynthetic process(GO:0006537) gamma-aminobutyric acid biosynthetic process(GO:0009449) |
| 0.0 | 0.1 | GO:1902905 | positive regulation of fibril organization(GO:1902905) |
| 0.0 | 0.4 | GO:0072520 | seminiferous tubule development(GO:0072520) |
| 0.0 | 0.1 | GO:0090261 | positive regulation of inclusion body assembly(GO:0090261) |
| 0.0 | 0.1 | GO:0009257 | 10-formyltetrahydrofolate biosynthetic process(GO:0009257) |
| 0.0 | 0.1 | GO:0061300 | cerebellum vasculature development(GO:0061300) |
| 0.0 | 0.9 | GO:1900739 | regulation of protein insertion into mitochondrial membrane involved in apoptotic signaling pathway(GO:1900739) positive regulation of protein insertion into mitochondrial membrane involved in apoptotic signaling pathway(GO:1900740) |
| 0.0 | 0.1 | GO:0038195 | urokinase plasminogen activator signaling pathway(GO:0038195) |
| 0.0 | 0.2 | GO:0071025 | RNA surveillance(GO:0071025) |
| 0.0 | 0.1 | GO:0033353 | S-adenosylmethionine cycle(GO:0033353) |
| 0.0 | 0.1 | GO:1903265 | positive regulation of tumor necrosis factor-mediated signaling pathway(GO:1903265) |
| 0.0 | 0.1 | GO:0008614 | pyridoxine metabolic process(GO:0008614) pyridoxine biosynthetic process(GO:0008615) vitamin B6 biosynthetic process(GO:0042819) |
| 0.0 | 0.1 | GO:0030951 | establishment or maintenance of microtubule cytoskeleton polarity(GO:0030951) |
| 0.0 | 0.1 | GO:0030070 | insulin processing(GO:0030070) |
| 0.0 | 0.1 | GO:0097368 | establishment of Sertoli cell barrier(GO:0097368) |
| 0.0 | 0.3 | GO:0045717 | negative regulation of fatty acid biosynthetic process(GO:0045717) |
| 0.0 | 0.2 | GO:0045722 | positive regulation of gluconeogenesis(GO:0045722) |
| 0.0 | 0.1 | GO:0045329 | carnitine biosynthetic process(GO:0045329) |
| 0.0 | 0.1 | GO:1990834 | response to odorant(GO:1990834) |
| 0.0 | 0.2 | GO:0006570 | tyrosine metabolic process(GO:0006570) |
| 0.0 | 0.3 | GO:0071371 | cellular response to gonadotropin stimulus(GO:0071371) |
| 0.0 | 0.1 | GO:0006177 | GMP biosynthetic process(GO:0006177) |
| 0.0 | 0.1 | GO:2000286 | receptor internalization involved in canonical Wnt signaling pathway(GO:2000286) |
| 0.0 | 0.0 | GO:0061187 | regulation of chromatin silencing at rDNA(GO:0061187) negative regulation of chromatin silencing at rDNA(GO:0061188) |
| 0.0 | 0.2 | GO:0016446 | somatic hypermutation of immunoglobulin genes(GO:0016446) |
| 0.0 | 0.1 | GO:0000973 | posttranscriptional tethering of RNA polymerase II gene DNA at nuclear periphery(GO:0000973) |
| 0.0 | 0.1 | GO:0090625 | mRNA cleavage involved in gene silencing by siRNA(GO:0090625) |
| 0.0 | 0.1 | GO:0002541 | activation of plasma proteins involved in acute inflammatory response(GO:0002541) |
| 0.0 | 0.0 | GO:0061580 | colon epithelial cell migration(GO:0061580) |
| 0.0 | 0.4 | GO:0006400 | tRNA modification(GO:0006400) |
| 0.0 | 0.1 | GO:0060574 | intestinal epithelial cell maturation(GO:0060574) |
| 0.0 | 0.1 | GO:2000321 | positive regulation of T-helper 17 cell differentiation(GO:2000321) |
| 0.0 | 0.1 | GO:0031118 | rRNA pseudouridine synthesis(GO:0031118) |
| 0.0 | 0.1 | GO:2000074 | regulation of type B pancreatic cell development(GO:2000074) |
| 0.0 | 0.1 | GO:0008298 | intracellular mRNA localization(GO:0008298) |
| 0.0 | 0.1 | GO:0060830 | ciliary receptor clustering involved in smoothened signaling pathway(GO:0060830) |
| 0.0 | 0.4 | GO:0006907 | pinocytosis(GO:0006907) |
| 0.0 | 0.2 | GO:0051103 | DNA ligation involved in DNA repair(GO:0051103) |
| 0.0 | 0.4 | GO:0014898 | muscle hypertrophy in response to stress(GO:0003299) cardiac muscle adaptation(GO:0014887) cardiac muscle hypertrophy in response to stress(GO:0014898) |
| 0.0 | 0.2 | GO:0061000 | negative regulation of dendritic spine development(GO:0061000) |
| 0.0 | 0.2 | GO:0048733 | sebaceous gland development(GO:0048733) |
| 0.0 | 0.6 | GO:0061641 | CENP-A containing nucleosome assembly(GO:0034080) CENP-A containing chromatin organization(GO:0061641) |
| 0.0 | 0.0 | GO:0014022 | neural plate elongation(GO:0014022) convergent extension involved in neural plate elongation(GO:0022007) |
| 0.0 | 0.1 | GO:1900625 | regulation of monocyte aggregation(GO:1900623) positive regulation of monocyte aggregation(GO:1900625) |
| 0.0 | 0.1 | GO:0010792 | DNA double-strand break processing involved in repair via single-strand annealing(GO:0010792) |
| 0.0 | 0.2 | GO:0014809 | regulation of skeletal muscle contraction by regulation of release of sequestered calcium ion(GO:0014809) |
| 0.0 | 0.1 | GO:1904885 | beta-catenin destruction complex assembly(GO:1904885) |
| 0.0 | 0.1 | GO:0060770 | negative regulation of epithelial cell proliferation involved in prostate gland development(GO:0060770) |
| 0.0 | 1.6 | GO:0070126 | mitochondrial translational termination(GO:0070126) |
| 0.0 | 0.1 | GO:0032911 | negative regulation of transforming growth factor beta1 production(GO:0032911) |
| 0.0 | 0.1 | GO:0000389 | mRNA 3'-splice site recognition(GO:0000389) |
| 0.0 | 0.0 | GO:0098532 | histone H3-K27 trimethylation(GO:0098532) |
| 0.0 | 0.3 | GO:0060213 | regulation of nuclear-transcribed mRNA poly(A) tail shortening(GO:0060211) positive regulation of nuclear-transcribed mRNA poly(A) tail shortening(GO:0060213) |
| 0.0 | 0.1 | GO:0019532 | oxalate transport(GO:0019532) |
| 0.0 | 0.1 | GO:0090669 | telomerase RNA stabilization(GO:0090669) |
| 0.0 | 0.0 | GO:0021526 | medial motor column neuron differentiation(GO:0021526) |
| 0.0 | 0.1 | GO:1902474 | positive regulation of protein localization to synapse(GO:1902474) |
| 0.0 | 0.0 | GO:1901253 | negative regulation of intracellular transport of viral material(GO:1901253) |
| 0.0 | 0.1 | GO:1904879 | positive regulation of calcium ion transmembrane transport via high voltage-gated calcium channel(GO:1904879) |
| 0.0 | 0.0 | GO:0033152 | immunoglobulin V(D)J recombination(GO:0033152) |
| 0.0 | 0.0 | GO:0015917 | aminophospholipid transport(GO:0015917) |
| 0.0 | 0.1 | GO:0060017 | parathyroid gland development(GO:0060017) |
| 0.0 | 0.2 | GO:0051964 | negative regulation of synapse assembly(GO:0051964) |
| 0.0 | 0.1 | GO:1903412 | response to bile acid(GO:1903412) |
| 0.0 | 0.1 | GO:0010835 | regulation of protein ADP-ribosylation(GO:0010835) |
| 0.0 | 0.1 | GO:0007185 | transmembrane receptor protein tyrosine phosphatase signaling pathway(GO:0007185) |
| 0.0 | 0.2 | GO:1904776 | regulation of protein localization to cell cortex(GO:1904776) positive regulation of protein localization to cell cortex(GO:1904778) |
| 0.0 | 0.0 | GO:0036451 | cap mRNA methylation(GO:0036451) |
| 0.0 | 0.2 | GO:0006309 | apoptotic DNA fragmentation(GO:0006309) |
| 0.0 | 0.1 | GO:0061087 | positive regulation of histone H3-K27 methylation(GO:0061087) |
| 0.0 | 0.0 | GO:0060332 | positive regulation of response to interferon-gamma(GO:0060332) positive regulation of interferon-gamma-mediated signaling pathway(GO:0060335) |
| 0.0 | 0.1 | GO:0060965 | negative regulation of gene silencing by miRNA(GO:0060965) |
| 0.0 | 0.1 | GO:0007296 | vitellogenesis(GO:0007296) |
| 0.0 | 0.3 | GO:0060972 | left/right pattern formation(GO:0060972) |
| 0.0 | 0.1 | GO:0019482 | beta-alanine metabolic process(GO:0019482) |
| 0.0 | 0.7 | GO:0042771 | intrinsic apoptotic signaling pathway in response to DNA damage by p53 class mediator(GO:0042771) |
| 0.0 | 0.0 | GO:0035983 | response to trichostatin A(GO:0035983) cellular response to trichostatin A(GO:0035984) |
| 0.0 | 0.1 | GO:0031936 | negative regulation of chromatin silencing(GO:0031936) |
| 0.0 | 0.2 | GO:0000054 | ribosomal subunit export from nucleus(GO:0000054) ribosome localization(GO:0033750) establishment of ribosome localization(GO:0033753) |
| 0.0 | 0.0 | GO:0072318 | clathrin coat disassembly(GO:0072318) clathrin-coated pit assembly(GO:1905224) |
| 0.0 | 0.0 | GO:0010193 | response to ozone(GO:0010193) |
| 0.0 | 0.1 | GO:0030948 | negative regulation of vascular endothelial growth factor receptor signaling pathway(GO:0030948) |
| 0.0 | 0.1 | GO:0016075 | rRNA catabolic process(GO:0016075) |
| 0.0 | 0.0 | GO:0036047 | protein demalonylation(GO:0036046) peptidyl-lysine demalonylation(GO:0036047) protein desuccinylation(GO:0036048) peptidyl-lysine desuccinylation(GO:0036049) protein deglutarylation(GO:0061698) peptidyl-lysine deglutarylation(GO:0061699) |
| 0.0 | 0.0 | GO:0090164 | asymmetric Golgi ribbon formation(GO:0090164) |
| 0.0 | 0.2 | GO:0045741 | positive regulation of epidermal growth factor-activated receptor activity(GO:0045741) |
| 0.0 | 0.3 | GO:0001510 | RNA methylation(GO:0001510) |
| 0.0 | 0.0 | GO:0060721 | spongiotrophoblast cell proliferation(GO:0060720) regulation of spongiotrophoblast cell proliferation(GO:0060721) cell proliferation involved in embryonic placenta development(GO:0060722) regulation of cell proliferation involved in embryonic placenta development(GO:0060723) |
| 0.0 | 0.1 | GO:0001787 | natural killer cell proliferation(GO:0001787) |
| 0.0 | 0.1 | GO:0061737 | leukotriene signaling pathway(GO:0061737) |
| 0.0 | 0.2 | GO:0030150 | protein import into mitochondrial matrix(GO:0030150) |
| 0.0 | 0.4 | GO:0034035 | purine ribonucleoside bisphosphate metabolic process(GO:0034035) 3'-phosphoadenosine 5'-phosphosulfate metabolic process(GO:0050427) |
| 0.0 | 0.2 | GO:1900025 | negative regulation of substrate adhesion-dependent cell spreading(GO:1900025) |
| 0.0 | 0.4 | GO:0008053 | mitochondrial fusion(GO:0008053) |
| 0.0 | 0.3 | GO:2000821 | regulation of grooming behavior(GO:2000821) |
| 0.0 | 0.0 | GO:0030718 | germ-line stem cell population maintenance(GO:0030718) |
Gene overrepresentation in cellular component category:
| Log-likelihood per target | Total log-likelihood | Term | Description |
|---|---|---|---|
| 0.2 | 1.2 | GO:0071595 | Nem1-Spo7 phosphatase complex(GO:0071595) |
| 0.1 | 0.6 | GO:0031436 | BRCA1-BARD1 complex(GO:0031436) |
| 0.1 | 0.4 | GO:0000799 | nuclear condensin complex(GO:0000799) |
| 0.1 | 0.8 | GO:0098560 | cytoplasmic side of late endosome membrane(GO:0098560) |
| 0.1 | 0.3 | GO:0070685 | macropinocytic cup(GO:0070685) |
| 0.1 | 0.4 | GO:0044393 | microspike(GO:0044393) |
| 0.1 | 0.3 | GO:0033186 | CAF-1 complex(GO:0033186) |
| 0.1 | 0.5 | GO:0043527 | tRNA methyltransferase complex(GO:0043527) |
| 0.1 | 0.8 | GO:0045252 | oxoglutarate dehydrogenase complex(GO:0045252) |
| 0.1 | 0.5 | GO:0097129 | cyclin D2-CDK4 complex(GO:0097129) |
| 0.1 | 0.3 | GO:0005846 | nuclear cap binding complex(GO:0005846) |
| 0.1 | 0.2 | GO:0043511 | inhibin complex(GO:0043511) inhibin A complex(GO:0043512) |
| 0.1 | 0.2 | GO:1990622 | CHOP-ATF3 complex(GO:1990622) |
| 0.1 | 0.2 | GO:0031085 | BLOC-3 complex(GO:0031085) |
| 0.1 | 0.2 | GO:1990423 | RZZ complex(GO:1990423) |
| 0.0 | 1.1 | GO:0033162 | melanosome membrane(GO:0033162) chitosome(GO:0045009) |
| 0.0 | 0.2 | GO:0009328 | phenylalanine-tRNA ligase complex(GO:0009328) |
| 0.0 | 0.1 | GO:0033593 | BRCA2-MAGE-D1 complex(GO:0033593) |
| 0.0 | 0.1 | GO:0097135 | X chromosome(GO:0000805) cyclin E2-CDK2 complex(GO:0097135) |
| 0.0 | 0.5 | GO:0033588 | Elongator holoenzyme complex(GO:0033588) |
| 0.0 | 0.1 | GO:0034272 | phosphatidylinositol 3-kinase complex, class III, type I(GO:0034271) phosphatidylinositol 3-kinase complex, class III, type II(GO:0034272) |
| 0.0 | 0.3 | GO:0098536 | deuterosome(GO:0098536) |
| 0.0 | 0.3 | GO:0032021 | NELF complex(GO:0032021) |
| 0.0 | 0.4 | GO:0005828 | kinetochore microtubule(GO:0005828) |
| 0.0 | 0.2 | GO:1990796 | photoreceptor cell terminal bouton(GO:1990796) |
| 0.0 | 1.3 | GO:0071437 | invadopodium(GO:0071437) |
| 0.0 | 0.2 | GO:0034666 | integrin alpha2-beta1 complex(GO:0034666) |
| 0.0 | 0.1 | GO:0098559 | cytoplasmic side of early endosome membrane(GO:0098559) |
| 0.0 | 0.3 | GO:1990726 | Lsm1-7-Pat1 complex(GO:1990726) |
| 0.0 | 0.3 | GO:0001939 | female pronucleus(GO:0001939) male pronucleus(GO:0001940) |
| 0.0 | 0.4 | GO:0031298 | replication fork protection complex(GO:0031298) |
| 0.0 | 0.4 | GO:0070187 | telosome(GO:0070187) |
| 0.0 | 0.1 | GO:0030289 | protein phosphatase 4 complex(GO:0030289) |
| 0.0 | 0.9 | GO:0044232 | organelle membrane contact site(GO:0044232) |
| 0.0 | 0.2 | GO:0097149 | centralspindlin complex(GO:0097149) |
| 0.0 | 0.2 | GO:0070381 | endosome to plasma membrane transport vesicle(GO:0070381) |
| 0.0 | 0.1 | GO:0035032 | phosphatidylinositol 3-kinase complex, class III(GO:0035032) |
| 0.0 | 0.2 | GO:0097451 | glial limiting end-foot(GO:0097451) |
| 0.0 | 0.1 | GO:0042613 | MHC class II protein complex(GO:0042613) |
| 0.0 | 0.5 | GO:0030130 | clathrin coat of trans-Golgi network vesicle(GO:0030130) |
| 0.0 | 0.1 | GO:0097196 | Shu complex(GO:0097196) |
| 0.0 | 0.8 | GO:0031143 | pseudopodium(GO:0031143) |
| 0.0 | 0.1 | GO:0048476 | Holliday junction resolvase complex(GO:0048476) |
| 0.0 | 0.1 | GO:0038039 | G-protein coupled receptor heterodimeric complex(GO:0038039) |
| 0.0 | 0.1 | GO:0032798 | Swi5-Sfr1 complex(GO:0032798) |
| 0.0 | 0.1 | GO:0097125 | cyclin B1-CDK1 complex(GO:0097125) |
| 0.0 | 0.2 | GO:0031415 | NatA complex(GO:0031415) |
| 0.0 | 0.2 | GO:0035867 | alphav-beta3 integrin-IGF-1-IGF1R complex(GO:0035867) |
| 0.0 | 0.1 | GO:1990075 | periciliary membrane compartment(GO:1990075) |
| 0.0 | 0.2 | GO:0072487 | MSL complex(GO:0072487) |
| 0.0 | 0.1 | GO:0032807 | DNA ligase IV complex(GO:0032807) |
| 0.0 | 1.2 | GO:0005669 | transcription factor TFIID complex(GO:0005669) |
| 0.0 | 1.7 | GO:0012507 | ER to Golgi transport vesicle membrane(GO:0012507) |
| 0.0 | 0.2 | GO:0046581 | intercellular canaliculus(GO:0046581) |
| 0.0 | 0.3 | GO:0034709 | methylosome(GO:0034709) |
| 0.0 | 0.1 | GO:0008537 | proteasome activator complex(GO:0008537) |
| 0.0 | 0.1 | GO:0005663 | DNA replication factor C complex(GO:0005663) |
| 0.0 | 0.2 | GO:0005955 | calcineurin complex(GO:0005955) |
| 0.0 | 0.6 | GO:0005732 | small nucleolar ribonucleoprotein complex(GO:0005732) |
| 0.0 | 0.1 | GO:0005873 | plus-end kinesin complex(GO:0005873) |
| 0.0 | 0.0 | GO:0005683 | U7 snRNP(GO:0005683) |
| 0.0 | 0.2 | GO:0061574 | ASAP complex(GO:0061574) |
| 0.0 | 0.1 | GO:0005749 | mitochondrial respiratory chain complex II, succinate dehydrogenase complex (ubiquinone)(GO:0005749) succinate dehydrogenase complex (ubiquinone)(GO:0045257) respiratory chain complex II(GO:0045273) succinate dehydrogenase complex(GO:0045281) fumarate reductase complex(GO:0045283) |
| 0.0 | 0.0 | GO:0043159 | acrosomal matrix(GO:0043159) |
| 0.0 | 0.1 | GO:0089717 | spanning component of plasma membrane(GO:0044214) spanning component of membrane(GO:0089717) |
| 0.0 | 1.3 | GO:0005876 | spindle microtubule(GO:0005876) |
| 0.0 | 0.1 | GO:1990913 | sperm head plasma membrane(GO:1990913) ooplasm(GO:1990917) |
| 0.0 | 0.1 | GO:1990879 | CST complex(GO:1990879) |
| 0.0 | 0.1 | GO:1990032 | parallel fiber(GO:1990032) |
| 0.0 | 0.1 | GO:0000408 | EKC/KEOPS complex(GO:0000408) |
| 0.0 | 0.1 | GO:0060200 | clathrin-sculpted acetylcholine transport vesicle(GO:0060200) clathrin-sculpted acetylcholine transport vesicle membrane(GO:0060201) |
| 0.0 | 0.1 | GO:0070557 | PCNA-p21 complex(GO:0070557) |
| 0.0 | 0.8 | GO:0016592 | mediator complex(GO:0016592) |
| 0.0 | 0.5 | GO:0035098 | ESC/E(Z) complex(GO:0035098) |
| 0.0 | 0.9 | GO:0042645 | nucleoid(GO:0009295) mitochondrial nucleoid(GO:0042645) |
| 0.0 | 0.1 | GO:0097524 | sperm plasma membrane(GO:0097524) |
| 0.0 | 0.3 | GO:0034045 | pre-autophagosomal structure membrane(GO:0034045) |
| 0.0 | 0.5 | GO:0005719 | nuclear euchromatin(GO:0005719) |
| 0.0 | 1.0 | GO:0005762 | organellar large ribosomal subunit(GO:0000315) mitochondrial large ribosomal subunit(GO:0005762) |
| 0.0 | 0.1 | GO:0035692 | macrophage migration inhibitory factor receptor complex(GO:0035692) |
| 0.0 | 0.5 | GO:0030687 | preribosome, large subunit precursor(GO:0030687) |
| 0.0 | 0.6 | GO:0000159 | protein phosphatase type 2A complex(GO:0000159) |
| 0.0 | 0.1 | GO:0042788 | polysomal ribosome(GO:0042788) |
| 0.0 | 0.1 | GO:1990452 | Parkin-FBXW7-Cul1 ubiquitin ligase complex(GO:1990452) |
| 0.0 | 0.2 | GO:0005750 | mitochondrial respiratory chain complex III(GO:0005750) respiratory chain complex III(GO:0045275) |
| 0.0 | 0.2 | GO:0016013 | syntrophin complex(GO:0016013) |
| 0.0 | 0.1 | GO:0042720 | mitochondrial inner membrane peptidase complex(GO:0042720) |
| 0.0 | 0.1 | GO:0044614 | nuclear pore cytoplasmic filaments(GO:0044614) |
| 0.0 | 0.1 | GO:1990393 | 3M complex(GO:1990393) |
| 0.0 | 0.0 | GO:0031084 | BLOC-2 complex(GO:0031084) |
| 0.0 | 0.3 | GO:0014731 | spectrin-associated cytoskeleton(GO:0014731) |
| 0.0 | 0.0 | GO:0008275 | gamma-tubulin small complex(GO:0008275) |
| 0.0 | 0.1 | GO:0042382 | paraspeckles(GO:0042382) |
| 0.0 | 0.2 | GO:0048188 | Set1C/COMPASS complex(GO:0048188) |
| 0.0 | 0.4 | GO:0005763 | organellar small ribosomal subunit(GO:0000314) mitochondrial small ribosomal subunit(GO:0005763) |
| 0.0 | 0.0 | GO:0033257 | Bcl3/NF-kappaB2 complex(GO:0033257) |
| 0.0 | 0.1 | GO:0031466 | Cul5-RING ubiquitin ligase complex(GO:0031466) |
| 0.0 | 0.2 | GO:0033178 | proton-transporting two-sector ATPase complex, catalytic domain(GO:0033178) |
| 0.0 | 0.2 | GO:0001673 | male germ cell nucleus(GO:0001673) |
| 0.0 | 0.1 | GO:0035749 | myelin sheath adaxonal region(GO:0035749) |
| 0.0 | 0.1 | GO:0042025 | host cell nucleus(GO:0042025) host cell nuclear part(GO:0044094) |
| 0.0 | 0.2 | GO:0000813 | ESCRT I complex(GO:0000813) |
| 0.0 | 0.1 | GO:0033269 | internode region of axon(GO:0033269) |
| 0.0 | 0.2 | GO:0043240 | Fanconi anaemia nuclear complex(GO:0043240) |
| 0.0 | 0.1 | GO:0072559 | NLRP3 inflammasome complex(GO:0072559) |
| 0.0 | 0.1 | GO:0008278 | cohesin complex(GO:0008278) |
| 0.0 | 0.2 | GO:0061700 | GATOR2 complex(GO:0061700) |
| 0.0 | 0.1 | GO:0002199 | zona pellucida receptor complex(GO:0002199) |
| 0.0 | 0.0 | GO:0045240 | dihydrolipoyl dehydrogenase complex(GO:0045240) |
| 0.0 | 0.1 | GO:0072669 | tRNA-splicing ligase complex(GO:0072669) |
Gene overrepresentation in molecular function category:
| Log-likelihood per target | Total log-likelihood | Term | Description |
|---|---|---|---|
| 0.3 | 0.9 | GO:0034602 | oxoglutarate dehydrogenase (NAD+) activity(GO:0034602) |
| 0.2 | 1.2 | GO:0005298 | proline:sodium symporter activity(GO:0005298) |
| 0.2 | 0.8 | GO:0046899 | nucleoside triphosphate adenylate kinase activity(GO:0046899) |
| 0.2 | 1.1 | GO:0004305 | ethanolamine kinase activity(GO:0004305) |
| 0.1 | 0.4 | GO:0004605 | phosphatidate cytidylyltransferase activity(GO:0004605) |
| 0.1 | 0.4 | GO:0035575 | histone demethylase activity (H4-K20 specific)(GO:0035575) |
| 0.1 | 0.4 | GO:0000035 | acyl binding(GO:0000035) |
| 0.1 | 0.4 | GO:0016979 | lipoate-protein ligase activity(GO:0016979) |
| 0.1 | 0.4 | GO:0033878 | hormone-sensitive lipase activity(GO:0033878) |
| 0.1 | 0.3 | GO:0070361 | mitochondrial light strand promoter anti-sense binding(GO:0070361) mitochondrial heavy strand promoter anti-sense binding(GO:0070362) mitochondrial heavy strand promoter sense binding(GO:0070364) |
| 0.1 | 1.7 | GO:0016813 | hydrolase activity, acting on carbon-nitrogen (but not peptide) bonds, in linear amidines(GO:0016813) |
| 0.1 | 0.3 | GO:0004418 | hydroxymethylbilane synthase activity(GO:0004418) |
| 0.1 | 0.5 | GO:0047280 | nicotinamide phosphoribosyltransferase activity(GO:0047280) |
| 0.1 | 0.4 | GO:0034041 | sterol-transporting ATPase activity(GO:0034041) |
| 0.1 | 0.7 | GO:0008467 | [heparan sulfate]-glucosamine 3-sulfotransferase 1 activity(GO:0008467) |
| 0.1 | 0.6 | GO:0016314 | phosphatidylinositol-3,4,5-trisphosphate 3-phosphatase activity(GO:0016314) |
| 0.1 | 0.4 | GO:0047676 | arachidonate-CoA ligase activity(GO:0047676) |
| 0.1 | 0.3 | GO:0008859 | exoribonuclease II activity(GO:0008859) |
| 0.1 | 0.7 | GO:0017150 | tRNA dihydrouridine synthase activity(GO:0017150) |
| 0.1 | 0.5 | GO:0009019 | tRNA (guanine-N1-)-methyltransferase activity(GO:0009019) |
| 0.1 | 0.4 | GO:0010521 | telomerase inhibitor activity(GO:0010521) |
| 0.1 | 1.1 | GO:0001075 | transcription factor activity, RNA polymerase II core promoter sequence-specific binding involved in preinitiation complex assembly(GO:0001075) |
| 0.1 | 0.2 | GO:0045145 | single-stranded DNA 5'-3' exodeoxyribonuclease activity(GO:0045145) |
| 0.1 | 0.2 | GO:0035650 | AP-1 adaptor complex binding(GO:0035650) |
| 0.1 | 1.2 | GO:0036374 | glutathione hydrolase activity(GO:0036374) |
| 0.1 | 0.2 | GO:0004912 | interleukin-3 receptor activity(GO:0004912) interleukin-5 receptor activity(GO:0004914) |
| 0.1 | 0.2 | GO:0052858 | peptidyl-lysine N-acetyltransferase activity, acting on acetyl phosphate as donor(GO:0052858) |
| 0.1 | 0.4 | GO:0004045 | aminoacyl-tRNA hydrolase activity(GO:0004045) |
| 0.1 | 0.3 | GO:0015018 | galactosylgalactosylxylosylprotein 3-beta-glucuronosyltransferase activity(GO:0015018) |
| 0.1 | 0.3 | GO:0016434 | rRNA (cytosine) methyltransferase activity(GO:0016434) |
| 0.1 | 0.2 | GO:0004613 | phosphoenolpyruvate carboxykinase activity(GO:0004611) phosphoenolpyruvate carboxykinase (GTP) activity(GO:0004613) |
| 0.1 | 0.2 | GO:0034353 | RNA pyrophosphohydrolase activity(GO:0034353) |
| 0.1 | 0.2 | GO:0070139 | ubiquitin-like protein-specific endopeptidase activity(GO:0070137) SUMO-specific endopeptidase activity(GO:0070139) |
| 0.1 | 0.2 | GO:0008900 | hydrogen:potassium-exchanging ATPase activity(GO:0008900) |
| 0.1 | 0.2 | GO:0004937 | alpha1-adrenergic receptor activity(GO:0004937) |
| 0.1 | 0.2 | GO:0004531 | deoxyribonuclease II activity(GO:0004531) |
| 0.1 | 0.3 | GO:0051120 | hepoxilin A3 synthase activity(GO:0051120) |
| 0.1 | 0.4 | GO:0004445 | inositol-polyphosphate 5-phosphatase activity(GO:0004445) |
| 0.1 | 0.2 | GO:0050510 | N-acetylgalactosaminyl-proteoglycan 3-beta-glucuronosyltransferase activity(GO:0050510) |
| 0.0 | 0.2 | GO:0015265 | urea channel activity(GO:0015265) |
| 0.0 | 0.1 | GO:0004939 | beta-adrenergic receptor activity(GO:0004939) |
| 0.0 | 0.1 | GO:0004421 | hydroxymethylglutaryl-CoA synthase activity(GO:0004421) |
| 0.0 | 0.9 | GO:0042809 | vitamin D receptor binding(GO:0042809) |
| 0.0 | 0.1 | GO:0098808 | mRNA cap binding(GO:0098808) |
| 0.0 | 0.5 | GO:0070087 | chromo shadow domain binding(GO:0070087) |
| 0.0 | 1.3 | GO:0031489 | myosin V binding(GO:0031489) |
| 0.0 | 0.4 | GO:0008865 | glucokinase activity(GO:0004340) hexokinase activity(GO:0004396) fructokinase activity(GO:0008865) mannokinase activity(GO:0019158) |
| 0.0 | 0.1 | GO:0004711 | ribosomal protein S6 kinase activity(GO:0004711) |
| 0.0 | 0.2 | GO:0004826 | phenylalanine-tRNA ligase activity(GO:0004826) |
| 0.0 | 0.1 | GO:0033300 | dehydroascorbic acid transporter activity(GO:0033300) |
| 0.0 | 0.4 | GO:0016423 | tRNA (guanine) methyltransferase activity(GO:0016423) |
| 0.0 | 0.2 | GO:0003945 | N-acetyllactosamine synthase activity(GO:0003945) |
| 0.0 | 0.4 | GO:0001042 | RNA polymerase I core binding(GO:0001042) |
| 0.0 | 0.2 | GO:0070546 | cysteine-S-conjugate beta-lyase activity(GO:0047804) L-phenylalanine aminotransferase activity(GO:0070546) |
| 0.0 | 0.1 | GO:0044715 | 8-oxo-dGDP phosphatase activity(GO:0044715) |
| 0.0 | 0.1 | GO:0070039 | rRNA (guanosine-2'-O-)-methyltransferase activity(GO:0070039) |
| 0.0 | 0.1 | GO:0008745 | N-acetylmuramoyl-L-alanine amidase activity(GO:0008745) |
| 0.0 | 0.1 | GO:0004874 | aryl hydrocarbon receptor activity(GO:0004874) |
| 0.0 | 0.1 | GO:0045131 | pre-mRNA branch point binding(GO:0045131) |
| 0.0 | 0.5 | GO:0032050 | clathrin heavy chain binding(GO:0032050) |
| 0.0 | 0.9 | GO:0003906 | DNA-(apurinic or apyrimidinic site) lyase activity(GO:0003906) |
| 0.0 | 0.8 | GO:0043560 | insulin receptor substrate binding(GO:0043560) |
| 0.0 | 0.1 | GO:0005483 | soluble NSF attachment protein activity(GO:0005483) |
| 0.0 | 0.2 | GO:0043208 | glycosphingolipid binding(GO:0043208) |
| 0.0 | 0.4 | GO:0000340 | RNA 7-methylguanosine cap binding(GO:0000340) |
| 0.0 | 0.2 | GO:0004793 | glycine hydroxymethyltransferase activity(GO:0004372) threonine aldolase activity(GO:0004793) L-allo-threonine aldolase activity(GO:0008732) |
| 0.0 | 0.2 | GO:0044020 | histone methyltransferase activity (H4-R3 specific)(GO:0044020) |
| 0.0 | 0.2 | GO:0016230 | sphingomyelin phosphodiesterase activator activity(GO:0016230) |
| 0.0 | 0.1 | GO:0001641 | group II metabotropic glutamate receptor activity(GO:0001641) |
| 0.0 | 0.2 | GO:0004447 | iodide peroxidase activity(GO:0004447) |
| 0.0 | 0.5 | GO:0004062 | aryl sulfotransferase activity(GO:0004062) |
| 0.0 | 0.5 | GO:0003688 | DNA replication origin binding(GO:0003688) |
| 0.0 | 0.2 | GO:0044547 | DNA topoisomerase binding(GO:0044547) |
| 0.0 | 0.2 | GO:0019238 | cyclohydrolase activity(GO:0019238) |
| 0.0 | 0.3 | GO:0019534 | toxin transporter activity(GO:0019534) |
| 0.0 | 0.3 | GO:0043995 | histone acetyltransferase activity (H4-K5 specific)(GO:0043995) histone acetyltransferase activity (H4-K8 specific)(GO:0043996) histone acetyltransferase activity (H4-K16 specific)(GO:0046972) |
| 0.0 | 0.1 | GO:0008336 | gamma-butyrobetaine dioxygenase activity(GO:0008336) |
| 0.0 | 1.6 | GO:0005154 | epidermal growth factor receptor binding(GO:0005154) |
| 0.0 | 0.1 | GO:0034512 | box C/D snoRNA binding(GO:0034512) |
| 0.0 | 0.3 | GO:0004723 | calcium-dependent protein serine/threonine phosphatase activity(GO:0004723) |
| 0.0 | 0.1 | GO:0001632 | leukotriene B4 receptor activity(GO:0001632) |
| 0.0 | 0.2 | GO:0043023 | ribosomal large subunit binding(GO:0043023) |
| 0.0 | 0.2 | GO:0004111 | creatine kinase activity(GO:0004111) |
| 0.0 | 0.1 | GO:0004522 | ribonuclease A activity(GO:0004522) |
| 0.0 | 0.1 | GO:0019166 | trans-2-enoyl-CoA reductase (NADPH) activity(GO:0019166) |
| 0.0 | 0.1 | GO:0003978 | UDP-N-acetylglucosamine 4-epimerase activity(GO:0003974) UDP-glucose 4-epimerase activity(GO:0003978) |
| 0.0 | 0.2 | GO:0016714 | oxidoreductase activity, acting on paired donors, with incorporation or reduction of molecular oxygen, reduced pteridine as one donor, and incorporation of one atom of oxygen(GO:0016714) |
| 0.0 | 0.6 | GO:0072349 | modified amino acid transmembrane transporter activity(GO:0072349) |
| 0.0 | 0.3 | GO:0097371 | MDM2/MDM4 family protein binding(GO:0097371) |
| 0.0 | 0.2 | GO:0001225 | RNA polymerase II transcription coactivator binding(GO:0001225) |
| 0.0 | 0.1 | GO:0042030 | ATPase inhibitor activity(GO:0042030) |
| 0.0 | 0.1 | GO:0097677 | STAT family protein binding(GO:0097677) |
| 0.0 | 2.6 | GO:0004497 | monooxygenase activity(GO:0004497) |
| 0.0 | 0.1 | GO:0008481 | sphinganine kinase activity(GO:0008481) D-erythro-sphingosine kinase activity(GO:0017050) |
| 0.0 | 0.1 | GO:0004965 | G-protein coupled GABA receptor activity(GO:0004965) |
| 0.0 | 0.1 | GO:0004167 | dopachrome isomerase activity(GO:0004167) |
| 0.0 | 0.1 | GO:0010484 | H3 histone acetyltransferase activity(GO:0010484) |
| 0.0 | 0.2 | GO:0034711 | inhibin binding(GO:0034711) |
| 0.0 | 0.1 | GO:0044323 | retinoic acid-responsive element binding(GO:0044323) |
| 0.0 | 0.3 | GO:0001730 | 2'-5'-oligoadenylate synthetase activity(GO:0001730) |
| 0.0 | 0.1 | GO:0016426 | tRNA (adenine) methyltransferase activity(GO:0016426) |
| 0.0 | 0.1 | GO:0035515 | oxidative RNA demethylase activity(GO:0035515) |
| 0.0 | 0.1 | GO:0004720 | protein-lysine 6-oxidase activity(GO:0004720) |
| 0.0 | 0.2 | GO:0019237 | centromeric DNA binding(GO:0019237) |
| 0.0 | 0.1 | GO:0004013 | adenosylhomocysteinase activity(GO:0004013) trialkylsulfonium hydrolase activity(GO:0016802) |
| 0.0 | 0.4 | GO:0005432 | calcium:sodium antiporter activity(GO:0005432) |
| 0.0 | 0.1 | GO:0003938 | IMP dehydrogenase activity(GO:0003938) |
| 0.0 | 0.1 | GO:0038047 | beta-endorphin receptor activity(GO:0004979) morphine receptor activity(GO:0038047) |
| 0.0 | 0.9 | GO:0008157 | protein phosphatase 1 binding(GO:0008157) |
| 0.0 | 0.1 | GO:0000104 | succinate dehydrogenase activity(GO:0000104) |
| 0.0 | 0.2 | GO:0030280 | structural constituent of epidermis(GO:0030280) |
| 0.0 | 0.1 | GO:0004839 | ubiquitin activating enzyme activity(GO:0004839) |
| 0.0 | 0.2 | GO:0043008 | ATP-dependent protein binding(GO:0043008) |
| 0.0 | 0.5 | GO:0002162 | dystroglycan binding(GO:0002162) |
| 0.0 | 0.2 | GO:0004705 | JUN kinase activity(GO:0004705) SAP kinase activity(GO:0016909) |
| 0.0 | 0.1 | GO:0042289 | MHC class II protein binding(GO:0042289) |
| 0.0 | 0.1 | GO:0033906 | hyaluronoglucuronidase activity(GO:0033906) |
| 0.0 | 0.0 | GO:0019777 | Atg12 transferase activity(GO:0019777) |
| 0.0 | 0.3 | GO:0003796 | lysozyme activity(GO:0003796) |
| 0.0 | 0.8 | GO:0030332 | cyclin binding(GO:0030332) |
| 0.0 | 0.1 | GO:0033699 | DNA 5'-adenosine monophosphate hydrolase activity(GO:0033699) |
| 0.0 | 0.2 | GO:0086006 | voltage-gated sodium channel activity involved in cardiac muscle cell action potential(GO:0086006) |
| 0.0 | 0.1 | GO:0050501 | hyaluronan synthase activity(GO:0050501) |
| 0.0 | 0.1 | GO:0042978 | ornithine decarboxylase activator activity(GO:0042978) |
| 0.0 | 0.4 | GO:1990381 | ubiquitin-specific protease binding(GO:1990381) |
| 0.0 | 0.1 | GO:0043891 | glyceraldehyde-3-phosphate dehydrogenase (NAD+) (phosphorylating) activity(GO:0004365) glyceraldehyde-3-phosphate dehydrogenase (NAD(P)+) (phosphorylating) activity(GO:0043891) |
| 0.0 | 1.6 | GO:0004722 | protein serine/threonine phosphatase activity(GO:0004722) |
| 0.0 | 0.3 | GO:0017017 | MAP kinase tyrosine/serine/threonine phosphatase activity(GO:0017017) |
| 0.0 | 0.1 | GO:0035174 | histone serine kinase activity(GO:0035174) |
| 0.0 | 0.1 | GO:0008310 | single-stranded DNA 3'-5' exodeoxyribonuclease activity(GO:0008310) |
| 0.0 | 0.1 | GO:0003835 | beta-galactoside alpha-2,6-sialyltransferase activity(GO:0003835) |
| 0.0 | 0.1 | GO:0004775 | succinate-CoA ligase (ADP-forming) activity(GO:0004775) |
| 0.0 | 0.5 | GO:0031210 | phosphatidylcholine binding(GO:0031210) |
| 0.0 | 0.1 | GO:0010853 | cyclase activator activity(GO:0010853) guanylate cyclase activator activity(GO:0030250) |
| 0.0 | 0.1 | GO:0019531 | oxalate transmembrane transporter activity(GO:0019531) |
| 0.0 | 0.1 | GO:0008821 | crossover junction endodeoxyribonuclease activity(GO:0008821) |
| 0.0 | 0.1 | GO:0008553 | hydrogen-exporting ATPase activity, phosphorylative mechanism(GO:0008553) |
| 0.0 | 0.1 | GO:0035662 | Toll-like receptor 4 binding(GO:0035662) |
| 0.0 | 0.5 | GO:0070182 | DNA polymerase binding(GO:0070182) |
| 0.0 | 0.1 | GO:0019776 | Atg8 ligase activity(GO:0019776) |
| 0.0 | 0.3 | GO:0034452 | dynactin binding(GO:0034452) |
| 0.0 | 0.2 | GO:0030306 | ADP-ribosylation factor binding(GO:0030306) |
| 0.0 | 0.1 | GO:0033170 | DNA clamp loader activity(GO:0003689) protein-DNA loading ATPase activity(GO:0033170) |
| 0.0 | 0.1 | GO:0061676 | importin-alpha family protein binding(GO:0061676) |
| 0.0 | 0.2 | GO:0031702 | type 1 angiotensin receptor binding(GO:0031702) |
| 0.0 | 0.0 | GO:0071209 | U7 snRNA binding(GO:0071209) |
| 0.0 | 0.1 | GO:0016174 | NAD(P)H oxidase activity(GO:0016174) |
| 0.0 | 0.3 | GO:0017049 | GTP-Rho binding(GO:0017049) |
| 0.0 | 0.0 | GO:0000253 | 3-keto sterol reductase activity(GO:0000253) |
| 0.0 | 0.5 | GO:0005540 | hyaluronic acid binding(GO:0005540) |
| 0.0 | 0.1 | GO:0003810 | protein-glutamine gamma-glutamyltransferase activity(GO:0003810) |
| 0.0 | 0.6 | GO:0005159 | insulin-like growth factor receptor binding(GO:0005159) |
| 0.0 | 0.2 | GO:0015501 | glutamate:sodium symporter activity(GO:0015501) |
| 0.0 | 0.1 | GO:0042799 | histone methyltransferase activity (H4-K20 specific)(GO:0042799) |
| 0.0 | 0.2 | GO:0050544 | arachidonic acid binding(GO:0050544) |
| 0.0 | 0.2 | GO:0035256 | G-protein coupled glutamate receptor binding(GO:0035256) |
| 0.0 | 0.1 | GO:0030160 | GKAP/Homer scaffold activity(GO:0030160) |
| 0.0 | 0.2 | GO:0004887 | thyroid hormone receptor activity(GO:0004887) |
| 0.0 | 0.2 | GO:0009982 | pseudouridine synthase activity(GO:0009982) |
| 0.0 | 0.5 | GO:1990841 | promoter-specific chromatin binding(GO:1990841) |
| 0.0 | 0.0 | GO:0004483 | mRNA (nucleoside-2'-O-)-methyltransferase activity(GO:0004483) |
| 0.0 | 0.2 | GO:0017070 | U6 snRNA binding(GO:0017070) |
| 0.0 | 0.5 | GO:0004198 | calcium-dependent cysteine-type endopeptidase activity(GO:0004198) |
| 0.0 | 0.1 | GO:0016679 | ubiquinol-cytochrome-c reductase activity(GO:0008121) oxidoreductase activity, acting on diphenols and related substances as donors(GO:0016679) oxidoreductase activity, acting on diphenols and related substances as donors, cytochrome as acceptor(GO:0016681) |
| 0.0 | 0.1 | GO:0032393 | MHC class I receptor activity(GO:0032393) |
| 0.0 | 0.0 | GO:0036055 | protein-malonyllysine demalonylase activity(GO:0036054) protein-succinyllysine desuccinylase activity(GO:0036055) protein-glutaryllysine deglutarylase activity(GO:0061697) |
| 0.0 | 0.0 | GO:0016300 | tRNA (uracil) methyltransferase activity(GO:0016300) |
| 0.0 | 0.2 | GO:0005041 | low-density lipoprotein receptor activity(GO:0005041) |
| 0.0 | 1.1 | GO:0048365 | Rac GTPase binding(GO:0048365) |
| 0.0 | 0.2 | GO:0043024 | ribosomal small subunit binding(GO:0043024) |
| 0.0 | 0.2 | GO:0016783 | sulfurtransferase activity(GO:0016783) |
| 0.0 | 0.1 | GO:0050610 | glutathione dehydrogenase (ascorbate) activity(GO:0045174) methylarsonate reductase activity(GO:0050610) |
| 0.0 | 0.0 | GO:0008267 | poly-glutamine tract binding(GO:0008267) |
| 0.0 | 0.2 | GO:0035925 | mRNA 3'-UTR AU-rich region binding(GO:0035925) |
| 0.0 | 0.1 | GO:0000179 | rRNA (adenine-N6,N6-)-dimethyltransferase activity(GO:0000179) |
| 0.0 | 0.0 | GO:0002094 | polyprenyltransferase activity(GO:0002094) |
| 0.0 | 0.0 | GO:0017159 | pantetheine hydrolase activity(GO:0017159) |
| 0.0 | 0.1 | GO:0016015 | morphogen activity(GO:0016015) |
| 0.0 | 0.5 | GO:0017048 | Rho GTPase binding(GO:0017048) |
| 0.0 | 0.6 | GO:0061631 | ubiquitin conjugating enzyme activity(GO:0061631) |
| 0.0 | 0.1 | GO:0038036 | sphingosine-1-phosphate receptor activity(GO:0038036) |
| 0.0 | 0.0 | GO:0046933 | proton-transporting ATP synthase activity, rotational mechanism(GO:0046933) |
| 0.0 | 0.1 | GO:0004931 | extracellular ATP-gated cation channel activity(GO:0004931) ATP-gated ion channel activity(GO:0035381) |
| 0.0 | 0.1 | GO:0004652 | polynucleotide adenylyltransferase activity(GO:0004652) |
| 0.0 | 0.2 | GO:0086056 | voltage-gated calcium channel activity involved in AV node cell action potential(GO:0086056) |
Gene overrepresentation in curated gene sets: canonical pathways category:
| Log-likelihood per target | Total log-likelihood | Term | Description |
|---|---|---|---|
| 0.1 | 0.2 | ST TUMOR NECROSIS FACTOR PATHWAY | Tumor Necrosis Factor Pathway. |
| 0.0 | 1.2 | PID IL5 PATHWAY | IL5-mediated signaling events |
| 0.0 | 1.6 | PID ERBB NETWORK PATHWAY | ErbB receptor signaling network |
| 0.0 | 1.6 | PID EPHA2 FWD PATHWAY | EPHA2 forward signaling |
| 0.0 | 1.0 | ST INTERLEUKIN 4 PATHWAY | Interleukin 4 (IL-4) Pathway |
| 0.0 | 0.5 | SA REG CASCADE OF CYCLIN EXPR | Expression of cyclins regulates progression through the cell cycle by activating cyclin-dependent kinases. |
| 0.0 | 1.2 | PID ATM PATHWAY | ATM pathway |
| 0.0 | 0.2 | PID SYNDECAN 2 PATHWAY | Syndecan-2-mediated signaling events |
| 0.0 | 0.7 | ST PHOSPHOINOSITIDE 3 KINASE PATHWAY | PI3K Pathway |
| 0.0 | 0.9 | PID AURORA B PATHWAY | Aurora B signaling |
| 0.0 | 2.0 | PID MYC ACTIV PATHWAY | Validated targets of C-MYC transcriptional activation |
| 0.0 | 0.4 | PID ARF6 DOWNSTREAM PATHWAY | Arf6 downstream pathway |
| 0.0 | 0.7 | PID NEPHRIN NEPH1 PATHWAY | Nephrin/Neph1 signaling in the kidney podocyte |
| 0.0 | 0.3 | PID MYC PATHWAY | C-MYC pathway |
| 0.0 | 0.1 | ST JAK STAT PATHWAY | Jak-STAT Pathway |
| 0.0 | 0.3 | PID ARF 3PATHWAY | Arf1 pathway |
| 0.0 | 0.3 | PID IGF1 PATHWAY | IGF1 pathway |
| 0.0 | 0.6 | PID DELTA NP63 PATHWAY | Validated transcriptional targets of deltaNp63 isoforms |
| 0.0 | 0.9 | PID TELOMERASE PATHWAY | Regulation of Telomerase |
| 0.0 | 0.4 | PID PRL SIGNALING EVENTS PATHWAY | Signaling events mediated by PRL |
| 0.0 | 0.7 | PID HNF3B PATHWAY | FOXA2 and FOXA3 transcription factor networks |
| 0.0 | 0.1 | PID IL8 CXCR1 PATHWAY | IL8- and CXCR1-mediated signaling events |
Gene overrepresentation in curated gene sets: REACTOME pathways category:
| Log-likelihood per target | Total log-likelihood | Term | Description |
|---|---|---|---|
| 0.1 | 1.4 | REACTOME ACTIVATION OF RAC | Genes involved in Activation of Rac |
| 0.0 | 0.7 | REACTOME NEGATIVE REGULATION OF THE PI3K AKT NETWORK | Genes involved in Negative regulation of the PI3K/AKT network |
| 0.0 | 1.0 | REACTOME SYNTHESIS OF PE | Genes involved in Synthesis of PE |
| 0.0 | 0.9 | REACTOME BASE FREE SUGAR PHOSPHATE REMOVAL VIA THE SINGLE NUCLEOTIDE REPLACEMENT PATHWAY | Genes involved in Base-free sugar-phosphate removal via the single-nucleotide replacement pathway |
| 0.0 | 1.2 | REACTOME NA CL DEPENDENT NEUROTRANSMITTER TRANSPORTERS | Genes involved in Na+/Cl- dependent neurotransmitter transporters |
| 0.0 | 0.4 | REACTOME PACKAGING OF TELOMERE ENDS | Genes involved in Packaging Of Telomere Ends |
| 0.0 | 1.0 | REACTOME CITRIC ACID CYCLE TCA CYCLE | Genes involved in Citric acid cycle (TCA cycle) |
| 0.0 | 0.9 | REACTOME FANCONI ANEMIA PATHWAY | Genes involved in Fanconi Anemia pathway |
| 0.0 | 0.6 | REACTOME MRNA SPLICING MINOR PATHWAY | Genes involved in mRNA Splicing - Minor Pathway |
| 0.0 | 1.2 | REACTOME GLUTATHIONE CONJUGATION | Genes involved in Glutathione conjugation |
| 0.0 | 0.7 | REACTOME ACTIVATION OF BH3 ONLY PROTEINS | Genes involved in Activation of BH3-only proteins |
| 0.0 | 0.4 | REACTOME INHIBITION OF REPLICATION INITIATION OF DAMAGED DNA BY RB1 E2F1 | Genes involved in Inhibition of replication initiation of damaged DNA by RB1/E2F1 |
| 0.0 | 0.9 | REACTOME G0 AND EARLY G1 | Genes involved in G0 and Early G1 |
| 0.0 | 0.4 | REACTOME SLBP DEPENDENT PROCESSING OF REPLICATION DEPENDENT HISTONE PRE MRNAS | Genes involved in SLBP Dependent Processing of Replication-Dependent Histone Pre-mRNAs |
| 0.0 | 0.5 | REACTOME CYTOSOLIC SULFONATION OF SMALL MOLECULES | Genes involved in Cytosolic sulfonation of small molecules |
| 0.0 | 0.8 | REACTOME G1 PHASE | Genes involved in G1 Phase |
| 0.0 | 0.4 | REACTOME HDL MEDIATED LIPID TRANSPORT | Genes involved in HDL-mediated lipid transport |
| 0.0 | 1.0 | REACTOME RNA POL II TRANSCRIPTION PRE INITIATION AND PROMOTER OPENING | Genes involved in RNA Polymerase II Transcription Pre-Initiation And Promoter Opening |
| 0.0 | 0.2 | REACTOME MEMBRANE BINDING AND TARGETTING OF GAG PROTEINS | Genes involved in Membrane binding and targetting of GAG proteins |
| 0.0 | 0.7 | REACTOME HS GAG BIOSYNTHESIS | Genes involved in HS-GAG biosynthesis |
| 0.0 | 0.1 | REACTOME VIF MEDIATED DEGRADATION OF APOBEC3G | Genes involved in Vif-mediated degradation of APOBEC3G |
| 0.0 | 0.9 | REACTOME BASIGIN INTERACTIONS | Genes involved in Basigin interactions |
| 0.0 | 0.5 | REACTOME HYALURONAN METABOLISM | Genes involved in Hyaluronan metabolism |
| 0.0 | 0.2 | REACTOME PLATELET ADHESION TO EXPOSED COLLAGEN | Genes involved in Platelet Adhesion to exposed collagen |
| 0.0 | 0.6 | REACTOME KINESINS | Genes involved in Kinesins |
| 0.0 | 0.1 | REACTOME FORMATION OF THE HIV1 EARLY ELONGATION COMPLEX | Genes involved in Formation of the HIV-1 Early Elongation Complex |
| 0.0 | 0.6 | REACTOME SMAD2 SMAD3 SMAD4 HETEROTRIMER REGULATES TRANSCRIPTION | Genes involved in SMAD2/SMAD3:SMAD4 heterotrimer regulates transcription |
| 0.0 | 0.2 | REACTOME ABACAVIR TRANSPORT AND METABOLISM | Genes involved in Abacavir transport and metabolism |
| 0.0 | 0.4 | REACTOME TIE2 SIGNALING | Genes involved in Tie2 Signaling |
| 0.0 | 0.3 | REACTOME CLASS C 3 METABOTROPIC GLUTAMATE PHEROMONE RECEPTORS | Genes involved in Class C/3 (Metabotropic glutamate/pheromone receptors) |
| 0.0 | 0.1 | REACTOME POL SWITCHING | Genes involved in Polymerase switching |
| 0.0 | 0.3 | REACTOME N GLYCAN ANTENNAE ELONGATION | Genes involved in N-Glycan antennae elongation |
| 0.0 | 0.6 | REACTOME MRNA 3 END PROCESSING | Genes involved in mRNA 3'-end processing |
| 0.0 | 0.1 | REACTOME SIGNALING BY CONSTITUTIVELY ACTIVE EGFR | Genes involved in Signaling by constitutively active EGFR |
| 0.0 | 0.4 | REACTOME SYNTHESIS OF VERY LONG CHAIN FATTY ACYL COAS | Genes involved in Synthesis of very long-chain fatty acyl-CoAs |
| 0.0 | 0.4 | REACTOME ACTIVATION OF THE PRE REPLICATIVE COMPLEX | Genes involved in Activation of the pre-replicative complex |
| 0.0 | 0.6 | REACTOME GLUCOSE TRANSPORT | Genes involved in Glucose transport |
| 0.0 | 1.2 | REACTOME INTERFERON ALPHA BETA SIGNALING | Genes involved in Interferon alpha/beta signaling |
| 0.0 | 0.2 | REACTOME TETRAHYDROBIOPTERIN BH4 SYNTHESIS RECYCLING SALVAGE AND REGULATION | Genes involved in Tetrahydrobiopterin (BH4) synthesis, recycling, salvage and regulation |
| 0.0 | 0.3 | REACTOME PROTEOLYTIC CLEAVAGE OF SNARE COMPLEX PROTEINS | Genes involved in Proteolytic cleavage of SNARE complex proteins |
| 0.0 | 0.3 | REACTOME JNK C JUN KINASES PHOSPHORYLATION AND ACTIVATION MEDIATED BY ACTIVATED HUMAN TAK1 | Genes involved in JNK (c-Jun kinases) phosphorylation and activation mediated by activated human TAK1 |
| 0.0 | 0.3 | REACTOME HORMONE SENSITIVE LIPASE HSL MEDIATED TRIACYLGLYCEROL HYDROLYSIS | Genes involved in Hormone-sensitive lipase (HSL)-mediated triacylglycerol hydrolysis |