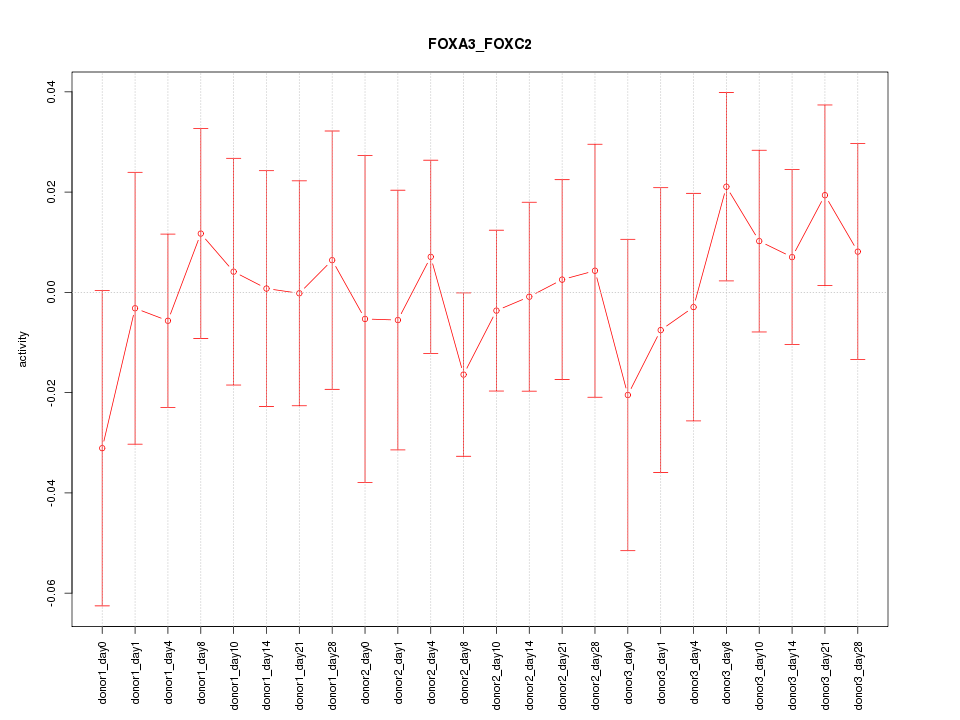
Motif ID: FOXA3_FOXC2
Z-value: 0.516


Transcription factors associated with FOXA3_FOXC2:
| Gene Symbol | Entrez ID | Gene Name |
|---|---|---|
| FOXA3 | ENSG00000170608.2 | FOXA3 |
| FOXC2 | ENSG00000176692.4 | FOXC2 |
Activity-expression correlation:
| Gene Symbol | Promoter | Pearson corr. coef. | P-value | Plot |
|---|---|---|---|---|
| FOXC2 | hg19_v2_chr16_+_86600857_86600921 | 0.12 | 5.8e-01 | Click! |
| FOXA3 | hg19_v2_chr19_+_46367518_46367567 | -0.02 | 9.3e-01 | Click! |


Top targets:
Gene overrepresentation in biological_process category:
| Log-likelihood per target | Total log-likelihood | Term | Description |
|---|---|---|---|
| 1.4 | 5.7 | GO:0042710 | biofilm formation(GO:0042710) single-species biofilm formation(GO:0044010) single-species biofilm formation in or on host organism(GO:0044407) regulation of single-species biofilm formation(GO:1900190) negative regulation of single-species biofilm formation(GO:1900191) regulation of single-species biofilm formation in or on host organism(GO:1900228) negative regulation of single-species biofilm formation in or on host organism(GO:1900229) |
| 0.3 | 0.8 | GO:1903568 | negative regulation of protein localization to cilium(GO:1903565) regulation of protein localization to ciliary membrane(GO:1903567) negative regulation of protein localization to ciliary membrane(GO:1903568) |
| 0.2 | 1.8 | GO:0034144 | negative regulation of toll-like receptor 4 signaling pathway(GO:0034144) |
| 0.2 | 2.3 | GO:0045329 | carnitine biosynthetic process(GO:0045329) |
| 0.2 | 1.9 | GO:0051388 | positive regulation of neurotrophin TRK receptor signaling pathway(GO:0051388) |
| 0.2 | 0.7 | GO:0072134 | hyaluranon cable assembly(GO:0036118) nephrogenic mesenchyme morphogenesis(GO:0072134) regulation of hyaluranon cable assembly(GO:1900104) positive regulation of hyaluranon cable assembly(GO:1900106) allantois development(GO:1905069) |
| 0.2 | 0.7 | GO:0006001 | fructose catabolic process(GO:0006001) fructose catabolic process to hydroxyacetone phosphate and glyceraldehyde-3-phosphate(GO:0061624) |
| 0.1 | 3.0 | GO:0003334 | keratinocyte development(GO:0003334) |
| 0.1 | 0.3 | GO:0034146 | toll-like receptor 5 signaling pathway(GO:0034146) |
| 0.1 | 0.6 | GO:0060005 | vestibular reflex(GO:0060005) |
| 0.1 | 0.7 | GO:0006848 | pyruvate transport(GO:0006848) pyruvate transmembrane transport(GO:1901475) |
| 0.1 | 0.3 | GO:0010903 | negative regulation of very-low-density lipoprotein particle remodeling(GO:0010903) |
| 0.1 | 0.4 | GO:0006651 | diacylglycerol biosynthetic process(GO:0006651) |
| 0.1 | 0.3 | GO:0002032 | desensitization of G-protein coupled receptor protein signaling pathway by arrestin(GO:0002032) |
| 0.1 | 0.5 | GO:0044245 | polysaccharide digestion(GO:0044245) |
| 0.1 | 0.2 | GO:0001970 | positive regulation of activation of membrane attack complex(GO:0001970) |
| 0.1 | 1.0 | GO:1902260 | negative regulation of delayed rectifier potassium channel activity(GO:1902260) |
| 0.1 | 0.1 | GO:0060738 | epithelial-mesenchymal signaling involved in prostate gland development(GO:0060738) |
| 0.1 | 0.2 | GO:0002541 | activation of plasma proteins involved in acute inflammatory response(GO:0002541) |
| 0.0 | 0.3 | GO:0060235 | lens induction in camera-type eye(GO:0060235) |
| 0.0 | 0.3 | GO:0019805 | quinolinate biosynthetic process(GO:0019805) 'de novo' NAD biosynthetic process(GO:0034627) |
| 0.0 | 0.1 | GO:0032764 | negative regulation of mast cell cytokine production(GO:0032764) |
| 0.0 | 1.3 | GO:0070233 | negative regulation of T cell apoptotic process(GO:0070233) |
| 0.0 | 0.2 | GO:0051958 | methotrexate transport(GO:0051958) |
| 0.0 | 0.4 | GO:0090204 | protein localization to nuclear pore(GO:0090204) |
| 0.0 | 0.6 | GO:0021527 | spinal cord association neuron differentiation(GO:0021527) |
| 0.0 | 0.2 | GO:0002803 | positive regulation of antimicrobial peptide production(GO:0002225) positive regulation of antimicrobial humoral response(GO:0002760) positive regulation of antibacterial peptide production(GO:0002803) |
| 0.0 | 0.1 | GO:0009956 | radial pattern formation(GO:0009956) |
| 0.0 | 0.3 | GO:0099566 | regulation of postsynaptic cytosolic calcium ion concentration(GO:0099566) |
| 0.0 | 0.1 | GO:0006391 | transcription initiation from mitochondrial promoter(GO:0006391) |
| 0.0 | 0.3 | GO:0061302 | smooth muscle cell-matrix adhesion(GO:0061302) |
| 0.0 | 0.1 | GO:0061030 | axon target recognition(GO:0007412) epithelial cell differentiation involved in mammary gland alveolus development(GO:0061030) |
| 0.0 | 0.3 | GO:0043152 | induction of bacterial agglutination(GO:0043152) |
| 0.0 | 0.1 | GO:0006210 | pyrimidine nucleobase catabolic process(GO:0006208) thymine catabolic process(GO:0006210) thymine metabolic process(GO:0019859) |
| 0.0 | 0.7 | GO:0072189 | ureter development(GO:0072189) |
| 0.0 | 0.1 | GO:0093001 | glycolysis from storage polysaccharide through glucose-1-phosphate(GO:0093001) |
| 0.0 | 0.2 | GO:0032488 | Cdc42 protein signal transduction(GO:0032488) |
| 0.0 | 0.1 | GO:0032747 | positive regulation of interleukin-23 production(GO:0032747) |
| 0.0 | 0.1 | GO:0052047 | interaction with other organism via secreted substance involved in symbiotic interaction(GO:0052047) |
| 0.0 | 0.8 | GO:0060972 | left/right pattern formation(GO:0060972) |
| 0.0 | 0.3 | GO:0035542 | regulation of SNARE complex assembly(GO:0035542) |
| 0.0 | 0.1 | GO:0090214 | spongiotrophoblast layer developmental growth(GO:0090214) |
| 0.0 | 0.1 | GO:0007185 | transmembrane receptor protein tyrosine phosphatase signaling pathway(GO:0007185) |
| 0.0 | 0.1 | GO:0021592 | midbrain-hindbrain boundary morphogenesis(GO:0021555) fourth ventricle development(GO:0021592) |
| 0.0 | 0.2 | GO:0034285 | response to sucrose(GO:0009744) response to disaccharide(GO:0034285) |
| 0.0 | 0.8 | GO:0021952 | central nervous system projection neuron axonogenesis(GO:0021952) |
| 0.0 | 0.1 | GO:0030950 | establishment or maintenance of actin cytoskeleton polarity(GO:0030950) |
| 0.0 | 0.2 | GO:0061088 | regulation of sequestering of zinc ion(GO:0061088) |
| 0.0 | 0.2 | GO:0042996 | regulation of Golgi to plasma membrane protein transport(GO:0042996) |
| 0.0 | 0.0 | GO:0044537 | regulation of circulating fibrinogen levels(GO:0044537) |
| 0.0 | 0.3 | GO:0007175 | negative regulation of epidermal growth factor-activated receptor activity(GO:0007175) |
| 0.0 | 0.2 | GO:0042048 | olfactory behavior(GO:0042048) |
| 0.0 | 0.3 | GO:0006450 | regulation of translational fidelity(GO:0006450) |
| 0.0 | 0.2 | GO:0048194 | Golgi vesicle budding(GO:0048194) |
| 0.0 | 0.1 | GO:0019747 | regulation of isoprenoid metabolic process(GO:0019747) |
| 0.0 | 0.1 | GO:0015722 | canalicular bile acid transport(GO:0015722) |
| 0.0 | 0.7 | GO:0030318 | melanocyte differentiation(GO:0030318) |
| 0.0 | 0.3 | GO:2000353 | positive regulation of endothelial cell apoptotic process(GO:2000353) |
| 0.0 | 0.3 | GO:0006488 | dolichol-linked oligosaccharide biosynthetic process(GO:0006488) |
| 0.0 | 0.1 | GO:0071847 | TNFSF11-mediated signaling pathway(GO:0071847) |
| 0.0 | 0.1 | GO:0042908 | xenobiotic transport(GO:0042908) |
| 0.0 | 0.1 | GO:0032534 | regulation of microvillus assembly(GO:0032534) |
| 0.0 | 0.4 | GO:0008045 | motor neuron axon guidance(GO:0008045) |
| 0.0 | 0.1 | GO:0042492 | gamma-delta T cell differentiation(GO:0042492) |
| 0.0 | 0.1 | GO:1904715 | negative regulation of chaperone-mediated autophagy(GO:1904715) |
| 0.0 | 0.1 | GO:0001831 | trophectodermal cellular morphogenesis(GO:0001831) |
| 0.0 | 0.1 | GO:0030241 | skeletal muscle myosin thick filament assembly(GO:0030241) |
| 0.0 | 0.1 | GO:1902896 | terminal web assembly(GO:1902896) |
| 0.0 | 0.1 | GO:0007258 | JUN phosphorylation(GO:0007258) |
| 0.0 | 0.3 | GO:0036150 | phosphatidylserine acyl-chain remodeling(GO:0036150) |
Gene overrepresentation in cellular_component category:
| Log-likelihood per target | Total log-likelihood | Term | Description |
|---|---|---|---|
| 0.1 | 0.3 | GO:0034365 | discoidal high-density lipoprotein particle(GO:0034365) |
| 0.1 | 0.3 | GO:0048237 | rough endoplasmic reticulum lumen(GO:0048237) alphav-beta3 integrin-vitronectin complex(GO:0071062) |
| 0.1 | 0.3 | GO:0038038 | G-protein coupled receptor homodimeric complex(GO:0038038) |
| 0.1 | 0.7 | GO:0044292 | dendrite terminus(GO:0044292) |
| 0.0 | 0.2 | GO:0005579 | membrane attack complex(GO:0005579) |
| 0.0 | 0.1 | GO:1990130 | Iml1 complex(GO:1990130) |
| 0.0 | 0.1 | GO:0005945 | 6-phosphofructokinase complex(GO:0005945) |
| 0.0 | 0.1 | GO:0098575 | lumenal side of lysosomal membrane(GO:0098575) |
| 0.0 | 0.1 | GO:0097255 | R2TP complex(GO:0097255) |
| 0.0 | 0.1 | GO:0000836 | Hrd1p ubiquitin ligase complex(GO:0000836) |
| 0.0 | 0.2 | GO:0042589 | zymogen granule membrane(GO:0042589) |
| 0.0 | 0.6 | GO:0005790 | smooth endoplasmic reticulum(GO:0005790) |
Gene overrepresentation in molecular_function category:
| Log-likelihood per target | Total log-likelihood | Term | Description |
|---|---|---|---|
| 0.6 | 2.3 | GO:0008336 | gamma-butyrobetaine dioxygenase activity(GO:0008336) |
| 0.2 | 0.7 | GO:0005477 | pyruvate secondary active transmembrane transporter activity(GO:0005477) |
| 0.1 | 0.7 | GO:0018479 | benzaldehyde dehydrogenase (NAD+) activity(GO:0018479) |
| 0.1 | 0.5 | GO:0016160 | amylase activity(GO:0016160) |
| 0.1 | 0.3 | GO:0051499 | D-aminoacyl-tRNA deacylase activity(GO:0051499) D-tyrosyl-tRNA(Tyr) deacylase activity(GO:0051500) |
| 0.1 | 0.3 | GO:0031859 | platelet activating factor receptor binding(GO:0031859) |
| 0.1 | 0.8 | GO:0004499 | N,N-dimethylaniline monooxygenase activity(GO:0004499) |
| 0.1 | 0.3 | GO:0005174 | CD40 receptor binding(GO:0005174) |
| 0.1 | 1.3 | GO:0019864 | IgG binding(GO:0019864) |
| 0.1 | 0.3 | GO:0070653 | high-density lipoprotein particle receptor binding(GO:0070653) |
| 0.1 | 0.7 | GO:0070700 | BMP receptor binding(GO:0070700) |
| 0.1 | 0.2 | GO:0004948 | calcitonin receptor activity(GO:0004948) |
| 0.0 | 0.2 | GO:0015350 | methotrexate transporter activity(GO:0015350) |
| 0.0 | 0.3 | GO:0052739 | phosphatidylserine 1-acylhydrolase activity(GO:0052739) |
| 0.0 | 1.3 | GO:0004435 | phosphatidylinositol phospholipase C activity(GO:0004435) |
| 0.0 | 0.2 | GO:0008508 | bile acid:sodium symporter activity(GO:0008508) |
| 0.0 | 0.3 | GO:0099583 | neurotransmitter receptor activity involved in regulation of postsynaptic cytosolic calcium ion concentration(GO:0099583) |
| 0.0 | 0.1 | GO:0000179 | rRNA (adenine-N6,N6-)-dimethyltransferase activity(GO:0000179) |
| 0.0 | 0.1 | GO:0004307 | ethanolaminephosphotransferase activity(GO:0004307) |
| 0.0 | 0.2 | GO:0016724 | ferroxidase activity(GO:0004322) oxidoreductase activity, oxidizing metal ions, oxygen as acceptor(GO:0016724) |
| 0.0 | 0.1 | GO:0005275 | amine transmembrane transporter activity(GO:0005275) |
| 0.0 | 0.1 | GO:0004321 | fatty-acyl-CoA synthase activity(GO:0004321) |
| 0.0 | 0.2 | GO:0016290 | palmitoyl-CoA hydrolase activity(GO:0016290) |
| 0.0 | 0.1 | GO:0008559 | xenobiotic-transporting ATPase activity(GO:0008559) |
| 0.0 | 0.2 | GO:0071253 | connexin binding(GO:0071253) |
| 0.0 | 0.0 | GO:0033858 | N-acetylgalactosamine kinase activity(GO:0033858) |
| 0.0 | 0.5 | GO:0070273 | phosphatidylinositol-4-phosphate binding(GO:0070273) |
| 0.0 | 0.1 | GO:0016909 | JUN kinase activity(GO:0004705) SAP kinase activity(GO:0016909) |
| 0.0 | 0.0 | GO:0045145 | single-stranded DNA 5'-3' exodeoxyribonuclease activity(GO:0045145) |
| 0.0 | 0.1 | GO:0003872 | 6-phosphofructokinase activity(GO:0003872) |
| 0.0 | 0.2 | GO:0001011 | transcription factor activity, sequence-specific DNA binding, RNA polymerase recruiting(GO:0001011) transcription factor activity, TFIIB-class binding(GO:0001087) |
| 0.0 | 0.1 | GO:0001515 | opioid peptide activity(GO:0001515) |
| 0.0 | 0.6 | GO:0070888 | E-box binding(GO:0070888) |
| 0.0 | 0.2 | GO:0001161 | intronic transcription regulatory region sequence-specific DNA binding(GO:0001161) intronic transcription regulatory region DNA binding(GO:0044213) |
| 0.0 | 0.1 | GO:0004118 | cGMP-stimulated cyclic-nucleotide phosphodiesterase activity(GO:0004118) |
| 0.0 | 0.1 | GO:0016997 | exo-alpha-sialidase activity(GO:0004308) alpha-sialidase activity(GO:0016997) |
| 0.0 | 0.1 | GO:0008467 | [heparan sulfate]-glucosamine 3-sulfotransferase 1 activity(GO:0008467) |
| 0.0 | 0.3 | GO:0017049 | GTP-Rho binding(GO:0017049) |
| 0.0 | 0.1 | GO:0031208 | POZ domain binding(GO:0031208) |
| 0.0 | 2.6 | GO:0017137 | Rab GTPase binding(GO:0017137) |
| 0.0 | 0.3 | GO:0008329 | signaling pattern recognition receptor activity(GO:0008329) pattern recognition receptor activity(GO:0038187) |
| 0.0 | 0.0 | GO:0017098 | sulfonylurea receptor binding(GO:0017098) |
| 0.0 | 0.3 | GO:0005545 | 1-phosphatidylinositol binding(GO:0005545) |
| 0.0 | 0.1 | GO:0008109 | N-acetyllactosaminide beta-1,6-N-acetylglucosaminyltransferase activity(GO:0008109) |
Gene overrepresentation in C2:CP category:
| Log-likelihood per target | Total log-likelihood | Term | Description |
|---|---|---|---|
| 0.0 | 0.1 | ST_STAT3_PATHWAY | STAT3 Pathway |
| 0.0 | 0.8 | PID_ALK2_PATHWAY | ALK2 signaling events |
| 0.0 | 1.9 | PID_ECADHERIN_STABILIZATION_PATHWAY | Stabilization and expansion of the E-cadherin adherens junction |
| 0.0 | 0.1 | PID_EPHA2_FWD_PATHWAY | EPHA2 forward signaling |
| 0.0 | 1.0 | PID_IL6_7_PATHWAY | IL6-mediated signaling events |
| 0.0 | 0.3 | PID_NFKAPPAB_ATYPICAL_PATHWAY | Atypical NF-kappaB pathway |
| 0.0 | 0.9 | ST_G_ALPHA_I_PATHWAY | G alpha i Pathway |
| 0.0 | 0.6 | PID_CD40_PATHWAY | CD40/CD40L signaling |
Gene overrepresentation in C2:CP:REACTOME category:
| Log-likelihood per target | Total log-likelihood | Term | Description |
|---|---|---|---|
| 0.1 | 1.1 | REACTOME_DIGESTION_OF_DIETARY_CARBOHYDRATE | Genes involved in Digestion of dietary carbohydrate |
| 0.0 | 0.7 | REACTOME_ETHANOL_OXIDATION | Genes involved in Ethanol oxidation |
| 0.0 | 0.7 | REACTOME_BILE_SALT_AND_ORGANIC_ANION_SLC_TRANSPORTERS | Genes involved in Bile salt and organic anion SLC transporters |
| 0.0 | 0.6 | REACTOME_CIRCADIAN_REPRESSION_OF_EXPRESSION_BY_REV_ERBA | Genes involved in Circadian Repression of Expression by REV-ERBA |
| 0.0 | 0.3 | REACTOME_TRYPTOPHAN_CATABOLISM | Genes involved in Tryptophan catabolism |
| 0.0 | 0.4 | REACTOME_DEGRADATION_OF_THE_EXTRACELLULAR_MATRIX | Genes involved in Degradation of the extracellular matrix |
| 0.0 | 0.3 | REACTOME_ABCA_TRANSPORTERS_IN_LIPID_HOMEOSTASIS | Genes involved in ABCA transporters in lipid homeostasis |
| 0.0 | 0.2 | REACTOME_ROLE_OF_SECOND_MESSENGERS_IN_NETRIN1_SIGNALING | Genes involved in Role of second messengers in netrin-1 signaling |
|
|
|
|