Motif ID: FOXF2_FOXJ1
Z-value: 0.654


Transcription factors associated with FOXF2_FOXJ1:
| Gene Symbol | Entrez ID | Gene Name |
|---|---|---|
| FOXF2 | ENSG00000137273.3 | FOXF2 |
| FOXJ1 | ENSG00000129654.7 | FOXJ1 |
Activity-expression correlation:
| Gene Symbol | Promoter | Pearson corr. coef. | P-value | Plot |
|---|---|---|---|---|
| FOXJ1 | hg19_v2_chr17_-_74137374_74137385 | 0.69 | 2.1e-04 | Click! |
| FOXF2 | hg19_v2_chr6_+_1389989_1390069 | 0.09 | 6.9e-01 | Click! |


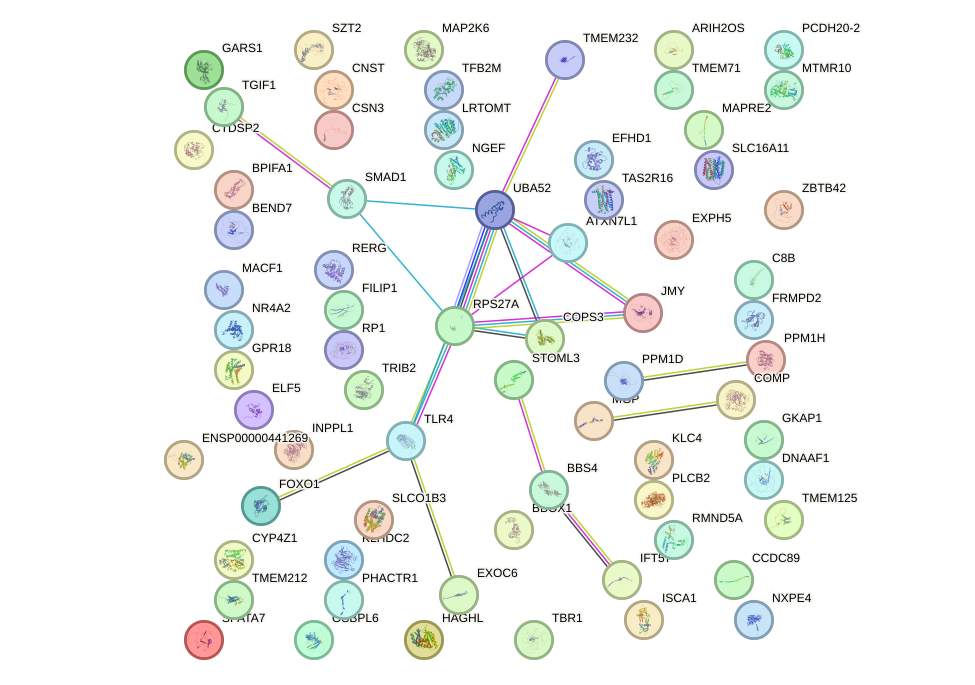
Top targets:
Gene overrepresentation in biological_process category:
| Log-likelihood per target | Total log-likelihood | Term | Description |
|---|---|---|---|
| 0.4 | 1.8 | GO:0042710 | biofilm formation(GO:0042710) single-species biofilm formation(GO:0044010) single-species biofilm formation in or on host organism(GO:0044407) regulation of single-species biofilm formation(GO:1900190) negative regulation of single-species biofilm formation(GO:1900191) regulation of single-species biofilm formation in or on host organism(GO:1900228) negative regulation of single-species biofilm formation in or on host organism(GO:1900229) |
| 0.2 | 0.7 | GO:0021986 | epithalamus development(GO:0021538) habenula development(GO:0021986) |
| 0.2 | 0.6 | GO:0070428 | negative regulation of interleukin-23 production(GO:0032707) regulation of nucleotide-binding oligomerization domain containing 1 signaling pathway(GO:0070428) |
| 0.2 | 0.9 | GO:0038108 | negative regulation of appetite by leptin-mediated signaling pathway(GO:0038108) |
| 0.2 | 1.0 | GO:0035469 | determination of pancreatic left/right asymmetry(GO:0035469) |
| 0.1 | 0.6 | GO:0042271 | susceptibility to natural killer cell mediated cytotoxicity(GO:0042271) |
| 0.1 | 1.4 | GO:0051388 | positive regulation of neurotrophin TRK receptor signaling pathway(GO:0051388) |
| 0.1 | 0.7 | GO:0001712 | ectodermal cell fate commitment(GO:0001712) |
| 0.1 | 0.3 | GO:0070358 | actin polymerization-dependent cell motility(GO:0070358) |
| 0.1 | 0.3 | GO:0072709 | cellular response to sorbitol(GO:0072709) |
| 0.1 | 0.9 | GO:0061002 | negative regulation of dendritic spine morphogenesis(GO:0061002) |
| 0.1 | 0.5 | GO:0097428 | protein maturation by iron-sulfur cluster transfer(GO:0097428) |
| 0.1 | 0.8 | GO:0042492 | gamma-delta T cell differentiation(GO:0042492) |
| 0.1 | 5.6 | GO:1900047 | negative regulation of blood coagulation(GO:0030195) negative regulation of hemostasis(GO:1900047) |
| 0.1 | 0.5 | GO:0035845 | photoreceptor cell outer segment organization(GO:0035845) |
| 0.1 | 0.7 | GO:0042996 | regulation of Golgi to plasma membrane protein transport(GO:0042996) |
| 0.1 | 0.6 | GO:1903546 | protein localization to photoreceptor outer segment(GO:1903546) |
| 0.1 | 0.3 | GO:0006391 | transcription initiation from mitochondrial promoter(GO:0006391) |
| 0.1 | 1.5 | GO:0003334 | keratinocyte development(GO:0003334) |
| 0.1 | 0.4 | GO:0021764 | amygdala development(GO:0021764) |
| 0.1 | 0.2 | GO:0003218 | cardiac left ventricle formation(GO:0003218) |
| 0.1 | 0.4 | GO:1901668 | regulation of superoxide dismutase activity(GO:1901668) |
| 0.1 | 1.5 | GO:0060972 | left/right pattern formation(GO:0060972) |
| 0.1 | 0.3 | GO:0045074 | interleukin-10 biosynthetic process(GO:0042091) regulation of interleukin-10 biosynthetic process(GO:0045074) |
| 0.1 | 0.2 | GO:0031548 | regulation of brain-derived neurotrophic factor receptor signaling pathway(GO:0031548) |
| 0.0 | 0.9 | GO:0019614 | catechol-containing compound catabolic process(GO:0019614) catecholamine catabolic process(GO:0042424) |
| 0.0 | 0.6 | GO:0045078 | positive regulation of interferon-gamma biosynthetic process(GO:0045078) |
| 0.0 | 0.2 | GO:0033615 | mitochondrial proton-transporting ATP synthase complex assembly(GO:0033615) |
| 0.0 | 0.2 | GO:1902617 | response to fluoride(GO:1902617) |
| 0.0 | 0.2 | GO:0006556 | S-adenosylmethionine biosynthetic process(GO:0006556) |
| 0.0 | 0.2 | GO:0019556 | histidine catabolic process to glutamate and formamide(GO:0019556) histidine catabolic process to glutamate and formate(GO:0019557) formamide metabolic process(GO:0043606) |
| 0.0 | 0.2 | GO:0043490 | malate-aspartate shuttle(GO:0043490) |
| 0.0 | 0.4 | GO:0045329 | carnitine biosynthetic process(GO:0045329) |
| 0.0 | 0.4 | GO:0002051 | osteoblast fate commitment(GO:0002051) |
| 0.0 | 0.8 | GO:0052695 | cellular glucuronidation(GO:0052695) |
| 0.0 | 0.2 | GO:0051029 | rRNA transport(GO:0051029) |
| 0.0 | 0.5 | GO:0090360 | platelet-derived growth factor production(GO:0090360) regulation of platelet-derived growth factor production(GO:0090361) |
| 0.0 | 0.2 | GO:1902527 | positive regulation of protein monoubiquitination(GO:1902527) |
| 0.0 | 0.2 | GO:0019348 | dolichol metabolic process(GO:0019348) |
| 0.0 | 0.5 | GO:0042659 | regulation of cell fate specification(GO:0042659) |
| 0.0 | 0.4 | GO:0008090 | retrograde axonal transport(GO:0008090) |
| 0.0 | 0.1 | GO:0031990 | mRNA export from nucleus in response to heat stress(GO:0031990) |
| 0.0 | 0.2 | GO:0032455 | nerve growth factor processing(GO:0032455) |
| 0.0 | 0.3 | GO:0016191 | synaptic vesicle uncoating(GO:0016191) |
| 0.0 | 0.6 | GO:2000251 | positive regulation of actin cytoskeleton reorganization(GO:2000251) |
| 0.0 | 0.3 | GO:0035860 | glial cell-derived neurotrophic factor receptor signaling pathway(GO:0035860) |
| 0.0 | 0.7 | GO:0006957 | complement activation, alternative pathway(GO:0006957) |
| 0.0 | 1.3 | GO:0043252 | sodium-independent organic anion transport(GO:0043252) |
| 0.0 | 0.1 | GO:0071947 | protein deubiquitination involved in ubiquitin-dependent protein catabolic process(GO:0071947) |
| 0.0 | 1.1 | GO:0050913 | sensory perception of bitter taste(GO:0050913) |
| 0.0 | 0.1 | GO:0015993 | molecular hydrogen transport(GO:0015993) |
| 0.0 | 0.1 | GO:0001555 | oocyte growth(GO:0001555) |
| 0.0 | 0.1 | GO:1904721 | negative regulation of mRNA cleavage(GO:0031438) negative regulation of immunoglobulin secretion(GO:0051025) negative regulation of ribonuclease activity(GO:0060701) negative regulation of endoribonuclease activity(GO:0060702) negative regulation of mRNA endonucleolytic cleavage involved in unfolded protein response(GO:1904721) |
| 0.0 | 0.2 | GO:1901374 | acetate ester transport(GO:1901374) |
| 0.0 | 0.1 | GO:0097056 | selenocysteinyl-tRNA(Sec) biosynthetic process(GO:0097056) |
| 0.0 | 0.1 | GO:0030241 | skeletal muscle myosin thick filament assembly(GO:0030241) |
| 0.0 | 0.0 | GO:0051725 | protein de-ADP-ribosylation(GO:0051725) |
| 0.0 | 0.1 | GO:0048698 | negative regulation of collateral sprouting in absence of injury(GO:0048698) |
| 0.0 | 0.1 | GO:0046604 | positive regulation of mitotic centrosome separation(GO:0046604) |
| 0.0 | 0.0 | GO:0090425 | hepatocyte cell migration(GO:0002194) otic placode formation(GO:0043049) branching involved in pancreas morphogenesis(GO:0061114) acinar cell differentiation(GO:0090425) positive regulation of forebrain neuron differentiation(GO:2000979) |
| 0.0 | 0.2 | GO:0015781 | pyrimidine nucleotide-sugar transport(GO:0015781) |
| 0.0 | 0.2 | GO:0035970 | peptidyl-threonine dephosphorylation(GO:0035970) |
| 0.0 | 0.3 | GO:0035455 | response to interferon-alpha(GO:0035455) |
| 0.0 | 0.0 | GO:0001544 | initiation of primordial ovarian follicle growth(GO:0001544) |
| 0.0 | 0.1 | GO:2001034 | positive regulation of double-strand break repair via nonhomologous end joining(GO:2001034) |
| 0.0 | 0.1 | GO:0008582 | regulation of synaptic growth at neuromuscular junction(GO:0008582) |
| 0.0 | 0.2 | GO:0048251 | elastic fiber assembly(GO:0048251) |
| 0.0 | 0.6 | GO:0006699 | bile acid biosynthetic process(GO:0006699) |
| 0.0 | 0.3 | GO:0046856 | phosphatidylinositol dephosphorylation(GO:0046856) |
| 0.0 | 0.3 | GO:0001502 | cartilage condensation(GO:0001502) |
| 0.0 | 0.0 | GO:0045726 | positive regulation of integrin biosynthetic process(GO:0045726) |
Gene overrepresentation in cellular_component category:
| Log-likelihood per target | Total log-likelihood | Term | Description |
|---|---|---|---|
| 0.1 | 0.4 | GO:0034657 | GID complex(GO:0034657) |
| 0.1 | 1.7 | GO:0044292 | dendrite terminus(GO:0044292) |
| 0.1 | 0.6 | GO:0046696 | lipopolysaccharide receptor complex(GO:0046696) |
| 0.1 | 0.4 | GO:0031673 | H zone(GO:0031673) |
| 0.1 | 0.9 | GO:0034464 | BBSome(GO:0034464) |
| 0.1 | 0.2 | GO:0048269 | methionine adenosyltransferase complex(GO:0048269) |
| 0.1 | 0.4 | GO:1990130 | Iml1 complex(GO:1990130) |
| 0.0 | 0.4 | GO:0005579 | membrane attack complex(GO:0005579) |
| 0.0 | 0.2 | GO:0033596 | TSC1-TSC2 complex(GO:0033596) |
| 0.0 | 1.0 | GO:0032391 | photoreceptor connecting cilium(GO:0032391) |
| 0.0 | 1.3 | GO:0005790 | smooth endoplasmic reticulum(GO:0005790) |
| 0.0 | 0.6 | GO:0035327 | transcriptionally active chromatin(GO:0035327) |
| 0.0 | 0.4 | GO:0071141 | SMAD protein complex(GO:0071141) |
| 0.0 | 0.0 | GO:0071438 | invadopodium membrane(GO:0071438) |
| 0.0 | 0.2 | GO:0071953 | elastic fiber(GO:0071953) |
| 0.0 | 6.9 | GO:0045121 | membrane raft(GO:0045121) |
| 0.0 | 0.4 | GO:0000145 | exocyst(GO:0000145) |
| 0.0 | 1.0 | GO:0005876 | spindle microtubule(GO:0005876) |
| 0.0 | 0.1 | GO:0001940 | male pronucleus(GO:0001940) |
Gene overrepresentation in molecular_function category:
| Log-likelihood per target | Total log-likelihood | Term | Description |
|---|---|---|---|
| 0.2 | 0.6 | GO:0010698 | acetyltransferase activator activity(GO:0010698) |
| 0.1 | 0.4 | GO:0008336 | gamma-butyrobetaine dioxygenase activity(GO:0008336) |
| 0.1 | 0.9 | GO:0016206 | catechol O-methyltransferase activity(GO:0016206) |
| 0.1 | 0.4 | GO:0004905 | type I interferon receptor activity(GO:0004905) |
| 0.1 | 0.7 | GO:0071253 | connexin binding(GO:0071253) |
| 0.1 | 0.3 | GO:0000179 | rRNA (adenine-N6,N6-)-dimethyltransferase activity(GO:0000179) |
| 0.1 | 0.9 | GO:0034452 | dynactin binding(GO:0034452) |
| 0.1 | 1.2 | GO:0015125 | bile acid transmembrane transporter activity(GO:0015125) |
| 0.1 | 0.2 | GO:0005169 | neurotrophin TRKB receptor binding(GO:0005169) |
| 0.1 | 0.5 | GO:0001225 | RNA polymerase II transcription coactivator binding(GO:0001225) |
| 0.0 | 1.9 | GO:0004435 | phosphatidylinositol phospholipase C activity(GO:0004435) |
| 0.0 | 0.2 | GO:0003976 | UDP-N-acetylglucosamine-lysosomal-enzyme N-acetylglucosaminephosphotransferase activity(GO:0003976) |
| 0.0 | 0.3 | GO:0016167 | glial cell-derived neurotrophic factor receptor activity(GO:0016167) |
| 0.0 | 0.2 | GO:0008513 | acetylcholine transmembrane transporter activity(GO:0005277) secondary active organic cation transmembrane transporter activity(GO:0008513) acetate ester transmembrane transporter activity(GO:1901375) |
| 0.0 | 0.1 | GO:0051499 | D-aminoacyl-tRNA deacylase activity(GO:0051499) D-tyrosyl-tRNA(Tyr) deacylase activity(GO:0051500) |
| 0.0 | 0.3 | GO:0005134 | interleukin-2 receptor binding(GO:0005134) |
| 0.0 | 0.2 | GO:0002046 | opsin binding(GO:0002046) |
| 0.0 | 0.7 | GO:0035259 | glucocorticoid receptor binding(GO:0035259) |
| 0.0 | 0.3 | GO:0008420 | CTD phosphatase activity(GO:0008420) |
| 0.0 | 0.2 | GO:0016841 | ammonia-lyase activity(GO:0016841) |
| 0.0 | 0.3 | GO:0034485 | phosphatidylinositol-3,4,5-trisphosphate 5-phosphatase activity(GO:0034485) |
| 0.0 | 0.4 | GO:0001011 | transcription factor activity, sequence-specific DNA binding, RNA polymerase recruiting(GO:0001011) transcription factor activity, TFIIB-class binding(GO:0001087) |
| 0.0 | 0.3 | GO:0071933 | Arp2/3 complex binding(GO:0071933) |
| 0.0 | 0.4 | GO:0030618 | transforming growth factor beta receptor, pathway-specific cytoplasmic mediator activity(GO:0030618) |
| 0.0 | 0.6 | GO:0070330 | aromatase activity(GO:0070330) |
| 0.0 | 0.5 | GO:0033038 | bitter taste receptor activity(GO:0033038) |
| 0.0 | 0.2 | GO:0015183 | L-aspartate transmembrane transporter activity(GO:0015183) |
| 0.0 | 0.8 | GO:0008157 | protein phosphatase 1 binding(GO:0008157) |
| 0.0 | 0.1 | GO:0060698 | endoribonuclease inhibitor activity(GO:0060698) |
| 0.0 | 0.9 | GO:0008028 | monocarboxylic acid transmembrane transporter activity(GO:0008028) |
| 0.0 | 0.1 | GO:0030492 | hemoglobin binding(GO:0030492) |
| 0.0 | 0.5 | GO:0051537 | 2 iron, 2 sulfur cluster binding(GO:0051537) |
| 0.0 | 0.7 | GO:0015020 | glucuronosyltransferase activity(GO:0015020) |
| 0.0 | 0.4 | GO:0051010 | microtubule plus-end binding(GO:0051010) |
| 0.0 | 0.3 | GO:0070410 | co-SMAD binding(GO:0070410) |
| 0.0 | 0.1 | GO:0001162 | RNA polymerase II intronic transcription regulatory region sequence-specific DNA binding(GO:0001162) |
| 0.0 | 0.1 | GO:0005250 | A-type (transient outward) potassium channel activity(GO:0005250) |
| 0.0 | 0.3 | GO:0055106 | ubiquitin-protein transferase regulator activity(GO:0055106) |
| 0.0 | 0.1 | GO:0004873 | asialoglycoprotein receptor activity(GO:0004873) |
| 0.0 | 0.4 | GO:0070840 | dynein complex binding(GO:0070840) |
| 0.0 | 0.4 | GO:0019956 | chemokine binding(GO:0019956) |
| 0.0 | 0.3 | GO:0043395 | heparan sulfate proteoglycan binding(GO:0043395) |
| 0.0 | 0.3 | GO:0004708 | MAP kinase kinase activity(GO:0004708) |
Gene overrepresentation in C2:CP category:
| Log-likelihood per target | Total log-likelihood | Term | Description |
|---|---|---|---|
| 0.0 | 0.6 | PID_THROMBIN_PAR4_PATHWAY | PAR4-mediated thrombin signaling events |
| 0.0 | 0.4 | PID_ALK2_PATHWAY | ALK2 signaling events |
| 0.0 | 1.4 | PID_ECADHERIN_STABILIZATION_PATHWAY | Stabilization and expansion of the E-cadherin adherens junction |
| 0.0 | 0.9 | PID_EPHA_FWDPATHWAY | EPHA forward signaling |
| 0.0 | 0.6 | PID_TOLL_ENDOGENOUS_PATHWAY | Endogenous TLR signaling |
| 0.0 | 1.0 | ST_G_ALPHA_I_PATHWAY | G alpha i Pathway |
| 0.0 | 0.3 | PID_P38_GAMMA_DELTA_PATHWAY | Signaling mediated by p38-gamma and p38-delta |
| 0.0 | 0.3 | PID_EPHA2_FWD_PATHWAY | EPHA2 forward signaling |
| 0.0 | 0.9 | PID_IL6_7_PATHWAY | IL6-mediated signaling events |
| 0.0 | 0.7 | PID_FRA_PATHWAY | Validated transcriptional targets of AP1 family members Fra1 and Fra2 |
Gene overrepresentation in C2:CP:REACTOME category:
| Log-likelihood per target | Total log-likelihood | Term | Description |
|---|---|---|---|
| 0.1 | 1.2 | REACTOME_RECYCLING_OF_BILE_ACIDS_AND_SALTS | Genes involved in Recycling of bile acids and salts |
| 0.0 | 0.6 | REACTOME_IKK_COMPLEX_RECRUITMENT_MEDIATED_BY_RIP1 | Genes involved in IKK complex recruitment mediated by RIP1 |
| 0.0 | 1.0 | REACTOME_CIRCADIAN_REPRESSION_OF_EXPRESSION_BY_REV_ERBA | Genes involved in Circadian Repression of Expression by REV-ERBA |
| 0.0 | 0.7 | REACTOME_GLUCURONIDATION | Genes involved in Glucuronidation |
| 0.0 | 1.9 | REACTOME_PLC_BETA_MEDIATED_EVENTS | Genes involved in PLC beta mediated events |
| 0.0 | 0.7 | REACTOME_ADHERENS_JUNCTIONS_INTERACTIONS | Genes involved in Adherens junctions interactions |
| 0.0 | 0.2 | REACTOME_ABACAVIR_TRANSPORT_AND_METABOLISM | Genes involved in Abacavir transport and metabolism |
| 0.0 | 0.7 | REACTOME_MYOGENESIS | Genes involved in Myogenesis |
| 0.0 | 0.4 | REACTOME_INSULIN_SYNTHESIS_AND_PROCESSING | Genes involved in Insulin Synthesis and Processing |
| 0.0 | 0.4 | REACTOME_TERMINATION_OF_O_GLYCAN_BIOSYNTHESIS | Genes involved in Termination of O-glycan biosynthesis |
| 0.0 | 0.5 | REACTOME_KINESINS | Genes involved in Kinesins |
| 0.0 | 0.9 | REACTOME_NRAGE_SIGNALS_DEATH_THROUGH_JNK | Genes involved in NRAGE signals death through JNK |
| 0.0 | 0.4 | REACTOME_REGULATION_OF_IFNA_SIGNALING | Genes involved in Regulation of IFNA signaling |
|
|
|
|