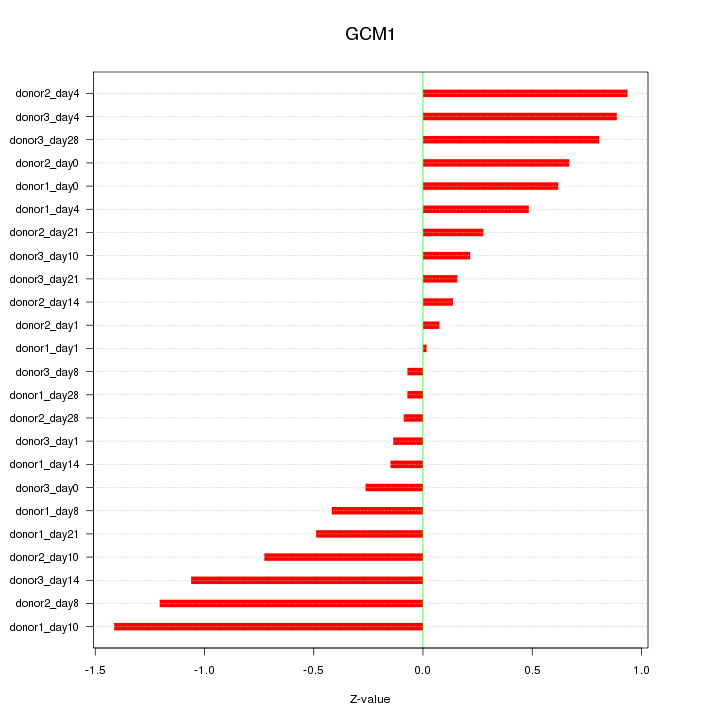
Motif ID: GCM1
Z-value: 0.619

Transcription factors associated with GCM1:
| Gene Symbol | Entrez ID | Gene Name |
|---|---|---|
| GCM1 | ENSG00000137270.10 | GCM1 |
Activity-expression correlation:
| Gene Symbol | Promoter | Pearson corr. coef. | P-value | Plot |
|---|---|---|---|---|
| GCM1 | hg19_v2_chr6_-_53013620_53013644 | -0.32 | 1.3e-01 | Click! |


Top targets:
Gene overrepresentation in biological_process category:
| Log-likelihood per target | Total log-likelihood | Term | Description |
|---|---|---|---|
| 0.2 | 0.6 | GO:0048627 | myoblast development(GO:0048627) |
| 0.2 | 1.0 | GO:1901503 | ether lipid biosynthetic process(GO:0008611) glycerol ether biosynthetic process(GO:0046504) ether biosynthetic process(GO:1901503) |
| 0.2 | 0.5 | GO:0043163 | cell envelope organization(GO:0043163) external encapsulating structure organization(GO:0045229) |
| 0.1 | 0.5 | GO:2000230 | negative regulation of pancreatic stellate cell proliferation(GO:2000230) |
| 0.1 | 0.3 | GO:0046947 | hydroxylysine metabolic process(GO:0046946) hydroxylysine biosynthetic process(GO:0046947) |
| 0.1 | 2.5 | GO:0001829 | trophectodermal cell differentiation(GO:0001829) |
| 0.1 | 0.3 | GO:0045226 | extracellular polysaccharide biosynthetic process(GO:0045226) extracellular polysaccharide metabolic process(GO:0046379) |
| 0.1 | 1.2 | GO:0023041 | neuronal signal transduction(GO:0023041) |
| 0.1 | 0.7 | GO:2000252 | negative regulation of feeding behavior(GO:2000252) |
| 0.1 | 0.3 | GO:1902728 | mineralocorticoid receptor signaling pathway(GO:0031959) positive regulation of skeletal muscle satellite cell proliferation(GO:1902724) positive regulation of growth factor dependent skeletal muscle satellite cell proliferation(GO:1902728) |
| 0.1 | 0.2 | GO:0007497 | posterior midgut development(GO:0007497) endothelin receptor signaling pathway(GO:0086100) |
| 0.1 | 0.5 | GO:0016191 | synaptic vesicle uncoating(GO:0016191) |
| 0.1 | 0.3 | GO:0045903 | positive regulation of translational fidelity(GO:0045903) |
| 0.1 | 0.2 | GO:0097021 | Peyer's patch morphogenesis(GO:0061146) lymphocyte migration into lymphoid organs(GO:0097021) |
| 0.1 | 1.5 | GO:0031581 | hemidesmosome assembly(GO:0031581) |
| 0.0 | 0.2 | GO:0016103 | diterpenoid catabolic process(GO:0016103) retinoic acid catabolic process(GO:0034653) |
| 0.0 | 0.6 | GO:0097084 | vascular smooth muscle cell development(GO:0097084) |
| 0.0 | 0.3 | GO:0002175 | protein localization to paranode region of axon(GO:0002175) |
| 0.0 | 0.3 | GO:1900623 | regulation of monocyte aggregation(GO:1900623) positive regulation of monocyte aggregation(GO:1900625) |
| 0.0 | 0.1 | GO:0006566 | threonine metabolic process(GO:0006566) |
| 0.0 | 0.1 | GO:0003335 | corneocyte development(GO:0003335) |
| 0.0 | 0.2 | GO:1902304 | positive regulation of potassium ion export(GO:1902304) |
| 0.0 | 0.3 | GO:0050428 | purine ribonucleoside bisphosphate biosynthetic process(GO:0034036) 3'-phosphoadenosine 5'-phosphosulfate biosynthetic process(GO:0050428) |
| 0.0 | 0.8 | GO:0045717 | negative regulation of fatty acid biosynthetic process(GO:0045717) |
| 0.0 | 0.8 | GO:0034162 | toll-like receptor 9 signaling pathway(GO:0034162) |
| 0.0 | 0.2 | GO:0050916 | sensory perception of sweet taste(GO:0050916) sensory perception of umami taste(GO:0050917) |
| 0.0 | 0.1 | GO:0016095 | polyprenol catabolic process(GO:0016095) |
| 0.0 | 0.2 | GO:0043932 | ossification involved in bone remodeling(GO:0043932) |
| 0.0 | 0.1 | GO:1900073 | regulation of neuromuscular synaptic transmission(GO:1900073) positive regulation of neuromuscular synaptic transmission(GO:1900075) |
| 0.0 | 0.3 | GO:0016199 | axon midline choice point recognition(GO:0016199) |
| 0.0 | 0.3 | GO:0001886 | endothelial cell morphogenesis(GO:0001886) |
| 0.0 | 1.1 | GO:1903861 | positive regulation of dendrite extension(GO:1903861) |
| 0.0 | 0.2 | GO:0032468 | Golgi calcium ion homeostasis(GO:0032468) |
| 0.0 | 0.1 | GO:0032242 | regulation of nucleoside transport(GO:0032242) positive regulation of necroptotic process(GO:0060545) |
| 0.0 | 0.3 | GO:0036155 | acylglycerol acyl-chain remodeling(GO:0036155) |
| 0.0 | 0.2 | GO:0002326 | B cell lineage commitment(GO:0002326) immunoglobulin V(D)J recombination(GO:0033152) |
| 0.0 | 0.2 | GO:2000609 | regulation of thyroid hormone generation(GO:2000609) |
| 0.0 | 0.1 | GO:0060084 | synaptic transmission involved in micturition(GO:0060084) |
| 0.0 | 0.1 | GO:0014878 | response to electrical stimulus involved in regulation of muscle adaptation(GO:0014878) |
| 0.0 | 0.1 | GO:0046952 | ketone body catabolic process(GO:0046952) |
| 0.0 | 0.1 | GO:1903347 | negative regulation of bicellular tight junction assembly(GO:1903347) |
| 0.0 | 3.5 | GO:0002377 | immunoglobulin production(GO:0002377) |
| 0.0 | 0.1 | GO:0030997 | regulation of centriole-centriole cohesion(GO:0030997) |
| 0.0 | 0.2 | GO:0006307 | DNA dealkylation involved in DNA repair(GO:0006307) |
| 0.0 | 0.1 | GO:0031536 | positive regulation of exit from mitosis(GO:0031536) |
| 0.0 | 0.1 | GO:2001171 | positive regulation of ATP biosynthetic process(GO:2001171) |
| 0.0 | 0.2 | GO:0097484 | dendrite extension(GO:0097484) |
| 0.0 | 0.1 | GO:0000727 | double-strand break repair via break-induced replication(GO:0000727) |
| 0.0 | 0.0 | GO:0002522 | leukocyte migration involved in immune response(GO:0002522) |
| 0.0 | 0.1 | GO:0039663 | fusion of virus membrane with host plasma membrane(GO:0019064) membrane fusion involved in viral entry into host cell(GO:0039663) multi-organism membrane fusion(GO:0044800) |
| 0.0 | 0.0 | GO:0090290 | positive regulation of osteoclast proliferation(GO:0090290) |
| 0.0 | 0.1 | GO:0070973 | protein localization to endoplasmic reticulum exit site(GO:0070973) |
| 0.0 | 0.1 | GO:0042335 | cuticle development(GO:0042335) |
| 0.0 | 0.0 | GO:0003050 | regulation of systemic arterial blood pressure by atrial natriuretic peptide(GO:0003050) |
| 0.0 | 0.1 | GO:0035583 | sequestering of TGFbeta in extracellular matrix(GO:0035583) |
| 0.0 | 0.2 | GO:0006103 | 2-oxoglutarate metabolic process(GO:0006103) |
| 0.0 | 0.0 | GO:0060748 | tertiary branching involved in mammary gland duct morphogenesis(GO:0060748) |
Gene overrepresentation in cellular_component category:
| Log-likelihood per target | Total log-likelihood | Term | Description |
|---|---|---|---|
| 0.2 | 1.5 | GO:0005610 | laminin-5 complex(GO:0005610) |
| 0.1 | 0.4 | GO:1903440 | calcitonin family receptor complex(GO:1903439) amylin receptor complex(GO:1903440) |
| 0.1 | 1.2 | GO:0031362 | anchored component of external side of plasma membrane(GO:0031362) |
| 0.0 | 0.3 | GO:0035692 | macrophage migration inhibitory factor receptor complex(GO:0035692) |
| 0.0 | 1.0 | GO:0031231 | integral component of peroxisomal membrane(GO:0005779) intrinsic component of peroxisomal membrane(GO:0031231) |
| 0.0 | 0.3 | GO:0035976 | AP1 complex(GO:0035976) |
| 0.0 | 0.1 | GO:0000811 | GINS complex(GO:0000811) |
| 0.0 | 0.1 | GO:0034388 | Pwp2p-containing subcomplex of 90S preribosome(GO:0034388) |
| 0.0 | 0.2 | GO:0016012 | sarcoglycan complex(GO:0016012) |
| 0.0 | 1.6 | GO:0045334 | clathrin-coated endocytic vesicle(GO:0045334) |
| 0.0 | 0.3 | GO:0033270 | paranode region of axon(GO:0033270) |
| 0.0 | 0.3 | GO:0071565 | nBAF complex(GO:0071565) |
| 0.0 | 0.2 | GO:0097512 | cardiac myofibril(GO:0097512) |
Gene overrepresentation in molecular_function category:
| Log-likelihood per target | Total log-likelihood | Term | Description |
|---|---|---|---|
| 0.4 | 1.2 | GO:0038131 | neuregulin receptor activity(GO:0038131) |
| 0.2 | 1.0 | GO:0080019 | fatty-acyl-CoA reductase (alcohol-forming) activity(GO:0080019) |
| 0.1 | 0.3 | GO:0033823 | procollagen-lysine 5-dioxygenase activity(GO:0008475) procollagen glucosyltransferase activity(GO:0033823) |
| 0.1 | 0.2 | GO:0005483 | soluble NSF attachment protein activity(GO:0005483) |
| 0.1 | 0.2 | GO:0070644 | vitamin D response element binding(GO:0070644) |
| 0.1 | 0.3 | GO:0050501 | hyaluronan synthase activity(GO:0050501) |
| 0.1 | 0.2 | GO:0004962 | endothelin receptor activity(GO:0004962) |
| 0.1 | 0.5 | GO:0050692 | DBD domain binding(GO:0050692) |
| 0.1 | 0.4 | GO:0097643 | amylin receptor activity(GO:0097643) |
| 0.1 | 0.5 | GO:0003810 | protein-glutamine gamma-glutamyltransferase activity(GO:0003810) |
| 0.0 | 0.8 | GO:0055106 | ubiquitin-protein transferase regulator activity(GO:0055106) |
| 0.0 | 0.3 | GO:0004465 | lipoprotein lipase activity(GO:0004465) |
| 0.0 | 0.1 | GO:0016838 | carbon-oxygen lyase activity, acting on phosphates(GO:0016838) |
| 0.0 | 0.3 | GO:1990932 | 5.8S rRNA binding(GO:1990932) |
| 0.0 | 0.2 | GO:0005220 | inositol hexakisphosphate binding(GO:0000822) inositol 1,4,5-trisphosphate-sensitive calcium-release channel activity(GO:0005220) |
| 0.0 | 0.3 | GO:0005143 | interleukin-12 receptor binding(GO:0005143) |
| 0.0 | 0.1 | GO:0047751 | 3-oxo-5-alpha-steroid 4-dehydrogenase activity(GO:0003865) steroid dehydrogenase activity, acting on the CH-CH group of donors(GO:0033765) cholestenone 5-alpha-reductase activity(GO:0047751) |
| 0.0 | 0.2 | GO:0004035 | alkaline phosphatase activity(GO:0004035) |
| 0.0 | 0.1 | GO:0016296 | oleoyl-[acyl-carrier-protein] hydrolase activity(GO:0004320) myristoyl-[acyl-carrier-protein] hydrolase activity(GO:0016295) palmitoyl-[acyl-carrier-protein] hydrolase activity(GO:0016296) acyl-[acyl-carrier-protein] hydrolase activity(GO:0016297) |
| 0.0 | 0.1 | GO:0008410 | CoA-transferase activity(GO:0008410) |
| 0.0 | 0.2 | GO:0034987 | immunoglobulin receptor binding(GO:0034987) |
| 0.0 | 0.1 | GO:0052593 | tryptamine:oxygen oxidoreductase (deaminating) activity(GO:0052593) aminoacetone:oxygen oxidoreductase(deaminating) activity(GO:0052594) aliphatic-amine oxidase activity(GO:0052595) phenethylamine:oxygen oxidoreductase (deaminating) activity(GO:0052596) |
| 0.0 | 0.2 | GO:0001595 | angiotensin receptor activity(GO:0001595) angiotensin type II receptor activity(GO:0004945) |
| 0.0 | 0.3 | GO:0019531 | oxalate transmembrane transporter activity(GO:0019531) |
| 0.0 | 0.5 | GO:0033130 | acetylcholine receptor binding(GO:0033130) |
| 0.0 | 0.4 | GO:0004185 | serine-type carboxypeptidase activity(GO:0004185) |
| 0.0 | 0.9 | GO:0071855 | neuropeptide receptor binding(GO:0071855) |
| 0.0 | 0.0 | GO:0002113 | interleukin-33 binding(GO:0002113) |
| 0.0 | 0.1 | GO:0030023 | extracellular matrix constituent conferring elasticity(GO:0030023) |
| 0.0 | 0.3 | GO:0070403 | NAD+ binding(GO:0070403) |
Gene overrepresentation in C2:CP category:
| Log-likelihood per target | Total log-likelihood | Term | Description |
|---|---|---|---|
| 0.1 | 1.5 | PID_INTEGRIN4_PATHWAY | Alpha6 beta4 integrin-ligand interactions |
| 0.0 | 0.3 | ST_IL_13_PATHWAY | Interleukin 13 (IL-13) Pathway |
| 0.0 | 0.8 | PID_TOLL_ENDOGENOUS_PATHWAY | Endogenous TLR signaling |
| 0.0 | 0.8 | PID_WNT_NONCANONICAL_PATHWAY | Noncanonical Wnt signaling pathway |
| 0.0 | 1.2 | PID_P75_NTR_PATHWAY | p75(NTR)-mediated signaling |
Gene overrepresentation in C2:CP:REACTOME category:
| Log-likelihood per target | Total log-likelihood | Term | Description |
|---|---|---|---|
| 0.1 | 0.8 | REACTOME_NEGATIVE_REGULATION_OF_THE_PI3K_AKT_NETWORK | Genes involved in Negative regulation of the PI3K/AKT network |
| 0.1 | 0.8 | REACTOME_IRAK2_MEDIATED_ACTIVATION_OF_TAK1_COMPLEX_UPON_TLR7_8_OR_9_STIMULATION | Genes involved in IRAK2 mediated activation of TAK1 complex upon TLR7/8 or 9 stimulation |
| 0.0 | 1.0 | REACTOME_PEROXISOMAL_LIPID_METABOLISM | Genes involved in Peroxisomal lipid metabolism |
| 0.0 | 0.5 | REACTOME_RETROGRADE_NEUROTROPHIN_SIGNALLING | Genes involved in Retrograde neurotrophin signalling |
| 0.0 | 0.5 | REACTOME_HYALURONAN_METABOLISM | Genes involved in Hyaluronan metabolism |
| 0.0 | 0.1 | REACTOME_BINDING_AND_ENTRY_OF_HIV_VIRION | Genes involved in Binding and entry of HIV virion |
| 0.0 | 0.3 | REACTOME_IL_6_SIGNALING | Genes involved in Interleukin-6 signaling |
| 0.0 | 0.3 | REACTOME_FGFR1_LIGAND_BINDING_AND_ACTIVATION | Genes involved in FGFR1 ligand binding and activation |
| 0.0 | 0.2 | REACTOME_CALNEXIN_CALRETICULIN_CYCLE | Genes involved in Calnexin/calreticulin cycle |
| 0.0 | 0.2 | REACTOME_ELEVATION_OF_CYTOSOLIC_CA2_LEVELS | Genes involved in Elevation of cytosolic Ca2+ levels |
| 0.0 | 1.5 | REACTOME_CELL_JUNCTION_ORGANIZATION | Genes involved in Cell junction organization |