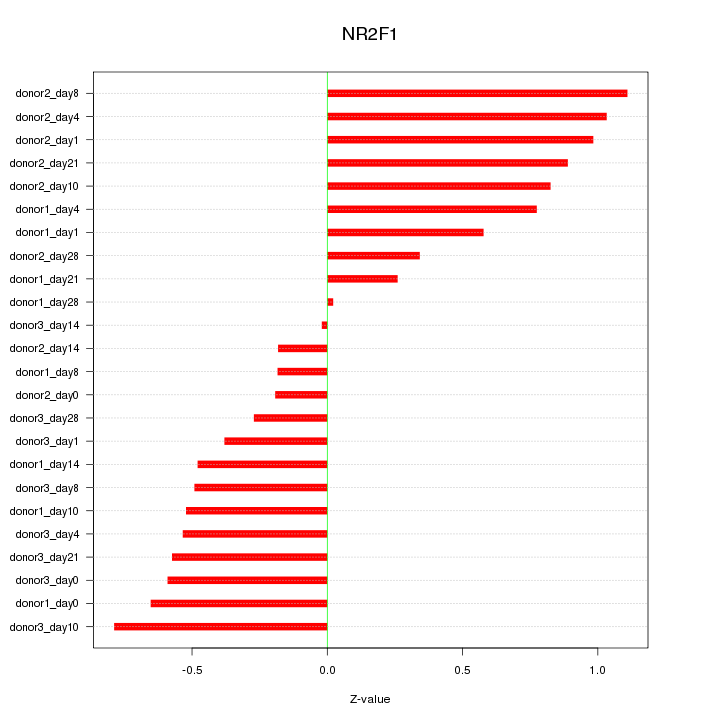
Motif ID: NR2F1
Z-value: 0.610

Transcription factors associated with NR2F1:
| Gene Symbol | Entrez ID | Gene Name |
|---|---|---|
| NR2F1 | ENSG00000175745.7 | NR2F1 |
Activity-expression correlation:
| Gene Symbol | Promoter | Pearson corr. coef. | P-value | Plot |
|---|---|---|---|---|
| NR2F1 | hg19_v2_chr5_+_92919043_92919082 | -0.19 | 3.8e-01 | Click! |


Top targets:
Gene overrepresentation in biological_process category:
| Log-likelihood per target | Total log-likelihood | Term | Description |
|---|---|---|---|
| 0.2 | 0.7 | GO:0070902 | mitochondrial tRNA pseudouridine synthesis(GO:0070902) |
| 0.2 | 1.8 | GO:0009441 | glycolate metabolic process(GO:0009441) |
| 0.2 | 0.5 | GO:0097187 | dentinogenesis(GO:0097187) |
| 0.1 | 0.8 | GO:0000821 | regulation of arginine metabolic process(GO:0000821) |
| 0.1 | 0.4 | GO:1903691 | positive regulation of wound healing, spreading of epidermal cells(GO:1903691) |
| 0.1 | 0.3 | GO:2000583 | renal albumin absorption(GO:0097018) regulation of renal albumin absorption(GO:2000532) regulation of platelet-derived growth factor receptor-alpha signaling pathway(GO:2000583) negative regulation of platelet-derived growth factor receptor-alpha signaling pathway(GO:2000584) |
| 0.1 | 0.5 | GO:2000418 | positive regulation of eosinophil migration(GO:2000418) |
| 0.1 | 0.4 | GO:0007525 | somatic muscle development(GO:0007525) |
| 0.1 | 0.3 | GO:0006391 | transcription initiation from mitochondrial promoter(GO:0006391) |
| 0.1 | 0.2 | GO:0019285 | glycine betaine biosynthetic process from choline(GO:0019285) glycine betaine metabolic process(GO:0031455) glycine betaine biosynthetic process(GO:0031456) |
| 0.1 | 0.3 | GO:0015692 | lead ion transport(GO:0015692) |
| 0.1 | 0.3 | GO:0061055 | myotome development(GO:0061055) |
| 0.1 | 0.2 | GO:0006742 | NADP catabolic process(GO:0006742) pyridine nucleotide catabolic process(GO:0019364) |
| 0.1 | 0.2 | GO:0038178 | complement component C5a signaling pathway(GO:0038178) |
| 0.1 | 0.5 | GO:0019344 | cysteine biosynthetic process(GO:0019344) |
| 0.1 | 0.1 | GO:1904106 | protein localization to microvillus(GO:1904106) |
| 0.1 | 0.7 | GO:0001867 | complement activation, lectin pathway(GO:0001867) |
| 0.1 | 0.2 | GO:0060599 | lateral sprouting involved in mammary gland duct morphogenesis(GO:0060599) |
| 0.0 | 0.1 | GO:2000118 | regulation of sodium-dependent phosphate transport(GO:2000118) |
| 0.0 | 0.2 | GO:0030997 | regulation of centriole-centriole cohesion(GO:0030997) |
| 0.0 | 0.3 | GO:0009804 | coumarin metabolic process(GO:0009804) |
| 0.0 | 0.1 | GO:0019243 | methylglyoxal catabolic process to D-lactate via S-lactoyl-glutathione(GO:0019243) methylglyoxal catabolic process(GO:0051596) methylglyoxal catabolic process to lactate(GO:0061727) |
| 0.0 | 0.4 | GO:1904338 | regulation of dopaminergic neuron differentiation(GO:1904338) |
| 0.0 | 0.2 | GO:2001293 | malonyl-CoA metabolic process(GO:2001293) |
| 0.0 | 0.4 | GO:0015889 | cobalamin transport(GO:0015889) |
| 0.0 | 0.2 | GO:1902896 | terminal web assembly(GO:1902896) |
| 0.0 | 0.2 | GO:0002351 | serotonin production involved in inflammatory response(GO:0002351) serotonin secretion involved in inflammatory response(GO:0002442) serotonin secretion by platelet(GO:0002554) |
| 0.0 | 0.3 | GO:0035871 | protein K11-linked deubiquitination(GO:0035871) |
| 0.0 | 0.1 | GO:0097156 | fasciculation of motor neuron axon(GO:0097156) |
| 0.0 | 0.7 | GO:0072189 | ureter development(GO:0072189) |
| 0.0 | 0.1 | GO:0070171 | negative regulation of tooth mineralization(GO:0070171) |
| 0.0 | 2.4 | GO:0001895 | retina homeostasis(GO:0001895) |
| 0.0 | 0.2 | GO:0006642 | triglyceride mobilization(GO:0006642) |
| 0.0 | 0.2 | GO:0043305 | negative regulation of mast cell degranulation(GO:0043305) |
| 0.0 | 0.1 | GO:2000276 | negative regulation of oxidative phosphorylation uncoupler activity(GO:2000276) |
| 0.0 | 0.4 | GO:0033539 | fatty acid beta-oxidation using acyl-CoA dehydrogenase(GO:0033539) |
| 0.0 | 0.1 | GO:0015722 | canalicular bile acid transport(GO:0015722) |
| 0.0 | 0.1 | GO:0010133 | proline catabolic process to glutamate(GO:0010133) |
| 0.0 | 0.1 | GO:0051754 | meiotic sister chromatid cohesion, centromeric(GO:0051754) |
| 0.0 | 0.1 | GO:0021524 | pulmonary valve formation(GO:0003193) visceral motor neuron differentiation(GO:0021524) foramen ovale closure(GO:0035922) |
| 0.0 | 0.1 | GO:1902774 | late endosome to lysosome transport(GO:1902774) |
| 0.0 | 0.1 | GO:0070601 | centromeric sister chromatid cohesion(GO:0070601) |
| 0.0 | 0.4 | GO:1904714 | regulation of chaperone-mediated autophagy(GO:1904714) |
| 0.0 | 0.2 | GO:0032264 | IMP salvage(GO:0032264) |
| 0.0 | 0.3 | GO:0060033 | anatomical structure regression(GO:0060033) |
| 0.0 | 0.2 | GO:0060770 | negative regulation of epithelial cell proliferation involved in prostate gland development(GO:0060770) |
| 0.0 | 0.2 | GO:0090073 | positive regulation of protein homodimerization activity(GO:0090073) |
| 0.0 | 0.1 | GO:0010902 | positive regulation of very-low-density lipoprotein particle remodeling(GO:0010902) |
| 0.0 | 0.3 | GO:0052695 | cellular glucuronidation(GO:0052695) |
| 0.0 | 0.5 | GO:0043968 | histone H2A acetylation(GO:0043968) |
| 0.0 | 1.1 | GO:0048791 | calcium ion-regulated exocytosis of neurotransmitter(GO:0048791) |
| 0.0 | 0.1 | GO:0015705 | iodide transport(GO:0015705) |
| 0.0 | 0.1 | GO:0010890 | positive regulation of sequestering of triglyceride(GO:0010890) |
| 0.0 | 0.1 | GO:0070445 | oligodendrocyte progenitor proliferation(GO:0070444) regulation of oligodendrocyte progenitor proliferation(GO:0070445) |
| 0.0 | 0.1 | GO:0006013 | mannose metabolic process(GO:0006013) |
| 0.0 | 0.1 | GO:0071934 | thiamine transmembrane transport(GO:0071934) |
| 0.0 | 0.1 | GO:0035860 | glial cell-derived neurotrophic factor receptor signaling pathway(GO:0035860) |
| 0.0 | 0.1 | GO:0006600 | creatine metabolic process(GO:0006600) |
| 0.0 | 0.1 | GO:0002943 | tRNA dihydrouridine synthesis(GO:0002943) |
| 0.0 | 0.1 | GO:1904199 | positive regulation of regulation of vascular smooth muscle cell membrane depolarization(GO:1904199) regulation of vascular smooth muscle cell membrane depolarization(GO:1990736) |
| 0.0 | 0.1 | GO:0007221 | positive regulation of transcription of Notch receptor target(GO:0007221) |
| 0.0 | 0.1 | GO:0048312 | intracellular distribution of mitochondria(GO:0048312) |
| 0.0 | 0.1 | GO:0045218 | zonula adherens maintenance(GO:0045218) |
| 0.0 | 0.1 | GO:2001168 | regulation of histone H2B ubiquitination(GO:2001166) positive regulation of histone H2B ubiquitination(GO:2001168) |
| 0.0 | 0.1 | GO:1900920 | regulation of amino acid uptake involved in synaptic transmission(GO:0051941) regulation of glutamate uptake involved in transmission of nerve impulse(GO:0051946) regulation of L-glutamate import(GO:1900920) |
| 0.0 | 0.0 | GO:0032581 | ER-dependent peroxisome organization(GO:0032581) |
| 0.0 | 0.1 | GO:1902378 | vestibulocochlear nerve structural organization(GO:0021649) positive regulation of cytokine activity(GO:0060301) ganglion morphogenesis(GO:0061552) VEGF-activated neuropilin signaling pathway involved in axon guidance(GO:1902378) dorsal root ganglion morphogenesis(GO:1904835) otic placode development(GO:1905040) |
| 0.0 | 0.0 | GO:0006114 | glycerol biosynthetic process(GO:0006114) |
| 0.0 | 0.0 | GO:0030718 | germ-line stem cell population maintenance(GO:0030718) |
| 0.0 | 0.0 | GO:0000354 | cis assembly of pre-catalytic spliceosome(GO:0000354) |
| 0.0 | 0.2 | GO:0036158 | outer dynein arm assembly(GO:0036158) |
Gene overrepresentation in cellular_component category:
| Log-likelihood per target | Total log-likelihood | Term | Description |
|---|---|---|---|
| 0.1 | 0.3 | GO:0072534 | perineuronal net(GO:0072534) |
| 0.1 | 0.3 | GO:0070826 | paraferritin complex(GO:0070826) |
| 0.1 | 0.2 | GO:0031251 | PAN complex(GO:0031251) |
| 0.1 | 0.4 | GO:0031232 | extrinsic component of external side of plasma membrane(GO:0031232) |
| 0.0 | 0.2 | GO:0036398 | TCR signalosome(GO:0036398) |
| 0.0 | 1.9 | GO:0005782 | peroxisomal matrix(GO:0005782) microbody lumen(GO:0031907) |
| 0.0 | 0.2 | GO:0000015 | phosphopyruvate hydratase complex(GO:0000015) |
| 0.0 | 0.4 | GO:0098574 | cytoplasmic side of lysosomal membrane(GO:0098574) |
| 0.0 | 0.1 | GO:0033263 | CORVET complex(GO:0033263) |
| 0.0 | 0.2 | GO:0042272 | nuclear RNA export factor complex(GO:0042272) |
| 0.0 | 0.2 | GO:0071953 | elastic fiber(GO:0071953) |
| 0.0 | 0.2 | GO:0036157 | outer dynein arm(GO:0036157) |
| 0.0 | 0.1 | GO:0045272 | plasma membrane respiratory chain complex I(GO:0045272) |
| 0.0 | 0.6 | GO:0002080 | acrosomal membrane(GO:0002080) |
| 0.0 | 0.2 | GO:0019773 | proteasome core complex, alpha-subunit complex(GO:0019773) |
| 0.0 | 0.1 | GO:0031415 | NatA complex(GO:0031415) |
| 0.0 | 0.5 | GO:0043189 | NuA4 histone acetyltransferase complex(GO:0035267) H4/H2A histone acetyltransferase complex(GO:0043189) H4 histone acetyltransferase complex(GO:1902562) |
| 0.0 | 0.1 | GO:0034715 | pICln-Sm protein complex(GO:0034715) |
| 0.0 | 0.2 | GO:0001520 | outer dense fiber(GO:0001520) |
| 0.0 | 0.1 | GO:0031931 | TORC1 complex(GO:0031931) |
| 0.0 | 0.2 | GO:0000276 | mitochondrial proton-transporting ATP synthase complex, coupling factor F(o)(GO:0000276) |
| 0.0 | 0.1 | GO:0042719 | mitochondrial intermembrane space protein transporter complex(GO:0042719) |
| 0.0 | 0.4 | GO:0031304 | intrinsic component of mitochondrial inner membrane(GO:0031304) integral component of mitochondrial inner membrane(GO:0031305) |
| 0.0 | 0.1 | GO:0097165 | nuclear stress granule(GO:0097165) |
| 0.0 | 0.4 | GO:0031092 | platelet alpha granule membrane(GO:0031092) |
| 0.0 | 0.4 | GO:0000314 | organellar small ribosomal subunit(GO:0000314) mitochondrial small ribosomal subunit(GO:0005763) |
| 0.0 | 0.1 | GO:0046581 | intercellular canaliculus(GO:0046581) |
Gene overrepresentation in molecular_function category:
| Log-likelihood per target | Total log-likelihood | Term | Description |
|---|---|---|---|
| 0.6 | 1.8 | GO:0016899 | oxidoreductase activity, acting on the CH-OH group of donors, oxygen as acceptor(GO:0016899) |
| 0.2 | 0.7 | GO:0004730 | pseudouridylate synthase activity(GO:0004730) |
| 0.1 | 0.4 | GO:0004174 | electron-transferring-flavoprotein dehydrogenase activity(GO:0004174) oxidoreductase activity, acting on the CH-NH group of donors, quinone or similar compound as acceptor(GO:0016649) |
| 0.1 | 0.5 | GO:0031728 | CCR3 chemokine receptor binding(GO:0031728) |
| 0.1 | 0.2 | GO:0002134 | pyrimidine nucleoside binding(GO:0001884) UTP binding(GO:0002134) pyrimidine ribonucleoside binding(GO:0032551) |
| 0.1 | 0.3 | GO:0004566 | beta-glucuronidase activity(GO:0004566) |
| 0.1 | 0.3 | GO:0015086 | cadmium ion transmembrane transporter activity(GO:0015086) cobalt ion transmembrane transporter activity(GO:0015087) lead ion transmembrane transporter activity(GO:0015094) ferrous iron uptake transmembrane transporter activity(GO:0015639) |
| 0.1 | 0.2 | GO:0004878 | complement component C5a receptor activity(GO:0004878) |
| 0.1 | 0.2 | GO:0070051 | fibrinogen binding(GO:0070051) |
| 0.0 | 0.1 | GO:0004416 | hydroxyacylglutathione hydrolase activity(GO:0004416) |
| 0.0 | 0.3 | GO:0016167 | glial cell-derived neurotrophic factor receptor activity(GO:0016167) |
| 0.0 | 0.6 | GO:0015174 | basic amino acid transmembrane transporter activity(GO:0015174) |
| 0.0 | 0.2 | GO:0016971 | flavin-linked sulfhydryl oxidase activity(GO:0016971) |
| 0.0 | 0.2 | GO:0001855 | complement component C4b binding(GO:0001855) |
| 0.0 | 0.4 | GO:0031419 | cobalamin binding(GO:0031419) |
| 0.0 | 0.2 | GO:0022850 | serotonin-gated cation channel activity(GO:0022850) |
| 0.0 | 0.8 | GO:0042043 | neurexin family protein binding(GO:0042043) |
| 0.0 | 0.1 | GO:0004657 | proline dehydrogenase activity(GO:0004657) |
| 0.0 | 0.6 | GO:0036374 | glutathione hydrolase activity(GO:0036374) |
| 0.0 | 0.2 | GO:0004634 | phosphopyruvate hydratase activity(GO:0004634) |
| 0.0 | 0.5 | GO:0005537 | mannose binding(GO:0005537) |
| 0.0 | 1.0 | GO:0001530 | lipopolysaccharide binding(GO:0001530) |
| 0.0 | 0.2 | GO:0004882 | androgen receptor activity(GO:0004882) |
| 0.0 | 0.1 | GO:0015111 | iodide transmembrane transporter activity(GO:0015111) |
| 0.0 | 0.3 | GO:0033691 | sialic acid binding(GO:0033691) |
| 0.0 | 0.2 | GO:0047623 | AMP deaminase activity(GO:0003876) adenosine-phosphate deaminase activity(GO:0047623) |
| 0.0 | 0.5 | GO:0008392 | arachidonic acid monooxygenase activity(GO:0008391) arachidonic acid epoxygenase activity(GO:0008392) |
| 0.0 | 0.1 | GO:0030197 | extracellular matrix constituent, lubricant activity(GO:0030197) |
| 0.0 | 0.5 | GO:0035497 | cAMP response element binding(GO:0035497) |
| 0.0 | 0.1 | GO:0004111 | creatine kinase activity(GO:0004111) |
| 0.0 | 0.1 | GO:0003956 | NAD(P)+-protein-arginine ADP-ribosyltransferase activity(GO:0003956) |
| 0.0 | 0.2 | GO:0035727 | lysophosphatidic acid binding(GO:0035727) |
| 0.0 | 0.2 | GO:0035381 | extracellular ATP-gated cation channel activity(GO:0004931) ATP-gated ion channel activity(GO:0035381) |
| 0.0 | 0.1 | GO:0008467 | [heparan sulfate]-glucosamine 3-sulfotransferase 1 activity(GO:0008467) |
| 0.0 | 0.4 | GO:0005149 | interleukin-1 receptor binding(GO:0005149) |
| 0.0 | 0.2 | GO:0031996 | thioesterase binding(GO:0031996) |
| 0.0 | 0.2 | GO:0015245 | fatty acid transporter activity(GO:0015245) |
| 0.0 | 0.0 | GO:0004613 | phosphoenolpyruvate carboxykinase activity(GO:0004611) phosphoenolpyruvate carboxykinase (GTP) activity(GO:0004613) |
| 0.0 | 0.1 | GO:0004906 | interferon-gamma receptor activity(GO:0004906) |
| 0.0 | 0.1 | GO:0015234 | thiamine transmembrane transporter activity(GO:0015234) azole transmembrane transporter activity(GO:1901474) |
| 0.0 | 0.1 | GO:0031726 | CCR1 chemokine receptor binding(GO:0031726) |
| 0.0 | 0.4 | GO:0043395 | heparan sulfate proteoglycan binding(GO:0043395) |
| 0.0 | 0.1 | GO:0004144 | diacylglycerol O-acyltransferase activity(GO:0004144) |
| 0.0 | 0.1 | GO:0017150 | tRNA dihydrouridine synthase activity(GO:0017150) |
| 0.0 | 0.1 | GO:0035473 | lipase binding(GO:0035473) lipoprotein lipase activator activity(GO:0060230) |
| 0.0 | 0.0 | GO:0008422 | beta-glucosidase activity(GO:0008422) |
| 0.0 | 0.3 | GO:0015125 | bile acid transmembrane transporter activity(GO:0015125) |
| 0.0 | 0.1 | GO:0005000 | vasopressin receptor activity(GO:0005000) |
| 0.0 | 0.2 | GO:0005319 | lipid transporter activity(GO:0005319) |
| 0.0 | 0.3 | GO:0005001 | transmembrane receptor protein tyrosine phosphatase activity(GO:0005001) transmembrane receptor protein phosphatase activity(GO:0019198) |
| 0.0 | 0.1 | GO:0008121 | ubiquinol-cytochrome-c reductase activity(GO:0008121) oxidoreductase activity, acting on diphenols and related substances as donors, cytochrome as acceptor(GO:0016681) |
| 0.0 | 0.5 | GO:0001103 | RNA polymerase II repressing transcription factor binding(GO:0001103) |
| 0.0 | 0.2 | GO:0004535 | poly(A)-specific ribonuclease activity(GO:0004535) |
Gene overrepresentation in C2:CP category:
| Log-likelihood per target | Total log-likelihood | Term | Description |
|---|---|---|---|
| 0.0 | 0.2 | ST_IL_13_PATHWAY | Interleukin 13 (IL-13) Pathway |
| 0.0 | 0.2 | PID_FOXM1_PATHWAY | FOXM1 transcription factor network |
Gene overrepresentation in C2:CP:REACTOME category:
| Log-likelihood per target | Total log-likelihood | Term | Description |
|---|---|---|---|
| 0.1 | 0.7 | REACTOME_CREATION_OF_C4_AND_C2_ACTIVATORS | Genes involved in Creation of C4 and C2 activators |
| 0.0 | 0.3 | REACTOME_SYNTHESIS_OF_BILE_ACIDS_AND_BILE_SALTS_VIA_24_HYDROXYCHOLESTEROL | Genes involved in Synthesis of bile acids and bile salts via 24-hydroxycholesterol |
| 0.0 | 0.4 | REACTOME_SIGNALING_BY_FGFR3_MUTANTS | Genes involved in Signaling by FGFR3 mutants |
| 0.0 | 0.4 | REACTOME_HDL_MEDIATED_LIPID_TRANSPORT | Genes involved in HDL-mediated lipid transport |
| 0.0 | 0.3 | REACTOME_RECYCLING_OF_BILE_ACIDS_AND_SALTS | Genes involved in Recycling of bile acids and salts |
| 0.0 | 0.8 | REACTOME_BASIGIN_INTERACTIONS | Genes involved in Basigin interactions |
| 0.0 | 0.2 | REACTOME_VITAMIN_B5_PANTOTHENATE_METABOLISM | Genes involved in Vitamin B5 (pantothenate) metabolism |
| 0.0 | 0.3 | REACTOME_HYALURONAN_UPTAKE_AND_DEGRADATION | Genes involved in Hyaluronan uptake and degradation |
| 0.0 | 0.2 | REACTOME_ELEVATION_OF_CYTOSOLIC_CA2_LEVELS | Genes involved in Elevation of cytosolic Ca2+ levels |
| 0.0 | 0.3 | REACTOME_GLUCURONIDATION | Genes involved in Glucuronidation |
| 0.0 | 0.4 | REACTOME_DEADENYLATION_OF_MRNA | Genes involved in Deadenylation of mRNA |