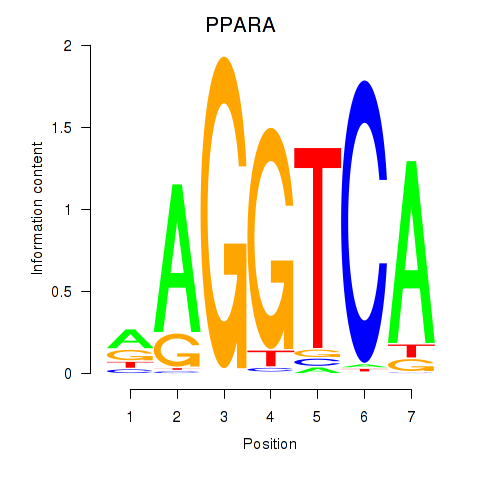
Motif ID: PPARA
Z-value: 1.091
Transcription factors associated with PPARA:
| Gene Symbol | Entrez ID | Gene Name |
|---|---|---|
| PPARA | ENSG00000186951.12 | PPARA |
Activity-expression correlation:
| Gene Symbol | Promoter | Pearson corr. coef. | P-value | Plot |
|---|---|---|---|---|
| PPARA | hg19_v2_chr22_+_46546494_46546525 | -0.47 | 2.1e-02 | Click! |


Top targets:
Gene overrepresentation in biological_process category:
| Log-likelihood per target | Total log-likelihood | Term | Description |
|---|---|---|---|
| 3.9 | 11.7 | GO:1903568 | negative regulation of protein localization to cilium(GO:1903565) regulation of protein localization to ciliary membrane(GO:1903567) negative regulation of protein localization to ciliary membrane(GO:1903568) |
| 0.7 | 3.5 | GO:0019303 | D-ribose catabolic process(GO:0019303) |
| 0.6 | 1.7 | GO:0061394 | regulation of transcription from RNA polymerase II promoter in response to arsenic-containing substance(GO:0061394) |
| 0.5 | 1.6 | GO:1901297 | positive regulation of ephrin receptor signaling pathway(GO:1901189) positive regulation of canonical Wnt signaling pathway involved in cardiac muscle cell fate commitment(GO:1901297) positive regulation of canonical Wnt signaling pathway involved in heart development(GO:1905068) |
| 0.5 | 1.6 | GO:2000276 | negative regulation of oxidative phosphorylation uncoupler activity(GO:2000276) |
| 0.4 | 1.7 | GO:0000255 | allantoin metabolic process(GO:0000255) |
| 0.4 | 2.8 | GO:1904491 | protein localization to ciliary transition zone(GO:1904491) |
| 0.4 | 6.1 | GO:0090360 | platelet-derived growth factor production(GO:0090360) regulation of platelet-derived growth factor production(GO:0090361) |
| 0.4 | 2.3 | GO:0010734 | protein glutathionylation(GO:0010731) regulation of protein glutathionylation(GO:0010732) negative regulation of protein glutathionylation(GO:0010734) |
| 0.4 | 1.1 | GO:1900365 | positive regulation of mRNA polyadenylation(GO:1900365) |
| 0.3 | 1.3 | GO:0032972 | diaphragm contraction(GO:0002086) regulation of muscle filament sliding speed(GO:0032972) |
| 0.3 | 2.3 | GO:0044245 | polysaccharide digestion(GO:0044245) |
| 0.3 | 3.8 | GO:0061525 | hindgut development(GO:0061525) |
| 0.3 | 1.2 | GO:1902613 | regulation of anti-Mullerian hormone signaling pathway(GO:1902612) negative regulation of anti-Mullerian hormone signaling pathway(GO:1902613) anti-Mullerian hormone signaling pathway(GO:1990262) |
| 0.3 | 0.9 | GO:1904048 | regulation of spontaneous neurotransmitter secretion(GO:1904048) |
| 0.3 | 0.9 | GO:0019243 | methylglyoxal catabolic process to D-lactate via S-lactoyl-glutathione(GO:0019243) methylglyoxal catabolic process(GO:0051596) methylglyoxal catabolic process to lactate(GO:0061727) |
| 0.3 | 1.5 | GO:0061669 | spontaneous neurotransmitter secretion(GO:0061669) spontaneous synaptic transmission(GO:0098814) |
| 0.3 | 1.2 | GO:0090299 | regulation of neural crest formation(GO:0090299) negative regulation of neural crest formation(GO:0090301) negative regulation of fibroblast growth factor receptor signaling pathway involved in neural plate anterior/posterior pattern formation(GO:2000314) |
| 0.3 | 0.8 | GO:0003218 | cardiac left ventricle formation(GO:0003218) |
| 0.3 | 2.4 | GO:0072592 | oxygen metabolic process(GO:0072592) |
| 0.3 | 0.8 | GO:0060086 | circadian temperature homeostasis(GO:0060086) positive regulation of bile acid biosynthetic process(GO:0070859) positive regulation of bile acid metabolic process(GO:1904253) |
| 0.2 | 1.7 | GO:1903279 | regulation of calcium:sodium antiporter activity(GO:1903279) |
| 0.2 | 0.7 | GO:0045925 | positive regulation of female receptivity(GO:0045925) |
| 0.2 | 0.9 | GO:1901842 | negative regulation of high voltage-gated calcium channel activity(GO:1901842) |
| 0.2 | 0.6 | GO:0090310 | negative regulation of methylation-dependent chromatin silencing(GO:0090310) |
| 0.2 | 0.8 | GO:1990535 | transformation of host cell by virus(GO:0019087) neuron projection maintenance(GO:1990535) |
| 0.2 | 0.8 | GO:2001295 | malonyl-CoA biosynthetic process(GO:2001295) |
| 0.2 | 1.0 | GO:0036023 | limb joint morphogenesis(GO:0036022) embryonic skeletal limb joint morphogenesis(GO:0036023) |
| 0.2 | 1.5 | GO:0070445 | oligodendrocyte progenitor proliferation(GO:0070444) regulation of oligodendrocyte progenitor proliferation(GO:0070445) |
| 0.2 | 1.8 | GO:0051388 | positive regulation of neurotrophin TRK receptor signaling pathway(GO:0051388) |
| 0.2 | 1.2 | GO:0048014 | Tie signaling pathway(GO:0048014) |
| 0.2 | 1.1 | GO:0072719 | cellular response to cisplatin(GO:0072719) |
| 0.2 | 3.6 | GO:0036158 | outer dynein arm assembly(GO:0036158) |
| 0.2 | 0.7 | GO:0090034 | regulation of chaperone-mediated protein complex assembly(GO:0090034) positive regulation of chaperone-mediated protein complex assembly(GO:0090035) |
| 0.2 | 0.7 | GO:0015910 | peroxisomal long-chain fatty acid import(GO:0015910) |
| 0.2 | 0.7 | GO:0002035 | brain renin-angiotensin system(GO:0002035) angiotensin-mediated drinking behavior(GO:0003051) |
| 0.2 | 0.7 | GO:0097368 | establishment of Sertoli cell barrier(GO:0097368) |
| 0.2 | 0.5 | GO:1904106 | protein localization to microvillus(GO:1904106) |
| 0.2 | 0.9 | GO:0042335 | cuticle development(GO:0042335) |
| 0.2 | 0.6 | GO:1904844 | response to L-glutamine(GO:1904844) cellular response to L-glutamine(GO:1904845) |
| 0.2 | 0.8 | GO:0006546 | glycine catabolic process(GO:0006546) glycine decarboxylation via glycine cleavage system(GO:0019464) |
| 0.1 | 1.9 | GO:0061179 | negative regulation of insulin secretion involved in cellular response to glucose stimulus(GO:0061179) |
| 0.1 | 1.1 | GO:0051386 | regulation of neurotrophin TRK receptor signaling pathway(GO:0051386) |
| 0.1 | 0.4 | GO:1904247 | positive regulation of polynucleotide adenylyltransferase activity(GO:1904247) |
| 0.1 | 0.7 | GO:0006196 | AMP catabolic process(GO:0006196) |
| 0.1 | 0.5 | GO:1904016 | response to Thyroglobulin triiodothyronine(GO:1904016) |
| 0.1 | 1.2 | GO:0035871 | protein K11-linked deubiquitination(GO:0035871) |
| 0.1 | 0.4 | GO:1902995 | regulation of phospholipid efflux(GO:1902994) positive regulation of phospholipid efflux(GO:1902995) |
| 0.1 | 0.8 | GO:1903659 | regulation of complement-dependent cytotoxicity(GO:1903659) |
| 0.1 | 0.7 | GO:0061055 | myotome development(GO:0061055) |
| 0.1 | 0.8 | GO:0036444 | calcium ion transmembrane import into mitochondrion(GO:0036444) |
| 0.1 | 0.6 | GO:0019355 | nicotinamide nucleotide biosynthetic process from aspartate(GO:0019355) 'de novo' NAD biosynthetic process from aspartate(GO:0034628) |
| 0.1 | 0.6 | GO:0045204 | MAPK export from nucleus(GO:0045204) |
| 0.1 | 1.8 | GO:0015866 | ADP transport(GO:0015866) |
| 0.1 | 0.3 | GO:0070681 | glutaminyl-tRNAGln biosynthesis via transamidation(GO:0070681) |
| 0.1 | 0.4 | GO:0043335 | protein unfolding(GO:0043335) |
| 0.1 | 2.4 | GO:0032012 | regulation of ARF protein signal transduction(GO:0032012) |
| 0.1 | 0.3 | GO:0090024 | cerebral cortex tangential migration using cell-cell interactions(GO:0021823) postnatal olfactory bulb interneuron migration(GO:0021827) chemorepulsion involved in postnatal olfactory bulb interneuron migration(GO:0021836) corticospinal neuron axon guidance(GO:0021966) negative regulation of granulocyte chemotaxis(GO:0071623) negative regulation of mononuclear cell migration(GO:0071676) negative regulation of neutrophil chemotaxis(GO:0090024) negative regulation of neutrophil migration(GO:1902623) |
| 0.1 | 0.5 | GO:0032747 | positive regulation of interleukin-23 production(GO:0032747) |
| 0.1 | 1.1 | GO:0072383 | plus-end-directed vesicle transport along microtubule(GO:0072383) |
| 0.1 | 0.7 | GO:1901341 | activation of store-operated calcium channel activity(GO:0032237) positive regulation of store-operated calcium channel activity(GO:1901341) |
| 0.1 | 1.5 | GO:0009313 | oligosaccharide catabolic process(GO:0009313) |
| 0.1 | 1.2 | GO:1904262 | negative regulation of TORC1 signaling(GO:1904262) |
| 0.1 | 0.8 | GO:0015793 | glycerol transport(GO:0015793) |
| 0.1 | 0.4 | GO:0006121 | mitochondrial electron transport, succinate to ubiquinone(GO:0006121) |
| 0.1 | 0.4 | GO:0006556 | S-adenosylmethionine biosynthetic process(GO:0006556) |
| 0.1 | 0.5 | GO:0019626 | short-chain fatty acid catabolic process(GO:0019626) |
| 0.1 | 0.3 | GO:0009644 | response to high light intensity(GO:0009644) |
| 0.1 | 0.4 | GO:0051801 | cytolysis in other organism involved in symbiotic interaction(GO:0051801) positive regulation of phospholipase C-activating G-protein coupled receptor signaling pathway(GO:1900738) |
| 0.1 | 0.8 | GO:0006477 | protein sulfation(GO:0006477) |
| 0.1 | 6.2 | GO:0006120 | mitochondrial electron transport, NADH to ubiquinone(GO:0006120) |
| 0.1 | 0.3 | GO:1900245 | positive regulation of MDA-5 signaling pathway(GO:1900245) |
| 0.1 | 1.1 | GO:0002091 | negative regulation of receptor internalization(GO:0002091) |
| 0.1 | 1.2 | GO:0080182 | histone H3-K4 trimethylation(GO:0080182) |
| 0.1 | 0.2 | GO:1903762 | regulation of heart looping(GO:1901207) positive regulation of voltage-gated potassium channel activity involved in ventricular cardiac muscle cell action potential repolarization(GO:1903762) positive regulation of ventricular cardiac muscle cell action potential(GO:1903947) positive regulation of membrane repolarization during ventricular cardiac muscle cell action potential(GO:1905026) positive regulation of membrane repolarization during cardiac muscle cell action potential(GO:1905033) |
| 0.1 | 0.7 | GO:0061002 | negative regulation of dendritic spine morphogenesis(GO:0061002) |
| 0.1 | 0.7 | GO:1990416 | cellular response to brain-derived neurotrophic factor stimulus(GO:1990416) |
| 0.1 | 0.4 | GO:0007341 | penetration of zona pellucida(GO:0007341) |
| 0.1 | 0.2 | GO:0070676 | intralumenal vesicle formation(GO:0070676) |
| 0.1 | 1.1 | GO:1903800 | positive regulation of production of miRNAs involved in gene silencing by miRNA(GO:1903800) |
| 0.1 | 0.7 | GO:0051013 | microtubule severing(GO:0051013) |
| 0.1 | 1.0 | GO:0048096 | chromatin-mediated maintenance of transcription(GO:0048096) |
| 0.1 | 2.1 | GO:0046856 | phosphatidylinositol dephosphorylation(GO:0046856) |
| 0.1 | 0.4 | GO:0010902 | positive regulation of very-low-density lipoprotein particle remodeling(GO:0010902) |
| 0.1 | 0.3 | GO:0035521 | monoubiquitinated histone deubiquitination(GO:0035521) monoubiquitinated histone H2A deubiquitination(GO:0035522) |
| 0.1 | 0.4 | GO:1904154 | positive regulation of retrograde protein transport, ER to cytosol(GO:1904154) |
| 0.1 | 4.2 | GO:0010862 | positive regulation of pathway-restricted SMAD protein phosphorylation(GO:0010862) |
| 0.1 | 0.9 | GO:0097011 | cellular response to granulocyte macrophage colony-stimulating factor stimulus(GO:0097011) response to granulocyte macrophage colony-stimulating factor(GO:0097012) |
| 0.1 | 1.6 | GO:0003334 | keratinocyte development(GO:0003334) |
| 0.1 | 0.4 | GO:0061084 | regulation of protein refolding(GO:0061083) negative regulation of protein refolding(GO:0061084) |
| 0.1 | 0.6 | GO:1902037 | negative regulation of hematopoietic stem cell differentiation(GO:1902037) |
| 0.1 | 1.0 | GO:0007097 | nuclear migration(GO:0007097) |
| 0.1 | 0.9 | GO:0033601 | positive regulation of mammary gland epithelial cell proliferation(GO:0033601) |
| 0.1 | 0.3 | GO:0045053 | protein retention in Golgi apparatus(GO:0045053) |
| 0.1 | 0.3 | GO:0098707 | ferrous iron import into cell(GO:0097460) ferrous iron import across plasma membrane(GO:0098707) |
| 0.1 | 1.0 | GO:0000244 | spliceosomal tri-snRNP complex assembly(GO:0000244) |
| 0.1 | 0.4 | GO:1903300 | negative regulation of glucokinase activity(GO:0033132) negative regulation of hexokinase activity(GO:1903300) |
| 0.1 | 0.2 | GO:1904044 | response to aldosterone(GO:1904044) |
| 0.1 | 0.6 | GO:0070863 | positive regulation of protein exit from endoplasmic reticulum(GO:0070863) |
| 0.1 | 0.7 | GO:0006883 | cellular sodium ion homeostasis(GO:0006883) |
| 0.1 | 0.2 | GO:1990926 | short-term synaptic potentiation(GO:1990926) |
| 0.1 | 0.1 | GO:0090291 | negative regulation of osteoclast proliferation(GO:0090291) |
| 0.1 | 1.0 | GO:0010561 | negative regulation of glycoprotein biosynthetic process(GO:0010561) |
| 0.1 | 0.7 | GO:1903546 | protein localization to photoreceptor outer segment(GO:1903546) |
| 0.1 | 0.4 | GO:0007258 | JUN phosphorylation(GO:0007258) |
| 0.1 | 0.8 | GO:0006122 | mitochondrial electron transport, ubiquinol to cytochrome c(GO:0006122) |
| 0.1 | 2.0 | GO:2000114 | regulation of establishment of cell polarity(GO:2000114) |
| 0.1 | 0.2 | GO:0000957 | mitochondrial RNA catabolic process(GO:0000957) regulation of mitochondrial RNA catabolic process(GO:0000960) |
| 0.1 | 0.3 | GO:2000259 | positive regulation of complement activation(GO:0045917) positive regulation of protein activation cascade(GO:2000259) |
| 0.1 | 0.2 | GO:0071557 | histone H3-K27 demethylation(GO:0071557) |
| 0.1 | 0.6 | GO:0021520 | spinal cord motor neuron cell fate specification(GO:0021520) |
| 0.0 | 0.1 | GO:0006106 | fumarate metabolic process(GO:0006106) |
| 0.0 | 0.2 | GO:0045872 | positive regulation of rhodopsin gene expression(GO:0045872) |
| 0.0 | 0.4 | GO:0033227 | dsRNA transport(GO:0033227) |
| 0.0 | 2.2 | GO:0010107 | potassium ion import(GO:0010107) |
| 0.0 | 0.1 | GO:1901491 | negative regulation of lymphangiogenesis(GO:1901491) |
| 0.0 | 0.3 | GO:0006102 | isocitrate metabolic process(GO:0006102) response to isolation stress(GO:0035900) |
| 0.0 | 0.1 | GO:0003331 | regulation of extracellular matrix constituent secretion(GO:0003330) positive regulation of extracellular matrix constituent secretion(GO:0003331) |
| 0.0 | 0.6 | GO:0031272 | regulation of pseudopodium assembly(GO:0031272) |
| 0.0 | 0.3 | GO:0030242 | pexophagy(GO:0030242) |
| 0.0 | 0.8 | GO:0018107 | peptidyl-threonine phosphorylation(GO:0018107) peptidyl-threonine modification(GO:0018210) |
| 0.0 | 0.4 | GO:0070934 | CRD-mediated mRNA stabilization(GO:0070934) |
| 0.0 | 2.4 | GO:0032728 | positive regulation of interferon-beta production(GO:0032728) |
| 0.0 | 0.3 | GO:0014722 | regulation of skeletal muscle contraction by calcium ion signaling(GO:0014722) |
| 0.0 | 0.1 | GO:0015729 | thiosulfate transport(GO:0015709) oxaloacetate transport(GO:0015729) malate transport(GO:0015743) malate transmembrane transport(GO:0071423) oxaloacetate(2-) transmembrane transport(GO:1902356) |
| 0.0 | 0.2 | GO:0035063 | nuclear speck organization(GO:0035063) |
| 0.0 | 3.0 | GO:0000381 | regulation of alternative mRNA splicing, via spliceosome(GO:0000381) |
| 0.0 | 3.5 | GO:0001578 | microtubule bundle formation(GO:0001578) |
| 0.0 | 0.2 | GO:0019046 | release from viral latency(GO:0019046) |
| 0.0 | 0.7 | GO:0000338 | protein deneddylation(GO:0000338) |
| 0.0 | 1.2 | GO:0006895 | Golgi to endosome transport(GO:0006895) |
| 0.0 | 0.3 | GO:0044375 | regulation of peroxisome size(GO:0044375) |
| 0.0 | 0.3 | GO:0021847 | ventricular zone neuroblast division(GO:0021847) |
| 0.0 | 0.3 | GO:0042415 | norepinephrine metabolic process(GO:0042415) surfactant homeostasis(GO:0043129) |
| 0.0 | 0.4 | GO:0000414 | regulation of histone H3-K36 methylation(GO:0000414) |
| 0.0 | 0.3 | GO:0033183 | negative regulation of histone ubiquitination(GO:0033183) regulation of histone H2A K63-linked ubiquitination(GO:1901314) negative regulation of histone H2A K63-linked ubiquitination(GO:1901315) |
| 0.0 | 0.3 | GO:1902774 | late endosome to lysosome transport(GO:1902774) |
| 0.0 | 1.0 | GO:0045947 | negative regulation of translational initiation(GO:0045947) |
| 0.0 | 0.1 | GO:0007113 | endomitotic cell cycle(GO:0007113) |
| 0.0 | 0.2 | GO:1902109 | negative regulation of mitochondrial membrane permeability involved in apoptotic process(GO:1902109) |
| 0.0 | 1.1 | GO:0010669 | epithelial structure maintenance(GO:0010669) |
| 0.0 | 0.2 | GO:0006741 | NADP biosynthetic process(GO:0006741) |
| 0.0 | 0.6 | GO:0006527 | arginine catabolic process(GO:0006527) |
| 0.0 | 0.1 | GO:0030997 | regulation of centriole-centriole cohesion(GO:0030997) |
| 0.0 | 0.8 | GO:0070886 | positive regulation of calcineurin-NFAT signaling cascade(GO:0070886) |
| 0.0 | 0.3 | GO:0048312 | intracellular distribution of mitochondria(GO:0048312) |
| 0.0 | 0.1 | GO:0061763 | multivesicular body-lysosome fusion(GO:0061763) |
| 0.0 | 0.6 | GO:0060539 | diaphragm development(GO:0060539) |
| 0.0 | 0.2 | GO:0006540 | glutamate decarboxylation to succinate(GO:0006540) |
| 0.0 | 0.5 | GO:0030903 | notochord development(GO:0030903) |
| 0.0 | 0.1 | GO:1904327 | protein localization to cytosolic proteasome complex(GO:1904327) protein localization to cytosolic proteasome complex involved in ERAD pathway(GO:1904379) |
| 0.0 | 0.8 | GO:2000651 | positive regulation of sodium ion transmembrane transporter activity(GO:2000651) |
| 0.0 | 1.4 | GO:0090503 | RNA phosphodiester bond hydrolysis, exonucleolytic(GO:0090503) |
| 0.0 | 1.6 | GO:0006119 | oxidative phosphorylation(GO:0006119) |
| 0.0 | 2.1 | GO:0048384 | retinoic acid receptor signaling pathway(GO:0048384) |
| 0.0 | 0.1 | GO:0090214 | spongiotrophoblast layer developmental growth(GO:0090214) |
| 0.0 | 0.1 | GO:0006663 | platelet activating factor biosynthetic process(GO:0006663) |
| 0.0 | 0.5 | GO:0006703 | estrogen biosynthetic process(GO:0006703) |
| 0.0 | 0.2 | GO:0035965 | cardiolipin acyl-chain remodeling(GO:0035965) |
| 0.0 | 0.9 | GO:0043567 | regulation of insulin-like growth factor receptor signaling pathway(GO:0043567) |
| 0.0 | 0.6 | GO:0071028 | nuclear RNA surveillance(GO:0071027) nuclear mRNA surveillance(GO:0071028) |
| 0.0 | 0.4 | GO:1901998 | toxin transport(GO:1901998) |
| 0.0 | 1.9 | GO:0006383 | transcription from RNA polymerase III promoter(GO:0006383) |
| 0.0 | 0.2 | GO:0016554 | cytidine to uridine editing(GO:0016554) |
| 0.0 | 0.1 | GO:2000546 | positive regulation of cell chemotaxis to fibroblast growth factor(GO:1904849) positive regulation of endothelial cell chemotaxis to fibroblast growth factor(GO:2000546) |
| 0.0 | 0.6 | GO:0007597 | blood coagulation, intrinsic pathway(GO:0007597) |
| 0.0 | 0.4 | GO:2000210 | positive regulation of anoikis(GO:2000210) |
| 0.0 | 0.2 | GO:0010756 | positive regulation of plasminogen activation(GO:0010756) |
| 0.0 | 1.7 | GO:0035914 | skeletal muscle cell differentiation(GO:0035914) |
| 0.0 | 0.7 | GO:0042776 | mitochondrial ATP synthesis coupled proton transport(GO:0042776) |
| 0.0 | 0.2 | GO:0005981 | regulation of glycogen catabolic process(GO:0005981) |
| 0.0 | 0.3 | GO:0034497 | protein localization to pre-autophagosomal structure(GO:0034497) |
| 0.0 | 0.2 | GO:0061099 | negative regulation of protein tyrosine kinase activity(GO:0061099) |
| 0.0 | 0.1 | GO:0000394 | RNA splicing, via endonucleolytic cleavage and ligation(GO:0000394) tRNA splicing, via endonucleolytic cleavage and ligation(GO:0006388) |
| 0.0 | 1.2 | GO:0007178 | transmembrane receptor protein serine/threonine kinase signaling pathway(GO:0007178) |
| 0.0 | 3.8 | GO:0007156 | homophilic cell adhesion via plasma membrane adhesion molecules(GO:0007156) |
| 0.0 | 0.0 | GO:0045763 | negative regulation of cellular amino acid metabolic process(GO:0045763) |
| 0.0 | 0.5 | GO:0097031 | NADH dehydrogenase complex assembly(GO:0010257) mitochondrial respiratory chain complex I assembly(GO:0032981) mitochondrial respiratory chain complex I biogenesis(GO:0097031) |
| 0.0 | 0.1 | GO:0060501 | positive regulation of epithelial cell proliferation involved in lung morphogenesis(GO:0060501) |
| 0.0 | 0.1 | GO:0060999 | positive regulation of dendritic spine development(GO:0060999) |
| 0.0 | 0.1 | GO:0070197 | meiotic telomere tethering at nuclear periphery(GO:0044821) meiotic attachment of telomere to nuclear envelope(GO:0070197) chromosome attachment to the nuclear envelope(GO:0097240) |
| 0.0 | 0.7 | GO:0002576 | platelet degranulation(GO:0002576) |
| 0.0 | 0.3 | GO:0044130 | negative regulation of growth of symbiont in host(GO:0044130) |
| 0.0 | 0.2 | GO:0001553 | luteinization(GO:0001553) |
| 0.0 | 0.8 | GO:0007214 | gamma-aminobutyric acid signaling pathway(GO:0007214) |
| 0.0 | 0.2 | GO:0010265 | SCF complex assembly(GO:0010265) |
| 0.0 | 0.2 | GO:2000318 | positive regulation of T-helper 17 type immune response(GO:2000318) |
| 0.0 | 1.9 | GO:0031146 | SCF-dependent proteasomal ubiquitin-dependent protein catabolic process(GO:0031146) |
| 0.0 | 0.1 | GO:0021691 | cerebellar Purkinje cell layer maturation(GO:0021691) |
| 0.0 | 0.2 | GO:0043951 | negative regulation of cAMP-mediated signaling(GO:0043951) |
| 0.0 | 0.1 | GO:0016256 | N-glycan processing to lysosome(GO:0016256) |
| 0.0 | 0.4 | GO:0006986 | response to unfolded protein(GO:0006986) response to topologically incorrect protein(GO:0035966) |
| 0.0 | 0.2 | GO:0060211 | regulation of nuclear-transcribed mRNA poly(A) tail shortening(GO:0060211) positive regulation of nuclear-transcribed mRNA poly(A) tail shortening(GO:0060213) |
| 0.0 | 0.2 | GO:0015889 | cobalamin transport(GO:0015889) |
| 0.0 | 0.5 | GO:0045736 | negative regulation of cyclin-dependent protein serine/threonine kinase activity(GO:0045736) |
| 0.0 | 0.2 | GO:0046784 | viral mRNA export from host cell nucleus(GO:0046784) |
| 0.0 | 1.7 | GO:0031338 | regulation of vesicle fusion(GO:0031338) |
| 0.0 | 0.2 | GO:0010457 | centriole-centriole cohesion(GO:0010457) |
| 0.0 | 0.3 | GO:0033169 | histone H3-K9 demethylation(GO:0033169) |
| 0.0 | 0.1 | GO:0061588 | calcium activated phospholipid scrambling(GO:0061588) calcium activated phosphatidylserine scrambling(GO:0061589) calcium activated phosphatidylcholine scrambling(GO:0061590) calcium activated galactosylceramide scrambling(GO:0061591) |
| 0.0 | 1.7 | GO:0070125 | mitochondrial translational elongation(GO:0070125) |
| 0.0 | 0.4 | GO:0032958 | inositol phosphate biosynthetic process(GO:0032958) |
| 0.0 | 0.4 | GO:0045540 | regulation of cholesterol biosynthetic process(GO:0045540) regulation of alcohol biosynthetic process(GO:1902930) |
| 0.0 | 0.2 | GO:0043982 | histone H4-K5 acetylation(GO:0043981) histone H4-K8 acetylation(GO:0043982) |
| 0.0 | 0.6 | GO:0016486 | peptide hormone processing(GO:0016486) |
| 0.0 | 0.0 | GO:0035995 | detection of muscle stretch(GO:0035995) |
| 0.0 | 0.2 | GO:0015937 | coenzyme A biosynthetic process(GO:0015937) |
| 0.0 | 1.1 | GO:0030032 | lamellipodium assembly(GO:0030032) |
| 0.0 | 0.2 | GO:0043374 | CD8-positive, alpha-beta T cell differentiation(GO:0043374) |
| 0.0 | 0.4 | GO:0006308 | DNA catabolic process(GO:0006308) |
| 0.0 | 0.0 | GO:0034196 | acylglycerol transport(GO:0034196) triglyceride transport(GO:0034197) |
| 0.0 | 0.1 | GO:1904714 | regulation of chaperone-mediated autophagy(GO:1904714) |
| 0.0 | 0.1 | GO:0031087 | deadenylation-independent decapping of nuclear-transcribed mRNA(GO:0031087) |
| 0.0 | 0.0 | GO:0061325 | subthalamus development(GO:0021539) subthalamic nucleus development(GO:0021763) deltoid tuberosity development(GO:0035993) prolactin secreting cell differentiation(GO:0060127) left lung development(GO:0060459) left lung morphogenesis(GO:0060460) superior vena cava morphogenesis(GO:0060578) cell proliferation involved in outflow tract morphogenesis(GO:0061325) |
| 0.0 | 0.2 | GO:0034975 | protein folding in endoplasmic reticulum(GO:0034975) |
| 0.0 | 0.2 | GO:0060575 | intestinal epithelial cell differentiation(GO:0060575) |
| 0.0 | 0.1 | GO:0002115 | store-operated calcium entry(GO:0002115) |
| 0.0 | 0.4 | GO:0015991 | energy coupled proton transmembrane transport, against electrochemical gradient(GO:0015988) ATP hydrolysis coupled proton transport(GO:0015991) |
| 0.0 | 0.3 | GO:0097503 | sialylation(GO:0097503) |
| 0.0 | 0.2 | GO:0019430 | removal of superoxide radicals(GO:0019430) |
| 0.0 | 0.1 | GO:0070166 | enamel mineralization(GO:0070166) |
Gene overrepresentation in cellular_component category:
| Log-likelihood per target | Total log-likelihood | Term | Description |
|---|---|---|---|
| 0.9 | 2.8 | GO:0097598 | sperm cytoplasmic droplet(GO:0097598) |
| 0.6 | 1.7 | GO:1990622 | CHOP-ATF3 complex(GO:1990622) |
| 0.5 | 1.5 | GO:0072534 | perineuronal net(GO:0072534) |
| 0.4 | 4.1 | GO:0097427 | microtubule bundle(GO:0097427) |
| 0.4 | 3.6 | GO:0036157 | outer dynein arm(GO:0036157) |
| 0.4 | 1.4 | GO:0031251 | PAN complex(GO:0031251) |
| 0.3 | 1.6 | GO:0002193 | MAML1-RBP-Jkappa- ICN1 complex(GO:0002193) |
| 0.2 | 0.9 | GO:0090571 | RNA polymerase II transcription repressor complex(GO:0090571) |
| 0.2 | 1.4 | GO:1990130 | Iml1 complex(GO:1990130) |
| 0.2 | 1.1 | GO:1990584 | cardiac Troponin complex(GO:1990584) |
| 0.2 | 0.9 | GO:0044326 | dendritic spine neck(GO:0044326) |
| 0.2 | 0.8 | GO:0005899 | insulin receptor complex(GO:0005899) |
| 0.2 | 3.6 | GO:0005890 | sodium:potassium-exchanging ATPase complex(GO:0005890) |
| 0.2 | 0.8 | GO:0045272 | plasma membrane respiratory chain complex I(GO:0045272) |
| 0.1 | 2.8 | GO:0036038 | MKS complex(GO:0036038) |
| 0.1 | 1.3 | GO:0061574 | ASAP complex(GO:0061574) |
| 0.1 | 0.4 | GO:0005873 | plus-end kinesin complex(GO:0005873) |
| 0.1 | 0.4 | GO:0043159 | acrosomal matrix(GO:0043159) |
| 0.1 | 0.4 | GO:0048269 | methionine adenosyltransferase complex(GO:0048269) |
| 0.1 | 0.4 | GO:0071001 | U4/U6 snRNP(GO:0071001) |
| 0.1 | 0.3 | GO:0030956 | glutamyl-tRNA(Gln) amidotransferase complex(GO:0030956) |
| 0.1 | 0.8 | GO:0031232 | extrinsic component of external side of plasma membrane(GO:0031232) |
| 0.1 | 1.2 | GO:0070776 | H3 histone acetyltransferase complex(GO:0070775) MOZ/MORF histone acetyltransferase complex(GO:0070776) |
| 0.1 | 5.9 | GO:0045271 | mitochondrial respiratory chain complex I(GO:0005747) NADH dehydrogenase complex(GO:0030964) respiratory chain complex I(GO:0045271) |
| 0.1 | 3.9 | GO:0080008 | Cul4-RING E3 ubiquitin ligase complex(GO:0080008) |
| 0.1 | 0.4 | GO:0045283 | mitochondrial respiratory chain complex II, succinate dehydrogenase complex (ubiquinone)(GO:0005749) succinate dehydrogenase complex (ubiquinone)(GO:0045257) respiratory chain complex II(GO:0045273) succinate dehydrogenase complex(GO:0045281) fumarate reductase complex(GO:0045283) |
| 0.1 | 3.1 | GO:0031092 | platelet alpha granule membrane(GO:0031092) |
| 0.1 | 0.7 | GO:0032541 | cortical endoplasmic reticulum(GO:0032541) |
| 0.1 | 0.5 | GO:1990037 | Lewy body core(GO:1990037) |
| 0.1 | 0.1 | GO:0032156 | septin cytoskeleton(GO:0032156) |
| 0.1 | 0.9 | GO:0098839 | postsynaptic density membrane(GO:0098839) |
| 0.1 | 0.6 | GO:0061617 | MICOS complex(GO:0061617) |
| 0.1 | 1.1 | GO:0071141 | SMAD protein complex(GO:0071141) |
| 0.1 | 1.0 | GO:0000124 | SAGA complex(GO:0000124) |
| 0.1 | 0.8 | GO:0045275 | mitochondrial respiratory chain complex III(GO:0005750) respiratory chain complex III(GO:0045275) |
| 0.1 | 0.6 | GO:0019907 | cyclin-dependent protein kinase activating kinase holoenzyme complex(GO:0019907) |
| 0.1 | 2.0 | GO:0005753 | mitochondrial proton-transporting ATP synthase complex(GO:0005753) |
| 0.1 | 0.3 | GO:0001405 | presequence translocase-associated import motor(GO:0001405) |
| 0.0 | 1.1 | GO:1990124 | messenger ribonucleoprotein complex(GO:1990124) |
| 0.0 | 0.6 | GO:0005664 | origin recognition complex(GO:0000808) nuclear origin of replication recognition complex(GO:0005664) |
| 0.0 | 0.3 | GO:0033263 | CORVET complex(GO:0033263) |
| 0.0 | 0.3 | GO:0005784 | Sec61 translocon complex(GO:0005784) translocon complex(GO:0071256) |
| 0.0 | 0.4 | GO:0071204 | histone pre-mRNA 3'end processing complex(GO:0071204) |
| 0.0 | 0.4 | GO:0000137 | Golgi cis cisterna(GO:0000137) |
| 0.0 | 0.8 | GO:0016281 | eukaryotic translation initiation factor 4F complex(GO:0016281) |
| 0.0 | 0.6 | GO:0043020 | NADPH oxidase complex(GO:0043020) |
| 0.0 | 0.7 | GO:0005832 | chaperonin-containing T-complex(GO:0005832) |
| 0.0 | 1.0 | GO:0005721 | pericentric heterochromatin(GO:0005721) |
| 0.0 | 0.5 | GO:0035253 | ciliary rootlet(GO:0035253) |
| 0.0 | 0.4 | GO:0044666 | MLL3/4 complex(GO:0044666) |
| 0.0 | 4.6 | GO:0008076 | voltage-gated potassium channel complex(GO:0008076) |
| 0.0 | 0.9 | GO:0035327 | transcriptionally active chromatin(GO:0035327) |
| 0.0 | 0.9 | GO:0031231 | integral component of peroxisomal membrane(GO:0005779) intrinsic component of peroxisomal membrane(GO:0031231) |
| 0.0 | 0.5 | GO:0042405 | nuclear inclusion body(GO:0042405) |
| 0.0 | 0.4 | GO:0043190 | ATP-binding cassette (ABC) transporter complex(GO:0043190) |
| 0.0 | 0.6 | GO:0034045 | pre-autophagosomal structure membrane(GO:0034045) |
| 0.0 | 0.4 | GO:0030126 | COPI vesicle coat(GO:0030126) |
| 0.0 | 0.2 | GO:0001652 | granular component(GO:0001652) |
| 0.0 | 6.0 | GO:0030426 | growth cone(GO:0030426) |
| 0.0 | 0.3 | GO:0005751 | mitochondrial respiratory chain complex IV(GO:0005751) |
| 0.0 | 0.2 | GO:0030121 | AP-1 adaptor complex(GO:0030121) |
| 0.0 | 1.2 | GO:0005758 | mitochondrial intermembrane space(GO:0005758) |
| 0.0 | 0.8 | GO:1902711 | GABA-A receptor complex(GO:1902711) |
| 0.0 | 0.2 | GO:0000347 | THO complex(GO:0000347) THO complex part of transcription export complex(GO:0000445) |
| 0.0 | 1.8 | GO:0031093 | platelet alpha granule lumen(GO:0031093) |
| 0.0 | 0.4 | GO:0045239 | tricarboxylic acid cycle enzyme complex(GO:0045239) |
| 0.0 | 0.1 | GO:0031213 | RSF complex(GO:0031213) |
| 0.0 | 0.2 | GO:0042587 | glycogen granule(GO:0042587) |
| 0.0 | 0.1 | GO:0036396 | MIS complex(GO:0036396) mRNA editing complex(GO:0045293) |
| 0.0 | 3.4 | GO:0001650 | fibrillar center(GO:0001650) |
| 0.0 | 0.4 | GO:0019005 | SCF ubiquitin ligase complex(GO:0019005) |
| 0.0 | 0.5 | GO:0005665 | DNA-directed RNA polymerase II, core complex(GO:0005665) |
| 0.0 | 0.6 | GO:0000314 | organellar small ribosomal subunit(GO:0000314) mitochondrial small ribosomal subunit(GO:0005763) |
| 0.0 | 0.5 | GO:0005640 | nuclear outer membrane(GO:0005640) |
| 0.0 | 0.2 | GO:0061200 | clathrin-sculpted gamma-aminobutyric acid transport vesicle(GO:0061200) clathrin-sculpted gamma-aminobutyric acid transport vesicle membrane(GO:0061202) |
| 0.0 | 0.6 | GO:0005719 | nuclear euchromatin(GO:0005719) |
| 0.0 | 0.1 | GO:0005879 | axonemal microtubule(GO:0005879) |
| 0.0 | 0.3 | GO:0033180 | proton-transporting V-type ATPase, V1 domain(GO:0033180) |
| 0.0 | 0.8 | GO:0048786 | presynaptic active zone(GO:0048786) |
| 0.0 | 0.4 | GO:0031304 | intrinsic component of mitochondrial inner membrane(GO:0031304) integral component of mitochondrial inner membrane(GO:0031305) |
| 0.0 | 1.1 | GO:0000315 | organellar large ribosomal subunit(GO:0000315) mitochondrial large ribosomal subunit(GO:0005762) |
| 0.0 | 0.7 | GO:0032391 | photoreceptor connecting cilium(GO:0032391) |
| 0.0 | 0.6 | GO:0016328 | lateral plasma membrane(GO:0016328) |
| 0.0 | 0.4 | GO:0031143 | pseudopodium(GO:0031143) |
| 0.0 | 0.4 | GO:0034362 | low-density lipoprotein particle(GO:0034362) |
| 0.0 | 0.7 | GO:0008180 | COP9 signalosome(GO:0008180) |
| 0.0 | 0.2 | GO:0035102 | PRC1 complex(GO:0035102) |
| 0.0 | 0.3 | GO:0005849 | mRNA cleavage factor complex(GO:0005849) |
| 0.0 | 0.7 | GO:0030286 | dynein complex(GO:0030286) |
| 0.0 | 0.9 | GO:0005637 | nuclear inner membrane(GO:0005637) |
| 0.0 | 0.7 | GO:0030173 | integral component of Golgi membrane(GO:0030173) |
| 0.0 | 0.2 | GO:0044232 | organelle membrane contact site(GO:0044232) |
Gene overrepresentation in molecular_function category:
| Log-likelihood per target | Total log-likelihood | Term | Description |
|---|---|---|---|
| 0.6 | 1.8 | GO:0070579 | methylcytosine dioxygenase activity(GO:0070579) |
| 0.6 | 2.3 | GO:0016160 | amylase activity(GO:0016160) |
| 0.6 | 1.7 | GO:0033867 | Fas-activated serine/threonine kinase activity(GO:0033867) |
| 0.4 | 2.3 | GO:0004473 | malate dehydrogenase (decarboxylating) (NAD+) activity(GO:0004471) malate dehydrogenase (decarboxylating) (NADP+) activity(GO:0004473) |
| 0.3 | 1.2 | GO:0005026 | transforming growth factor beta receptor activity, type II(GO:0005026) |
| 0.3 | 2.1 | GO:0050682 | AF-2 domain binding(GO:0050682) |
| 0.3 | 0.9 | GO:0010698 | acetyltransferase activator activity(GO:0010698) |
| 0.3 | 0.9 | GO:0031811 | G-protein coupled nucleotide receptor binding(GO:0031811) P2Y1 nucleotide receptor binding(GO:0031812) |
| 0.3 | 0.9 | GO:0004416 | hydroxyacylglutathione hydrolase activity(GO:0004416) |
| 0.3 | 0.9 | GO:0019959 | interleukin-8 binding(GO:0019959) |
| 0.2 | 0.7 | GO:0004676 | 3-phosphoinositide-dependent protein kinase activity(GO:0004676) |
| 0.2 | 2.1 | GO:0004445 | inositol-polyphosphate 5-phosphatase activity(GO:0004445) phosphatidylinositol-3,4,5-trisphosphate 5-phosphatase activity(GO:0034485) |
| 0.2 | 0.8 | GO:0003989 | acetyl-CoA carboxylase activity(GO:0003989) |
| 0.2 | 0.8 | GO:0003986 | acetyl-CoA hydrolase activity(GO:0003986) |
| 0.2 | 3.5 | GO:0015467 | G-protein activated inward rectifier potassium channel activity(GO:0015467) |
| 0.2 | 0.8 | GO:0004047 | aminomethyltransferase activity(GO:0004047) |
| 0.2 | 0.6 | GO:0034353 | RNA pyrophosphohydrolase activity(GO:0034353) |
| 0.2 | 1.2 | GO:0017077 | oxidative phosphorylation uncoupler activity(GO:0017077) |
| 0.2 | 0.7 | GO:0004040 | amidase activity(GO:0004040) |
| 0.2 | 0.7 | GO:0042903 | tubulin deacetylase activity(GO:0042903) |
| 0.2 | 0.3 | GO:0051538 | 3 iron, 4 sulfur cluster binding(GO:0051538) |
| 0.2 | 3.6 | GO:0045504 | dynein heavy chain binding(GO:0045504) |
| 0.2 | 0.8 | GO:0015254 | glycerol channel activity(GO:0015254) |
| 0.2 | 1.1 | GO:0035500 | MH2 domain binding(GO:0035500) |
| 0.2 | 1.8 | GO:0031995 | insulin-like growth factor II binding(GO:0031995) |
| 0.2 | 0.6 | GO:0031685 | adenosine receptor binding(GO:0031685) |
| 0.1 | 1.3 | GO:0031013 | troponin I binding(GO:0031013) |
| 0.1 | 0.4 | GO:0050613 | delta14-sterol reductase activity(GO:0050613) |
| 0.1 | 1.6 | GO:0000150 | recombinase activity(GO:0000150) |
| 0.1 | 0.4 | GO:0008177 | succinate dehydrogenase (ubiquinone) activity(GO:0008177) |
| 0.1 | 0.4 | GO:0034188 | apolipoprotein A-I receptor activity(GO:0034188) phosphatidylserine-translocating ATPase activity(GO:0090556) |
| 0.1 | 0.6 | GO:0000309 | nicotinamide-nucleotide adenylyltransferase activity(GO:0000309) |
| 0.1 | 1.8 | GO:0015217 | ATP transmembrane transporter activity(GO:0005347) ADP transmembrane transporter activity(GO:0015217) |
| 0.1 | 0.4 | GO:0052836 | inositol 5-diphosphate pentakisphosphate 5-kinase activity(GO:0052836) inositol diphosphate tetrakisphosphate kinase activity(GO:0052839) |
| 0.1 | 0.6 | GO:0004095 | carnitine O-palmitoyltransferase activity(GO:0004095) |
| 0.1 | 1.1 | GO:0005375 | copper ion transmembrane transporter activity(GO:0005375) |
| 0.1 | 0.4 | GO:0001588 | dopamine neurotransmitter receptor activity, coupled via Gs(GO:0001588) |
| 0.1 | 6.1 | GO:0050136 | NADH dehydrogenase (ubiquinone) activity(GO:0008137) NADH dehydrogenase (quinone) activity(GO:0050136) |
| 0.1 | 1.5 | GO:0016018 | cyclosporin A binding(GO:0016018) |
| 0.1 | 0.1 | GO:0002134 | pyrimidine nucleoside binding(GO:0001884) UTP binding(GO:0002134) pyrimidine ribonucleoside binding(GO:0032551) |
| 0.1 | 0.3 | GO:1904455 | ubiquitin-specific protease activity involved in negative regulation of ERAD pathway(GO:1904455) |
| 0.1 | 0.7 | GO:0005324 | long-chain fatty acid transporter activity(GO:0005324) |
| 0.1 | 0.7 | GO:0008241 | peptidyl-dipeptidase activity(GO:0008241) |
| 0.1 | 3.5 | GO:0019200 | carbohydrate kinase activity(GO:0019200) |
| 0.1 | 0.7 | GO:0047623 | AMP deaminase activity(GO:0003876) adenosine-phosphate deaminase activity(GO:0047623) |
| 0.1 | 0.2 | GO:0008948 | oxaloacetate decarboxylase activity(GO:0008948) |
| 0.1 | 0.9 | GO:0017151 | DEAD/H-box RNA helicase binding(GO:0017151) |
| 0.1 | 0.6 | GO:0016403 | dimethylargininase activity(GO:0016403) |
| 0.1 | 1.1 | GO:0016174 | NAD(P)H oxidase activity(GO:0016174) |
| 0.1 | 0.3 | GO:0015091 | ferric iron transmembrane transporter activity(GO:0015091) trivalent inorganic cation transmembrane transporter activity(GO:0072510) |
| 0.1 | 0.5 | GO:0004075 | biotin carboxylase activity(GO:0004075) |
| 0.1 | 0.7 | GO:0008568 | microtubule-severing ATPase activity(GO:0008568) |
| 0.1 | 2.4 | GO:0005086 | ARF guanyl-nucleotide exchange factor activity(GO:0005086) |
| 0.1 | 0.4 | GO:0070404 | NADH binding(GO:0070404) |
| 0.1 | 1.7 | GO:0030955 | potassium ion binding(GO:0030955) |
| 0.1 | 0.4 | GO:0016909 | JUN kinase activity(GO:0004705) SAP kinase activity(GO:0016909) |
| 0.1 | 0.5 | GO:0008121 | ubiquinol-cytochrome-c reductase activity(GO:0008121) oxidoreductase activity, acting on diphenols and related substances as donors, cytochrome as acceptor(GO:0016681) |
| 0.1 | 0.9 | GO:0001011 | transcription factor activity, sequence-specific DNA binding, RNA polymerase recruiting(GO:0001011) transcription factor activity, TFIIB-class binding(GO:0001087) |
| 0.1 | 0.6 | GO:0070324 | thyroid hormone binding(GO:0070324) |
| 0.1 | 0.3 | GO:0052740 | 1-acyl-2-lysophosphatidylserine acylhydrolase activity(GO:0052740) |
| 0.1 | 1.1 | GO:0005537 | mannose binding(GO:0005537) |
| 0.1 | 0.4 | GO:0051032 | nucleic acid transmembrane transporter activity(GO:0051032) RNA transmembrane transporter activity(GO:0051033) |
| 0.1 | 0.3 | GO:0008401 | retinoic acid 4-hydroxylase activity(GO:0008401) |
| 0.1 | 1.4 | GO:0004535 | poly(A)-specific ribonuclease activity(GO:0004535) |
| 0.1 | 0.8 | GO:0038132 | neuregulin binding(GO:0038132) |
| 0.1 | 0.3 | GO:0001641 | group II metabotropic glutamate receptor activity(GO:0001641) |
| 0.1 | 0.4 | GO:0043532 | angiostatin binding(GO:0043532) |
| 0.1 | 0.2 | GO:0010861 | thyroid hormone receptor activator activity(GO:0010861) thyroid hormone receptor coactivator activity(GO:0030375) |
| 0.1 | 0.4 | GO:0000774 | adenyl-nucleotide exchange factor activity(GO:0000774) |
| 0.1 | 1.2 | GO:0035925 | mRNA 3'-UTR AU-rich region binding(GO:0035925) |
| 0.1 | 0.6 | GO:0030274 | LIM domain binding(GO:0030274) |
| 0.1 | 1.0 | GO:0008190 | eukaryotic initiation factor 4E binding(GO:0008190) |
| 0.1 | 1.5 | GO:0005001 | transmembrane receptor protein tyrosine phosphatase activity(GO:0005001) transmembrane receptor protein phosphatase activity(GO:0019198) |
| 0.1 | 0.4 | GO:0030621 | U4 snRNA binding(GO:0030621) |
| 0.1 | 0.3 | GO:0031871 | proteinase activated receptor binding(GO:0031871) |
| 0.1 | 0.2 | GO:0071558 | histone demethylase activity (H3-K27 specific)(GO:0071558) |
| 0.1 | 0.4 | GO:0060230 | lipoprotein lipase activator activity(GO:0060230) |
| 0.0 | 0.3 | GO:0004167 | dopachrome isomerase activity(GO:0004167) |
| 0.0 | 0.2 | GO:0010465 | nerve growth factor receptor activity(GO:0010465) |
| 0.0 | 1.9 | GO:0001530 | lipopolysaccharide binding(GO:0001530) |
| 0.0 | 1.2 | GO:0005328 | neurotransmitter:sodium symporter activity(GO:0005328) |
| 0.0 | 3.0 | GO:0017080 | sodium channel regulator activity(GO:0017080) |
| 0.0 | 0.6 | GO:0016175 | superoxide-generating NADPH oxidase activity(GO:0016175) |
| 0.0 | 0.1 | GO:0045155 | electron transporter, transferring electrons from CoQH2-cytochrome c reductase complex and cytochrome c oxidase complex activity(GO:0045155) |
| 0.0 | 0.1 | GO:0015117 | thiosulfate transmembrane transporter activity(GO:0015117) oxaloacetate transmembrane transporter activity(GO:0015131) |
| 0.0 | 0.5 | GO:0097322 | 7SK snRNA binding(GO:0097322) |
| 0.0 | 0.3 | GO:0003828 | alpha-N-acetylneuraminate alpha-2,8-sialyltransferase activity(GO:0003828) |
| 0.0 | 0.4 | GO:0003810 | protein-glutamine gamma-glutamyltransferase activity(GO:0003810) |
| 0.0 | 0.3 | GO:0005237 | inhibitory extracellular ligand-gated ion channel activity(GO:0005237) |
| 0.0 | 0.6 | GO:0015197 | peptide transporter activity(GO:0015197) |
| 0.0 | 0.4 | GO:0052650 | NADP-retinol dehydrogenase activity(GO:0052650) |
| 0.0 | 0.2 | GO:0004800 | thyroxine 5'-deiodinase activity(GO:0004800) |
| 0.0 | 0.4 | GO:0030911 | TPR domain binding(GO:0030911) |
| 0.0 | 0.7 | GO:0001222 | transcription corepressor binding(GO:0001222) |
| 0.0 | 1.0 | GO:0005521 | lamin binding(GO:0005521) |
| 0.0 | 1.3 | GO:0071889 | 14-3-3 protein binding(GO:0071889) |
| 0.0 | 1.0 | GO:0035173 | histone kinase activity(GO:0035173) |
| 0.0 | 0.3 | GO:0048495 | Roundabout binding(GO:0048495) |
| 0.0 | 0.5 | GO:0008503 | benzodiazepine receptor activity(GO:0008503) |
| 0.0 | 1.1 | GO:0005251 | delayed rectifier potassium channel activity(GO:0005251) |
| 0.0 | 0.4 | GO:0004128 | cytochrome-b5 reductase activity, acting on NAD(P)H(GO:0004128) |
| 0.0 | 0.2 | GO:0015459 | potassium channel regulator activity(GO:0015459) |
| 0.0 | 0.2 | GO:0004351 | glutamate decarboxylase activity(GO:0004351) |
| 0.0 | 0.2 | GO:0004591 | oxoglutarate dehydrogenase (succinyl-transferring) activity(GO:0004591) |
| 0.0 | 0.2 | GO:0004466 | long-chain-acyl-CoA dehydrogenase activity(GO:0004466) |
| 0.0 | 0.1 | GO:0005105 | type 1 fibroblast growth factor receptor binding(GO:0005105) |
| 0.0 | 1.8 | GO:0004407 | histone deacetylase activity(GO:0004407) |
| 0.0 | 0.9 | GO:0015269 | calcium-activated potassium channel activity(GO:0015269) |
| 0.0 | 0.4 | GO:0016888 | endodeoxyribonuclease activity, producing 5'-phosphomonoesters(GO:0016888) |
| 0.0 | 5.4 | GO:0001078 | transcriptional repressor activity, RNA polymerase II core promoter proximal region sequence-specific binding(GO:0001078) |
| 0.0 | 0.4 | GO:0031702 | type 1 angiotensin receptor binding(GO:0031702) |
| 0.0 | 0.3 | GO:0004568 | chitinase activity(GO:0004568) |
| 0.0 | 0.9 | GO:0030971 | receptor tyrosine kinase binding(GO:0030971) |
| 0.0 | 0.1 | GO:0005499 | vitamin D binding(GO:0005499) |
| 0.0 | 1.6 | GO:0005160 | transforming growth factor beta receptor binding(GO:0005160) |
| 0.0 | 0.1 | GO:0008267 | poly-glutamine tract binding(GO:0008267) |
| 0.0 | 0.5 | GO:0008093 | cytoskeletal adaptor activity(GO:0008093) |
| 0.0 | 0.8 | GO:0030374 | ligand-dependent nuclear receptor transcription coactivator activity(GO:0030374) |
| 0.0 | 0.1 | GO:0008665 | 2'-phosphotransferase activity(GO:0008665) |
| 0.0 | 0.1 | GO:0016361 | activin receptor activity, type I(GO:0016361) |
| 0.0 | 0.3 | GO:0032454 | histone demethylase activity (H3-K9 specific)(GO:0032454) |
| 0.0 | 0.6 | GO:0016676 | cytochrome-c oxidase activity(GO:0004129) heme-copper terminal oxidase activity(GO:0015002) oxidoreductase activity, acting on a heme group of donors(GO:0016675) oxidoreductase activity, acting on a heme group of donors, oxygen as acceptor(GO:0016676) |
| 0.0 | 0.4 | GO:0008574 | ATP-dependent microtubule motor activity, plus-end-directed(GO:0008574) |
| 0.0 | 0.3 | GO:0031681 | G-protein beta-subunit binding(GO:0031681) |
| 0.0 | 0.7 | GO:0044183 | protein binding involved in protein folding(GO:0044183) |
| 0.0 | 0.1 | GO:0019788 | NEDD8 transferase activity(GO:0019788) |
| 0.0 | 0.2 | GO:1990247 | N6-methyladenosine-containing RNA binding(GO:1990247) |
| 0.0 | 0.4 | GO:0019841 | retinol binding(GO:0019841) |
| 0.0 | 0.2 | GO:0003995 | acyl-CoA dehydrogenase activity(GO:0003995) |
| 0.0 | 0.8 | GO:0005096 | GTPase activator activity(GO:0005096) |
| 0.0 | 0.2 | GO:0031419 | cobalamin binding(GO:0031419) |
| 0.0 | 0.6 | GO:0050699 | WW domain binding(GO:0050699) |
| 0.0 | 3.0 | GO:0017137 | Rab GTPase binding(GO:0017137) |
| 0.0 | 0.2 | GO:0042809 | vitamin D receptor binding(GO:0042809) |
| 0.0 | 1.6 | GO:0008013 | beta-catenin binding(GO:0008013) |
| 0.0 | 0.6 | GO:0030507 | spectrin binding(GO:0030507) |
| 0.0 | 0.4 | GO:0042288 | MHC class I protein binding(GO:0042288) |
| 0.0 | 0.2 | GO:0042975 | peroxisome proliferator activated receptor binding(GO:0042975) |
| 0.0 | 0.3 | GO:0070273 | phosphatidylinositol-4-phosphate binding(GO:0070273) |
| 0.0 | 0.1 | GO:0043184 | morphogen activity(GO:0016015) vascular endothelial growth factor receptor 2 binding(GO:0043184) |
| 0.0 | 0.1 | GO:0003976 | UDP-N-acetylglucosamine-lysosomal-enzyme N-acetylglucosaminephosphotransferase activity(GO:0003976) |
| 0.0 | 0.2 | GO:0043522 | leucine zipper domain binding(GO:0043522) |
| 0.0 | 0.1 | GO:1990380 | Lys48-specific deubiquitinase activity(GO:1990380) |
| 0.0 | 0.0 | GO:0002046 | opsin binding(GO:0002046) |
| 0.0 | 0.2 | GO:0043996 | histone acetyltransferase activity (H4-K5 specific)(GO:0043995) histone acetyltransferase activity (H4-K8 specific)(GO:0043996) histone acetyltransferase activity (H4-K16 specific)(GO:0046972) |
| 0.0 | 0.3 | GO:0008242 | omega peptidase activity(GO:0008242) |
| 0.0 | 0.1 | GO:0047498 | calcium-dependent phospholipase A2 activity(GO:0047498) |
| 0.0 | 0.3 | GO:0046966 | thyroid hormone receptor binding(GO:0046966) |
| 0.0 | 0.6 | GO:0070063 | RNA polymerase binding(GO:0070063) |
| 0.0 | 2.1 | GO:0004386 | helicase activity(GO:0004386) |
| 0.0 | 0.4 | GO:0004864 | protein phosphatase inhibitor activity(GO:0004864) |
| 0.0 | 0.4 | GO:0016831 | carboxy-lyase activity(GO:0016831) |
Gene overrepresentation in C2:CP category:
| Log-likelihood per target | Total log-likelihood | Term | Description |
|---|---|---|---|
| 0.1 | 0.5 | PID_ALK2_PATHWAY | ALK2 signaling events |
| 0.1 | 1.7 | PID_IL5_PATHWAY | IL5-mediated signaling events |
| 0.0 | 0.4 | ST_IL_13_PATHWAY | Interleukin 13 (IL-13) Pathway |
| 0.0 | 1.1 | PID_RET_PATHWAY | Signaling events regulated by Ret tyrosine kinase |
| 0.0 | 1.2 | PID_ERBB_NETWORK_PATHWAY | ErbB receptor signaling network |
| 0.0 | 2.7 | PID_HEDGEHOG_GLI_PATHWAY | Hedgehog signaling events mediated by Gli proteins |
| 0.0 | 4.4 | PID_MYC_REPRESS_PATHWAY | Validated targets of C-MYC transcriptional repression |
| 0.0 | 1.9 | PID_PS1_PATHWAY | Presenilin action in Notch and Wnt signaling |
| 0.0 | 2.5 | PID_HNF3B_PATHWAY | FOXA2 and FOXA3 transcription factor networks |
| 0.0 | 2.4 | PID_RAC1_PATHWAY | RAC1 signaling pathway |
| 0.0 | 1.6 | ST_GA13_PATHWAY | G alpha 13 Pathway |
| 0.0 | 1.5 | PID_CDC42_REG_PATHWAY | Regulation of CDC42 activity |
| 0.0 | 1.8 | PID_ATF2_PATHWAY | ATF-2 transcription factor network |
| 0.0 | 0.5 | ST_TUMOR_NECROSIS_FACTOR_PATHWAY | Tumor Necrosis Factor Pathway. |
| 0.0 | 0.5 | PID_IL27_PATHWAY | IL27-mediated signaling events |
| 0.0 | 0.8 | PID_HDAC_CLASSII_PATHWAY | Signaling events mediated by HDAC Class II |
| 0.0 | 0.4 | SIG_CD40PATHWAYMAP | Genes related to CD40 signaling |
| 0.0 | 2.5 | PID_BETA_CATENIN_NUC_PATHWAY | Regulation of nuclear beta catenin signaling and target gene transcription |
| 0.0 | 0.7 | PID_LIS1_PATHWAY | Lissencephaly gene (LIS1) in neuronal migration and development |
| 0.0 | 0.4 | PID_PTP1B_PATHWAY | Signaling events mediated by PTP1B |
| 0.0 | 0.8 | PID_GLYPICAN_1PATHWAY | Glypican 1 network |
| 0.0 | 0.1 | PID_ALK1_PATHWAY | ALK1 signaling events |
Gene overrepresentation in C2:CP:REACTOME category:
| Log-likelihood per target | Total log-likelihood | Term | Description |
|---|---|---|---|
| 1.0 | 8.9 | REACTOME_DIGESTION_OF_DIETARY_CARBOHYDRATE | Genes involved in Digestion of dietary carbohydrate |
| 0.1 | 0.3 | REACTOME_SHC_RELATED_EVENTS | Genes involved in SHC-related events |
| 0.1 | 1.6 | REACTOME_NOTCH_HLH_TRANSCRIPTION_PATHWAY | Genes involved in Notch-HLH transcription pathway |
| 0.1 | 3.2 | REACTOME_SIGNALING_BY_NODAL | Genes involved in Signaling by NODAL |
| 0.1 | 3.5 | REACTOME_INHIBITION_OF_VOLTAGE_GATED_CA2_CHANNELS_VIA_GBETA_GAMMA_SUBUNITS | Genes involved in Inhibition of voltage gated Ca2+ channels via Gbeta/gamma subunits |
| 0.1 | 2.3 | REACTOME_PROLACTIN_RECEPTOR_SIGNALING | Genes involved in Prolactin receptor signaling |
| 0.1 | 7.5 | REACTOME_RESPIRATORY_ELECTRON_TRANSPORT | Genes involved in Respiratory electron transport |
| 0.1 | 1.0 | REACTOME_ANDROGEN_BIOSYNTHESIS | Genes involved in Androgen biosynthesis |
| 0.1 | 1.3 | REACTOME_ALPHA_LINOLENIC_ACID_ALA_METABOLISM | Genes involved in alpha-linolenic acid (ALA) metabolism |
| 0.1 | 2.2 | REACTOME_ACTIVATION_OF_GENES_BY_ATF4 | Genes involved in Activation of Genes by ATF4 |
| 0.1 | 0.8 | REACTOME_ELEVATION_OF_CYTOSOLIC_CA2_LEVELS | Genes involved in Elevation of cytosolic Ca2+ levels |
| 0.1 | 1.0 | REACTOME_MITOCHONDRIAL_FATTY_ACID_BETA_OXIDATION | Genes involved in Mitochondrial Fatty Acid Beta-Oxidation |
| 0.1 | 1.6 | REACTOME_RESPIRATORY_ELECTRON_TRANSPORT_ATP_SYNTHESIS_BY_CHEMIOSMOTIC_COUPLING_AND_HEAT_PRODUCTION_BY_UNCOUPLING_PROTEINS_ | Genes involved in Respiratory electron transport, ATP synthesis by chemiosmotic coupling, and heat production by uncoupling proteins. |
| 0.1 | 0.8 | REACTOME_PASSIVE_TRANSPORT_BY_AQUAPORINS | Genes involved in Passive Transport by Aquaporins |
| 0.1 | 1.6 | REACTOME_CELL_EXTRACELLULAR_MATRIX_INTERACTIONS | Genes involved in Cell-extracellular matrix interactions |
| 0.1 | 0.3 | REACTOME_TRANSFERRIN_ENDOCYTOSIS_AND_RECYCLING | Genes involved in Transferrin endocytosis and recycling |
| 0.0 | 1.2 | REACTOME_NA_CL_DEPENDENT_NEUROTRANSMITTER_TRANSPORTERS | Genes involved in Na+/Cl- dependent neurotransmitter transporters |
| 0.0 | 1.3 | REACTOME_CIRCADIAN_REPRESSION_OF_EXPRESSION_BY_REV_ERBA | Genes involved in Circadian Repression of Expression by REV-ERBA |
| 0.0 | 0.6 | REACTOME_COMMON_PATHWAY | Genes involved in Common Pathway |
| 0.0 | 0.6 | REACTOME_LATENT_INFECTION_OF_HOMO_SAPIENS_WITH_MYCOBACTERIUM_TUBERCULOSIS | Genes involved in Latent infection of Homo sapiens with Mycobacterium tuberculosis |
| 0.0 | 0.9 | REACTOME_HDL_MEDIATED_LIPID_TRANSPORT | Genes involved in HDL-mediated lipid transport |
| 0.0 | 0.8 | REACTOME_DOWNREGULATION_OF_ERBB2_ERBB3_SIGNALING | Genes involved in Downregulation of ERBB2:ERBB3 signaling |
| 0.0 | 0.7 | REACTOME_G_BETA_GAMMA_SIGNALLING_THROUGH_PI3KGAMMA | Genes involved in G beta:gamma signalling through PI3Kgamma |
| 0.0 | 1.1 | REACTOME_INSULIN_RECEPTOR_RECYCLING | Genes involved in Insulin receptor recycling |
| 0.0 | 0.7 | REACTOME_PROCESSING_OF_INTRONLESS_PRE_MRNAS | Genes involved in Processing of Intronless Pre-mRNAs |
| 0.0 | 0.7 | REACTOME_PURINE_SALVAGE | Genes involved in Purine salvage |
| 0.0 | 1.0 | REACTOME_METAL_ION_SLC_TRANSPORTERS | Genes involved in Metal ion SLC transporters |
| 0.0 | 1.1 | REACTOME_SYNTHESIS_OF_PIPS_AT_THE_PLASMA_MEMBRANE | Genes involved in Synthesis of PIPs at the plasma membrane |
| 0.0 | 1.4 | REACTOME_ION_TRANSPORT_BY_P_TYPE_ATPASES | Genes involved in Ion transport by P-type ATPases |
| 0.0 | 0.7 | REACTOME_GABA_A_RECEPTOR_ACTIVATION | Genes involved in GABA A receptor activation |
| 0.0 | 0.4 | REACTOME_ACTIVATION_OF_THE_AP1_FAMILY_OF_TRANSCRIPTION_FACTORS | Genes involved in Activation of the AP-1 family of transcription factors |
| 0.0 | 0.9 | REACTOME_SPHINGOLIPID_DE_NOVO_BIOSYNTHESIS | Genes involved in Sphingolipid de novo biosynthesis |
| 0.0 | 0.5 | REACTOME_CITRIC_ACID_CYCLE_TCA_CYCLE | Genes involved in Citric acid cycle (TCA cycle) |
| 0.0 | 0.4 | REACTOME_IL_6_SIGNALING | Genes involved in Interleukin-6 signaling |
| 0.0 | 0.4 | REACTOME_YAP1_AND_WWTR1_TAZ_STIMULATED_GENE_EXPRESSION | Genes involved in YAP1- and WWTR1 (TAZ)-stimulated gene expression |
| 0.0 | 0.6 | REACTOME_ACTIVATED_AMPK_STIMULATES_FATTY_ACID_OXIDATION_IN_MUSCLE | Genes involved in Activated AMPK stimulates fatty-acid oxidation in muscle |
| 0.0 | 0.9 | REACTOME_MYOGENESIS | Genes involved in Myogenesis |
| 0.0 | 0.3 | REACTOME_TETRAHYDROBIOPTERIN_BH4_SYNTHESIS_RECYCLING_SALVAGE_AND_REGULATION | Genes involved in Tetrahydrobiopterin (BH4) synthesis, recycling, salvage and regulation |
| 0.0 | 0.4 | REACTOME_ABCA_TRANSPORTERS_IN_LIPID_HOMEOSTASIS | Genes involved in ABCA transporters in lipid homeostasis |
| 0.0 | 0.6 | REACTOME_ASSOCIATION_OF_TRIC_CCT_WITH_TARGET_PROTEINS_DURING_BIOSYNTHESIS | Genes involved in Association of TriC/CCT with target proteins during biosynthesis |
| 0.0 | 0.2 | REACTOME_VITAMIN_B5_PANTOTHENATE_METABOLISM | Genes involved in Vitamin B5 (pantothenate) metabolism |
| 0.0 | 0.7 | REACTOME_NOTCH1_INTRACELLULAR_DOMAIN_REGULATES_TRANSCRIPTION | Genes involved in NOTCH1 Intracellular Domain Regulates Transcription |
| 0.0 | 1.0 | REACTOME_VOLTAGE_GATED_POTASSIUM_CHANNELS | Genes involved in Voltage gated Potassium channels |
| 0.0 | 0.4 | REACTOME_G0_AND_EARLY_G1 | Genes involved in G0 and Early G1 |
| 0.0 | 0.2 | REACTOME_PRE_NOTCH_TRANSCRIPTION_AND_TRANSLATION | Genes involved in Pre-NOTCH Transcription and Translation |
| 0.0 | 0.5 | REACTOME_SULFUR_AMINO_ACID_METABOLISM | Genes involved in Sulfur amino acid metabolism |
| 0.0 | 0.4 | REACTOME_CHOLESTEROL_BIOSYNTHESIS | Genes involved in Cholesterol biosynthesis |
| 0.0 | 0.3 | REACTOME_ADHERENS_JUNCTIONS_INTERACTIONS | Genes involved in Adherens junctions interactions |