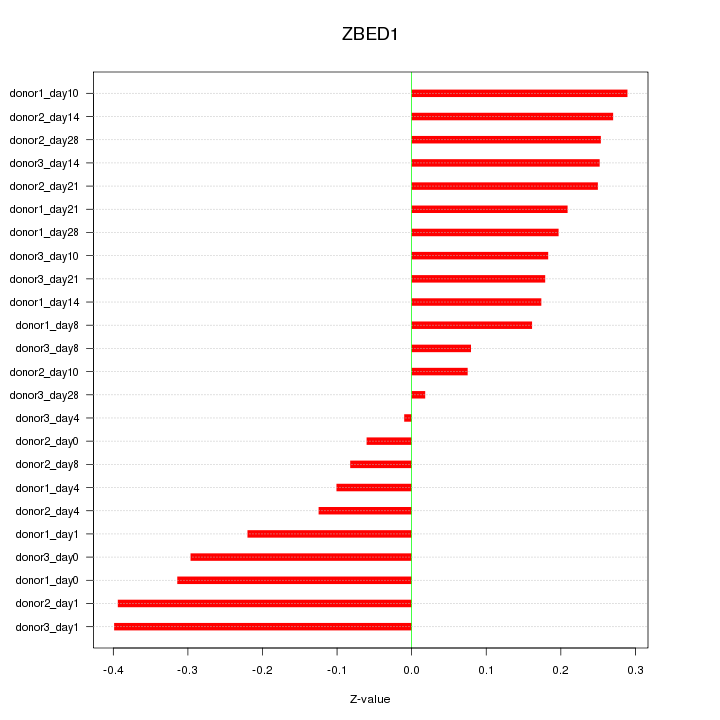
Motif ID: ZBED1
Z-value: 0.219

Transcription factors associated with ZBED1:
| Gene Symbol | Entrez ID | Gene Name |
|---|---|---|
| ZBED1 | ENSG00000214717.5 | ZBED1 |
| ZBED1 | ENSGR0000214717.5 | ZBED1 |
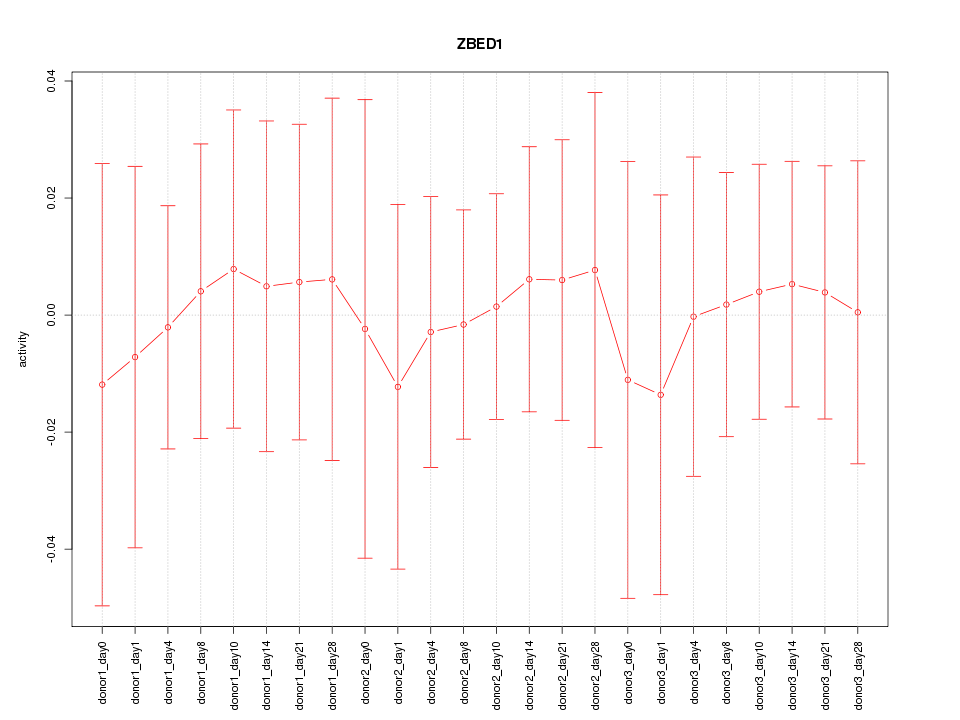
Activity-expression correlation:
| Gene Symbol | Promoter | Pearson corr. coef. | P-value | Plot |
|---|---|---|---|---|
| ZBED1 | hg19_v2_chrX_-_2418596_2418621 | 0.62 | 1.4e-03 | Click! |

Top targets:
Gene overrepresentation in biological_process category:
| Log-likelihood per target | Total log-likelihood | Term | Description |
|---|---|---|---|
| 0.0 | 0.3 | GO:0000710 | meiotic mismatch repair(GO:0000710) |
| 0.0 | 0.1 | GO:0071596 | ubiquitin-dependent protein catabolic process via the N-end rule pathway(GO:0071596) |
| 0.0 | 0.2 | GO:0045347 | negative regulation of MHC class II biosynthetic process(GO:0045347) |
| 0.0 | 0.1 | GO:0015742 | alpha-ketoglutarate transport(GO:0015742) |
Gene overrepresentation in cellular_component category:
| Log-likelihood per target | Total log-likelihood | Term | Description |
|---|---|---|---|
| 0.1 | 0.3 | GO:0032301 | MutSalpha complex(GO:0032301) |
| 0.0 | 0.3 | GO:0071004 | U2-type prespliceosome(GO:0071004) |
Gene overrepresentation in molecular_function category:
| Log-likelihood per target | Total log-likelihood | Term | Description |
|---|---|---|---|
| 0.1 | 0.3 | GO:0032143 | single thymine insertion binding(GO:0032143) |
| 0.0 | 0.1 | GO:0015140 | malate transmembrane transporter activity(GO:0015140) |