Project
avrg: GSE58827: Dynamics of the Mouse Liver
Navigation
Downloads
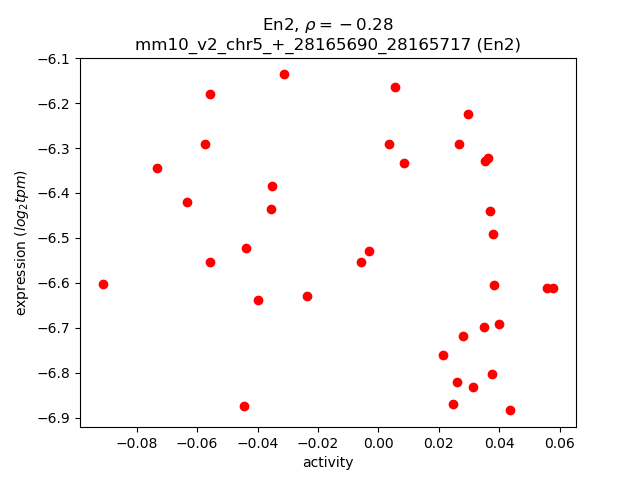
Results for En2
Z-value: 1.45
Motif logo

Transcription factors associated with En2
| Gene Symbol | Gene ID | Gene Info |
|---|---|---|
|
En2
|
ENSMUSG00000039095.7 | engrailed 2 |
Activity-expression correlation:
| Gene | Promoter | Pearson corr. coef. | P-value | Plot |
|---|---|---|---|---|
| En2 | mm10_v2_chr5_+_28165690_28165717 | -0.28 | 9.4e-02 | Click! |
Activity profile of En2 motif
Sorted Z-values of En2 motif
| Promoter | Log-likelihood | Transcript | Gene | Gene Info |
|---|---|---|---|---|
| chr10_+_127898515 | 9.28 |
ENSMUST00000047134.7
|
Sdr9c7
|
4short chain dehydrogenase/reductase family 9C, member 7 |
| chr3_+_60081861 | 5.10 |
ENSMUST00000029326.5
|
Sucnr1
|
succinate receptor 1 |
| chr10_-_109010955 | 4.28 |
ENSMUST00000105276.1
ENSMUST00000064054.7 |
Syt1
|
synaptotagmin I |
| chr19_-_7966000 | 4.14 |
ENSMUST00000182102.1
ENSMUST00000075619.4 |
Slc22a27
|
solute carrier family 22, member 27 |
| chr2_-_148045891 | 3.38 |
ENSMUST00000109964.1
|
Foxa2
|
forkhead box A2 |
| chr1_+_127729405 | 3.36 |
ENSMUST00000038006.6
|
Acmsd
|
amino carboxymuconate semialdehyde decarboxylase |
| chr5_+_135106881 | 3.15 |
ENSMUST00000005507.3
|
Mlxipl
|
MLX interacting protein-like |
| chr17_-_83846769 | 3.05 |
ENSMUST00000000687.7
|
Haao
|
3-hydroxyanthranilate 3,4-dioxygenase |
| chr14_+_33941021 | 2.94 |
ENSMUST00000100720.1
|
Gdf2
|
growth differentiation factor 2 |
| chr12_-_84450944 | 2.91 |
ENSMUST00000085192.5
|
Aldh6a1
|
aldehyde dehydrogenase family 6, subfamily A1 |
| chr14_+_55560480 | 2.84 |
ENSMUST00000121622.1
ENSMUST00000143431.1 ENSMUST00000150481.1 |
Dcaf11
|
DDB1 and CUL4 associated factor 11 |
| chr14_+_55560904 | 2.59 |
ENSMUST00000072530.4
ENSMUST00000128490.1 |
Dcaf11
|
DDB1 and CUL4 associated factor 11 |
| chr6_-_54992946 | 2.58 |
ENSMUST00000131475.1
|
Ggct
|
gamma-glutamyl cyclotransferase |
| chr7_+_44590886 | 2.55 |
ENSMUST00000107906.3
|
Kcnc3
|
potassium voltage gated channel, Shaw-related subfamily, member 3 |
| chr5_-_77115145 | 2.53 |
ENSMUST00000081964.5
|
Hopx
|
HOP homeobox |
| chr8_-_45382198 | 2.53 |
ENSMUST00000093526.6
|
Fam149a
|
family with sequence similarity 149, member A |
| chr3_+_62419668 | 2.46 |
ENSMUST00000161057.1
|
Arhgef26
|
Rho guanine nucleotide exchange factor (GEF) 26 |
| chrM_+_10167 | 2.34 |
ENSMUST00000082414.1
|
mt-Nd4
|
mitochondrially encoded NADH dehydrogenase 4 |
| chr17_+_35424870 | 2.29 |
ENSMUST00000113879.3
|
H2-Q6
|
histocompatibility 2, Q region locus 6 |
| chr2_+_30364262 | 2.27 |
ENSMUST00000142801.1
ENSMUST00000100214.3 |
Fam73b
|
family with sequence similarity 73, member B |
| chr2_+_30364227 | 2.20 |
ENSMUST00000077977.7
ENSMUST00000140075.2 |
Fam73b
|
family with sequence similarity 73, member B |
| chr13_-_23574196 | 2.14 |
ENSMUST00000105106.1
|
Hist1h2bf
|
histone cluster 1, H2bf |
| chr8_-_83955205 | 2.14 |
ENSMUST00000098595.2
|
Gm10644
|
predicted gene 10644 |
| chr10_-_92375367 | 2.04 |
ENSMUST00000182870.1
|
Gm20757
|
predicted gene, 20757 |
| chr18_+_84851338 | 2.02 |
ENSMUST00000160180.1
|
Cyb5
|
cytochrome b-5 |
| chr2_+_109917639 | 2.01 |
ENSMUST00000046548.7
ENSMUST00000111037.2 |
Lgr4
|
leucine-rich repeat-containing G protein-coupled receptor 4 |
| chr17_+_35424842 | 1.99 |
ENSMUST00000174699.1
|
H2-Q6
|
histocompatibility 2, Q region locus 6 |
| chr15_+_100353149 | 1.97 |
ENSMUST00000075675.5
ENSMUST00000088142.5 ENSMUST00000176287.1 |
AB099516
Mettl7a2
|
cDNA sequence AB099516 methyltransferase like 7A2 |
| chrM_+_7005 | 1.93 |
ENSMUST00000082405.1
|
mt-Co2
|
mitochondrially encoded cytochrome c oxidase II |
| chr6_-_146502141 | 1.91 |
ENSMUST00000079573.6
ENSMUST00000139732.1 |
Itpr2
|
inositol 1,4,5-triphosphate receptor 2 |
| chr4_-_129261394 | 1.88 |
ENSMUST00000145261.1
|
C77080
|
expressed sequence C77080 |
| chr9_-_71163224 | 1.86 |
ENSMUST00000074465.2
|
Aqp9
|
aquaporin 9 |
| chr17_-_34959232 | 1.83 |
ENSMUST00000165202.1
ENSMUST00000172753.1 |
Hspa1b
|
heat shock protein 1B |
| chr2_+_118861954 | 1.78 |
ENSMUST00000028807.5
|
Ivd
|
isovaleryl coenzyme A dehydrogenase |
| chrM_+_9870 | 1.77 |
ENSMUST00000084013.1
|
mt-Nd4l
|
mitochondrially encoded NADH dehydrogenase 4L |
| chr6_+_37870786 | 1.75 |
ENSMUST00000120428.1
ENSMUST00000031859.7 |
Trim24
|
tripartite motif-containing 24 |
| chr10_+_39612934 | 1.75 |
ENSMUST00000019987.6
|
Traf3ip2
|
TRAF3 interacting protein 2 |
| chr18_+_38993126 | 1.72 |
ENSMUST00000097593.2
|
Arhgap26
|
Rho GTPase activating protein 26 |
| chrM_+_3906 | 1.71 |
ENSMUST00000082396.1
|
mt-Nd2
|
mitochondrially encoded NADH dehydrogenase 2 |
| chr4_-_63154130 | 1.62 |
ENSMUST00000030041.4
|
Ambp
|
alpha 1 microglobulin/bikunin |
| chr14_+_55559993 | 1.61 |
ENSMUST00000117236.1
|
Dcaf11
|
DDB1 and CUL4 associated factor 11 |
| chr17_-_36032682 | 1.61 |
ENSMUST00000102678.4
|
H2-T23
|
histocompatibility 2, T region locus 23 |
| chr6_-_126645784 | 1.61 |
ENSMUST00000055168.3
|
Kcna1
|
potassium voltage-gated channel, shaker-related subfamily, member 1 |
| chr17_-_34305715 | 1.60 |
ENSMUST00000174074.1
|
Gm20513
|
predicted gene 20513 |
| chr19_+_25406661 | 1.60 |
ENSMUST00000146647.1
|
Kank1
|
KN motif and ankyrin repeat domains 1 |
| chr10_-_127121125 | 1.59 |
ENSMUST00000164259.1
ENSMUST00000080975.4 |
Os9
|
amplified in osteosarcoma |
| chr11_-_71019233 | 1.59 |
ENSMUST00000108523.3
ENSMUST00000143850.1 |
Derl2
|
Der1-like domain family, member 2 |
| chr15_-_101892916 | 1.57 |
ENSMUST00000100179.1
|
Krt76
|
keratin 76 |
| chr2_+_116067213 | 1.55 |
ENSMUST00000152412.1
|
G630016G05Rik
|
RIKEN cDNA G630016G05 gene |
| chr18_+_56432116 | 1.54 |
ENSMUST00000070166.5
|
Gramd3
|
GRAM domain containing 3 |
| chr14_+_55560010 | 1.54 |
ENSMUST00000147981.1
ENSMUST00000133256.1 |
Dcaf11
|
DDB1 and CUL4 associated factor 11 |
| chr5_-_137684665 | 1.52 |
ENSMUST00000100544.4
ENSMUST00000031736.9 ENSMUST00000151839.1 |
Agfg2
|
ArfGAP with FG repeats 2 |
| chr7_+_64501687 | 1.46 |
ENSMUST00000032732.8
|
Apba2
|
amyloid beta (A4) precursor protein-binding, family A, member 2 |
| chr2_+_20737306 | 1.42 |
ENSMUST00000114606.1
ENSMUST00000114608.1 |
Etl4
|
enhancer trap locus 4 |
| chr10_-_107486077 | 1.36 |
ENSMUST00000000445.1
|
Myf5
|
myogenic factor 5 |
| chrX_-_60893430 | 1.35 |
ENSMUST00000135107.2
|
Sox3
|
SRY-box containing gene 3 |
| chr7_-_119895446 | 1.35 |
ENSMUST00000098080.2
|
Dcun1d3
|
DCN1, defective in cullin neddylation 1, domain containing 3 (S. cerevisiae) |
| chr16_+_38089001 | 1.33 |
ENSMUST00000023507.6
|
Gsk3b
|
glycogen synthase kinase 3 beta |
| chr1_+_132298606 | 1.33 |
ENSMUST00000046071.4
|
Klhdc8a
|
kelch domain containing 8A |
| chr3_+_108653931 | 1.31 |
ENSMUST00000029483.8
ENSMUST00000124384.1 |
Clcc1
|
chloride channel CLIC-like 1 |
| chrX_+_57212110 | 1.30 |
ENSMUST00000033466.1
|
Cd40lg
|
CD40 ligand |
| chr5_-_62766153 | 1.29 |
ENSMUST00000076623.4
|
Arap2
|
ArfGAP with RhoGAP domain, ankyrin repeat and PH domain 2 |
| chr17_-_12960306 | 1.28 |
ENSMUST00000159697.1
|
Acat2
|
acetyl-Coenzyme A acetyltransferase 2 |
| chr11_-_86993682 | 1.27 |
ENSMUST00000018571.4
|
Ypel2
|
yippee-like 2 (Drosophila) |
| chr12_-_56613270 | 1.27 |
ENSMUST00000072631.5
|
Nkx2-9
|
NK2 homeobox 9 |
| chr14_-_55560340 | 1.26 |
ENSMUST00000066106.3
|
A730061H03Rik
|
RIKEN cDNA A730061H03 gene |
| chr17_+_3397189 | 1.26 |
ENSMUST00000072156.6
|
Tiam2
|
T cell lymphoma invasion and metastasis 2 |
| chrM_+_9452 | 1.24 |
ENSMUST00000082411.1
|
mt-Nd3
|
mitochondrially encoded NADH dehydrogenase 3 |
| chr9_+_104063678 | 1.20 |
ENSMUST00000047799.5
|
Acad11
|
acyl-Coenzyme A dehydrogenase family, member 11 |
| chr4_+_150853919 | 1.20 |
ENSMUST00000073600.2
|
Errfi1
|
ERBB receptor feedback inhibitor 1 |
| chrX_+_129749740 | 1.19 |
ENSMUST00000167619.2
ENSMUST00000037854.8 |
Diap2
|
diaphanous homolog 2 (Drosophila) |
| chr9_+_43829963 | 1.17 |
ENSMUST00000180221.1
|
Gm3898
|
predicted gene 3898 |
| chr16_+_22857845 | 1.15 |
ENSMUST00000004574.7
ENSMUST00000178320.1 ENSMUST00000166487.2 |
Dnajb11
|
DnaJ (Hsp40) homolog, subfamily B, member 11 |
| chr13_-_23710714 | 1.14 |
ENSMUST00000091707.6
ENSMUST00000006787.7 ENSMUST00000091706.6 |
Hfe
|
hemochromatosis |
| chr2_-_173276144 | 1.12 |
ENSMUST00000139306.1
|
Pmepa1
|
prostate transmembrane protein, androgen induced 1 |
| chr3_-_79841729 | 1.11 |
ENSMUST00000168038.1
|
Tmem144
|
transmembrane protein 144 |
| chr5_-_62765618 | 1.10 |
ENSMUST00000159470.1
|
Arap2
|
ArfGAP with RhoGAP domain, ankyrin repeat and PH domain 2 |
| chr11_-_118212715 | 1.10 |
ENSMUST00000106302.2
ENSMUST00000151165.1 |
Cyth1
|
cytohesin 1 |
| chr13_+_34734837 | 1.10 |
ENSMUST00000039605.6
|
Fam50b
|
family with sequence similarity 50, member B |
| chrM_+_7759 | 1.08 |
ENSMUST00000082407.1
ENSMUST00000082408.1 |
mt-Atp8
mt-Atp6
|
mitochondrially encoded ATP synthase 8 mitochondrially encoded ATP synthase 6 |
| chr7_+_64502090 | 1.07 |
ENSMUST00000137732.1
|
Apba2
|
amyloid beta (A4) precursor protein-binding, family A, member 2 |
| chr4_+_150237694 | 1.04 |
ENSMUST00000141931.1
|
Eno1
|
enolase 1, alpha non-neuron |
| chr8_-_70139197 | 1.02 |
ENSMUST00000075724.7
|
Rfxank
|
regulatory factor X-associated ankyrin-containing protein |
| chr3_-_32491969 | 1.01 |
ENSMUST00000164954.1
|
Kcnmb3
|
potassium large conductance calcium-activated channel, subfamily M, beta member 3 |
| chrM_+_8600 | 1.00 |
ENSMUST00000082409.1
|
mt-Co3
|
mitochondrially encoded cytochrome c oxidase III |
| chr12_-_91849081 | 0.99 |
ENSMUST00000167466.1
ENSMUST00000021347.5 ENSMUST00000178462.1 |
Sel1l
|
sel-1 suppressor of lin-12-like (C. elegans) |
| chr7_+_5015466 | 0.99 |
ENSMUST00000086349.3
|
Zfp524
|
zinc finger protein 524 |
| chrX_+_152001845 | 0.99 |
ENSMUST00000026289.3
ENSMUST00000112617.3 |
Hsd17b10
|
hydroxysteroid (17-beta) dehydrogenase 10 |
| chr9_+_104063376 | 0.98 |
ENSMUST00000120854.1
|
Acad11
|
acyl-Coenzyme A dehydrogenase family, member 11 |
| chr11_+_99873389 | 0.97 |
ENSMUST00000093936.3
|
Krtap9-1
|
keratin associated protein 9-1 |
| chr17_-_34972124 | 0.97 |
ENSMUST00000087328.2
ENSMUST00000179128.1 |
Hspa1a
|
heat shock protein 1A |
| chr8_+_106150359 | 0.95 |
ENSMUST00000034377.6
|
Pla2g15
|
phospholipase A2, group XV |
| chr7_+_103550368 | 0.95 |
ENSMUST00000106888.1
|
Olfr613
|
olfactory receptor 613 |
| chr1_-_172632931 | 0.94 |
ENSMUST00000027826.5
|
Dusp23
|
dual specificity phosphatase 23 |
| chr7_+_64501949 | 0.93 |
ENSMUST00000138829.1
|
Apba2
|
amyloid beta (A4) precursor protein-binding, family A, member 2 |
| chr3_-_92123943 | 0.93 |
ENSMUST00000070284.3
|
Prr9
|
proline rich 9 |
| chr9_+_78448192 | 0.91 |
ENSMUST00000034896.6
|
Mto1
|
mitochondrial translation optimization 1 homolog (S. cerevisiae) |
| chr9_+_32116040 | 0.90 |
ENSMUST00000174641.1
|
Arhgap32
|
Rho GTPase activating protein 32 |
| chr19_-_6942406 | 0.90 |
ENSMUST00000099782.3
|
Gpr137
|
G protein-coupled receptor 137 |
| chr19_-_3575708 | 0.89 |
ENSMUST00000113997.2
ENSMUST00000025846.8 ENSMUST00000172362.1 |
Ppp6r3
|
protein phosphatase 6, regulatory subunit 3 |
| chr7_-_105399991 | 0.87 |
ENSMUST00000118726.1
ENSMUST00000074686.7 ENSMUST00000122327.1 ENSMUST00000179474.1 ENSMUST00000048079.6 |
Fam160a2
|
family with sequence similarity 160, member A2 |
| chr15_+_100334929 | 0.87 |
ENSMUST00000075420.4
|
Mettl7a3
|
methyltransferase like 7A3 |
| chr15_+_100364542 | 0.87 |
ENSMUST00000175683.1
ENSMUST00000177211.1 ENSMUST00000108953.2 |
Higd1c
AB099516
|
HIG1 domain family, member 1C cDNA sequence AB099516 |
| chr19_+_3851797 | 0.87 |
ENSMUST00000072055.6
|
Chka
|
choline kinase alpha |
| chr11_-_31671863 | 0.86 |
ENSMUST00000058060.7
|
Bod1
|
biorientation of chromosomes in cell division 1 |
| chr19_+_3851972 | 0.86 |
ENSMUST00000025760.6
|
Chka
|
choline kinase alpha |
| chr9_-_96719549 | 0.84 |
ENSMUST00000128269.1
|
Zbtb38
|
zinc finger and BTB domain containing 38 |
| chr5_-_74531619 | 0.84 |
ENSMUST00000113542.2
ENSMUST00000072857.6 ENSMUST00000121330.1 ENSMUST00000151474.1 |
Scfd2
|
Sec1 family domain containing 2 |
| chr19_+_6046576 | 0.81 |
ENSMUST00000138532.1
ENSMUST00000129081.1 ENSMUST00000156550.1 |
Syvn1
|
synovial apoptosis inhibitor 1, synoviolin |
| chr4_-_14621669 | 0.81 |
ENSMUST00000143105.1
|
Slc26a7
|
solute carrier family 26, member 7 |
| chr5_+_88583527 | 0.81 |
ENSMUST00000031229.6
|
Rufy3
|
RUN and FYVE domain containing 3 |
| chrX_+_160768179 | 0.81 |
ENSMUST00000112368.2
|
Rs1
|
retinoschisis (X-linked, juvenile) 1 (human) |
| chr11_+_116843278 | 0.77 |
ENSMUST00000106370.3
|
Mettl23
|
methyltransferase like 23 |
| chr7_+_102210335 | 0.77 |
ENSMUST00000140631.1
ENSMUST00000120879.1 ENSMUST00000146996.1 |
Pgap2
|
post-GPI attachment to proteins 2 |
| chr9_+_21955747 | 0.77 |
ENSMUST00000053583.5
|
Swsap1
|
SWIM type zinc finger 7 associated protein 1 |
| chr6_+_8948608 | 0.77 |
ENSMUST00000160300.1
|
Nxph1
|
neurexophilin 1 |
| chr4_+_108719649 | 0.76 |
ENSMUST00000178992.1
|
3110021N24Rik
|
RIKEN cDNA 3110021N24 gene |
| chr2_-_84715160 | 0.75 |
ENSMUST00000035840.5
|
Zdhhc5
|
zinc finger, DHHC domain containing 5 |
| chrX_+_160768013 | 0.75 |
ENSMUST00000033650.7
|
Rs1
|
retinoschisis (X-linked, juvenile) 1 (human) |
| chr14_+_53461099 | 0.75 |
ENSMUST00000181728.1
|
Trav7-4
|
T cell receptor alpha variable 7-4 |
| chr11_-_99374895 | 0.75 |
ENSMUST00000006963.2
|
Krt28
|
keratin 28 |
| chr19_-_28967794 | 0.73 |
ENSMUST00000162110.1
|
4430402I18Rik
|
RIKEN cDNA 4430402I18 gene |
| chr8_+_94037198 | 0.73 |
ENSMUST00000109556.2
ENSMUST00000093301.2 ENSMUST00000060632.7 |
Ogfod1
|
2-oxoglutarate and iron-dependent oxygenase domain containing 1 |
| chrX_-_136741155 | 0.69 |
ENSMUST00000166930.1
ENSMUST00000113095.1 ENSMUST00000155207.1 ENSMUST00000080411.6 ENSMUST00000169418.1 |
Morf4l2
|
mortality factor 4 like 2 |
| chr11_+_75532099 | 0.69 |
ENSMUST00000169547.2
|
Slc43a2
|
solute carrier family 43, member 2 |
| chr16_+_45093611 | 0.68 |
ENSMUST00000099498.2
|
Ccdc80
|
coiled-coil domain containing 80 |
| chr11_-_99337930 | 0.68 |
ENSMUST00000100482.2
|
Krt26
|
keratin 26 |
| chrM_+_2743 | 0.66 |
ENSMUST00000082392.1
|
mt-Nd1
|
mitochondrially encoded NADH dehydrogenase 1 |
| chr14_-_50681645 | 0.66 |
ENSMUST00000078075.4
|
Olfr747
|
olfactory receptor 747 |
| chr2_-_146511899 | 0.66 |
ENSMUST00000131824.1
|
Ralgapa2
|
Ral GTPase activating protein, alpha subunit 2 (catalytic) |
| chr11_+_11114125 | 0.66 |
ENSMUST00000109681.1
|
Vwc2
|
von Willebrand factor C domain containing 2 |
| chr7_+_79273201 | 0.66 |
ENSMUST00000037315.6
|
Abhd2
|
abhydrolase domain containing 2 |
| chr17_+_45734506 | 0.64 |
ENSMUST00000180558.1
|
F630040K05Rik
|
RIKEN cDNA F630040K05 gene |
| chr11_-_99322943 | 0.63 |
ENSMUST00000038004.2
|
Krt25
|
keratin 25 |
| chr9_+_107563246 | 0.62 |
ENSMUST00000010198.3
|
Tusc2
|
tumor suppressor candidate 2 |
| chr10_+_59403644 | 0.62 |
ENSMUST00000009790.7
|
Pla2g12b
|
phospholipase A2, group XIIB |
| chr12_+_35047180 | 0.61 |
ENSMUST00000048519.9
ENSMUST00000163677.1 |
Snx13
|
sorting nexin 13 |
| chr7_-_99141068 | 0.60 |
ENSMUST00000037968.8
|
Uvrag
|
UV radiation resistance associated gene |
| chr4_+_42949814 | 0.58 |
ENSMUST00000037872.3
ENSMUST00000098112.2 |
Dnajb5
|
DnaJ (Hsp40) homolog, subfamily B, member 5 |
| chr8_-_84662841 | 0.57 |
ENSMUST00000060427.4
|
Ier2
|
immediate early response 2 |
| chr10_+_73821937 | 0.57 |
ENSMUST00000134009.2
ENSMUST00000125006.2 ENSMUST00000177420.1 |
Pcdh15
|
protocadherin 15 |
| chr12_-_104473236 | 0.57 |
ENSMUST00000021513.4
|
Gsc
|
goosecoid homeobox |
| chr11_+_23306884 | 0.56 |
ENSMUST00000180046.1
|
Usp34
|
ubiquitin specific peptidase 34 |
| chr8_-_83594440 | 0.56 |
ENSMUST00000019382.9
ENSMUST00000165740.1 |
Tecr
|
trans-2,3-enoyl-CoA reductase |
| chr14_+_52769753 | 0.55 |
ENSMUST00000178768.2
|
Trav7d-4
|
T cell receptor alpha variable 7D-4 |
| chr11_-_31671727 | 0.53 |
ENSMUST00000109415.1
|
Bod1
|
biorientation of chromosomes in cell division 1 |
| chr4_-_14621494 | 0.53 |
ENSMUST00000149633.1
|
Slc26a7
|
solute carrier family 26, member 7 |
| chr12_-_91779129 | 0.53 |
ENSMUST00000170077.1
|
Ston2
|
stonin 2 |
| chr2_-_144527341 | 0.52 |
ENSMUST00000163701.1
ENSMUST00000081982.5 |
Dzank1
|
double zinc ribbon and ankyrin repeat domains 1 |
| chr7_-_25754701 | 0.51 |
ENSMUST00000108401.1
ENSMUST00000043765.7 |
Hnrnpul1
|
heterogeneous nuclear ribonucleoprotein U-like 1 |
| chr10_-_40142247 | 0.50 |
ENSMUST00000092566.6
|
Slc16a10
|
solute carrier family 16 (monocarboxylic acid transporters), member 10 |
| chr1_-_131527302 | 0.49 |
ENSMUST00000097588.2
|
Srgap2
|
SLIT-ROBO Rho GTPase activating protein 2 |
| chr8_-_83594405 | 0.47 |
ENSMUST00000163837.1
|
Tecr
|
trans-2,3-enoyl-CoA reductase |
| chr5_-_106696530 | 0.47 |
ENSMUST00000137285.1
ENSMUST00000124263.1 ENSMUST00000112695.1 ENSMUST00000155495.1 ENSMUST00000135108.1 |
Zfp644
|
zinc finger protein 644 |
| chr15_-_76243401 | 0.47 |
ENSMUST00000165738.1
ENSMUST00000075689.6 |
Parp10
|
poly (ADP-ribose) polymerase family, member 10 |
| chr2_-_17460610 | 0.47 |
ENSMUST00000145492.1
|
Nebl
|
nebulette |
| chr15_-_101573883 | 0.46 |
ENSMUST00000042957.5
|
Krt75
|
keratin 75 |
| chr9_-_96719404 | 0.46 |
ENSMUST00000140121.1
|
Zbtb38
|
zinc finger and BTB domain containing 38 |
| chr10_+_73821857 | 0.45 |
ENSMUST00000177128.1
ENSMUST00000064562.7 ENSMUST00000129404.2 ENSMUST00000105426.3 ENSMUST00000131321.2 ENSMUST00000126920.2 ENSMUST00000147189.2 ENSMUST00000105424.3 ENSMUST00000092420.6 ENSMUST00000105429.3 ENSMUST00000131724.2 ENSMUST00000152655.2 ENSMUST00000151116.2 ENSMUST00000155701.2 ENSMUST00000152819.2 ENSMUST00000125517.2 ENSMUST00000124046.1 ENSMUST00000149977.2 ENSMUST00000146682.1 ENSMUST00000177107.1 |
Pcdh15
|
protocadherin 15 |
| chr5_-_106696819 | 0.45 |
ENSMUST00000127434.1
ENSMUST00000112696.1 ENSMUST00000112698.1 |
Zfp644
|
zinc finger protein 644 |
| chr16_-_45724600 | 0.44 |
ENSMUST00000096057.4
|
Tagln3
|
transgelin 3 |
| chr8_+_106603351 | 0.44 |
ENSMUST00000000312.5
ENSMUST00000167688.1 |
Cdh1
|
cadherin 1 |
| chr8_+_13907748 | 0.44 |
ENSMUST00000043520.3
|
Fbxo25
|
F-box protein 25 |
| chr5_-_137531204 | 0.43 |
ENSMUST00000150063.2
|
Gnb2
|
guanine nucleotide binding protein (G protein), beta 2 |
| chr1_+_131527901 | 0.42 |
ENSMUST00000068613.4
|
Fam72a
|
family with sequence similarity 72, member A |
| chr4_-_155056784 | 0.42 |
ENSMUST00000131173.2
|
Plch2
|
phospholipase C, eta 2 |
| chr15_+_80255184 | 0.42 |
ENSMUST00000109605.3
|
Atf4
|
activating transcription factor 4 |
| chr1_+_104768510 | 0.42 |
ENSMUST00000062528.8
|
Cdh20
|
cadherin 20 |
| chr6_+_28480337 | 0.42 |
ENSMUST00000001460.7
ENSMUST00000167201.1 |
Snd1
|
staphylococcal nuclease and tudor domain containing 1 |
| chr8_-_90908415 | 0.41 |
ENSMUST00000098517.1
|
Gm6658
|
predicted gene 6658 |
| chr11_+_120467635 | 0.40 |
ENSMUST00000140862.1
ENSMUST00000106205.1 ENSMUST00000106203.1 ENSMUST00000026900.7 |
Hgs
|
HGF-regulated tyrosine kinase substrate |
| chr11_-_59839745 | 0.39 |
ENSMUST00000141415.1
|
Cops3
|
COP9 (constitutive photomorphogenic) homolog, subunit 3 (Arabidopsis thaliana) |
| chr2_-_92540967 | 0.39 |
ENSMUST00000142249.2
|
Gm13817
|
predicted gene 13817 |
| chr2_+_144527718 | 0.38 |
ENSMUST00000028914.2
ENSMUST00000110017.2 |
Polr3f
|
polymerase (RNA) III (DNA directed) polypeptide F |
| chrX_+_136741821 | 0.37 |
ENSMUST00000089350.4
|
BC065397
|
cDNA sequence BC065397 |
| chr13_-_92030897 | 0.37 |
ENSMUST00000149630.1
|
Rasgrf2
|
RAS protein-specific guanine nucleotide-releasing factor 2 |
| chr8_-_84237042 | 0.37 |
ENSMUST00000039480.5
|
Zswim4
|
zinc finger SWIM-type containing 4 |
| chrM_+_11734 | 0.36 |
ENSMUST00000082418.1
|
mt-Nd5
|
mitochondrially encoded NADH dehydrogenase 5 |
| chr11_-_70687917 | 0.36 |
ENSMUST00000108545.2
ENSMUST00000120261.1 ENSMUST00000036299.7 ENSMUST00000119120.1 ENSMUST00000100933.3 |
Camta2
|
calmodulin binding transcription activator 2 |
| chr5_+_139543889 | 0.34 |
ENSMUST00000174792.1
ENSMUST00000031523.8 |
Uncx
|
UNC homeobox |
| chr10_+_128337761 | 0.34 |
ENSMUST00000005826.7
|
Cs
|
citrate synthase |
| chr1_-_171287916 | 0.33 |
ENSMUST00000111305.1
|
Usp21
|
ubiquitin specific peptidase 21 |
| chr11_+_69059750 | 0.33 |
ENSMUST00000051888.2
|
2310047M10Rik
|
RIKEN cDNA 2310047M10 gene |
| chr2_-_87492418 | 0.33 |
ENSMUST00000026957.3
|
Pramel7
|
preferentially expressed antigen in melanoma like 7 |
| chr15_+_102406143 | 0.33 |
ENSMUST00000170884.1
ENSMUST00000165924.1 ENSMUST00000163709.1 ENSMUST00000001326.6 |
Sp1
|
trans-acting transcription factor 1 |
| chr1_-_171287931 | 0.32 |
ENSMUST00000111306.3
ENSMUST00000065941.5 |
Usp21
|
ubiquitin specific peptidase 21 |
| chr4_+_116221590 | 0.32 |
ENSMUST00000147292.1
|
Pik3r3
|
phosphatidylinositol 3 kinase, regulatory subunit, polypeptide 3 (p55) |
| chr5_-_84417359 | 0.31 |
ENSMUST00000113401.1
|
Epha5
|
Eph receptor A5 |
| chr11_-_70688097 | 0.30 |
ENSMUST00000108544.1
|
Camta2
|
calmodulin binding transcription activator 2 |
| chr12_-_85151264 | 0.30 |
ENSMUST00000019379.7
|
Rps6kl1
|
ribosomal protein S6 kinase-like 1 |
| chr17_-_24886304 | 0.30 |
ENSMUST00000044252.5
|
Nubp2
|
nucleotide binding protein 2 |
| chr4_+_136310936 | 0.29 |
ENSMUST00000131671.1
|
Hnrnpr
|
heterogeneous nuclear ribonucleoprotein R |
| chr12_+_84451485 | 0.29 |
ENSMUST00000137170.1
|
Lin52
|
lin-52 homolog (C. elegans) |
| chr10_+_99263224 | 0.27 |
ENSMUST00000020118.4
|
Dusp6
|
dual specificity phosphatase 6 |
| chr11_+_102285161 | 0.27 |
ENSMUST00000156326.1
|
Tmub2
|
transmembrane and ubiquitin-like domain containing 2 |
| chr7_+_29071597 | 0.27 |
ENSMUST00000180926.1
|
Gm26604
|
predicted gene, 26604 |
| chrX_+_102119447 | 0.27 |
ENSMUST00000113627.3
|
Pin4
|
protein (peptidyl-prolyl cis/trans isomerase) NIMA-interacting, 4 (parvulin) |
| chr19_+_6942501 | 0.27 |
ENSMUST00000113423.3
|
Bad
|
BCL2-associated agonist of cell death |
| chr17_+_20945311 | 0.26 |
ENSMUST00000007708.7
|
Ppp2r1a
|
protein phosphatase 2 (formerly 2A), regulatory subunit A (PR 65), alpha isoform |
| chr7_+_90380646 | 0.23 |
ENSMUST00000098310.2
|
Sytl2
|
synaptotagmin-like 2 |
Network of associatons between targets according to the STRING database.

First level regulatory network of En2
Gene Ontology Analysis
Gene overrepresentation in biological process category:
| Log-likelihood per target | Total log-likelihood | Term | Description |
|---|---|---|---|
| 1.1 | 3.4 | GO:0045014 | carbon catabolite repression of transcription(GO:0045013) negative regulation of transcription by glucose(GO:0045014) |
| 1.0 | 2.9 | GO:0006210 | pyrimidine nucleobase catabolic process(GO:0006208) thymine catabolic process(GO:0006210) thymine metabolic process(GO:0019859) |
| 0.8 | 6.4 | GO:0046874 | quinolinate metabolic process(GO:0046874) |
| 0.7 | 2.0 | GO:0061290 | cell-cell signaling involved in kidney development(GO:0060995) Wnt signaling pathway involved in kidney development(GO:0061289) canonical Wnt signaling pathway involved in metanephric kidney development(GO:0061290) cell-cell signaling involved in metanephros development(GO:0072204) |
| 0.6 | 1.1 | GO:0002589 | regulation of antigen processing and presentation of peptide antigen via MHC class I(GO:0002589) |
| 0.5 | 1.6 | GO:2000393 | negative regulation of lamellipodium morphogenesis(GO:2000393) |
| 0.5 | 5.3 | GO:0005513 | detection of calcium ion(GO:0005513) |
| 0.5 | 1.9 | GO:0015851 | nucleobase transport(GO:0015851) pyrimidine nucleobase transport(GO:0015855) |
| 0.4 | 3.1 | GO:0090324 | negative regulation of oxidative phosphorylation(GO:0090324) |
| 0.4 | 1.3 | GO:1904339 | negative regulation of dopaminergic neuron differentiation(GO:1904339) |
| 0.4 | 1.3 | GO:2001200 | positive regulation of dendritic cell differentiation(GO:2001200) |
| 0.4 | 1.6 | GO:0002489 | antigen processing and presentation of endogenous peptide antigen via MHC class Ib via ER pathway(GO:0002488) antigen processing and presentation of endogenous peptide antigen via MHC class Ib via ER pathway, TAP-dependent(GO:0002489) positive regulation of CD8-positive, alpha-beta T cell proliferation(GO:2000566) |
| 0.4 | 1.6 | GO:0050975 | sensory perception of touch(GO:0050975) |
| 0.4 | 1.6 | GO:0016062 | adaptation of rhodopsin mediated signaling(GO:0016062) light adaption(GO:0036367) |
| 0.3 | 1.0 | GO:0050973 | detection of mechanical stimulus involved in equilibrioception(GO:0050973) |
| 0.3 | 3.2 | GO:0070862 | negative regulation of protein exit from endoplasmic reticulum(GO:0070862) negative regulation of retrograde protein transport, ER to cytosol(GO:1904153) |
| 0.3 | 2.5 | GO:0043415 | positive regulation of skeletal muscle tissue regeneration(GO:0043415) |
| 0.3 | 4.1 | GO:0015747 | urate transport(GO:0015747) |
| 0.3 | 1.2 | GO:0042271 | susceptibility to natural killer cell mediated cytotoxicity(GO:0042271) |
| 0.3 | 1.8 | GO:0070562 | regulation of vitamin D receptor signaling pathway(GO:0070562) |
| 0.2 | 1.2 | GO:0042536 | negative regulation of tumor necrosis factor biosynthetic process(GO:0042536) |
| 0.2 | 0.9 | GO:1900864 | mitochondrial tRNA modification(GO:0070900) mitochondrial RNA modification(GO:1900864) |
| 0.2 | 1.4 | GO:0048743 | positive regulation of skeletal muscle fiber development(GO:0048743) |
| 0.2 | 4.1 | GO:0006120 | mitochondrial electron transport, NADH to ubiquinone(GO:0006120) |
| 0.2 | 1.7 | GO:0019695 | choline metabolic process(GO:0019695) |
| 0.2 | 0.6 | GO:0052564 | response to immune response of other organism involved in symbiotic interaction(GO:0052564) response to host immune response(GO:0052572) |
| 0.2 | 1.8 | GO:0006551 | leucine metabolic process(GO:0006551) |
| 0.2 | 1.3 | GO:0019532 | oxalate transport(GO:0019532) |
| 0.2 | 1.1 | GO:0010991 | negative regulation of SMAD protein complex assembly(GO:0010991) |
| 0.2 | 0.5 | GO:1900045 | negative regulation of protein K63-linked ubiquitination(GO:1900045) negative regulation of protein polyubiquitination(GO:1902915) |
| 0.1 | 1.6 | GO:0018298 | protein-chromophore linkage(GO:0018298) |
| 0.1 | 0.4 | GO:0060066 | oviduct development(GO:0060066) |
| 0.1 | 1.9 | GO:0071361 | cellular response to ethanol(GO:0071361) |
| 0.1 | 1.0 | GO:0034638 | phosphatidylcholine catabolic process(GO:0034638) |
| 0.1 | 2.9 | GO:0045603 | positive regulation of endothelial cell differentiation(GO:0045603) |
| 0.1 | 0.6 | GO:0051684 | maintenance of Golgi location(GO:0051684) |
| 0.1 | 1.3 | GO:0030300 | regulation of intestinal cholesterol absorption(GO:0030300) |
| 0.1 | 2.1 | GO:0002227 | innate immune response in mucosa(GO:0002227) |
| 0.1 | 0.7 | GO:0060178 | regulation of exocyst localization(GO:0060178) |
| 0.1 | 0.3 | GO:0006583 | melanin biosynthetic process from tyrosine(GO:0006583) |
| 0.1 | 1.6 | GO:0048733 | sebaceous gland development(GO:0048733) |
| 0.1 | 0.4 | GO:0036091 | positive regulation of transcription from RNA polymerase II promoter in response to oxidative stress(GO:0036091) |
| 0.1 | 2.5 | GO:0001886 | endothelial cell morphogenesis(GO:0001886) |
| 0.1 | 4.3 | GO:0002474 | antigen processing and presentation of peptide antigen via MHC class I(GO:0002474) |
| 0.1 | 2.2 | GO:0033539 | fatty acid beta-oxidation using acyl-CoA dehydrogenase(GO:0033539) |
| 0.1 | 0.3 | GO:1902220 | positive regulation of intrinsic apoptotic signaling pathway in response to osmotic stress(GO:1902220) |
| 0.1 | 1.8 | GO:0030970 | retrograde protein transport, ER to cytosol(GO:0030970) |
| 0.1 | 0.3 | GO:1903538 | meiotic sister chromatid cohesion, centromeric(GO:0051754) meiotic cell cycle process involved in oocyte maturation(GO:1903537) regulation of meiotic cell cycle process involved in oocyte maturation(GO:1903538) |
| 0.1 | 0.7 | GO:0006449 | regulation of translational termination(GO:0006449) |
| 0.1 | 1.4 | GO:0010225 | response to UV-C(GO:0010225) |
| 0.1 | 1.7 | GO:0002230 | positive regulation of defense response to virus by host(GO:0002230) |
| 0.1 | 1.0 | GO:0030497 | fatty acid elongation(GO:0030497) |
| 0.1 | 3.2 | GO:0042773 | ATP synthesis coupled electron transport(GO:0042773) |
| 0.1 | 0.5 | GO:0021815 | modulation of microtubule cytoskeleton involved in cerebral cortex radial glia guided migration(GO:0021815) |
| 0.1 | 0.4 | GO:0016056 | rhodopsin mediated signaling pathway(GO:0016056) |
| 0.1 | 0.8 | GO:2000114 | regulation of establishment of cell polarity(GO:2000114) |
| 0.1 | 1.4 | GO:0021854 | hypothalamus development(GO:0021854) |
| 0.0 | 1.2 | GO:0016556 | mRNA modification(GO:0016556) |
| 0.0 | 0.6 | GO:0014029 | neural crest formation(GO:0014029) |
| 0.0 | 0.4 | GO:0031547 | brain-derived neurotrophic factor receptor signaling pathway(GO:0031547) |
| 0.0 | 0.3 | GO:0070814 | hydrogen sulfide biosynthetic process(GO:0070814) |
| 0.0 | 1.1 | GO:0034219 | carbohydrate transmembrane transport(GO:0034219) |
| 0.0 | 1.0 | GO:0022904 | respiratory electron transport chain(GO:0022904) |
| 0.0 | 0.2 | GO:1902268 | negative regulation of polyamine transmembrane transport(GO:1902268) |
| 0.0 | 1.1 | GO:0032012 | ARF protein signal transduction(GO:0032011) regulation of ARF protein signal transduction(GO:0032012) |
| 0.0 | 0.3 | GO:0071372 | cellular response to follicle-stimulating hormone stimulus(GO:0071372) |
| 0.0 | 0.7 | GO:0032570 | response to progesterone(GO:0032570) |
| 0.0 | 0.3 | GO:0035726 | common myeloid progenitor cell proliferation(GO:0035726) |
| 0.0 | 1.1 | GO:0015986 | energy coupled proton transport, down electrochemical gradient(GO:0015985) ATP synthesis coupled proton transport(GO:0015986) |
| 0.0 | 2.6 | GO:0001836 | release of cytochrome c from mitochondria(GO:0001836) |
| 0.0 | 0.1 | GO:1903632 | positive regulation of aminoacyl-tRNA ligase activity(GO:1903632) |
| 0.0 | 1.5 | GO:0007339 | binding of sperm to zona pellucida(GO:0007339) |
| 0.0 | 0.3 | GO:0042663 | regulation of endodermal cell fate specification(GO:0042663) |
| 0.0 | 2.6 | GO:0046928 | regulation of neurotransmitter secretion(GO:0046928) |
| 0.0 | 0.2 | GO:0045218 | zonula adherens maintenance(GO:0045218) |
| 0.0 | 0.7 | GO:0033194 | response to hydroperoxide(GO:0033194) |
| 0.0 | 1.3 | GO:0008333 | endosome to lysosome transport(GO:0008333) |
| 0.0 | 1.1 | GO:0006904 | vesicle docking involved in exocytosis(GO:0006904) |
| 0.0 | 1.2 | GO:0071385 | cellular response to glucocorticoid stimulus(GO:0071385) |
| 0.0 | 0.8 | GO:0018345 | protein palmitoylation(GO:0018345) |
| 0.0 | 0.8 | GO:1902230 | negative regulation of intrinsic apoptotic signaling pathway in response to DNA damage(GO:1902230) |
| 0.0 | 0.7 | GO:0003299 | muscle hypertrophy in response to stress(GO:0003299) cardiac muscle hypertrophy in response to stress(GO:0014898) |
| 0.0 | 0.7 | GO:0071108 | protein K48-linked deubiquitination(GO:0071108) |
| 0.0 | 0.7 | GO:0016578 | histone deubiquitination(GO:0016578) |
| 0.0 | 0.6 | GO:0045109 | intermediate filament organization(GO:0045109) |
| 0.0 | 0.4 | GO:0000338 | protein deneddylation(GO:0000338) |
| 0.0 | 0.4 | GO:2000310 | regulation of N-methyl-D-aspartate selective glutamate receptor activity(GO:2000310) |
| 0.0 | 0.9 | GO:0018149 | peptide cross-linking(GO:0018149) |
| 0.0 | 0.4 | GO:0043968 | histone H2A acetylation(GO:0043968) |
| 0.0 | 0.3 | GO:0031163 | iron-sulfur cluster assembly(GO:0016226) metallo-sulfur cluster assembly(GO:0031163) |
| 0.0 | 0.3 | GO:0006107 | oxaloacetate metabolic process(GO:0006107) |
| 0.0 | 0.1 | GO:0033353 | S-adenosylmethionine cycle(GO:0033353) |
| 0.0 | 0.5 | GO:0043551 | regulation of phosphatidylinositol 3-kinase activity(GO:0043551) |
| 0.0 | 1.3 | GO:0006821 | chloride transport(GO:0006821) |
| 0.0 | 0.8 | GO:0015807 | L-amino acid transport(GO:0015807) |
| 0.0 | 0.3 | GO:0061157 | mRNA destabilization(GO:0061157) |
| 0.0 | 0.5 | GO:0048488 | synaptic vesicle endocytosis(GO:0048488) |
| 0.0 | 0.3 | GO:1903963 | arachidonic acid secretion(GO:0050482) arachidonate transport(GO:1903963) |
| 0.0 | 0.7 | GO:0030514 | negative regulation of BMP signaling pathway(GO:0030514) |
Gene overrepresentation in cellular component category:
| Log-likelihood per target | Total log-likelihood | Term | Description |
|---|---|---|---|
| 0.5 | 5.9 | GO:0042612 | MHC class I protein complex(GO:0042612) |
| 0.4 | 3.4 | GO:0000835 | ER ubiquitin ligase complex(GO:0000835) Hrd1p ubiquitin ligase complex(GO:0000836) |
| 0.3 | 1.8 | GO:0005726 | perichromatin fibrils(GO:0005726) |
| 0.2 | 8.6 | GO:0080008 | Cul4-RING E3 ubiquitin ligase complex(GO:0080008) |
| 0.2 | 1.6 | GO:0005785 | signal recognition particle receptor complex(GO:0005785) |
| 0.2 | 4.3 | GO:0098563 | integral component of synaptic vesicle membrane(GO:0030285) intrinsic component of synaptic vesicle membrane(GO:0098563) |
| 0.1 | 1.1 | GO:1990357 | terminal web(GO:1990357) |
| 0.1 | 0.9 | GO:0070695 | FHF complex(GO:0070695) |
| 0.1 | 1.0 | GO:0000015 | phosphopyruvate hydratase complex(GO:0000015) |
| 0.1 | 1.3 | GO:1990909 | Wnt signalosome(GO:1990909) |
| 0.1 | 0.4 | GO:1990590 | ATF1-ATF4 transcription factor complex(GO:1990590) |
| 0.1 | 9.1 | GO:0070469 | respiratory chain(GO:0070469) |
| 0.1 | 1.5 | GO:0002199 | zona pellucida receptor complex(GO:0002199) |
| 0.1 | 1.2 | GO:0034663 | endoplasmic reticulum chaperone complex(GO:0034663) |
| 0.1 | 1.6 | GO:0044224 | juxtaparanode region of axon(GO:0044224) |
| 0.1 | 1.1 | GO:0000276 | mitochondrial proton-transporting ATP synthase complex, coupling factor F(o)(GO:0000276) |
| 0.1 | 0.7 | GO:0097524 | sperm plasma membrane(GO:0097524) |
| 0.1 | 2.6 | GO:0030673 | axolemma(GO:0030673) |
| 0.1 | 2.0 | GO:0045095 | keratin filament(GO:0045095) |
| 0.0 | 0.4 | GO:0097433 | dense body(GO:0097433) |
| 0.0 | 1.3 | GO:0005614 | interstitial matrix(GO:0005614) |
| 0.0 | 0.5 | GO:0044327 | dendritic spine head(GO:0044327) |
| 0.0 | 0.4 | GO:0016600 | flotillin complex(GO:0016600) |
| 0.0 | 2.1 | GO:0045171 | intercellular bridge(GO:0045171) |
| 0.0 | 0.3 | GO:0090571 | RNA polymerase II transcription repressor complex(GO:0090571) |
| 0.0 | 0.7 | GO:0033017 | sarcoplasmic reticulum membrane(GO:0033017) |
| 0.0 | 0.9 | GO:0001533 | cornified envelope(GO:0001533) |
| 0.0 | 4.0 | GO:0072562 | blood microparticle(GO:0072562) |
| 0.0 | 1.5 | GO:0005881 | cytoplasmic microtubule(GO:0005881) |
| 0.0 | 1.3 | GO:0034707 | chloride channel complex(GO:0034707) |
| 0.0 | 1.0 | GO:0042645 | nucleoid(GO:0009295) mitochondrial nucleoid(GO:0042645) |
| 0.0 | 1.1 | GO:0031901 | early endosome membrane(GO:0031901) |
| 0.0 | 0.3 | GO:0030669 | clathrin-coated endocytic vesicle membrane(GO:0030669) |
| 0.0 | 0.4 | GO:0005666 | DNA-directed RNA polymerase III complex(GO:0005666) |
| 0.0 | 1.3 | GO:0031463 | Cul3-RING ubiquitin ligase complex(GO:0031463) |
| 0.0 | 0.5 | GO:0005942 | phosphatidylinositol 3-kinase complex(GO:0005942) |
| 0.0 | 0.2 | GO:0005915 | zonula adherens(GO:0005915) |
| 0.0 | 0.3 | GO:0071437 | invadopodium(GO:0071437) |
| 0.0 | 3.4 | GO:0008021 | synaptic vesicle(GO:0008021) |
| 0.0 | 1.1 | GO:0032420 | stereocilium(GO:0032420) |
| 0.0 | 1.6 | GO:0032587 | ruffle membrane(GO:0032587) |
| 0.0 | 0.4 | GO:0035267 | NuA4 histone acetyltransferase complex(GO:0035267) H4/H2A histone acetyltransferase complex(GO:0043189) H4 histone acetyltransferase complex(GO:1902562) |
| 0.0 | 0.3 | GO:0031616 | spindle pole centrosome(GO:0031616) |
| 0.0 | 1.1 | GO:0005882 | intermediate filament(GO:0005882) |
| 0.0 | 7.8 | GO:0031966 | mitochondrial membrane(GO:0031966) |
| 0.0 | 0.3 | GO:0000159 | protein phosphatase type 2A complex(GO:0000159) |
| 0.0 | 2.5 | GO:0019897 | extrinsic component of plasma membrane(GO:0019897) |
| 0.0 | 1.0 | GO:0008076 | voltage-gated potassium channel complex(GO:0008076) |
| 0.0 | 0.0 | GO:0035841 | growing cell tip(GO:0035838) new growing cell tip(GO:0035841) |
| 0.0 | 0.4 | GO:0008180 | COP9 signalosome(GO:0008180) |
| 0.0 | 3.0 | GO:0016323 | basolateral plasma membrane(GO:0016323) |
| 0.0 | 0.7 | GO:0010494 | cytoplasmic stress granule(GO:0010494) |
| 0.0 | 0.2 | GO:0036056 | filtration diaphragm(GO:0036056) slit diaphragm(GO:0036057) |
Gene overrepresentation in molecular function category:
| Log-likelihood per target | Total log-likelihood | Term | Description |
|---|---|---|---|
| 1.1 | 4.3 | GO:0030348 | syntaxin-3 binding(GO:0030348) |
| 0.7 | 2.2 | GO:0017099 | very-long-chain-acyl-CoA dehydrogenase activity(GO:0017099) |
| 0.5 | 7.0 | GO:0030881 | beta-2-microglobulin binding(GO:0030881) |
| 0.5 | 2.6 | GO:0003839 | gamma-glutamylcyclotransferase activity(GO:0003839) |
| 0.5 | 1.9 | GO:0005220 | inositol 1,4,5-trisphosphate-sensitive calcium-release channel activity(GO:0005220) |
| 0.4 | 1.7 | GO:0004104 | cholinesterase activity(GO:0004104) |
| 0.4 | 8.7 | GO:0004745 | retinol dehydrogenase activity(GO:0004745) |
| 0.4 | 1.9 | GO:0005350 | purine nucleobase transmembrane transporter activity(GO:0005345) pyrimidine nucleobase transmembrane transporter activity(GO:0005350) nucleobase transmembrane transporter activity(GO:0015205) glycerol channel activity(GO:0015254) |
| 0.3 | 8.1 | GO:0008137 | NADH dehydrogenase (ubiquinone) activity(GO:0008137) NADH dehydrogenase (quinone) activity(GO:0050136) |
| 0.3 | 4.1 | GO:1901702 | urate transmembrane transporter activity(GO:0015143) salt transmembrane transporter activity(GO:1901702) |
| 0.3 | 1.8 | GO:0034056 | estrogen response element binding(GO:0034056) |
| 0.2 | 1.3 | GO:0003985 | acetyl-CoA C-acetyltransferase activity(GO:0003985) C-acetyltransferase activity(GO:0016453) |
| 0.1 | 1.6 | GO:0008429 | phosphatidylethanolamine binding(GO:0008429) |
| 0.1 | 3.0 | GO:0019825 | oxygen binding(GO:0019825) |
| 0.1 | 2.0 | GO:0016500 | protein-hormone receptor activity(GO:0016500) |
| 0.1 | 1.0 | GO:0055131 | C3HC4-type RING finger domain binding(GO:0055131) |
| 0.1 | 1.0 | GO:0004634 | phosphopyruvate hydratase activity(GO:0004634) |
| 0.1 | 0.7 | GO:0019784 | NEDD8-specific protease activity(GO:0019784) |
| 0.1 | 0.5 | GO:0015173 | aromatic amino acid transmembrane transporter activity(GO:0015173) |
| 0.1 | 1.0 | GO:0003857 | 3-hydroxyacyl-CoA dehydrogenase activity(GO:0003857) |
| 0.1 | 1.0 | GO:0047499 | calcium-independent phospholipase A2 activity(GO:0047499) |
| 0.1 | 1.8 | GO:0003995 | acyl-CoA dehydrogenase activity(GO:0003995) |
| 0.1 | 1.3 | GO:0019531 | oxalate transmembrane transporter activity(GO:0019531) |
| 0.1 | 1.3 | GO:0034236 | protein kinase A catalytic subunit binding(GO:0034236) |
| 0.1 | 1.6 | GO:0005251 | delayed rectifier potassium channel activity(GO:0005251) |
| 0.1 | 2.0 | GO:0016676 | cytochrome-c oxidase activity(GO:0004129) heme-copper terminal oxidase activity(GO:0015002) oxidoreductase activity, acting on a heme group of donors, oxygen as acceptor(GO:0016676) |
| 0.1 | 0.7 | GO:0031543 | peptidyl-proline dioxygenase activity(GO:0031543) |
| 0.1 | 3.4 | GO:0016831 | carboxy-lyase activity(GO:0016831) |
| 0.1 | 0.3 | GO:0003681 | bent DNA binding(GO:0003681) |
| 0.1 | 0.5 | GO:0046935 | 1-phosphatidylinositol-3-kinase regulator activity(GO:0046935) |
| 0.1 | 0.3 | GO:0046912 | transferase activity, transferring acyl groups, acyl groups converted into alkyl on transfer(GO:0046912) |
| 0.1 | 3.4 | GO:0001205 | transcriptional activator activity, RNA polymerase II distal enhancer sequence-specific binding(GO:0001205) |
| 0.1 | 3.5 | GO:0001540 | beta-amyloid binding(GO:0001540) |
| 0.1 | 0.3 | GO:0016716 | oxidoreductase activity, acting on paired donors, with incorporation or reduction of molecular oxygen, another compound as one donor, and incorporation of one atom of oxygen(GO:0016716) |
| 0.1 | 1.3 | GO:0008327 | methyl-CpG binding(GO:0008327) |
| 0.1 | 2.9 | GO:0016620 | oxidoreductase activity, acting on the aldehyde or oxo group of donors, NAD or NADP as acceptor(GO:0016620) |
| 0.0 | 0.8 | GO:1904264 | ubiquitin protein ligase activity involved in ERAD pathway(GO:1904264) |
| 0.0 | 0.7 | GO:0019865 | immunoglobulin binding(GO:0019865) |
| 0.0 | 2.9 | GO:0005160 | transforming growth factor beta receptor binding(GO:0005160) |
| 0.0 | 0.7 | GO:0004993 | G-protein coupled serotonin receptor activity(GO:0004993) |
| 0.0 | 0.2 | GO:0004966 | galanin receptor activity(GO:0004966) |
| 0.0 | 0.7 | GO:0047372 | acylglycerol lipase activity(GO:0047372) |
| 0.0 | 1.0 | GO:0015269 | calcium-activated potassium channel activity(GO:0015269) |
| 0.0 | 2.4 | GO:0005547 | phosphatidylinositol-3,4,5-trisphosphate binding(GO:0005547) |
| 0.0 | 0.2 | GO:0008073 | ornithine decarboxylase inhibitor activity(GO:0008073) |
| 0.0 | 1.1 | GO:0070412 | R-SMAD binding(GO:0070412) |
| 0.0 | 1.1 | GO:0005086 | ARF guanyl-nucleotide exchange factor activity(GO:0005086) |
| 0.0 | 0.3 | GO:0005004 | GPI-linked ephrin receptor activity(GO:0005004) |
| 0.0 | 2.6 | GO:0005249 | voltage-gated potassium channel activity(GO:0005249) |
| 0.0 | 0.4 | GO:0043522 | leucine zipper domain binding(GO:0043522) |
| 0.0 | 0.4 | GO:0045294 | alpha-catenin binding(GO:0045294) |
| 0.0 | 1.2 | GO:0005164 | tumor necrosis factor receptor binding(GO:0005164) |
| 0.0 | 1.4 | GO:0031624 | ubiquitin conjugating enzyme binding(GO:0031624) |
| 0.0 | 1.0 | GO:0016627 | oxidoreductase activity, acting on the CH-CH group of donors(GO:0016627) |
| 0.0 | 1.2 | GO:0008138 | protein tyrosine/serine/threonine phosphatase activity(GO:0008138) |
| 0.0 | 1.1 | GO:0015144 | carbohydrate transmembrane transporter activity(GO:0015144) carbohydrate transporter activity(GO:1901476) |
| 0.0 | 0.3 | GO:0008656 | cysteine-type endopeptidase activator activity involved in apoptotic process(GO:0008656) |
| 0.0 | 0.4 | GO:0001056 | RNA polymerase III activity(GO:0001056) |
| 0.0 | 0.7 | GO:0001968 | fibronectin binding(GO:0001968) |
| 0.0 | 0.5 | GO:0070530 | K63-linked polyubiquitin binding(GO:0070530) |
| 0.0 | 3.7 | GO:0001078 | transcriptional repressor activity, RNA polymerase II core promoter proximal region sequence-specific binding(GO:0001078) |
| 0.0 | 0.1 | GO:0004594 | pantothenate kinase activity(GO:0004594) |
| 0.0 | 0.2 | GO:0070097 | delta-catenin binding(GO:0070097) |
| 0.0 | 0.4 | GO:0004435 | phosphatidylinositol phospholipase C activity(GO:0004435) |
| 0.0 | 0.8 | GO:0015175 | neutral amino acid transmembrane transporter activity(GO:0015175) |
| 0.0 | 0.1 | GO:0004013 | adenosylhomocysteinase activity(GO:0004013) trialkylsulfonium hydrolase activity(GO:0016802) |
| 0.0 | 1.3 | GO:0005254 | chloride channel activity(GO:0005254) |
| 0.0 | 1.6 | GO:0008013 | beta-catenin binding(GO:0008013) |
| 0.0 | 0.1 | GO:0016721 | superoxide dismutase activity(GO:0004784) oxidoreductase activity, acting on superoxide radicals as acceptor(GO:0016721) |
| 0.0 | 2.0 | GO:0042826 | histone deacetylase binding(GO:0042826) |
| 0.0 | 1.2 | GO:0051082 | unfolded protein binding(GO:0051082) |
| 0.0 | 1.1 | GO:0015078 | hydrogen ion transmembrane transporter activity(GO:0015078) |
| 0.0 | 0.9 | GO:0050660 | flavin adenine dinucleotide binding(GO:0050660) |
| 0.0 | 0.3 | GO:0004623 | phospholipase A2 activity(GO:0004623) |
| 0.0 | 0.4 | GO:0001106 | RNA polymerase II transcription corepressor activity(GO:0001106) |
| 0.0 | 1.6 | GO:0002020 | protease binding(GO:0002020) |
| 0.0 | 0.2 | GO:0042043 | neurexin family protein binding(GO:0042043) |
Gene overrepresentation in curated gene sets: canonical pathways category:
| Log-likelihood per target | Total log-likelihood | Term | Description |
|---|---|---|---|
| 0.1 | 2.9 | PID ALK1 PATHWAY | ALK1 signaling events |
| 0.1 | 1.9 | ST WNT CA2 CYCLIC GMP PATHWAY | Wnt/Ca2+/cyclic GMP signaling. |
| 0.1 | 1.6 | PID HIF1A PATHWAY | Hypoxic and oxygen homeostasis regulation of HIF-1-alpha |
| 0.1 | 3.4 | SIG CD40PATHWAYMAP | Genes related to CD40 signaling |
| 0.1 | 3.7 | PID HNF3A PATHWAY | FOXA1 transcription factor network |
| 0.1 | 1.3 | PID WNT CANONICAL PATHWAY | Canonical Wnt signaling pathway |
| 0.1 | 2.4 | PID ARF6 PATHWAY | Arf6 signaling events |
| 0.0 | 1.0 | ST G ALPHA S PATHWAY | G alpha s Pathway |
| 0.0 | 1.3 | PID INTEGRIN2 PATHWAY | Beta2 integrin cell surface interactions |
| 0.0 | 0.9 | PID NEPHRIN NEPH1 PATHWAY | Nephrin/Neph1 signaling in the kidney podocyte |
| 0.0 | 1.7 | PID FAK PATHWAY | Signaling events mediated by focal adhesion kinase |
| 0.0 | 0.3 | PID EPHA FWDPATHWAY | EPHA forward signaling |
| 0.0 | 0.4 | PID NECTIN PATHWAY | Nectin adhesion pathway |
| 0.0 | 1.8 | PID AR TF PATHWAY | Regulation of Androgen receptor activity |
| 0.0 | 1.0 | PID HDAC CLASSII PATHWAY | Signaling events mediated by HDAC Class II |
| 0.0 | 0.9 | PID TRKR PATHWAY | Neurotrophic factor-mediated Trk receptor signaling |
| 0.0 | 1.0 | PID HIF1 TFPATHWAY | HIF-1-alpha transcription factor network |
| 0.0 | 0.4 | PID FRA PATHWAY | Validated transcriptional targets of AP1 family members Fra1 and Fra2 |
| 0.0 | 1.4 | PID BETA CATENIN NUC PATHWAY | Regulation of nuclear beta catenin signaling and target gene transcription |
| 0.0 | 0.4 | PID ERBB1 INTERNALIZATION PATHWAY | Internalization of ErbB1 |
Gene overrepresentation in curated gene sets: REACTOME pathways category:
| Log-likelihood per target | Total log-likelihood | Term | Description |
|---|---|---|---|
| 0.4 | 4.3 | REACTOME ACETYLCHOLINE NEUROTRANSMITTER RELEASE CYCLE | Genes involved in Acetylcholine Neurotransmitter Release Cycle |
| 0.4 | 6.4 | REACTOME TRYPTOPHAN CATABOLISM | Genes involved in Tryptophan catabolism |
| 0.3 | 5.7 | REACTOME BRANCHED CHAIN AMINO ACID CATABOLISM | Genes involved in Branched-chain amino acid catabolism |
| 0.2 | 1.9 | REACTOME ELEVATION OF CYTOSOLIC CA2 LEVELS | Genes involved in Elevation of cytosolic Ca2+ levels |
| 0.2 | 1.9 | REACTOME PASSIVE TRANSPORT BY AQUAPORINS | Genes involved in Passive Transport by Aquaporins |
| 0.1 | 1.7 | REACTOME SYNTHESIS OF PE | Genes involved in Synthesis of PE |
| 0.1 | 4.2 | REACTOME VOLTAGE GATED POTASSIUM CHANNELS | Genes involved in Voltage gated Potassium channels |
| 0.1 | 2.6 | REACTOME GLUTATHIONE CONJUGATION | Genes involved in Glutathione conjugation |
| 0.0 | 0.5 | REACTOME IL 7 SIGNALING | Genes involved in Interleukin-7 signaling |
| 0.0 | 0.4 | REACTOME ACTIVATION OF CHAPERONE GENES BY ATF6 ALPHA | Genes involved in Activation of Chaperone Genes by ATF6-alpha |
| 0.0 | 1.8 | REACTOME SIGNALING BY FGFR1 FUSION MUTANTS | Genes involved in Signaling by FGFR1 fusion mutants |
| 0.0 | 1.0 | REACTOME PRE NOTCH PROCESSING IN GOLGI | Genes involved in Pre-NOTCH Processing in Golgi |
| 0.0 | 1.3 | REACTOME REGULATION OF GENE EXPRESSION IN BETA CELLS | Genes involved in Regulation of gene expression in beta cells |
| 0.0 | 1.0 | REACTOME SYNTHESIS OF VERY LONG CHAIN FATTY ACYL COAS | Genes involved in Synthesis of very long-chain fatty acyl-CoAs |
| 0.0 | 0.5 | REACTOME ERKS ARE INACTIVATED | Genes involved in ERKs are inactivated |
| 0.0 | 1.1 | REACTOME DOWNREGULATION OF TGF BETA RECEPTOR SIGNALING | Genes involved in Downregulation of TGF-beta receptor signaling |
| 0.0 | 1.7 | REACTOME IMMUNOREGULATORY INTERACTIONS BETWEEN A LYMPHOID AND A NON LYMPHOID CELL | Genes involved in Immunoregulatory interactions between a Lymphoid and a non-Lymphoid cell |
| 0.0 | 1.4 | REACTOME MYOGENESIS | Genes involved in Myogenesis |
| 0.0 | 0.2 | REACTOME REGULATION OF ORNITHINE DECARBOXYLASE ODC | Genes involved in Regulation of ornithine decarboxylase (ODC) |
| 0.0 | 1.8 | REACTOME DESTABILIZATION OF MRNA BY AUF1 HNRNP D0 | Genes involved in Destabilization of mRNA by AUF1 (hnRNP D0) |
| 0.0 | 1.0 | REACTOME CGMP EFFECTS | Genes involved in cGMP effects |
| 0.0 | 1.6 | REACTOME ACTIVATION OF CHAPERONE GENES BY XBP1S | Genes involved in Activation of Chaperone Genes by XBP1(S) |
| 0.0 | 1.0 | REACTOME GLYCOLYSIS | Genes involved in Glycolysis |
| 0.0 | 1.3 | REACTOME AMINO ACID TRANSPORT ACROSS THE PLASMA MEMBRANE | Genes involved in Amino acid transport across the plasma membrane |
| 0.0 | 0.4 | REACTOME RNA POL III CHAIN ELONGATION | Genes involved in RNA Polymerase III Chain Elongation |
| 0.0 | 0.3 | REACTOME AKT PHOSPHORYLATES TARGETS IN THE CYTOSOL | Genes involved in AKT phosphorylates targets in the cytosol |
| 0.0 | 0.3 | REACTOME CITRIC ACID CYCLE TCA CYCLE | Genes involved in Citric acid cycle (TCA cycle) |
| 0.0 | 0.4 | REACTOME ENDOSOMAL SORTING COMPLEX REQUIRED FOR TRANSPORT ESCRT | Genes involved in Endosomal Sorting Complex Required For Transport (ESCRT) |
| 0.0 | 0.4 | REACTOME RAS ACTIVATION UOPN CA2 INFUX THROUGH NMDA RECEPTOR | Genes involved in Ras activation uopn Ca2+ infux through NMDA receptor |
| 0.0 | 0.4 | REACTOME G BETA GAMMA SIGNALLING THROUGH PLC BETA | Genes involved in G beta:gamma signalling through PLC beta |
| 0.0 | 0.3 | REACTOME SMAD2 SMAD3 SMAD4 HETEROTRIMER REGULATES TRANSCRIPTION | Genes involved in SMAD2/SMAD3:SMAD4 heterotrimer regulates transcription |