Project
avrg: GSE58827: Dynamics of the Mouse Liver
Navigation
Downloads
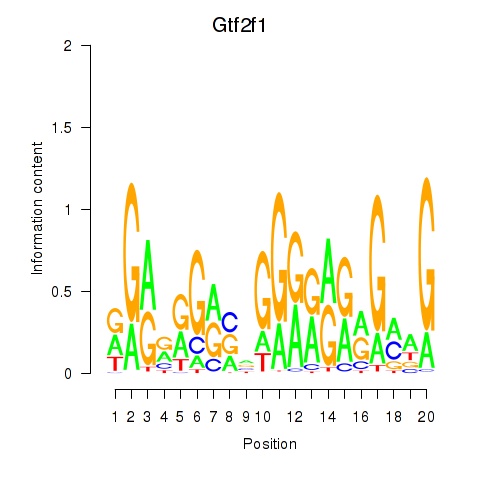
Results for Gtf2i_Gtf2f1
Z-value: 0.87
Motif logo

Transcription factors associated with Gtf2i_Gtf2f1
| Gene Symbol | Gene ID | Gene Info |
|---|---|---|
|
Gtf2i
|
ENSMUSG00000060261.9 | general transcription factor II I |
|
Gtf2f1
|
ENSMUSG00000002658.9 | general transcription factor IIF, polypeptide 1 |
Activity-expression correlation:
| Gene | Promoter | Pearson corr. coef. | P-value | Plot |
|---|---|---|---|---|
| Gtf2i | mm10_v2_chr5_-_134314637_134314676 | 0.53 | 1.0e-03 | Click! |
| Gtf2f1 | mm10_v2_chr17_-_57011271_57011326 | 0.04 | 8.2e-01 | Click! |
Activity profile of Gtf2i_Gtf2f1 motif
Sorted Z-values of Gtf2i_Gtf2f1 motif
| Promoter | Log-likelihood | Transcript | Gene | Gene Info |
|---|---|---|---|---|
| chr9_+_70679016 | 1.89 |
ENSMUST00000144537.1
|
Adam10
|
a disintegrin and metallopeptidase domain 10 |
| chr15_-_66948419 | 1.82 |
ENSMUST00000167817.1
|
Ndrg1
|
N-myc downstream regulated gene 1 |
| chr14_+_54640952 | 1.78 |
ENSMUST00000169818.2
|
Gm17606
|
predicted gene, 17606 |
| chr5_+_43672289 | 1.69 |
ENSMUST00000156034.1
|
Cc2d2a
|
coiled-coil and C2 domain containing 2A |
| chrX_+_13071470 | 1.44 |
ENSMUST00000169594.2
|
Usp9x
|
ubiquitin specific peptidase 9, X chromosome |
| chr10_-_127620960 | 1.43 |
ENSMUST00000121829.1
|
Lrp1
|
low density lipoprotein receptor-related protein 1 |
| chr17_+_26941420 | 1.37 |
ENSMUST00000081285.3
ENSMUST00000177932.1 |
Syngap1
|
synaptic Ras GTPase activating protein 1 homolog (rat) |
| chr16_-_74411776 | 1.34 |
ENSMUST00000116586.2
|
Robo2
|
roundabout homolog 2 (Drosophila) |
| chr10_-_127620922 | 1.32 |
ENSMUST00000118455.1
|
Lrp1
|
low density lipoprotein receptor-related protein 1 |
| chr4_-_43558386 | 1.30 |
ENSMUST00000130353.1
|
Tln1
|
talin 1 |
| chr4_-_123527648 | 1.25 |
ENSMUST00000147228.1
|
Macf1
|
microtubule-actin crosslinking factor 1 |
| chr8_+_107293500 | 1.13 |
ENSMUST00000151114.1
ENSMUST00000075922.4 ENSMUST00000125721.1 |
Nfat5
|
nuclear factor of activated T cells 5 |
| chr7_+_44428938 | 1.09 |
ENSMUST00000127790.1
|
Lrrc4b
|
leucine rich repeat containing 4B |
| chr13_+_99184733 | 1.08 |
ENSMUST00000056558.8
|
Zfp366
|
zinc finger protein 366 |
| chr2_-_45112890 | 1.06 |
ENSMUST00000076836.6
|
Zeb2
|
zinc finger E-box binding homeobox 2 |
| chr16_+_95257646 | 1.05 |
ENSMUST00000113856.1
ENSMUST00000134166.1 ENSMUST00000125847.1 ENSMUST00000140222.1 |
Kcnj15
|
potassium inwardly-rectifying channel, subfamily J, member 15 |
| chr5_-_131538687 | 1.04 |
ENSMUST00000161374.1
|
Auts2
|
autism susceptibility candidate 2 |
| chr6_+_34746368 | 1.04 |
ENSMUST00000142716.1
|
Cald1
|
caldesmon 1 |
| chr11_+_96282529 | 1.04 |
ENSMUST00000125410.1
|
Hoxb8
|
homeobox B8 |
| chr8_-_90348126 | 0.99 |
ENSMUST00000176034.1
ENSMUST00000176616.1 |
Tox3
|
TOX high mobility group box family member 3 |
| chr13_-_63565520 | 0.95 |
ENSMUST00000021921.5
|
Ptch1
|
patched homolog 1 |
| chrX_-_145505175 | 0.95 |
ENSMUST00000143610.1
|
Amot
|
angiomotin |
| chr2_+_18064645 | 0.94 |
ENSMUST00000114680.2
|
Mllt10
|
myeloid/lymphoid or mixed-lineage leukemia (trithorax homolog, Drosophila); translocated to, 10 |
| chr11_-_69617879 | 0.94 |
ENSMUST00000005334.2
|
Shbg
|
sex hormone binding globulin |
| chr6_+_34745952 | 0.91 |
ENSMUST00000123823.1
ENSMUST00000136907.1 ENSMUST00000126181.1 |
Cald1
|
caldesmon 1 |
| chr4_-_41695935 | 0.91 |
ENSMUST00000145379.1
|
Cntfr
|
ciliary neurotrophic factor receptor |
| chr15_+_12117848 | 0.90 |
ENSMUST00000128475.1
ENSMUST00000134277.1 |
Zfr
|
zinc finger RNA binding protein |
| chr2_+_92184106 | 0.89 |
ENSMUST00000111294.1
ENSMUST00000111293.2 ENSMUST00000162146.1 ENSMUST00000111292.1 ENSMUST00000162497.1 |
Phf21a
|
PHD finger protein 21A |
| chrX_+_159255919 | 0.87 |
ENSMUST00000112492.1
|
Rps6ka3
|
ribosomal protein S6 kinase polypeptide 3 |
| chr11_+_44519405 | 0.87 |
ENSMUST00000101327.2
|
Rnf145
|
ring finger protein 145 |
| chrX_+_42150672 | 0.86 |
ENSMUST00000069619.7
|
Stag2
|
stromal antigen 2 |
| chr16_+_95257558 | 0.85 |
ENSMUST00000113862.1
ENSMUST00000113861.1 ENSMUST00000037154.7 ENSMUST00000113854.1 ENSMUST00000113855.1 |
Kcnj15
|
potassium inwardly-rectifying channel, subfamily J, member 15 |
| chr18_+_7869707 | 0.84 |
ENSMUST00000166062.1
ENSMUST00000169010.1 |
Wac
|
WW domain containing adaptor with coiled-coil |
| chr16_-_91011029 | 0.84 |
ENSMUST00000130813.1
|
Synj1
|
synaptojanin 1 |
| chr17_-_35703971 | 0.84 |
ENSMUST00000148065.1
|
Ddr1
|
discoidin domain receptor family, member 1 |
| chr2_+_48949495 | 0.83 |
ENSMUST00000112745.1
|
Mbd5
|
methyl-CpG binding domain protein 5 |
| chr2_-_38287174 | 0.82 |
ENSMUST00000130472.1
|
Dennd1a
|
DENN/MADD domain containing 1A |
| chrX_+_42151002 | 0.82 |
ENSMUST00000123245.1
|
Stag2
|
stromal antigen 2 |
| chr1_+_178798438 | 0.80 |
ENSMUST00000160789.1
|
Kif26b
|
kinesin family member 26B |
| chr2_+_105126505 | 0.80 |
ENSMUST00000143043.1
|
Wt1
|
Wilms tumor 1 homolog |
| chr2_+_74745674 | 0.79 |
ENSMUST00000140666.1
|
Hoxd3
|
homeobox D3 |
| chr8_+_107293463 | 0.79 |
ENSMUST00000169453.1
|
Nfat5
|
nuclear factor of activated T cells 5 |
| chr15_-_99457712 | 0.78 |
ENSMUST00000161948.1
|
Nckap5l
|
NCK-associated protein 5-like |
| chrX_+_48343758 | 0.78 |
ENSMUST00000037596.6
|
Bcorl1
|
BCL6 co-repressor-like 1 |
| chr4_-_44168252 | 0.78 |
ENSMUST00000145760.1
ENSMUST00000128426.1 |
Rnf38
|
ring finger protein 38 |
| chr6_+_85587524 | 0.77 |
ENSMUST00000072018.5
|
Alms1
|
Alstrom syndrome 1 |
| chr10_-_63244135 | 0.75 |
ENSMUST00000054837.3
|
1700120B22Rik
|
RIKEN cDNA 1700120B22 gene |
| chr16_+_95258209 | 0.75 |
ENSMUST00000113858.1
|
Kcnj15
|
potassium inwardly-rectifying channel, subfamily J, member 15 |
| chr6_+_38109320 | 0.75 |
ENSMUST00000031851.3
|
Tmem213
|
transmembrane protein 213 |
| chr6_+_141249161 | 0.74 |
ENSMUST00000043259.7
|
Pde3a
|
phosphodiesterase 3A, cGMP inhibited |
| chr7_+_25268387 | 0.73 |
ENSMUST00000169392.1
|
Cic
|
capicua homolog (Drosophila) |
| chr16_-_74411292 | 0.72 |
ENSMUST00000117200.1
|
Robo2
|
roundabout homolog 2 (Drosophila) |
| chr8_-_91801948 | 0.72 |
ENSMUST00000175795.1
|
Irx3
|
Iroquois related homeobox 3 (Drosophila) |
| chr3_-_87174518 | 0.72 |
ENSMUST00000041732.8
|
Kirrel
|
kin of IRRE like (Drosophila) |
| chr6_+_125321205 | 0.71 |
ENSMUST00000176365.1
|
Scnn1a
|
sodium channel, nonvoltage-gated 1 alpha |
| chr6_+_92092369 | 0.70 |
ENSMUST00000113463.1
|
Nr2c2
|
nuclear receptor subfamily 2, group C, member 2 |
| chr5_+_118560719 | 0.70 |
ENSMUST00000100816.4
|
Med13l
|
mediator complex subunit 13-like |
| chr7_-_133123770 | 0.67 |
ENSMUST00000164896.1
ENSMUST00000171968.1 |
Ctbp2
|
C-terminal binding protein 2 |
| chr4_-_126202583 | 0.66 |
ENSMUST00000106142.1
ENSMUST00000169403.1 ENSMUST00000130334.1 |
Thrap3
|
thyroid hormone receptor associated protein 3 |
| chrX_+_101849375 | 0.66 |
ENSMUST00000124279.1
|
Nhsl2
|
NHS-like 2 |
| chr6_-_12109583 | 0.64 |
ENSMUST00000080891.5
|
Gm6578
|
predicted gene 6578 |
| chr7_+_45705088 | 0.64 |
ENSMUST00000080885.3
|
Dbp
|
D site albumin promoter binding protein |
| chr16_-_42340595 | 0.64 |
ENSMUST00000102817.4
|
Gap43
|
growth associated protein 43 |
| chr5_-_137116177 | 0.63 |
ENSMUST00000054384.5
ENSMUST00000152207.1 |
Trim56
|
tripartite motif-containing 56 |
| chr6_-_122340200 | 0.62 |
ENSMUST00000159384.1
|
Phc1
|
polyhomeotic-like 1 (Drosophila) |
| chr17_+_48462355 | 0.62 |
ENSMUST00000162132.1
|
Unc5cl
|
unc-5 homolog C (C. elegans)-like |
| chr7_+_110773658 | 0.59 |
ENSMUST00000143786.1
|
Ampd3
|
adenosine monophosphate deaminase 3 |
| chr5_-_44799643 | 0.58 |
ENSMUST00000070748.5
|
Ldb2
|
LIM domain binding 2 |
| chr11_+_96282648 | 0.58 |
ENSMUST00000168043.1
|
Hoxb8
|
homeobox B8 |
| chr15_-_8444449 | 0.57 |
ENSMUST00000052965.6
|
Nipbl
|
Nipped-B homolog (Drosophila) |
| chrX_-_102252154 | 0.57 |
ENSMUST00000050551.3
|
Cited1
|
Cbp/p300-interacting transactivator with Glu/Asp-rich carboxy-terminal domain 1 |
| chr5_-_124187150 | 0.57 |
ENSMUST00000161938.1
|
Pitpnm2
|
phosphatidylinositol transfer protein, membrane-associated 2 |
| chr16_+_72663143 | 0.56 |
ENSMUST00000023600.7
|
Robo1
|
roundabout homolog 1 (Drosophila) |
| chr8_-_91801547 | 0.56 |
ENSMUST00000093312.4
|
Irx3
|
Iroquois related homeobox 3 (Drosophila) |
| chr4_-_126202335 | 0.56 |
ENSMUST00000142125.1
ENSMUST00000106141.2 |
Thrap3
|
thyroid hormone receptor associated protein 3 |
| chr15_-_84447037 | 0.56 |
ENSMUST00000080751.2
|
1810041L15Rik
|
RIKEN cDNA 1810041L15 gene |
| chr1_-_64121389 | 0.56 |
ENSMUST00000055001.3
|
Klf7
|
Kruppel-like factor 7 (ubiquitous) |
| chr17_+_48299952 | 0.56 |
ENSMUST00000170941.1
|
Treml2
|
triggering receptor expressed on myeloid cells-like 2 |
| chr6_+_4504814 | 0.55 |
ENSMUST00000141483.1
|
Col1a2
|
collagen, type I, alpha 2 |
| chr17_-_85688252 | 0.55 |
ENSMUST00000024947.7
ENSMUST00000163568.2 |
Six2
|
sine oculis-related homeobox 2 |
| chr6_-_148831395 | 0.55 |
ENSMUST00000145960.1
|
Ipo8
|
importin 8 |
| chr4_-_83486178 | 0.55 |
ENSMUST00000130626.1
|
Psip1
|
PC4 and SFRS1 interacting protein 1 |
| chr9_+_70678950 | 0.54 |
ENSMUST00000067880.6
|
Adam10
|
a disintegrin and metallopeptidase domain 10 |
| chr2_+_4300462 | 0.54 |
ENSMUST00000175669.1
|
Frmd4a
|
FERM domain containing 4A |
| chr11_-_79059872 | 0.54 |
ENSMUST00000141409.1
|
Ksr1
|
kinase suppressor of ras 1 |
| chr6_-_38109548 | 0.54 |
ENSMUST00000114908.1
|
Atp6v0a4
|
ATPase, H+ transporting, lysosomal V0 subunit A4 |
| chr12_+_8674391 | 0.54 |
ENSMUST00000163569.1
ENSMUST00000169089.1 |
Pum2
|
pumilio 2 (Drosophila) |
| chr10_+_100015817 | 0.53 |
ENSMUST00000130190.1
ENSMUST00000020129.7 |
Kitl
|
kit ligand |
| chr4_+_13751297 | 0.53 |
ENSMUST00000105566.2
|
Runx1t1
|
runt-related transcription factor 1; translocated to, 1 (cyclin D-related) |
| chr7_-_78577771 | 0.53 |
ENSMUST00000039438.7
|
Ntrk3
|
neurotrophic tyrosine kinase, receptor, type 3 |
| chr9_-_60522017 | 0.53 |
ENSMUST00000140824.1
|
Thsd4
|
thrombospondin, type I, domain containing 4 |
| chr6_-_127151044 | 0.52 |
ENSMUST00000000188.8
|
Ccnd2
|
cyclin D2 |
| chr19_+_44293676 | 0.52 |
ENSMUST00000026221.5
|
Scd2
|
stearoyl-Coenzyme A desaturase 2 |
| chr10_+_81137953 | 0.52 |
ENSMUST00000117956.1
|
Zbtb7a
|
zinc finger and BTB domain containing 7a |
| chr2_-_121271315 | 0.51 |
ENSMUST00000131245.1
|
Trp53bp1
|
transformation related protein 53 binding protein 1 |
| chr17_+_88597663 | 0.51 |
ENSMUST00000137138.1
|
Ston1
|
stonin 1 |
| chr13_+_93303757 | 0.51 |
ENSMUST00000109494.1
|
Homer1
|
homer homolog 1 (Drosophila) |
| chr6_-_92481343 | 0.50 |
ENSMUST00000113445.1
|
Prickle2
|
prickle homolog 2 (Drosophila) |
| chrX_+_42068398 | 0.50 |
ENSMUST00000115095.2
|
Xiap
|
X-linked inhibitor of apoptosis |
| chr2_+_74681991 | 0.50 |
ENSMUST00000142312.1
|
Hoxd11
|
homeobox D11 |
| chrX_-_78583782 | 0.50 |
ENSMUST00000177904.1
|
Prrg1
|
proline rich Gla (G-carboxyglutamic acid) 1 |
| chr13_+_44840686 | 0.50 |
ENSMUST00000173906.1
|
Jarid2
|
jumonji, AT rich interactive domain 2 |
| chr3_-_104220103 | 0.49 |
ENSMUST00000121198.1
ENSMUST00000122303.1 |
Magi3
|
membrane associated guanylate kinase, WW and PDZ domain containing 3 |
| chr1_-_166002613 | 0.49 |
ENSMUST00000177358.1
ENSMUST00000160908.1 ENSMUST00000027850.8 ENSMUST00000160260.2 |
Pou2f1
|
POU domain, class 2, transcription factor 1 |
| chr12_-_118301429 | 0.49 |
ENSMUST00000026367.9
|
Sp4
|
trans-acting transcription factor 4 |
| chr2_+_4017727 | 0.48 |
ENSMUST00000177457.1
|
Frmd4a
|
FERM domain containing 4A |
| chr2_-_30415389 | 0.48 |
ENSMUST00000142096.1
|
Crat
|
carnitine acetyltransferase |
| chr11_-_85139939 | 0.48 |
ENSMUST00000108075.2
|
Usp32
|
ubiquitin specific peptidase 32 |
| chr16_+_95258036 | 0.48 |
ENSMUST00000113859.1
|
Kcnj15
|
potassium inwardly-rectifying channel, subfamily J, member 15 |
| chr1_-_84839304 | 0.48 |
ENSMUST00000027421.6
|
Trip12
|
thyroid hormone receptor interactor 12 |
| chr17_+_5799616 | 0.48 |
ENSMUST00000181392.1
|
3300005D01Rik
|
RIKEN cDNA 3300005D01 gene |
| chr17_+_35077080 | 0.48 |
ENSMUST00000172959.1
|
Ly6g6e
|
lymphocyte antigen 6 complex, locus G6E |
| chr11_+_96931387 | 0.48 |
ENSMUST00000107633.1
|
Prr15l
|
proline rich 15-like |
| chr11_+_84179792 | 0.48 |
ENSMUST00000137500.2
ENSMUST00000130012.2 |
Acaca
|
acetyl-Coenzyme A carboxylase alpha |
| chr3_-_30509462 | 0.47 |
ENSMUST00000173899.1
|
Mecom
|
MDS1 and EVI1 complex locus |
| chr2_-_59160644 | 0.47 |
ENSMUST00000077687.5
|
Ccdc148
|
coiled-coil domain containing 148 |
| chr1_+_75400070 | 0.47 |
ENSMUST00000113589.1
|
Speg
|
SPEG complex locus |
| chr7_+_75610038 | 0.47 |
ENSMUST00000125771.1
|
Akap13
|
A kinase (PRKA) anchor protein 13 |
| chr4_-_44167988 | 0.47 |
ENSMUST00000143337.1
|
Rnf38
|
ring finger protein 38 |
| chr11_+_98203314 | 0.47 |
ENSMUST00000003203.7
ENSMUST00000107538.1 |
Cdk12
|
cyclin-dependent kinase 12 |
| chr7_-_102210120 | 0.46 |
ENSMUST00000070165.5
|
Nup98
|
nucleoporin 98 |
| chr13_+_96542602 | 0.46 |
ENSMUST00000179226.1
|
Col4a3bp
|
collagen, type IV, alpha 3 (Goodpasture antigen) binding protein |
| chr6_-_56362356 | 0.46 |
ENSMUST00000044505.7
ENSMUST00000166102.1 ENSMUST00000164037.1 ENSMUST00000114327.2 |
Pde1c
|
phosphodiesterase 1C |
| chrX_-_70365052 | 0.46 |
ENSMUST00000101509.2
|
Ids
|
iduronate 2-sulfatase |
| chr10_-_80657071 | 0.46 |
ENSMUST00000003434.7
|
Btbd2
|
BTB (POZ) domain containing 2 |
| chrX_-_78583882 | 0.46 |
ENSMUST00000114025.1
ENSMUST00000134602.1 ENSMUST00000114024.2 |
Prrg1
|
proline rich Gla (G-carboxyglutamic acid) 1 |
| chr16_+_56075399 | 0.46 |
ENSMUST00000089362.2
ENSMUST00000089360.3 ENSMUST00000049128.6 |
Senp7
|
SUMO1/sentrin specific peptidase 7 |
| chrX_+_85574018 | 0.45 |
ENSMUST00000048250.3
ENSMUST00000137438.1 ENSMUST00000146063.1 |
Tab3
|
TGF-beta activated kinase 1/MAP3K7 binding protein 3 |
| chr12_+_95695350 | 0.45 |
ENSMUST00000110117.1
|
Flrt2
|
fibronectin leucine rich transmembrane protein 2 |
| chr2_+_105127200 | 0.45 |
ENSMUST00000139585.1
|
Wt1
|
Wilms tumor 1 homolog |
| chr5_-_45856496 | 0.45 |
ENSMUST00000087164.3
ENSMUST00000121573.1 |
Lcorl
|
ligand dependent nuclear receptor corepressor-like |
| chr7_-_133123409 | 0.45 |
ENSMUST00000170459.1
ENSMUST00000166400.1 |
Ctbp2
|
C-terminal binding protein 2 |
| chr6_-_77979515 | 0.45 |
ENSMUST00000159626.1
ENSMUST00000075340.5 ENSMUST00000162273.1 |
Ctnna2
|
catenin (cadherin associated protein), alpha 2 |
| chr11_+_69765970 | 0.44 |
ENSMUST00000108642.1
ENSMUST00000156932.1 |
Zbtb4
|
zinc finger and BTB domain containing 4 |
| chr6_-_122340499 | 0.44 |
ENSMUST00000160843.1
|
Phc1
|
polyhomeotic-like 1 (Drosophila) |
| chr11_-_68386974 | 0.44 |
ENSMUST00000135141.1
|
Ntn1
|
netrin 1 |
| chr11_+_84179852 | 0.44 |
ENSMUST00000136463.2
|
Acaca
|
acetyl-Coenzyme A carboxylase alpha |
| chr13_+_93304066 | 0.43 |
ENSMUST00000109493.1
|
Homer1
|
homer homolog 1 (Drosophila) |
| chr17_-_34121944 | 0.43 |
ENSMUST00000151986.1
|
Brd2
|
bromodomain containing 2 |
| chr4_+_133176336 | 0.43 |
ENSMUST00000105912.1
|
Wasf2
|
WAS protein family, member 2 |
| chr18_-_78206408 | 0.43 |
ENSMUST00000163367.1
|
Slc14a2
|
solute carrier family 14 (urea transporter), member 2 |
| chr14_+_25459267 | 0.43 |
ENSMUST00000007961.8
|
Zmiz1
|
zinc finger, MIZ-type containing 1 |
| chr14_-_34502522 | 0.43 |
ENSMUST00000171551.1
|
Bmpr1a
|
bone morphogenetic protein receptor, type 1A |
| chr2_-_165884636 | 0.43 |
ENSMUST00000177633.1
ENSMUST00000018050.7 ENSMUST00000088113.4 |
Zmynd8
|
zinc finger, MYND-type containing 8 |
| chr18_+_88971790 | 0.43 |
ENSMUST00000023828.7
|
Rttn
|
rotatin |
| chr2_+_5951440 | 0.42 |
ENSMUST00000060092.6
|
Upf2
|
UPF2 regulator of nonsense transcripts homolog (yeast) |
| chr4_-_44167905 | 0.42 |
ENSMUST00000102934.2
|
Rnf38
|
ring finger protein 38 |
| chr19_+_44757394 | 0.42 |
ENSMUST00000004340.4
|
Pax2
|
paired box gene 2 |
| chr12_+_3806513 | 0.42 |
ENSMUST00000172719.1
|
Dnmt3a
|
DNA methyltransferase 3A |
| chrX_+_48108912 | 0.42 |
ENSMUST00000114998.1
ENSMUST00000115000.3 |
Xpnpep2
|
X-prolyl aminopeptidase (aminopeptidase P) 2, membrane-bound |
| chr7_+_127876796 | 0.42 |
ENSMUST00000131000.1
|
Zfp646
|
zinc finger protein 646 |
| chr10_-_81430966 | 0.42 |
ENSMUST00000117966.1
|
Nfic
|
nuclear factor I/C |
| chr16_-_76373014 | 0.42 |
ENSMUST00000054178.1
|
Nrip1
|
nuclear receptor interacting protein 1 |
| chr11_-_69758223 | 0.41 |
ENSMUST00000071213.3
|
Polr2a
|
polymerase (RNA) II (DNA directed) polypeptide A |
| chrX_-_102251852 | 0.41 |
ENSMUST00000101336.3
ENSMUST00000136277.1 |
Cited1
|
Cbp/p300-interacting transactivator with Glu/Asp-rich carboxy-terminal domain 1 |
| chr18_-_43393346 | 0.41 |
ENSMUST00000025379.7
|
Dpysl3
|
dihydropyrimidinase-like 3 |
| chr14_+_55854115 | 0.40 |
ENSMUST00000168479.1
|
Nynrin
|
NYN domain and retroviral integrase containing |
| chr9_+_38719024 | 0.40 |
ENSMUST00000129598.1
|
Vwa5a
|
von Willebrand factor A domain containing 5A |
| chr1_-_133801031 | 0.40 |
ENSMUST00000143567.1
|
Atp2b4
|
ATPase, Ca++ transporting, plasma membrane 4 |
| chr4_+_101550411 | 0.40 |
ENSMUST00000094953.4
ENSMUST00000106933.1 |
Dnajc6
|
DnaJ (Hsp40) homolog, subfamily C, member 6 |
| chr4_-_132049058 | 0.40 |
ENSMUST00000105981.2
ENSMUST00000084253.3 ENSMUST00000141291.1 |
Epb4.1
|
erythrocyte protein band 4.1 |
| chr10_-_30803075 | 0.40 |
ENSMUST00000068567.4
|
Ncoa7
|
nuclear receptor coactivator 7 |
| chrX_-_136780141 | 0.40 |
ENSMUST00000018739.4
|
Glra4
|
glycine receptor, alpha 4 subunit |
| chr11_+_23306910 | 0.39 |
ENSMUST00000137823.1
|
Usp34
|
ubiquitin specific peptidase 34 |
| chr11_+_24078173 | 0.39 |
ENSMUST00000109514.1
|
Bcl11a
|
B cell CLL/lymphoma 11A (zinc finger protein) |
| chr11_-_116077927 | 0.39 |
ENSMUST00000156545.1
|
Unc13d
|
unc-13 homolog D (C. elegans) |
| chr7_+_140093388 | 0.39 |
ENSMUST00000026540.8
|
Prap1
|
proline-rich acidic protein 1 |
| chr15_-_82912134 | 0.39 |
ENSMUST00000048966.5
ENSMUST00000109510.2 |
Tcf20
|
transcription factor 20 |
| chr19_-_28010995 | 0.39 |
ENSMUST00000172907.1
ENSMUST00000046898.9 |
Rfx3
|
regulatory factor X, 3 (influences HLA class II expression) |
| chr2_+_18064564 | 0.39 |
ENSMUST00000114671.1
|
Mllt10
|
myeloid/lymphoid or mixed-lineage leukemia (trithorax homolog, Drosophila); translocated to, 10 |
| chr18_+_8694077 | 0.39 |
ENSMUST00000171469.1
|
Gm5819
|
predicted gene 5819 |
| chr7_-_46795661 | 0.39 |
ENSMUST00000123725.1
|
Hps5
|
Hermansky-Pudlak syndrome 5 homolog (human) |
| chr15_-_102624922 | 0.39 |
ENSMUST00000183765.1
|
ATF7
|
Cyclic AMP-dependent transcription factor ATF-7 |
| chr9_-_44721383 | 0.38 |
ENSMUST00000148929.1
ENSMUST00000123406.1 |
Phldb1
|
pleckstrin homology-like domain, family B, member 1 |
| chr2_+_74711911 | 0.38 |
ENSMUST00000111983.2
|
Hoxd3
|
homeobox D3 |
| chr11_+_96251100 | 0.38 |
ENSMUST00000129907.2
|
Gm53
|
predicted gene 53 |
| chr6_+_128399766 | 0.38 |
ENSMUST00000001561.5
|
Nrip2
|
nuclear receptor interacting protein 2 |
| chr1_-_160792908 | 0.38 |
ENSMUST00000028049.7
|
Rabgap1l
|
RAB GTPase activating protein 1-like |
| chr3_+_108085976 | 0.38 |
ENSMUST00000070502.1
|
Gm12500
|
predicted gene 12500 |
| chr16_-_22439570 | 0.38 |
ENSMUST00000170393.1
|
Etv5
|
ets variant gene 5 |
| chr10_+_42583787 | 0.38 |
ENSMUST00000105497.1
ENSMUST00000144806.1 |
Ostm1
|
osteopetrosis associated transmembrane protein 1 |
| chr17_-_26199008 | 0.38 |
ENSMUST00000142410.1
ENSMUST00000120333.1 ENSMUST00000039113.7 |
Pdia2
|
protein disulfide isomerase associated 2 |
| chr4_+_108460000 | 0.38 |
ENSMUST00000097925.2
|
Zcchc11
|
zinc finger, CCHC domain containing 11 |
| chr1_-_168432270 | 0.38 |
ENSMUST00000072863.4
|
Pbx1
|
pre B cell leukemia homeobox 1 |
| chr1_+_172341197 | 0.37 |
ENSMUST00000056136.3
|
Kcnj10
|
potassium inwardly-rectifying channel, subfamily J, member 10 |
| chr19_+_27217011 | 0.37 |
ENSMUST00000164746.1
ENSMUST00000172302.1 |
Vldlr
|
very low density lipoprotein receptor |
| chr15_-_102366314 | 0.37 |
ENSMUST00000078508.5
|
Sp7
|
Sp7 transcription factor 7 |
| chr6_+_87428986 | 0.37 |
ENSMUST00000032125.5
|
Bmp10
|
bone morphogenetic protein 10 |
| chr3_-_79567771 | 0.37 |
ENSMUST00000133154.1
|
Fnip2
|
folliculin interacting protein 2 |
| chr11_-_108343917 | 0.37 |
ENSMUST00000059595.4
|
Prkca
|
protein kinase C, alpha |
| chr6_+_128399881 | 0.37 |
ENSMUST00000120405.1
|
Nrip2
|
nuclear receptor interacting protein 2 |
| chr14_+_64652524 | 0.37 |
ENSMUST00000100473.4
|
Kif13b
|
kinesin family member 13B |
| chr17_+_48346401 | 0.37 |
ENSMUST00000024791.8
|
Trem2
|
triggering receptor expressed on myeloid cells 2 |
| chr11_-_9011111 | 0.37 |
ENSMUST00000020683.3
|
Hus1
|
Hus1 homolog (S. pombe) |
| chr1_-_132067826 | 0.37 |
ENSMUST00000160656.1
ENSMUST00000161864.1 ENSMUST00000126927.1 ENSMUST00000159038.1 |
Mfsd4
|
major facilitator superfamily domain containing 4 |
| chr5_-_73256555 | 0.37 |
ENSMUST00000171179.1
ENSMUST00000101127.5 |
Fryl
Fryl
|
furry homolog-like (Drosophila) furry homolog-like (Drosophila) |
| chrX_-_105929206 | 0.37 |
ENSMUST00000134381.1
ENSMUST00000154866.1 |
Atrx
|
alpha thalassemia/mental retardation syndrome X-linked homolog (human) |
| chr10_+_108162358 | 0.37 |
ENSMUST00000070663.5
|
Ppp1r12a
|
protein phosphatase 1, regulatory (inhibitor) subunit 12A |
| chr14_-_64949632 | 0.37 |
ENSMUST00000176832.1
|
Hmbox1
|
homeobox containing 1 |
| chr6_+_17463826 | 0.36 |
ENSMUST00000140070.1
|
Met
|
met proto-oncogene |
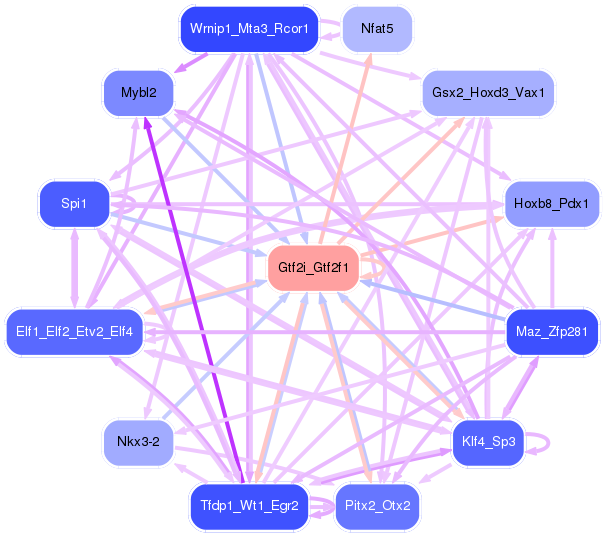
Network of associatons between targets according to the STRING database.

First level regulatory network of Gtf2i_Gtf2f1
Gene Ontology Analysis
Gene overrepresentation in biological process category:
| Log-likelihood per target | Total log-likelihood | Term | Description |
|---|---|---|---|
| 0.9 | 2.6 | GO:0050925 | negative regulation of negative chemotaxis(GO:0050925) |
| 0.8 | 3.1 | GO:1905167 | positive regulation of lysosomal protein catabolic process(GO:1905167) |
| 0.5 | 2.4 | GO:0042117 | monocyte activation(GO:0042117) |
| 0.4 | 1.2 | GO:0072299 | negative regulation of metanephric glomerulus development(GO:0072299) negative regulation of metanephric glomerular mesangial cell proliferation(GO:0072302) regulation of metanephric ureteric bud development(GO:2001074) positive regulation of metanephric ureteric bud development(GO:2001076) |
| 0.4 | 1.2 | GO:2000620 | positive regulation of histone H4-K16 acetylation(GO:2000620) |
| 0.4 | 1.6 | GO:0021698 | cerebellar cortex structural organization(GO:0021698) |
| 0.4 | 1.1 | GO:1904980 | regulation of endosome organization(GO:1904978) positive regulation of endosome organization(GO:1904980) |
| 0.3 | 1.8 | GO:1904491 | protein localization to ciliary transition zone(GO:1904491) |
| 0.3 | 0.3 | GO:0072166 | posterior mesonephric tubule development(GO:0072166) |
| 0.3 | 0.8 | GO:0060399 | positive regulation of growth hormone receptor signaling pathway(GO:0060399) |
| 0.3 | 1.1 | GO:0003365 | establishment of cell polarity involved in ameboidal cell migration(GO:0003365) |
| 0.3 | 0.8 | GO:2000979 | hepatocyte cell migration(GO:0002194) branching involved in pancreas morphogenesis(GO:0061114) acinar cell differentiation(GO:0090425) positive regulation of forebrain neuron differentiation(GO:2000979) |
| 0.3 | 1.0 | GO:0003360 | brainstem development(GO:0003360) |
| 0.3 | 0.8 | GO:2000597 | optic nerve formation(GO:0021634) optic chiasma development(GO:0061360) regulation of optic nerve formation(GO:2000595) positive regulation of optic nerve formation(GO:2000597) |
| 0.3 | 1.0 | GO:0035128 | post-embryonic appendage morphogenesis(GO:0035120) post-embryonic limb morphogenesis(GO:0035127) post-embryonic forelimb morphogenesis(GO:0035128) telomeric repeat-containing RNA transcription(GO:0097393) telomeric repeat-containing RNA transcription from RNA pol II promoter(GO:0097394) regulation of telomeric RNA transcription from RNA pol II promoter(GO:1901580) negative regulation of telomeric RNA transcription from RNA pol II promoter(GO:1901581) positive regulation of telomeric RNA transcription from RNA pol II promoter(GO:1901582) |
| 0.2 | 1.2 | GO:0071894 | histone H2B conserved C-terminal lysine ubiquitination(GO:0071894) |
| 0.2 | 0.9 | GO:0009957 | epidermal cell fate specification(GO:0009957) |
| 0.2 | 0.5 | GO:0000973 | posttranscriptional tethering of RNA polymerase II gene DNA at nuclear periphery(GO:0000973) |
| 0.2 | 0.9 | GO:0044268 | multicellular organismal protein metabolic process(GO:0044268) |
| 0.2 | 0.2 | GO:2000137 | negative regulation of cell proliferation involved in heart morphogenesis(GO:2000137) |
| 0.2 | 0.2 | GO:0099404 | negative regulation of maintenance of sister chromatid cohesion(GO:0034092) negative regulation of maintenance of mitotic sister chromatid cohesion(GO:0034183) maintenance of mitotic sister chromatid cohesion, telomeric(GO:0099403) mitotic sister chromatid cohesion, telomeric(GO:0099404) regulation of maintenance of mitotic sister chromatid cohesion, telomeric(GO:1904907) negative regulation of maintenance of mitotic sister chromatid cohesion, telomeric(GO:1904908) |
| 0.2 | 1.7 | GO:1902746 | regulation of lens fiber cell differentiation(GO:1902746) |
| 0.2 | 0.6 | GO:0002588 | positive regulation of antigen processing and presentation of peptide or polysaccharide antigen via MHC class II(GO:0002582) positive regulation of antigen processing and presentation of peptide antigen via MHC class II(GO:0002588) |
| 0.2 | 1.4 | GO:0072081 | proximal/distal pattern formation involved in nephron development(GO:0072047) specification of nephron tubule identity(GO:0072081) specification of loop of Henle identity(GO:0072086) |
| 0.2 | 0.6 | GO:0035621 | ER to Golgi ceramide transport(GO:0035621) |
| 0.2 | 1.0 | GO:0071104 | response to interleukin-9(GO:0071104) response to interleukin-11(GO:0071105) |
| 0.2 | 0.6 | GO:0071918 | urea transmembrane transport(GO:0071918) |
| 0.2 | 0.6 | GO:0072004 | pronephric field specification(GO:0039003) pattern specification involved in pronephros development(GO:0039017) kidney field specification(GO:0072004) regulation of mesenchymal cell apoptotic process involved in metanephric nephron morphogenesis(GO:0072304) negative regulation of mesenchymal cell apoptotic process involved in metanephric nephron morphogenesis(GO:0072305) apoptotic process involved in metanephric collecting duct development(GO:1900204) apoptotic process involved in metanephric nephron tubule development(GO:1900205) regulation of apoptotic process involved in metanephric collecting duct development(GO:1900214) negative regulation of apoptotic process involved in metanephric collecting duct development(GO:1900215) regulation of apoptotic process involved in metanephric nephron tubule development(GO:1900217) negative regulation of apoptotic process involved in metanephric nephron tubule development(GO:1900218) mesenchymal cell apoptotic process involved in metanephric nephron morphogenesis(GO:1901147) regulation of metanephric DCT cell differentiation(GO:2000592) positive regulation of metanephric DCT cell differentiation(GO:2000594) |
| 0.2 | 0.8 | GO:0097168 | mesenchymal stem cell proliferation(GO:0097168) |
| 0.2 | 0.7 | GO:0060282 | positive regulation of oocyte development(GO:0060282) |
| 0.2 | 0.7 | GO:1902528 | regulation of protein linear polyubiquitination(GO:1902528) positive regulation of protein linear polyubiquitination(GO:1902530) |
| 0.2 | 1.3 | GO:0021615 | glossopharyngeal nerve morphogenesis(GO:0021615) |
| 0.2 | 1.0 | GO:0032483 | regulation of Rab protein signal transduction(GO:0032483) |
| 0.2 | 0.7 | GO:0045636 | positive regulation of melanocyte differentiation(GO:0045636) |
| 0.2 | 1.7 | GO:0032876 | negative regulation of DNA endoreduplication(GO:0032876) |
| 0.2 | 0.7 | GO:1904800 | regulation of neuron remodeling(GO:1904799) negative regulation of neuron remodeling(GO:1904800) |
| 0.2 | 0.2 | GO:0072268 | pattern specification involved in metanephros development(GO:0072268) |
| 0.2 | 0.2 | GO:0072309 | mesenchymal stem cell maintenance involved in metanephric nephron morphogenesis(GO:0072309) |
| 0.2 | 1.8 | GO:0090232 | positive regulation of spindle checkpoint(GO:0090232) |
| 0.2 | 1.3 | GO:0007016 | cytoskeletal anchoring at plasma membrane(GO:0007016) |
| 0.2 | 0.6 | GO:0061386 | closure of optic fissure(GO:0061386) |
| 0.2 | 0.8 | GO:0072092 | ureteric bud invasion(GO:0072092) |
| 0.2 | 0.5 | GO:0010814 | substance P catabolic process(GO:0010814) calcitonin catabolic process(GO:0010816) endothelin maturation(GO:0034959) |
| 0.2 | 0.3 | GO:0071317 | cellular response to isoquinoline alkaloid(GO:0071317) |
| 0.2 | 0.5 | GO:1900045 | negative regulation of protein K63-linked ubiquitination(GO:1900045) negative regulation of protein polyubiquitination(GO:1902915) |
| 0.1 | 0.7 | GO:0002069 | columnar/cuboidal epithelial cell maturation(GO:0002069) |
| 0.1 | 0.1 | GO:0072076 | nephrogenic mesenchyme development(GO:0072076) |
| 0.1 | 0.6 | GO:0061010 | gall bladder development(GO:0061010) |
| 0.1 | 1.4 | GO:0048386 | positive regulation of retinoic acid receptor signaling pathway(GO:0048386) |
| 0.1 | 0.4 | GO:0021998 | neural plate mediolateral regionalization(GO:0021998) mesoderm structural organization(GO:0048338) paraxial mesoderm structural organization(GO:0048352) positive regulation of cardiac ventricle development(GO:1904414) |
| 0.1 | 0.5 | GO:0001543 | ovarian follicle rupture(GO:0001543) |
| 0.1 | 0.4 | GO:0072138 | mesenchymal cell proliferation involved in ureteric bud development(GO:0072138) |
| 0.1 | 0.5 | GO:1903966 | monounsaturated fatty acid metabolic process(GO:1903964) monounsaturated fatty acid biosynthetic process(GO:1903966) |
| 0.1 | 0.1 | GO:0018076 | N-terminal peptidyl-lysine acetylation(GO:0018076) |
| 0.1 | 0.4 | GO:0000821 | regulation of arginine metabolic process(GO:0000821) negative regulation of nitric oxide mediated signal transduction(GO:0010751) negative regulation of cellular amino acid metabolic process(GO:0045763) |
| 0.1 | 0.5 | GO:0035279 | mRNA cleavage involved in gene silencing by miRNA(GO:0035279) mRNA cleavage involved in gene silencing(GO:0098795) |
| 0.1 | 1.4 | GO:1900246 | positive regulation of RIG-I signaling pathway(GO:1900246) |
| 0.1 | 0.1 | GO:0000117 | regulation of transcription involved in G2/M transition of mitotic cell cycle(GO:0000117) |
| 0.1 | 0.9 | GO:0000395 | mRNA 5'-splice site recognition(GO:0000395) |
| 0.1 | 1.0 | GO:0060164 | regulation of timing of neuron differentiation(GO:0060164) |
| 0.1 | 0.6 | GO:0014886 | transition between slow and fast fiber(GO:0014886) |
| 0.1 | 1.4 | GO:0061302 | smooth muscle cell-matrix adhesion(GO:0061302) |
| 0.1 | 0.2 | GO:2000286 | receptor internalization involved in canonical Wnt signaling pathway(GO:2000286) |
| 0.1 | 0.1 | GO:0035502 | metanephric part of ureteric bud development(GO:0035502) |
| 0.1 | 0.8 | GO:1901300 | positive regulation of hydrogen peroxide-mediated programmed cell death(GO:1901300) |
| 0.1 | 0.7 | GO:0016198 | axon choice point recognition(GO:0016198) |
| 0.1 | 0.5 | GO:0086023 | adrenergic receptor signaling pathway involved in heart process(GO:0086023) |
| 0.1 | 0.5 | GO:0001830 | trophectodermal cell fate commitment(GO:0001830) |
| 0.1 | 1.0 | GO:0002432 | granuloma formation(GO:0002432) |
| 0.1 | 0.7 | GO:0060298 | positive regulation of sarcomere organization(GO:0060298) |
| 0.1 | 0.3 | GO:0090649 | response to oxygen-glucose deprivation(GO:0090649) cellular response to oxygen-glucose deprivation(GO:0090650) |
| 0.1 | 0.4 | GO:1904451 | regulation of hydrogen:potassium-exchanging ATPase activity(GO:1904451) positive regulation of hydrogen:potassium-exchanging ATPase activity(GO:1904453) |
| 0.1 | 4.1 | GO:0010107 | potassium ion import(GO:0010107) |
| 0.1 | 1.2 | GO:0033147 | negative regulation of intracellular estrogen receptor signaling pathway(GO:0033147) |
| 0.1 | 0.2 | GO:2000820 | negative regulation of transcription from RNA polymerase II promoter involved in smooth muscle cell differentiation(GO:2000820) |
| 0.1 | 0.4 | GO:0003050 | regulation of systemic arterial blood pressure by atrial natriuretic peptide(GO:0003050) |
| 0.1 | 0.2 | GO:0031959 | mineralocorticoid receptor signaling pathway(GO:0031959) |
| 0.1 | 0.8 | GO:0044027 | hypermethylation of CpG island(GO:0044027) |
| 0.1 | 0.3 | GO:1904431 | positive regulation of t-circle formation(GO:1904431) |
| 0.1 | 0.2 | GO:0019042 | viral latency(GO:0019042) release from viral latency(GO:0019046) |
| 0.1 | 0.3 | GO:0021836 | chemorepulsion involved in postnatal olfactory bulb interneuron migration(GO:0021836) |
| 0.1 | 0.3 | GO:1904049 | negative regulation of spontaneous neurotransmitter secretion(GO:1904049) |
| 0.1 | 0.3 | GO:0007290 | spermatid nucleus elongation(GO:0007290) |
| 0.1 | 0.3 | GO:0015910 | peroxisomal long-chain fatty acid import(GO:0015910) |
| 0.1 | 0.1 | GO:0033563 | dorsal/ventral axon guidance(GO:0033563) |
| 0.1 | 0.1 | GO:1903279 | regulation of calcium:sodium antiporter activity(GO:1903279) |
| 0.1 | 0.2 | GO:2001226 | negative regulation of chloride transport(GO:2001226) |
| 0.1 | 0.4 | GO:0060032 | notochord regression(GO:0060032) |
| 0.1 | 0.4 | GO:2000705 | negative regulation of anion channel activity(GO:0010360) regulation of dense core granule biogenesis(GO:2000705) |
| 0.1 | 0.2 | GO:0072194 | kidney smooth muscle tissue development(GO:0072194) |
| 0.1 | 0.4 | GO:0044778 | meiotic DNA integrity checkpoint(GO:0044778) |
| 0.1 | 0.4 | GO:0048382 | mesendoderm development(GO:0048382) |
| 0.1 | 1.3 | GO:0051574 | positive regulation of histone H3-K9 methylation(GO:0051574) |
| 0.1 | 0.1 | GO:0003133 | BMP signaling pathway involved in heart induction(GO:0003130) endodermal-mesodermal cell signaling(GO:0003133) endodermal-mesodermal cell signaling involved in heart induction(GO:0003134) cell-cell signaling involved in cell fate commitment(GO:0045168) |
| 0.1 | 0.3 | GO:0045715 | negative regulation of low-density lipoprotein particle receptor biosynthetic process(GO:0045715) |
| 0.1 | 0.3 | GO:0045660 | positive regulation of neutrophil differentiation(GO:0045660) |
| 0.1 | 0.4 | GO:2001166 | regulation of histone H2B ubiquitination(GO:2001166) positive regulation of histone H2B ubiquitination(GO:2001168) |
| 0.1 | 0.2 | GO:2000118 | regulation of sodium-dependent phosphate transport(GO:2000118) |
| 0.1 | 0.4 | GO:0072365 | regulation of cellular ketone metabolic process by negative regulation of transcription from RNA polymerase II promoter(GO:0072365) |
| 0.1 | 0.4 | GO:0034436 | glycoprotein transport(GO:0034436) |
| 0.1 | 0.3 | GO:0033693 | neurofilament bundle assembly(GO:0033693) |
| 0.1 | 0.4 | GO:0071879 | positive regulation of adrenergic receptor signaling pathway(GO:0071879) |
| 0.1 | 0.3 | GO:0099527 | postsynapse to nucleus signaling pathway(GO:0099527) |
| 0.1 | 1.0 | GO:0021942 | radial glia guided migration of Purkinje cell(GO:0021942) |
| 0.1 | 1.6 | GO:0006620 | posttranslational protein targeting to membrane(GO:0006620) |
| 0.1 | 0.4 | GO:1903758 | regulation of transcription from RNA polymerase II promoter by histone modification(GO:1903756) negative regulation of transcription from RNA polymerase II promoter by histone modification(GO:1903758) |
| 0.1 | 0.3 | GO:0071462 | cellular response to water stimulus(GO:0071462) |
| 0.1 | 0.6 | GO:0007296 | vitellogenesis(GO:0007296) |
| 0.1 | 0.1 | GO:0098917 | retrograde trans-synaptic signaling(GO:0098917) |
| 0.1 | 0.3 | GO:0030221 | basophil differentiation(GO:0030221) |
| 0.1 | 0.2 | GO:0060364 | frontal suture morphogenesis(GO:0060364) |
| 0.1 | 0.6 | GO:0019254 | carnitine metabolic process, CoA-linked(GO:0019254) |
| 0.1 | 1.2 | GO:2001256 | regulation of store-operated calcium entry(GO:2001256) |
| 0.1 | 0.2 | GO:0097155 | fasciculation of sensory neuron axon(GO:0097155) |
| 0.1 | 0.9 | GO:0048251 | elastic fiber assembly(GO:0048251) |
| 0.1 | 0.7 | GO:0009644 | response to high light intensity(GO:0009644) |
| 0.1 | 0.2 | GO:2000312 | regulation of kainate selective glutamate receptor activity(GO:2000312) |
| 0.1 | 0.6 | GO:0070495 | regulation of thrombin receptor signaling pathway(GO:0070494) negative regulation of thrombin receptor signaling pathway(GO:0070495) |
| 0.1 | 0.1 | GO:1901420 | negative regulation of response to alcohol(GO:1901420) |
| 0.1 | 0.1 | GO:0032907 | transforming growth factor beta3 production(GO:0032907) regulation of transforming growth factor beta3 production(GO:0032910) positive regulation of transforming growth factor beta3 production(GO:0032916) |
| 0.1 | 0.3 | GO:0051581 | negative regulation of neurotransmitter uptake(GO:0051581) negative regulation of serotonin uptake(GO:0051612) |
| 0.1 | 0.3 | GO:0035483 | gastric emptying(GO:0035483) |
| 0.1 | 0.4 | GO:0036353 | histone H2A-K119 monoubiquitination(GO:0036353) |
| 0.1 | 0.7 | GO:0032264 | IMP salvage(GO:0032264) |
| 0.1 | 0.1 | GO:2000481 | positive regulation of cAMP-dependent protein kinase activity(GO:2000481) |
| 0.1 | 0.2 | GO:2000170 | positive regulation of peptidyl-cysteine S-nitrosylation(GO:2000170) |
| 0.1 | 0.2 | GO:0045626 | negative regulation of T-helper 1 cell differentiation(GO:0045626) |
| 0.1 | 0.2 | GO:1900157 | regulation of bone mineralization involved in bone maturation(GO:1900157) |
| 0.1 | 0.3 | GO:0010815 | bradykinin catabolic process(GO:0010815) |
| 0.1 | 0.2 | GO:0035585 | calcium-mediated signaling using extracellular calcium source(GO:0035585) |
| 0.1 | 0.1 | GO:0010847 | regulation of chromatin assembly(GO:0010847) |
| 0.1 | 0.1 | GO:0060994 | regulation of transcription from RNA polymerase II promoter involved in kidney development(GO:0060994) |
| 0.1 | 0.2 | GO:0070315 | G1 to G0 transition involved in cell differentiation(GO:0070315) |
| 0.1 | 0.1 | GO:0036363 | transforming growth factor beta activation(GO:0036363) |
| 0.1 | 0.5 | GO:1901525 | negative regulation of macromitophagy(GO:1901525) |
| 0.1 | 0.2 | GO:0061090 | positive regulation of sequestering of zinc ion(GO:0061090) |
| 0.1 | 0.1 | GO:0098928 | presynaptic signal transduction(GO:0098928) presynapse to nucleus signaling pathway(GO:0099526) |
| 0.1 | 0.2 | GO:0052055 | modulation by symbiont of host molecular function(GO:0052055) modulation of catalytic activity in other organism involved in symbiotic interaction(GO:0052203) modulation by host of symbiont catalytic activity(GO:0052422) |
| 0.1 | 0.3 | GO:0018125 | peptidyl-cysteine methylation(GO:0018125) |
| 0.1 | 0.3 | GO:0002572 | pro-T cell differentiation(GO:0002572) |
| 0.1 | 0.3 | GO:0000415 | negative regulation of histone H3-K36 methylation(GO:0000415) |
| 0.1 | 0.8 | GO:0099628 | receptor diffusion trapping(GO:0098953) postsynaptic neurotransmitter receptor diffusion trapping(GO:0098970) neurotransmitter receptor diffusion trapping(GO:0099628) |
| 0.1 | 0.4 | GO:0001831 | trophectodermal cellular morphogenesis(GO:0001831) |
| 0.1 | 0.3 | GO:0042938 | dipeptide transport(GO:0042938) |
| 0.1 | 0.1 | GO:1901074 | regulation of engulfment of apoptotic cell(GO:1901074) |
| 0.1 | 0.7 | GO:0070574 | cadmium ion transport(GO:0015691) cadmium ion transmembrane transport(GO:0070574) |
| 0.1 | 0.3 | GO:0032053 | ciliary basal body organization(GO:0032053) |
| 0.1 | 0.6 | GO:0010587 | miRNA catabolic process(GO:0010587) |
| 0.1 | 0.5 | GO:0015074 | DNA integration(GO:0015074) |
| 0.1 | 0.5 | GO:0061343 | cell adhesion involved in heart morphogenesis(GO:0061343) |
| 0.1 | 0.1 | GO:1904306 | positive regulation of gastro-intestinal system smooth muscle contraction(GO:1904306) |
| 0.1 | 0.3 | GO:0010808 | positive regulation of synaptic vesicle priming(GO:0010808) |
| 0.1 | 0.2 | GO:0051385 | response to mineralocorticoid(GO:0051385) |
| 0.1 | 1.7 | GO:0070884 | regulation of calcineurin-NFAT signaling cascade(GO:0070884) |
| 0.1 | 0.2 | GO:0045041 | positive regulation of T cell mediated immune response to tumor cell(GO:0002842) protein import into mitochondrial intermembrane space(GO:0045041) |
| 0.1 | 1.1 | GO:0070816 | phosphorylation of RNA polymerase II C-terminal domain(GO:0070816) |
| 0.1 | 0.1 | GO:0036016 | response to interleukin-3(GO:0036015) cellular response to interleukin-3(GO:0036016) |
| 0.1 | 0.2 | GO:1903028 | regulation of opsonization(GO:1903027) positive regulation of opsonization(GO:1903028) |
| 0.1 | 0.5 | GO:0033564 | anterior/posterior axon guidance(GO:0033564) |
| 0.1 | 0.3 | GO:0021993 | initiation of neural tube closure(GO:0021993) |
| 0.1 | 0.3 | GO:0033326 | cerebrospinal fluid secretion(GO:0033326) |
| 0.1 | 0.4 | GO:0072318 | clathrin coat disassembly(GO:0072318) |
| 0.1 | 0.4 | GO:2001032 | regulation of double-strand break repair via nonhomologous end joining(GO:2001032) |
| 0.1 | 0.5 | GO:0033353 | S-adenosylmethionine cycle(GO:0033353) |
| 0.1 | 0.4 | GO:0086045 | membrane depolarization during AV node cell action potential(GO:0086045) |
| 0.1 | 0.3 | GO:0034773 | histone H4-K20 trimethylation(GO:0034773) |
| 0.1 | 0.3 | GO:0033364 | mast cell secretory granule organization(GO:0033364) |
| 0.1 | 0.9 | GO:0090336 | positive regulation of brown fat cell differentiation(GO:0090336) |
| 0.1 | 1.0 | GO:0010603 | regulation of cytoplasmic mRNA processing body assembly(GO:0010603) |
| 0.1 | 0.2 | GO:0048687 | positive regulation of sprouting of injured axon(GO:0048687) positive regulation of axon extension involved in regeneration(GO:0048691) |
| 0.1 | 0.2 | GO:0043973 | histone H3-K4 acetylation(GO:0043973) |
| 0.1 | 0.3 | GO:0000454 | snoRNA guided rRNA pseudouridine synthesis(GO:0000454) telomerase RNA stabilization(GO:0090669) |
| 0.1 | 0.2 | GO:1905053 | regulation of base-excision repair(GO:1905051) positive regulation of base-excision repair(GO:1905053) |
| 0.1 | 0.5 | GO:0000056 | ribosomal small subunit export from nucleus(GO:0000056) |
| 0.1 | 0.7 | GO:0097067 | cellular response to thyroid hormone stimulus(GO:0097067) |
| 0.1 | 0.2 | GO:0035441 | cell migration involved in vasculogenesis(GO:0035441) |
| 0.1 | 0.2 | GO:1901421 | positive regulation of response to alcohol(GO:1901421) |
| 0.1 | 0.4 | GO:0071802 | negative regulation of podosome assembly(GO:0071802) |
| 0.1 | 0.3 | GO:0039536 | regulation of RIG-I signaling pathway(GO:0039535) negative regulation of RIG-I signaling pathway(GO:0039536) |
| 0.1 | 0.4 | GO:0071481 | cellular response to X-ray(GO:0071481) |
| 0.1 | 0.2 | GO:0001994 | norepinephrine-epinephrine vasoconstriction involved in regulation of systemic arterial blood pressure(GO:0001994) |
| 0.1 | 0.2 | GO:1903976 | negative regulation of glial cell migration(GO:1903976) |
| 0.1 | 0.3 | GO:1900170 | negative regulation of glucocorticoid mediated signaling pathway(GO:1900170) |
| 0.1 | 0.1 | GO:0060599 | lateral sprouting involved in mammary gland duct morphogenesis(GO:0060599) |
| 0.1 | 0.1 | GO:0060685 | regulation of prostatic bud formation(GO:0060685) negative regulation of prostatic bud formation(GO:0060686) |
| 0.1 | 0.4 | GO:0006297 | nucleotide-excision repair, DNA gap filling(GO:0006297) |
| 0.1 | 0.1 | GO:0014012 | peripheral nervous system axon regeneration(GO:0014012) |
| 0.1 | 0.4 | GO:0072553 | terminal button organization(GO:0072553) |
| 0.1 | 0.2 | GO:0061743 | motor learning(GO:0061743) |
| 0.1 | 0.3 | GO:0045716 | positive regulation of low-density lipoprotein particle receptor biosynthetic process(GO:0045716) |
| 0.1 | 0.1 | GO:0002277 | myeloid dendritic cell activation involved in immune response(GO:0002277) |
| 0.1 | 0.2 | GO:0006226 | dUMP biosynthetic process(GO:0006226) |
| 0.1 | 0.2 | GO:0061146 | Peyer's patch morphogenesis(GO:0061146) |
| 0.1 | 0.2 | GO:0007158 | neuron cell-cell adhesion(GO:0007158) |
| 0.1 | 0.2 | GO:1902966 | regulation of protein localization to early endosome(GO:1902965) positive regulation of protein localization to early endosome(GO:1902966) |
| 0.1 | 0.4 | GO:0043353 | enucleate erythrocyte differentiation(GO:0043353) |
| 0.1 | 0.1 | GO:0061110 | dense core granule biogenesis(GO:0061110) |
| 0.1 | 0.3 | GO:0010920 | negative regulation of inositol phosphate biosynthetic process(GO:0010920) |
| 0.1 | 1.2 | GO:0060218 | hematopoietic stem cell differentiation(GO:0060218) |
| 0.0 | 0.2 | GO:0050915 | sensory perception of sour taste(GO:0050915) |
| 0.0 | 0.5 | GO:0070072 | vacuolar proton-transporting V-type ATPase complex assembly(GO:0070072) |
| 0.0 | 0.3 | GO:0010025 | wax biosynthetic process(GO:0010025) wax metabolic process(GO:0010166) |
| 0.0 | 0.3 | GO:0033685 | negative regulation of luteinizing hormone secretion(GO:0033685) |
| 0.0 | 0.3 | GO:0016266 | O-glycan processing(GO:0016266) |
| 0.0 | 0.4 | GO:0031848 | protection from non-homologous end joining at telomere(GO:0031848) |
| 0.0 | 0.3 | GO:1903691 | positive regulation of wound healing, spreading of epidermal cells(GO:1903691) |
| 0.0 | 0.1 | GO:1901675 | negative regulation of histone H3-K27 acetylation(GO:1901675) |
| 0.0 | 0.2 | GO:0097350 | neutrophil clearance(GO:0097350) |
| 0.0 | 0.4 | GO:0036371 | protein localization to M-band(GO:0036309) protein localization to T-tubule(GO:0036371) |
| 0.0 | 0.2 | GO:0097343 | ripoptosome assembly(GO:0097343) ripoptosome assembly involved in necroptotic process(GO:1901026) |
| 0.0 | 0.2 | GO:0035989 | tendon development(GO:0035989) |
| 0.0 | 0.3 | GO:0045925 | positive regulation of female receptivity(GO:0045925) |
| 0.0 | 0.2 | GO:0045163 | clustering of voltage-gated potassium channels(GO:0045163) |
| 0.0 | 0.2 | GO:0051684 | maintenance of Golgi location(GO:0051684) |
| 0.0 | 0.2 | GO:2000721 | positive regulation of transcription from RNA polymerase II promoter involved in smooth muscle cell differentiation(GO:2000721) |
| 0.0 | 0.1 | GO:0071579 | regulation of zinc ion transport(GO:0071579) |
| 0.0 | 0.5 | GO:0018095 | protein polyglutamylation(GO:0018095) |
| 0.0 | 0.1 | GO:0021563 | glossopharyngeal nerve development(GO:0021563) |
| 0.0 | 0.3 | GO:0016185 | synaptic vesicle budding from presynaptic endocytic zone membrane(GO:0016185) |
| 0.0 | 0.1 | GO:0031133 | regulation of axon diameter(GO:0031133) |
| 0.0 | 0.5 | GO:2000169 | regulation of peptidyl-cysteine S-nitrosylation(GO:2000169) |
| 0.0 | 0.1 | GO:0002305 | gamma-delta intraepithelial T cell differentiation(GO:0002304) CD8-positive, gamma-delta intraepithelial T cell differentiation(GO:0002305) |
| 0.0 | 0.6 | GO:2000042 | negative regulation of double-strand break repair via homologous recombination(GO:2000042) |
| 0.0 | 0.2 | GO:0034983 | peptidyl-lysine deacetylation(GO:0034983) |
| 0.0 | 0.1 | GO:0009726 | detection of nodal flow(GO:0003127) detection of endogenous stimulus(GO:0009726) |
| 0.0 | 0.4 | GO:1904261 | regulation of basement membrane assembly involved in embryonic body morphogenesis(GO:1904259) positive regulation of basement membrane assembly involved in embryonic body morphogenesis(GO:1904261) basement membrane assembly involved in embryonic body morphogenesis(GO:2001197) |
| 0.0 | 0.2 | GO:0001692 | histamine metabolic process(GO:0001692) |
| 0.0 | 0.1 | GO:0014858 | positive regulation of skeletal muscle cell proliferation(GO:0014858) positive regulation of skeletal muscle satellite cell proliferation(GO:1902724) positive regulation of growth factor dependent skeletal muscle satellite cell proliferation(GO:1902728) |
| 0.0 | 0.2 | GO:0010956 | negative regulation of calcidiol 1-monooxygenase activity(GO:0010956) |
| 0.0 | 0.9 | GO:0046597 | negative regulation of viral entry into host cell(GO:0046597) |
| 0.0 | 0.2 | GO:1902261 | positive regulation of delayed rectifier potassium channel activity(GO:1902261) |
| 0.0 | 0.3 | GO:0043654 | recognition of apoptotic cell(GO:0043654) |
| 0.0 | 0.2 | GO:0035993 | subthalamic nucleus development(GO:0021763) deltoid tuberosity development(GO:0035993) superior vena cava morphogenesis(GO:0060578) |
| 0.0 | 0.1 | GO:0007386 | compartment pattern specification(GO:0007386) |
| 0.0 | 0.1 | GO:0006436 | tryptophanyl-tRNA aminoacylation(GO:0006436) |
| 0.0 | 0.1 | GO:0033184 | positive regulation of histone ubiquitination(GO:0033184) |
| 0.0 | 0.1 | GO:1900223 | positive regulation of beta-amyloid clearance(GO:1900223) |
| 0.0 | 0.3 | GO:0002457 | T cell antigen processing and presentation(GO:0002457) |
| 0.0 | 0.4 | GO:0016584 | nucleosome positioning(GO:0016584) |
| 0.0 | 0.2 | GO:0051012 | microtubule sliding(GO:0051012) |
| 0.0 | 0.3 | GO:0030263 | apoptotic chromosome condensation(GO:0030263) |
| 0.0 | 0.9 | GO:0000188 | inactivation of MAPK activity(GO:0000188) |
| 0.0 | 0.3 | GO:0015015 | heparan sulfate proteoglycan biosynthetic process, enzymatic modification(GO:0015015) |
| 0.0 | 0.2 | GO:0014054 | positive regulation of gamma-aminobutyric acid secretion(GO:0014054) |
| 0.0 | 0.4 | GO:0080182 | histone H3-K4 trimethylation(GO:0080182) |
| 0.0 | 0.1 | GO:0098989 | NMDA selective glutamate receptor signaling pathway(GO:0098989) |
| 0.0 | 0.5 | GO:0038063 | collagen-activated tyrosine kinase receptor signaling pathway(GO:0038063) |
| 0.0 | 0.0 | GO:0007208 | phospholipase C-activating serotonin receptor signaling pathway(GO:0007208) |
| 0.0 | 0.1 | GO:0007195 | adenylate cyclase-inhibiting dopamine receptor signaling pathway(GO:0007195) |
| 0.0 | 0.3 | GO:0001672 | regulation of chromatin assembly or disassembly(GO:0001672) |
| 0.0 | 0.2 | GO:0061153 | trachea submucosa development(GO:0061152) trachea gland development(GO:0061153) |
| 0.0 | 0.0 | GO:0090244 | Wnt signaling pathway involved in somitogenesis(GO:0090244) |
| 0.0 | 0.1 | GO:0001992 | regulation of systemic arterial blood pressure by vasopressin(GO:0001992) |
| 0.0 | 0.1 | GO:1903596 | regulation of gap junction assembly(GO:1903596) positive regulation of gap junction assembly(GO:1903598) |
| 0.0 | 0.2 | GO:0002023 | reduction of food intake in response to dietary excess(GO:0002023) |
| 0.0 | 0.0 | GO:2000860 | positive regulation of mineralocorticoid secretion(GO:2000857) positive regulation of aldosterone secretion(GO:2000860) |
| 0.0 | 0.2 | GO:0072133 | kidney mesenchyme morphogenesis(GO:0072131) metanephric mesenchyme morphogenesis(GO:0072133) |
| 0.0 | 0.3 | GO:0099633 | protein localization to postsynaptic specialization membrane(GO:0099633) neurotransmitter receptor localization to postsynaptic specialization membrane(GO:0099645) |
| 0.0 | 0.9 | GO:0007625 | grooming behavior(GO:0007625) |
| 0.0 | 0.3 | GO:0045200 | establishment or maintenance of neuroblast polarity(GO:0045196) establishment of neuroblast polarity(GO:0045200) |
| 0.0 | 0.1 | GO:0030573 | bile acid catabolic process(GO:0030573) |
| 0.0 | 0.1 | GO:0071947 | protein deubiquitination involved in ubiquitin-dependent protein catabolic process(GO:0071947) |
| 0.0 | 0.3 | GO:0006265 | DNA topological change(GO:0006265) |
| 0.0 | 0.4 | GO:0010886 | positive regulation of cholesterol storage(GO:0010886) |
| 0.0 | 0.0 | GO:0048022 | negative regulation of melanin biosynthetic process(GO:0048022) negative regulation of secondary metabolite biosynthetic process(GO:1900377) |
| 0.0 | 0.1 | GO:0009804 | coumarin metabolic process(GO:0009804) dibenzo-p-dioxin metabolic process(GO:0018894) |
| 0.0 | 0.4 | GO:0098703 | calcium ion import across plasma membrane(GO:0098703) calcium ion import into cell(GO:1990035) |
| 0.0 | 0.2 | GO:0098532 | histone H3-K27 trimethylation(GO:0098532) |
| 0.0 | 0.2 | GO:0010616 | negative regulation of cardiac muscle adaptation(GO:0010616) |
| 0.0 | 0.4 | GO:0097461 | ferric iron import into cell(GO:0097461) ferric iron import across plasma membrane(GO:0098706) |
| 0.0 | 0.2 | GO:0006868 | glutamine transport(GO:0006868) |
| 0.0 | 0.6 | GO:0071340 | skeletal muscle acetylcholine-gated channel clustering(GO:0071340) |
| 0.0 | 1.0 | GO:0040015 | negative regulation of multicellular organism growth(GO:0040015) |
| 0.0 | 1.0 | GO:0048026 | positive regulation of mRNA splicing, via spliceosome(GO:0048026) |
| 0.0 | 0.0 | GO:0035910 | ascending aorta development(GO:0035905) ascending aorta morphogenesis(GO:0035910) |
| 0.0 | 0.3 | GO:0002315 | marginal zone B cell differentiation(GO:0002315) |
| 0.0 | 0.4 | GO:0035563 | positive regulation of chromatin binding(GO:0035563) |
| 0.0 | 0.2 | GO:0090527 | actin filament reorganization(GO:0090527) |
| 0.0 | 0.0 | GO:0014834 | skeletal muscle satellite cell maintenance involved in skeletal muscle regeneration(GO:0014834) |
| 0.0 | 0.2 | GO:0021957 | corticospinal tract morphogenesis(GO:0021957) |
| 0.0 | 0.7 | GO:0001967 | suckling behavior(GO:0001967) |
| 0.0 | 0.2 | GO:0003150 | muscular septum morphogenesis(GO:0003150) |
| 0.0 | 0.3 | GO:2000483 | negative regulation of interleukin-8 secretion(GO:2000483) |
| 0.0 | 0.0 | GO:2001271 | regulation of cysteine-type endopeptidase activity involved in execution phase of apoptosis(GO:2001270) negative regulation of cysteine-type endopeptidase activity involved in execution phase of apoptosis(GO:2001271) |
| 0.0 | 0.2 | GO:0048341 | paraxial mesoderm formation(GO:0048341) |
| 0.0 | 0.5 | GO:0090331 | negative regulation of platelet aggregation(GO:0090331) |
| 0.0 | 0.1 | GO:0035526 | retrograde transport, plasma membrane to Golgi(GO:0035526) |
| 0.0 | 0.1 | GO:0003195 | tricuspid valve formation(GO:0003195) |
| 0.0 | 0.1 | GO:1905000 | regulation of membrane repolarization during atrial cardiac muscle cell action potential(GO:1905000) |
| 0.0 | 0.3 | GO:1902474 | positive regulation of protein localization to synapse(GO:1902474) |
| 0.0 | 0.2 | GO:0007217 | tachykinin receptor signaling pathway(GO:0007217) |
| 0.0 | 0.9 | GO:0035162 | embryonic hemopoiesis(GO:0035162) |
| 0.0 | 0.2 | GO:2000327 | regulation of ligand-dependent nuclear receptor transcription coactivator activity(GO:2000325) positive regulation of ligand-dependent nuclear receptor transcription coactivator activity(GO:2000327) |
| 0.0 | 0.1 | GO:0070093 | negative regulation of glucagon secretion(GO:0070093) |
| 0.0 | 0.4 | GO:1900028 | negative regulation of ruffle assembly(GO:1900028) |
| 0.0 | 0.4 | GO:0070914 | UV-damage excision repair(GO:0070914) |
| 0.0 | 0.1 | GO:0032417 | positive regulation of sodium:proton antiporter activity(GO:0032417) monocyte extravasation(GO:0035696) interleukin-15-mediated signaling pathway(GO:0035723) activation of meiosis involved in egg activation(GO:0060466) cellular response to interleukin-15(GO:0071350) response to fluoride(GO:1902617) regulation of monocyte extravasation(GO:2000437) |
| 0.0 | 0.4 | GO:0048672 | positive regulation of collateral sprouting(GO:0048672) |
| 0.0 | 1.2 | GO:0048169 | regulation of long-term neuronal synaptic plasticity(GO:0048169) |
| 0.0 | 0.4 | GO:0035278 | miRNA mediated inhibition of translation(GO:0035278) negative regulation of translation, ncRNA-mediated(GO:0040033) regulation of translation, ncRNA-mediated(GO:0045974) |
| 0.0 | 0.1 | GO:0044341 | sodium-dependent phosphate transport(GO:0044341) |
| 0.0 | 0.5 | GO:1901898 | negative regulation of relaxation of cardiac muscle(GO:1901898) |
| 0.0 | 0.1 | GO:0019072 | viral genome packaging(GO:0019072) viral RNA genome packaging(GO:0019074) |
| 0.0 | 0.2 | GO:0032915 | positive regulation of transforming growth factor beta2 production(GO:0032915) |
| 0.0 | 0.0 | GO:0072284 | comma-shaped body morphogenesis(GO:0072049) metanephric S-shaped body morphogenesis(GO:0072284) |
| 0.0 | 0.3 | GO:0035887 | aortic smooth muscle cell differentiation(GO:0035887) |
| 0.0 | 1.3 | GO:0090162 | establishment of epithelial cell polarity(GO:0090162) |
| 0.0 | 0.5 | GO:0002091 | negative regulation of receptor internalization(GO:0002091) |
| 0.0 | 0.4 | GO:0060012 | synaptic transmission, glycinergic(GO:0060012) |
| 0.0 | 0.2 | GO:0009650 | UV protection(GO:0009650) |
| 0.0 | 0.1 | GO:1903490 | regulation of cytokinetic process(GO:0032954) regulation of mitotic cytokinetic process(GO:1903436) positive regulation of mitotic cytokinetic process(GO:1903438) positive regulation of mitotic cytokinesis(GO:1903490) |
| 0.0 | 0.3 | GO:0043589 | skin morphogenesis(GO:0043589) |
| 0.0 | 0.2 | GO:0014063 | negative regulation of serotonin secretion(GO:0014063) cellular response to temperature stimulus(GO:0071502) |
| 0.0 | 0.2 | GO:2000819 | regulation of nucleotide-excision repair(GO:2000819) |
| 0.0 | 0.1 | GO:0060075 | regulation of resting membrane potential(GO:0060075) |
| 0.0 | 0.1 | GO:0000320 | re-entry into mitotic cell cycle(GO:0000320) |
| 0.0 | 0.1 | GO:0021812 | neuronal-glial interaction involved in cerebral cortex radial glia guided migration(GO:0021812) |
| 0.0 | 0.3 | GO:0044062 | regulation of excretion(GO:0044062) |
| 0.0 | 0.3 | GO:0010032 | meiotic chromosome condensation(GO:0010032) |
| 0.0 | 0.4 | GO:0032516 | positive regulation of phosphoprotein phosphatase activity(GO:0032516) |
| 0.0 | 0.2 | GO:0048496 | maintenance of organ identity(GO:0048496) |
| 0.0 | 0.2 | GO:0021562 | vestibulocochlear nerve development(GO:0021562) |
| 0.0 | 0.3 | GO:1900042 | positive regulation of interleukin-2 secretion(GO:1900042) |
| 0.0 | 0.0 | GO:0086017 | Purkinje myocyte action potential(GO:0086017) |
| 0.0 | 0.3 | GO:2000467 | insulin receptor signaling pathway via phosphatidylinositol 3-kinase(GO:0038028) positive regulation of glycogen (starch) synthase activity(GO:2000467) |
| 0.0 | 0.2 | GO:0045356 | positive regulation of interferon-alpha biosynthetic process(GO:0045356) |
| 0.0 | 0.1 | GO:0097278 | complement-dependent cytotoxicity(GO:0097278) |
| 0.0 | 0.1 | GO:0035973 | aggrephagy(GO:0035973) |
| 0.0 | 0.7 | GO:0035855 | megakaryocyte development(GO:0035855) |
| 0.0 | 0.1 | GO:0060618 | nipple development(GO:0060618) |
| 0.0 | 0.5 | GO:0007588 | excretion(GO:0007588) |
| 0.0 | 0.1 | GO:0051794 | regulation of catagen(GO:0051794) |
| 0.0 | 0.2 | GO:0070561 | vitamin D receptor signaling pathway(GO:0070561) |
| 0.0 | 0.1 | GO:1901842 | negative regulation of high voltage-gated calcium channel activity(GO:1901842) |
| 0.0 | 0.3 | GO:0021815 | modulation of microtubule cytoskeleton involved in cerebral cortex radial glia guided migration(GO:0021815) |
| 0.0 | 0.3 | GO:2000096 | positive regulation of Wnt signaling pathway, planar cell polarity pathway(GO:2000096) |
| 0.0 | 0.0 | GO:0060166 | olfactory pit development(GO:0060166) |
| 0.0 | 0.1 | GO:0097252 | negative regulation of interleukin-13 production(GO:0032696) oligodendrocyte apoptotic process(GO:0097252) |
| 0.0 | 0.3 | GO:0000290 | deadenylation-dependent decapping of nuclear-transcribed mRNA(GO:0000290) |
| 0.0 | 0.1 | GO:0001806 | type IV hypersensitivity(GO:0001806) |
| 0.0 | 0.2 | GO:0042074 | cell migration involved in gastrulation(GO:0042074) |
| 0.0 | 0.4 | GO:0006654 | phosphatidic acid biosynthetic process(GO:0006654) |
| 0.0 | 0.0 | GO:1990009 | retinal cell apoptotic process(GO:1990009) |
| 0.0 | 0.1 | GO:1900248 | cytoplasmic translational elongation(GO:0002182) regulation of cytoplasmic translational elongation(GO:1900247) negative regulation of cytoplasmic translational elongation(GO:1900248) positive regulation of mRNA polyadenylation(GO:1900365) |
| 0.0 | 0.1 | GO:1903048 | regulation of acetylcholine-gated cation channel activity(GO:1903048) |
| 0.0 | 0.1 | GO:0072718 | response to cisplatin(GO:0072718) |
| 0.0 | 0.3 | GO:0043981 | histone H4-K5 acetylation(GO:0043981) histone H4-K8 acetylation(GO:0043982) |
| 0.0 | 0.2 | GO:0060982 | coronary artery morphogenesis(GO:0060982) |
| 0.0 | 0.2 | GO:1905206 | positive regulation of hydrogen peroxide-induced cell death(GO:1905206) |
| 0.0 | 0.1 | GO:1902564 | negative regulation of neutrophil degranulation(GO:0043314) negative regulation of blood vessel remodeling(GO:0060313) negative regulation of neutrophil activation(GO:1902564) |
| 0.0 | 0.1 | GO:2000586 | regulation of platelet-derived growth factor receptor-beta signaling pathway(GO:2000586) |
| 0.0 | 0.1 | GO:1904158 | axonemal central apparatus assembly(GO:1904158) |
| 0.0 | 0.1 | GO:2000987 | positive regulation of fear response(GO:1903367) positive regulation of behavioral fear response(GO:2000987) |
| 0.0 | 0.5 | GO:0045056 | transcytosis(GO:0045056) |
| 0.0 | 0.1 | GO:0072619 | interleukin-21 production(GO:0032625) interleukin-21 secretion(GO:0072619) |
| 0.0 | 0.1 | GO:1904425 | negative regulation of GTP binding(GO:1904425) |
| 0.0 | 0.1 | GO:0033140 | negative regulation of peptidyl-serine phosphorylation of STAT protein(GO:0033140) |
| 0.0 | 0.2 | GO:0014004 | microglia differentiation(GO:0014004) microglia development(GO:0014005) |
| 0.0 | 0.2 | GO:2000035 | regulation of stem cell division(GO:2000035) |
| 0.0 | 0.2 | GO:0042769 | DNA damage response, detection of DNA damage(GO:0042769) |
| 0.0 | 0.2 | GO:0030321 | transepithelial chloride transport(GO:0030321) |
| 0.0 | 0.1 | GO:1990839 | response to endothelin(GO:1990839) |
| 0.0 | 0.4 | GO:0021796 | cerebral cortex regionalization(GO:0021796) |
| 0.0 | 0.2 | GO:0035879 | lactate transport(GO:0015727) lactate transmembrane transport(GO:0035873) plasma membrane lactate transport(GO:0035879) |
| 0.0 | 0.1 | GO:0070375 | ERK5 cascade(GO:0070375) |
| 0.0 | 0.1 | GO:0006550 | isoleucine catabolic process(GO:0006550) |
| 0.0 | 0.4 | GO:0015747 | urate transport(GO:0015747) |
| 0.0 | 0.8 | GO:0045197 | establishment or maintenance of epithelial cell apical/basal polarity(GO:0045197) |
| 0.0 | 0.4 | GO:0048312 | intracellular distribution of mitochondria(GO:0048312) |
| 0.0 | 0.2 | GO:0043619 | regulation of transcription from RNA polymerase II promoter in response to oxidative stress(GO:0043619) |
| 0.0 | 0.1 | GO:0006382 | adenosine to inosine editing(GO:0006382) |
| 0.0 | 0.2 | GO:0035635 | entry of bacterium into host cell(GO:0035635) regulation of entry of bacterium into host cell(GO:2000535) |
| 0.0 | 0.1 | GO:0006529 | asparagine biosynthetic process(GO:0006529) |
| 0.0 | 0.1 | GO:0070358 | actin polymerization-dependent cell motility(GO:0070358) |
| 0.0 | 0.1 | GO:0046952 | ketone body catabolic process(GO:0046952) |
| 0.0 | 0.1 | GO:0003218 | cardiac left ventricle formation(GO:0003218) |
| 0.0 | 0.1 | GO:2001201 | regulation of transforming growth factor-beta secretion(GO:2001201) |
| 0.0 | 0.2 | GO:0051151 | negative regulation of smooth muscle cell differentiation(GO:0051151) |
| 0.0 | 0.4 | GO:0071850 | mitotic cell cycle arrest(GO:0071850) |
| 0.0 | 0.2 | GO:0007501 | mesodermal cell fate specification(GO:0007501) |
| 0.0 | 0.1 | GO:0044240 | multicellular organism lipid catabolic process(GO:0044240) |
| 0.0 | 0.4 | GO:0015816 | glycine transport(GO:0015816) |
| 0.0 | 0.1 | GO:0030859 | polarized epithelial cell differentiation(GO:0030859) |
| 0.0 | 0.1 | GO:0060414 | aorta smooth muscle tissue morphogenesis(GO:0060414) |
| 0.0 | 0.3 | GO:0071435 | potassium ion export(GO:0071435) |
| 0.0 | 0.1 | GO:0046600 | negative regulation of centriole replication(GO:0046600) |
| 0.0 | 0.2 | GO:0035871 | protein K11-linked deubiquitination(GO:0035871) |
| 0.0 | 0.1 | GO:0001712 | ectodermal cell fate commitment(GO:0001712) |
| 0.0 | 0.2 | GO:0045743 | positive regulation of fibroblast growth factor receptor signaling pathway(GO:0045743) |
| 0.0 | 0.0 | GO:0071500 | cellular response to nitrosative stress(GO:0071500) |
| 0.0 | 0.1 | GO:1903296 | regulation of glutamate secretion, neurotransmission(GO:1903294) positive regulation of glutamate secretion, neurotransmission(GO:1903296) |
| 0.0 | 0.2 | GO:2000807 | regulation of synaptic vesicle clustering(GO:2000807) |
| 0.0 | 0.0 | GO:0035026 | leading edge cell differentiation(GO:0035026) |
| 0.0 | 0.0 | GO:0099590 | neurotransmitter receptor internalization(GO:0099590) |
| 0.0 | 0.0 | GO:0043382 | positive regulation of memory T cell differentiation(GO:0043382) |
| 0.0 | 0.0 | GO:0003093 | regulation of glomerular filtration(GO:0003093) |
| 0.0 | 0.1 | GO:0006651 | diacylglycerol biosynthetic process(GO:0006651) |
| 0.0 | 0.1 | GO:0075509 | receptor-mediated endocytosis of virus by host cell(GO:0019065) endocytosis involved in viral entry into host cell(GO:0075509) |
| 0.0 | 0.1 | GO:1901738 | regulation of vitamin A metabolic process(GO:1901738) |
| 0.0 | 0.2 | GO:0010216 | maintenance of DNA methylation(GO:0010216) |
| 0.0 | 0.0 | GO:2000293 | regulation of defecation(GO:2000292) negative regulation of defecation(GO:2000293) |
| 0.0 | 0.2 | GO:0060159 | regulation of dopamine receptor signaling pathway(GO:0060159) |
| 0.0 | 0.3 | GO:0019934 | cGMP-mediated signaling(GO:0019934) |
| 0.0 | 0.2 | GO:0060903 | positive regulation of meiosis I(GO:0060903) |
| 0.0 | 0.0 | GO:2000542 | negative regulation of gastrulation(GO:2000542) |
| 0.0 | 0.4 | GO:0033120 | positive regulation of RNA splicing(GO:0033120) |
| 0.0 | 0.1 | GO:0033387 | putrescine biosynthetic process from ornithine(GO:0033387) |
| 0.0 | 0.6 | GO:0038066 | p38MAPK cascade(GO:0038066) |
| 0.0 | 0.1 | GO:0003096 | renal sodium ion transport(GO:0003096) renal sodium ion absorption(GO:0070294) |
| 0.0 | 0.1 | GO:0035106 | operant conditioning(GO:0035106) |
| 0.0 | 0.1 | GO:0003105 | negative regulation of glomerular filtration(GO:0003105) |
| 0.0 | 0.1 | GO:0048162 | preantral ovarian follicle growth(GO:0001546) multi-layer follicle stage(GO:0048162) |
| 0.0 | 0.1 | GO:0042538 | hyperosmotic salinity response(GO:0042538) |
| 0.0 | 0.1 | GO:0030208 | dermatan sulfate biosynthetic process(GO:0030208) |
| 0.0 | 0.1 | GO:0060385 | axonogenesis involved in innervation(GO:0060385) |
| 0.0 | 0.3 | GO:0035414 | negative regulation of catenin import into nucleus(GO:0035414) |
| 0.0 | 0.3 | GO:0042118 | endothelial cell activation(GO:0042118) |
| 0.0 | 0.2 | GO:0060040 | retinal bipolar neuron differentiation(GO:0060040) |
| 0.0 | 0.0 | GO:1903336 | negative regulation of vacuolar transport(GO:1903336) |
| 0.0 | 0.3 | GO:2000400 | positive regulation of T cell differentiation in thymus(GO:0033089) positive regulation of thymocyte aggregation(GO:2000400) |
| 0.0 | 0.2 | GO:0030948 | negative regulation of vascular endothelial growth factor receptor signaling pathway(GO:0030948) |
| 0.0 | 0.1 | GO:0010909 | regulation of heparan sulfate proteoglycan biosynthetic process(GO:0010908) positive regulation of heparan sulfate proteoglycan biosynthetic process(GO:0010909) canonical Wnt signaling pathway involved in positive regulation of epithelial to mesenchymal transition(GO:0044334) |
| 0.0 | 0.0 | GO:0021524 | visceral motor neuron differentiation(GO:0021524) |
| 0.0 | 0.1 | GO:0036414 | protein citrullination(GO:0018101) histone citrullination(GO:0036414) |
| 0.0 | 0.1 | GO:0007021 | tubulin complex assembly(GO:0007021) |
| 0.0 | 0.4 | GO:0044783 | G1 DNA damage checkpoint(GO:0044783) |
| 0.0 | 0.3 | GO:1901223 | negative regulation of NIK/NF-kappaB signaling(GO:1901223) |
| 0.0 | 0.1 | GO:0001759 | organ induction(GO:0001759) |
| 0.0 | 0.2 | GO:0061051 | positive regulation of cell growth involved in cardiac muscle cell development(GO:0061051) |
| 0.0 | 0.0 | GO:0036215 | response to stem cell factor(GO:0036215) cellular response to stem cell factor stimulus(GO:0036216) Kit signaling pathway(GO:0038109) |
| 0.0 | 0.1 | GO:0034727 | lysosomal microautophagy(GO:0016237) piecemeal microautophagy of nucleus(GO:0034727) suppression by virus of host autophagy(GO:0039521) negative regulation of sphingolipid biosynthesis involved in cellular sphingolipid homeostasis(GO:0090157) |
| 0.0 | 0.1 | GO:0061438 | renal system vasculature morphogenesis(GO:0061438) kidney vasculature morphogenesis(GO:0061439) |
| 0.0 | 0.1 | GO:1902570 | protein localization to nucleolus(GO:1902570) |
| 0.0 | 1.8 | GO:0001578 | microtubule bundle formation(GO:0001578) |
| 0.0 | 0.2 | GO:0002826 | negative regulation of T-helper 1 type immune response(GO:0002826) |
| 0.0 | 0.0 | GO:2000016 | negative regulation of determination of dorsal identity(GO:2000016) |
| 0.0 | 0.1 | GO:0050916 | sensory perception of sweet taste(GO:0050916) sensory perception of umami taste(GO:0050917) |
| 0.0 | 0.2 | GO:0071578 | zinc II ion transmembrane import(GO:0071578) |
| 0.0 | 0.1 | GO:0045292 | mRNA cis splicing, via spliceosome(GO:0045292) |
| 0.0 | 0.1 | GO:2000507 | positive regulation of energy homeostasis(GO:2000507) |
| 0.0 | 0.2 | GO:0032534 | regulation of microvillus assembly(GO:0032534) |
| 0.0 | 0.0 | GO:1901187 | regulation of ephrin receptor signaling pathway(GO:1901187) |
| 0.0 | 0.4 | GO:0007202 | activation of phospholipase C activity(GO:0007202) |
| 0.0 | 0.1 | GO:0007028 | cytoplasm organization(GO:0007028) |
| 0.0 | 0.2 | GO:0035024 | negative regulation of Rho protein signal transduction(GO:0035024) |
| 0.0 | 0.1 | GO:0090063 | positive regulation of microtubule nucleation(GO:0090063) |
| 0.0 | 0.2 | GO:0000012 | single strand break repair(GO:0000012) |
| 0.0 | 0.2 | GO:0010457 | centriole-centriole cohesion(GO:0010457) |
| 0.0 | 0.1 | GO:0048333 | mesodermal cell differentiation(GO:0048333) |
| 0.0 | 0.1 | GO:0030910 | olfactory placode formation(GO:0030910) olfactory placode development(GO:0071698) olfactory placode morphogenesis(GO:0071699) |
| 0.0 | 0.2 | GO:2000270 | negative regulation of fibroblast apoptotic process(GO:2000270) |
| 0.0 | 0.1 | GO:0070164 | negative regulation of adiponectin secretion(GO:0070164) |
| 0.0 | 0.1 | GO:2001280 | positive regulation of prostaglandin biosynthetic process(GO:0031394) positive regulation of unsaturated fatty acid biosynthetic process(GO:2001280) |
| 0.0 | 0.0 | GO:0046668 | regulation of retinal cell programmed cell death(GO:0046668) |
| 0.0 | 0.1 | GO:0006543 | glutamine catabolic process(GO:0006543) |
| 0.0 | 0.1 | GO:0001970 | positive regulation of activation of membrane attack complex(GO:0001970) |
| 0.0 | 0.0 | GO:0010446 | response to alkaline pH(GO:0010446) |
| 0.0 | 0.2 | GO:1900112 | regulation of histone H3-K9 trimethylation(GO:1900112) |
| 0.0 | 0.4 | GO:0007143 | female meiotic division(GO:0007143) |
| 0.0 | 0.5 | GO:0016574 | histone ubiquitination(GO:0016574) |
| 0.0 | 0.9 | GO:0006940 | regulation of smooth muscle contraction(GO:0006940) |
| 0.0 | 0.1 | GO:0061072 | voluntary musculoskeletal movement(GO:0050882) iris morphogenesis(GO:0061072) |
| 0.0 | 0.1 | GO:0019919 | peptidyl-arginine methylation, to asymmetrical-dimethyl arginine(GO:0019919) |
| 0.0 | 0.1 | GO:1904263 | positive regulation of TORC1 signaling(GO:1904263) |
| 0.0 | 0.3 | GO:1990001 | inhibition of cysteine-type endopeptidase activity involved in apoptotic process(GO:1990001) |
| 0.0 | 0.1 | GO:0060666 | dichotomous subdivision of terminal units involved in salivary gland branching(GO:0060666) |
| 0.0 | 0.1 | GO:0045602 | negative regulation of endothelial cell differentiation(GO:0045602) |
| 0.0 | 0.2 | GO:0030259 | lipid glycosylation(GO:0030259) |
| 0.0 | 0.3 | GO:0003299 | muscle hypertrophy in response to stress(GO:0003299) cardiac muscle hypertrophy in response to stress(GO:0014898) |
| 0.0 | 0.1 | GO:0030432 | peristalsis(GO:0030432) |
| 0.0 | 0.1 | GO:0035616 | histone H2B conserved C-terminal lysine deubiquitination(GO:0035616) |
| 0.0 | 0.2 | GO:0031507 | heterochromatin assembly(GO:0031507) |
| 0.0 | 0.1 | GO:1904378 | maintenance of unfolded protein(GO:0036506) tail-anchored membrane protein insertion into ER membrane(GO:0071816) maintenance of unfolded protein involved in ERAD pathway(GO:1904378) |
| 0.0 | 0.3 | GO:0010669 | epithelial structure maintenance(GO:0010669) |
| 0.0 | 0.1 | GO:0042823 | pyridoxal phosphate biosynthetic process(GO:0042823) |
| 0.0 | 0.1 | GO:0003214 | cardiac left ventricle morphogenesis(GO:0003214) |
| 0.0 | 0.1 | GO:0042541 | hemoglobin biosynthetic process(GO:0042541) |
| 0.0 | 0.1 | GO:0030327 | prenylated protein catabolic process(GO:0030327) |
| 0.0 | 0.0 | GO:0090309 | positive regulation of methylation-dependent chromatin silencing(GO:0090309) |
| 0.0 | 0.1 | GO:0090148 | membrane fission(GO:0090148) |
| 0.0 | 0.0 | GO:0035461 | vitamin transmembrane transport(GO:0035461) |
| 0.0 | 0.1 | GO:0002225 | positive regulation of antimicrobial peptide production(GO:0002225) positive regulation of antimicrobial humoral response(GO:0002760) positive regulation of antibacterial peptide production(GO:0002803) |
| 0.0 | 0.1 | GO:0015862 | uridine transport(GO:0015862) |
| 0.0 | 0.3 | GO:0071108 | protein K48-linked deubiquitination(GO:0071108) |
| 0.0 | 0.6 | GO:0043171 | peptide catabolic process(GO:0043171) |
| 0.0 | 1.0 | GO:1904893 | negative regulation of JAK-STAT cascade(GO:0046426) negative regulation of STAT cascade(GO:1904893) |
| 0.0 | 0.1 | GO:0015014 | heparan sulfate proteoglycan biosynthetic process, polysaccharide chain biosynthetic process(GO:0015014) |
| 0.0 | 0.2 | GO:0097264 | self proteolysis(GO:0097264) |
| 0.0 | 0.2 | GO:0006610 | ribosomal protein import into nucleus(GO:0006610) |
| 0.0 | 0.1 | GO:0090472 | dibasic protein processing(GO:0090472) |
| 0.0 | 0.1 | GO:0051387 | negative regulation of neurotrophin TRK receptor signaling pathway(GO:0051387) |
| 0.0 | 0.1 | GO:0034351 | negative regulation of glial cell apoptotic process(GO:0034351) |
| 0.0 | 1.7 | GO:0006334 | nucleosome assembly(GO:0006334) |
| 0.0 | 0.0 | GO:0009233 | menaquinone metabolic process(GO:0009233) phylloquinone metabolic process(GO:0042374) phylloquinone catabolic process(GO:0042376) quinone catabolic process(GO:1901662) |
| 0.0 | 0.2 | GO:0036065 | fucosylation(GO:0036065) |
| 0.0 | 0.0 | GO:0035426 | extracellular matrix-cell signaling(GO:0035426) |
| 0.0 | 0.1 | GO:0061052 | negative regulation of cell growth involved in cardiac muscle cell development(GO:0061052) |
| 0.0 | 0.0 | GO:0098971 | anterograde dendritic transport of neurotransmitter receptor complex(GO:0098971) |
| 0.0 | 0.2 | GO:0006968 | cellular defense response(GO:0006968) |
| 0.0 | 0.0 | GO:0033577 | protein glycosylation in endoplasmic reticulum(GO:0033577) |
| 0.0 | 0.1 | GO:2000766 | negative regulation of cytoplasmic translation(GO:2000766) |
| 0.0 | 0.3 | GO:0050913 | detection of chemical stimulus involved in sensory perception of bitter taste(GO:0001580) detection of chemical stimulus involved in sensory perception of taste(GO:0050912) sensory perception of bitter taste(GO:0050913) |
| 0.0 | 0.1 | GO:2000052 | positive regulation of non-canonical Wnt signaling pathway(GO:2000052) |
| 0.0 | 0.0 | GO:0055118 | negative regulation of cardiac muscle contraction(GO:0055118) regulation of cell communication by electrical coupling involved in cardiac conduction(GO:1901844) |
| 0.0 | 0.1 | GO:0033058 | directional locomotion(GO:0033058) |
| 0.0 | 0.0 | GO:0000101 | sulfur amino acid transport(GO:0000101) |
| 0.0 | 0.1 | GO:0030242 | pexophagy(GO:0030242) |
| 0.0 | 0.0 | GO:0043323 | positive regulation of natural killer cell degranulation(GO:0043323) |
| 0.0 | 0.1 | GO:0070236 | negative regulation of activation-induced cell death of T cells(GO:0070236) |
| 0.0 | 0.0 | GO:1900220 | semaphorin-plexin signaling pathway involved in bone trabecula morphogenesis(GO:1900220) |
| 0.0 | 0.0 | GO:0042796 | snRNA transcription from RNA polymerase II promoter(GO:0042795) snRNA transcription from RNA polymerase III promoter(GO:0042796) |
| 0.0 | 0.0 | GO:0032596 | protein transport into membrane raft(GO:0032596) |
| 0.0 | 0.1 | GO:0071847 | TNFSF11-mediated signaling pathway(GO:0071847) |
| 0.0 | 0.1 | GO:0015871 | choline transport(GO:0015871) |
| 0.0 | 0.1 | GO:1904587 | response to glycoprotein(GO:1904587) |
| 0.0 | 0.4 | GO:0030517 | negative regulation of axon extension(GO:0030517) |
| 0.0 | 0.0 | GO:0033313 | meiotic cell cycle checkpoint(GO:0033313) |
| 0.0 | 0.3 | GO:0035634 | response to stilbenoid(GO:0035634) |
| 0.0 | 0.1 | GO:0035721 | intraciliary retrograde transport(GO:0035721) |
| 0.0 | 0.1 | GO:0071421 | manganese ion transmembrane transport(GO:0071421) |
| 0.0 | 0.2 | GO:0034453 | microtubule anchoring(GO:0034453) |
| 0.0 | 0.1 | GO:0070268 | cornification(GO:0070268) |
| 0.0 | 0.3 | GO:0032011 | ARF protein signal transduction(GO:0032011) regulation of ARF protein signal transduction(GO:0032012) |
| 0.0 | 0.0 | GO:0061763 | multivesicular body-lysosome fusion(GO:0061763) |
| 0.0 | 0.0 | GO:0043553 | negative regulation of phosphatidylinositol 3-kinase activity(GO:0043553) |
| 0.0 | 0.4 | GO:0045022 | early endosome to late endosome transport(GO:0045022) |
| 0.0 | 0.1 | GO:0061086 | negative regulation of histone H3-K27 methylation(GO:0061086) |
| 0.0 | 0.0 | GO:0045213 | neurotransmitter receptor metabolic process(GO:0045213) |
| 0.0 | 0.0 | GO:0051295 | establishment of meiotic spindle localization(GO:0051295) negative regulation of meiotic cell cycle phase transition(GO:1901994) |
| 0.0 | 0.2 | GO:0060065 | uterus development(GO:0060065) |
| 0.0 | 0.0 | GO:0007512 | adult heart development(GO:0007512) |
| 0.0 | 0.1 | GO:0060174 | limb bud formation(GO:0060174) |
| 0.0 | 0.4 | GO:0006368 | transcription elongation from RNA polymerase II promoter(GO:0006368) |
| 0.0 | 0.1 | GO:0090070 | positive regulation of ribosome biogenesis(GO:0090070) positive regulation of rRNA processing(GO:2000234) |
| 0.0 | 0.0 | GO:0061033 | secretion by lung epithelial cell involved in lung growth(GO:0061033) |
| 0.0 | 0.8 | GO:1902017 | regulation of cilium assembly(GO:1902017) |
| 0.0 | 0.2 | GO:0007064 | mitotic sister chromatid cohesion(GO:0007064) |
| 0.0 | 0.0 | GO:0032687 | negative regulation of interferon-alpha production(GO:0032687) |
| 0.0 | 0.1 | GO:0090214 | spongiotrophoblast layer developmental growth(GO:0090214) |
| 0.0 | 0.1 | GO:2000491 | positive regulation of hepatic stellate cell activation(GO:2000491) |
| 0.0 | 0.0 | GO:0042732 | D-xylose metabolic process(GO:0042732) |
| 0.0 | 0.1 | GO:0031953 | negative regulation of protein autophosphorylation(GO:0031953) |
| 0.0 | 0.1 | GO:0006491 | N-glycan processing(GO:0006491) |
| 0.0 | 0.1 | GO:0090051 | negative regulation of cell migration involved in sprouting angiogenesis(GO:0090051) |
| 0.0 | 0.0 | GO:0002644 | negative regulation of tolerance induction(GO:0002644) |
| 0.0 | 0.1 | GO:0034063 | stress granule assembly(GO:0034063) |
| 0.0 | 0.1 | GO:0003215 | cardiac right ventricle morphogenesis(GO:0003215) |
| 0.0 | 0.1 | GO:0060011 | Sertoli cell proliferation(GO:0060011) |
| 0.0 | 0.1 | GO:2001269 | positive regulation of cysteine-type endopeptidase activity involved in apoptotic signaling pathway(GO:2001269) |
| 0.0 | 0.1 | GO:0006622 | protein targeting to lysosome(GO:0006622) |
| 0.0 | 0.1 | GO:0002291 | T cell activation via T cell receptor contact with antigen bound to MHC molecule on antigen presenting cell(GO:0002291) |
| 0.0 | 0.5 | GO:0060976 | coronary vasculature development(GO:0060976) |
| 0.0 | 0.0 | GO:0003162 | atrioventricular node development(GO:0003162) |
| 0.0 | 0.1 | GO:0032287 | peripheral nervous system myelin maintenance(GO:0032287) |
| 0.0 | 0.1 | GO:0001731 | formation of translation preinitiation complex(GO:0001731) |
| 0.0 | 0.0 | GO:0007199 | G-protein coupled receptor signaling pathway coupled to cGMP nucleotide second messenger(GO:0007199) |
| 0.0 | 0.1 | GO:0046007 | negative regulation of activated T cell proliferation(GO:0046007) |
| 0.0 | 0.0 | GO:1903525 | regulation of membrane tubulation(GO:1903525) positive regulation of membrane tubulation(GO:1903527) |
| 0.0 | 0.0 | GO:0006780 | uroporphyrinogen III biosynthetic process(GO:0006780) |
| 0.0 | 0.1 | GO:0045585 | regulation of cytotoxic T cell differentiation(GO:0045583) positive regulation of cytotoxic T cell differentiation(GO:0045585) |
| 0.0 | 0.0 | GO:0060454 | positive regulation of gastric acid secretion(GO:0060454) |
| 0.0 | 0.1 | GO:0007614 | short-term memory(GO:0007614) |
| 0.0 | 0.2 | GO:0016998 | cell wall macromolecule catabolic process(GO:0016998) |
| 0.0 | 0.1 | GO:0045947 | negative regulation of translational initiation(GO:0045947) |
| 0.0 | 0.1 | GO:0032464 | positive regulation of protein homooligomerization(GO:0032464) |
| 0.0 | 0.1 | GO:2000288 | positive regulation of myoblast proliferation(GO:2000288) |
| 0.0 | 0.0 | GO:0003278 | apoptotic process involved in heart morphogenesis(GO:0003278) |
| 0.0 | 0.1 | GO:0006621 | protein retention in ER lumen(GO:0006621) |
| 0.0 | 0.1 | GO:0035269 | protein O-linked mannosylation(GO:0035269) |
| 0.0 | 0.0 | GO:0021660 | rhombomere formation(GO:0021594) rhombomere 3 formation(GO:0021660) rhombomere 5 morphogenesis(GO:0021664) rhombomere 5 formation(GO:0021666) |
| 0.0 | 0.1 | GO:0032298 | positive regulation of DNA-dependent DNA replication initiation(GO:0032298) |
| 0.0 | 1.5 | GO:0042787 | protein ubiquitination involved in ubiquitin-dependent protein catabolic process(GO:0042787) |
| 0.0 | 0.1 | GO:0072321 | chaperone-mediated protein transport(GO:0072321) |
| 0.0 | 0.0 | GO:1990927 | calcium ion regulated lysosome exocytosis(GO:1990927) |
| 0.0 | 0.2 | GO:0010842 | retina layer formation(GO:0010842) |
| 0.0 | 0.4 | GO:0006378 | mRNA polyadenylation(GO:0006378) |
| 0.0 | 0.0 | GO:0007352 | zygotic specification of dorsal/ventral axis(GO:0007352) |
Gene overrepresentation in cellular component category:
| Log-likelihood per target | Total log-likelihood | Term | Description |
|---|---|---|---|
| 0.3 | 0.3 | GO:0044301 | climbing fiber(GO:0044301) |
| 0.3 | 0.8 | GO:0002944 | cyclin K-CDK12 complex(GO:0002944) |
| 0.3 | 1.0 | GO:0097059 | CNTFR-CLCF1 complex(GO:0097059) |
| 0.3 | 1.0 | GO:1990707 | subtelomeric heterochromatin(GO:1990421) nuclear subtelomeric heterochromatin(GO:1990707) |
| 0.2 | 1.9 | GO:0030478 | actin cap(GO:0030478) |
| 0.2 | 2.4 | GO:0097197 | tetraspanin-enriched microdomain(GO:0097197) |
| 0.2 | 0.3 | GO:0097129 | cyclin D2-CDK4 complex(GO:0097129) |
| 0.2 | 0.5 | GO:0044614 | nuclear pore cytoplasmic filaments(GO:0044614) |
| 0.1 | 1.5 | GO:0033093 | Weibel-Palade body(GO:0033093) |
| 0.1 | 0.4 | GO:0070381 | endosome to plasma membrane transport vesicle(GO:0070381) |
| 0.1 | 0.4 | GO:0005584 | collagen type I trimer(GO:0005584) |
| 0.1 | 2.3 | GO:0097470 | ribbon synapse(GO:0097470) |
| 0.1 | 1.8 | GO:0036038 | MKS complex(GO:0036038) |
| 0.1 | 0.4 | GO:0090537 | CERF complex(GO:0090537) |
| 0.1 | 0.4 | GO:0031084 | BLOC-2 complex(GO:0031084) |
| 0.1 | 0.3 | GO:0038045 | large latent transforming growth factor-beta complex(GO:0038045) |
| 0.1 | 0.4 | GO:0070033 | synaptobrevin 2-SNAP-25-syntaxin-1a-complexin II complex(GO:0070033) |
| 0.1 | 0.9 | GO:0001739 | sex chromatin(GO:0001739) |
| 0.1 | 0.3 | GO:0000799 | nuclear condensin complex(GO:0000799) |
| 0.1 | 1.3 | GO:0044294 | dendritic growth cone(GO:0044294) |
| 0.1 | 0.6 | GO:0072357 | PTW/PP1 phosphatase complex(GO:0072357) |
| 0.1 | 0.4 | GO:1990761 | growth cone lamellipodium(GO:1990761) |
| 0.1 | 0.5 | GO:0070776 | H3 histone acetyltransferase complex(GO:0070775) MOZ/MORF histone acetyltransferase complex(GO:0070776) |
| 0.1 | 1.4 | GO:0031235 | intrinsic component of the cytoplasmic side of the plasma membrane(GO:0031235) |
| 0.1 | 0.5 | GO:0005827 | polar microtubule(GO:0005827) |
| 0.1 | 0.2 | GO:0033596 | TSC1-TSC2 complex(GO:0033596) |
| 0.1 | 0.3 | GO:0090661 | box H/ACA telomerase RNP complex(GO:0090661) |
| 0.1 | 1.0 | GO:0097539 | ciliary transition fiber(GO:0097539) |
| 0.1 | 0.5 | GO:0000220 | vacuolar proton-transporting V-type ATPase, V0 domain(GO:0000220) |
| 0.1 | 0.4 | GO:0032983 | kainate selective glutamate receptor complex(GO:0032983) |
| 0.1 | 0.6 | GO:0097427 | microtubule bundle(GO:0097427) |
| 0.1 | 0.2 | GO:0034667 | integrin alpha3-beta1 complex(GO:0034667) |
| 0.1 | 1.0 | GO:0030665 | clathrin-coated vesicle membrane(GO:0030665) |
| 0.1 | 0.4 | GO:0033503 | HULC complex(GO:0033503) |
| 0.1 | 0.4 | GO:0098651 | collagen type IV trimer(GO:0005587) network-forming collagen trimer(GO:0098642) collagen network(GO:0098645) basement membrane collagen trimer(GO:0098651) |
| 0.1 | 0.4 | GO:0016327 | apicolateral plasma membrane(GO:0016327) |
| 0.1 | 0.2 | GO:0070442 | integrin alphaIIb-beta3 complex(GO:0070442) |
| 0.1 | 0.2 | GO:0044326 | dendritic spine neck(GO:0044326) |
| 0.1 | 0.4 | GO:0030896 | checkpoint clamp complex(GO:0030896) |
| 0.1 | 0.3 | GO:0048476 | Holliday junction resolvase complex(GO:0048476) |
| 0.1 | 1.5 | GO:0035098 | ESC/E(Z) complex(GO:0035098) |
| 0.1 | 2.4 | GO:0016592 | mediator complex(GO:0016592) |
| 0.1 | 0.2 | GO:0031095 | platelet dense tubular network membrane(GO:0031095) |
| 0.1 | 0.7 | GO:0031258 | lamellipodium membrane(GO:0031258) |
| 0.1 | 0.7 | GO:0031527 | filopodium membrane(GO:0031527) |
| 0.1 | 0.5 | GO:0005583 | fibrillar collagen trimer(GO:0005583) banded collagen fibril(GO:0098643) |
| 0.1 | 0.3 | GO:0097418 | neurofibrillary tangle(GO:0097418) |
| 0.1 | 0.2 | GO:0097058 | CRLF-CLCF1 complex(GO:0097058) |
| 0.0 | 0.1 | GO:0033193 | Lsd1/2 complex(GO:0033193) |
| 0.0 | 0.2 | GO:0061574 | ASAP complex(GO:0061574) |
| 0.0 | 2.0 | GO:0055038 | recycling endosome membrane(GO:0055038) |
| 0.0 | 0.4 | GO:0005883 | neurofilament(GO:0005883) |
| 0.0 | 4.5 | GO:0005905 | clathrin-coated pit(GO:0005905) |
| 0.0 | 0.8 | GO:0044300 | cerebellar mossy fiber(GO:0044300) |
| 0.0 | 0.2 | GO:0043259 | laminin-10 complex(GO:0043259) |
| 0.0 | 0.1 | GO:0055087 | Ski complex(GO:0055087) |
| 0.0 | 0.4 | GO:0016593 | Cdc73/Paf1 complex(GO:0016593) |
| 0.0 | 0.1 | GO:0036449 | microtubule minus-end(GO:0036449) |
| 0.0 | 0.2 | GO:0031680 | G-protein beta/gamma-subunit complex(GO:0031680) |
| 0.0 | 0.3 | GO:0035253 | ciliary rootlet(GO:0035253) |
| 0.0 | 0.1 | GO:0005940 | septin ring(GO:0005940) |
| 0.0 | 0.2 | GO:0030891 | VCB complex(GO:0030891) |
| 0.0 | 1.5 | GO:0043198 | dendritic shaft(GO:0043198) |
| 0.0 | 0.8 | GO:0035327 | transcriptionally active chromatin(GO:0035327) |
| 0.0 | 0.0 | GO:0032591 | dendritic spine membrane(GO:0032591) |
| 0.0 | 0.7 | GO:0048188 | Set1C/COMPASS complex(GO:0048188) |
| 0.0 | 0.3 | GO:0031465 | Cul4B-RING E3 ubiquitin ligase complex(GO:0031465) |
| 0.0 | 0.4 | GO:0097442 | CA3 pyramidal cell dendrite(GO:0097442) |
| 0.0 | 0.3 | GO:0044292 | dendrite terminus(GO:0044292) |
| 0.0 | 0.1 | GO:1990047 | spindle matrix(GO:1990047) |
| 0.0 | 0.9 | GO:0010369 | chromocenter(GO:0010369) |
| 0.0 | 0.3 | GO:0070695 | FHF complex(GO:0070695) |
| 0.0 | 0.3 | GO:0072557 | IPAF inflammasome complex(GO:0072557) |
| 0.0 | 0.2 | GO:0001651 | dense fibrillar component(GO:0001651) |
| 0.0 | 0.5 | GO:0097542 | ciliary tip(GO:0097542) |
| 0.0 | 0.3 | GO:0097025 | MPP7-DLG1-LIN7 complex(GO:0097025) |
| 0.0 | 0.1 | GO:1902937 | inward rectifier potassium channel complex(GO:1902937) |
| 0.0 | 0.4 | GO:0031209 | SCAR complex(GO:0031209) |
| 0.0 | 0.1 | GO:0098536 | deuterosome(GO:0098536) |
| 0.0 | 0.1 | GO:0036019 | endolysosome(GO:0036019) |
| 0.0 | 3.3 | GO:0000118 | histone deacetylase complex(GO:0000118) |
| 0.0 | 0.8 | GO:0043196 | varicosity(GO:0043196) |
| 0.0 | 0.1 | GO:0097543 | ciliary inversin compartment(GO:0097543) |
| 0.0 | 0.1 | GO:0034274 | Atg12-Atg5-Atg16 complex(GO:0034274) |
| 0.0 | 0.2 | GO:0017146 | NMDA selective glutamate receptor complex(GO:0017146) |
| 0.0 | 0.4 | GO:0031464 | Cul4A-RING E3 ubiquitin ligase complex(GO:0031464) |
| 0.0 | 0.5 | GO:0032593 | insulin-responsive compartment(GO:0032593) |
| 0.0 | 0.1 | GO:0030905 | retromer, tubulation complex(GO:0030905) |
| 0.0 | 0.1 | GO:0032280 | symmetric synapse(GO:0032280) |
| 0.0 | 0.8 | GO:0005942 | phosphatidylinositol 3-kinase complex(GO:0005942) |
| 0.0 | 0.1 | GO:0030906 | retromer, cargo-selective complex(GO:0030906) |
| 0.0 | 0.1 | GO:0034751 | aryl hydrocarbon receptor complex(GO:0034751) |
| 0.0 | 0.1 | GO:0031523 | Myb complex(GO:0031523) |
| 0.0 | 0.2 | GO:0019907 | cyclin-dependent protein kinase activating kinase holoenzyme complex(GO:0019907) |
| 0.0 | 0.8 | GO:0030673 | axolemma(GO:0030673) |
| 0.0 | 1.4 | GO:0043034 | costamere(GO:0043034) |
| 0.0 | 0.2 | GO:0032437 | cuticular plate(GO:0032437) |
| 0.0 | 0.3 | GO:0005677 | chromatin silencing complex(GO:0005677) |
| 0.0 | 0.1 | GO:0098842 | postsynaptic early endosome(GO:0098842) |
| 0.0 | 0.2 | GO:0070531 | BRCA1-A complex(GO:0070531) |
| 0.0 | 0.5 | GO:0005721 | pericentric heterochromatin(GO:0005721) |
| 0.0 | 0.1 | GO:1990452 | Parkin-FBXW7-Cul1 ubiquitin ligase complex(GO:1990452) |
| 0.0 | 0.4 | GO:0000974 | Prp19 complex(GO:0000974) |
| 0.0 | 0.8 | GO:0034451 | centriolar satellite(GO:0034451) |
| 0.0 | 0.3 | GO:0031315 | extrinsic component of mitochondrial outer membrane(GO:0031315) |
| 0.0 | 0.1 | GO:0000308 | cytoplasmic cyclin-dependent protein kinase holoenzyme complex(GO:0000308) |
| 0.0 | 4.4 | GO:0005923 | bicellular tight junction(GO:0005923) |
| 0.0 | 1.8 | GO:0010494 | cytoplasmic stress granule(GO:0010494) |
| 0.0 | 0.1 | GO:0032584 | growth cone membrane(GO:0032584) |
| 0.0 | 0.3 | GO:0097449 | astrocyte projection(GO:0097449) |
| 0.0 | 0.1 | GO:1990131 | Gtr1-Gtr2 GTPase complex(GO:1990131) |
| 0.0 | 1.2 | GO:0016235 | aggresome(GO:0016235) |
| 0.0 | 0.2 | GO:0071203 | WASH complex(GO:0071203) |
| 0.0 | 0.8 | GO:0097228 | sperm principal piece(GO:0097228) |
| 0.0 | 0.6 | GO:0001741 | XY body(GO:0001741) |
| 0.0 | 0.3 | GO:0000164 | protein phosphatase type 1 complex(GO:0000164) |
| 0.0 | 0.1 | GO:0016602 | CCAAT-binding factor complex(GO:0016602) |
| 0.0 | 0.8 | GO:0035861 | site of double-strand break(GO:0035861) |
| 0.0 | 0.1 | GO:0002142 | stereocilia ankle link complex(GO:0002142) |
| 0.0 | 0.0 | GO:0005853 | eukaryotic translation elongation factor 1 complex(GO:0005853) |
| 0.0 | 0.1 | GO:1990393 | 3M complex(GO:1990393) |
| 0.0 | 0.3 | GO:0097431 | mitotic spindle pole(GO:0097431) |
| 0.0 | 0.3 | GO:0030140 | trans-Golgi network transport vesicle(GO:0030140) |
| 0.0 | 0.1 | GO:0033165 | interphotoreceptor matrix(GO:0033165) |
| 0.0 | 0.6 | GO:0044665 | MLL1/2 complex(GO:0044665) MLL1 complex(GO:0071339) |
| 0.0 | 0.2 | GO:0071006 | U2-type catalytic step 1 spliceosome(GO:0071006) catalytic step 1 spliceosome(GO:0071012) |
| 0.0 | 0.1 | GO:0070369 | beta-catenin-TCF7L2 complex(GO:0070369) |
| 0.0 | 0.1 | GO:0032444 | activin responsive factor complex(GO:0032444) |
| 0.0 | 0.1 | GO:0071598 | neuronal ribonucleoprotein granule(GO:0071598) |
| 0.0 | 0.1 | GO:0071818 | BAT3 complex(GO:0071818) ER membrane insertion complex(GO:0072379) |
| 0.0 | 0.1 | GO:0071204 | histone pre-mRNA 3'end processing complex(GO:0071204) |
| 0.0 | 0.5 | GO:0035145 | exon-exon junction complex(GO:0035145) |
| 0.0 | 0.4 | GO:0030014 | CCR4-NOT complex(GO:0030014) |
| 0.0 | 0.0 | GO:0098855 | HCN channel complex(GO:0098855) |
| 0.0 | 0.2 | GO:0005675 | holo TFIIH complex(GO:0005675) |
| 0.0 | 0.1 | GO:0097209 | epidermal lamellar body(GO:0097209) |
| 0.0 | 0.2 | GO:1990909 | Wnt signalosome(GO:1990909) |
| 0.0 | 0.0 | GO:0060205 | secretory granule lumen(GO:0034774) cytoplasmic membrane-bounded vesicle lumen(GO:0060205) |
| 0.0 | 0.2 | GO:0031597 | cytosolic proteasome complex(GO:0031597) |
| 0.0 | 0.1 | GO:0031010 | ISWI-type complex(GO:0031010) |
| 0.0 | 0.5 | GO:0005779 | integral component of peroxisomal membrane(GO:0005779) |
| 0.0 | 0.4 | GO:0034706 | sodium channel complex(GO:0034706) |
| 0.0 | 0.2 | GO:0032009 | early phagosome(GO:0032009) |
| 0.0 | 0.8 | GO:0005871 | kinesin complex(GO:0005871) |
| 0.0 | 0.1 | GO:0060187 | cell pole(GO:0060187) |
| 0.0 | 0.3 | GO:0005697 | telomerase holoenzyme complex(GO:0005697) |
| 0.0 | 0.0 | GO:1990075 | periciliary membrane compartment(GO:1990075) |
| 0.0 | 0.4 | GO:0002102 | podosome(GO:0002102) |
| 0.0 | 4.5 | GO:0014069 | postsynaptic density(GO:0014069) |
| 0.0 | 0.1 | GO:0001940 | male pronucleus(GO:0001940) |
| 0.0 | 0.4 | GO:1990752 | microtubule end(GO:1990752) |
| 0.0 | 0.1 | GO:0034687 | integrin alphaL-beta2 complex(GO:0034687) |
| 0.0 | 0.1 | GO:0030485 | smooth muscle contractile fiber(GO:0030485) |
| 0.0 | 0.2 | GO:0030126 | COPI vesicle coat(GO:0030126) |
| 0.0 | 0.1 | GO:0030991 | intraciliary transport particle A(GO:0030991) |
| 0.0 | 0.1 | GO:0005663 | DNA replication factor C complex(GO:0005663) |
| 0.0 | 0.1 | GO:0045180 | basal cortex(GO:0045180) |
| 0.0 | 2.1 | GO:0000775 | chromosome, centromeric region(GO:0000775) |
| 0.0 | 0.1 | GO:0016281 | eukaryotic translation initiation factor 4F complex(GO:0016281) |
| 0.0 | 1.2 | GO:0036064 | ciliary basal body(GO:0036064) |
| 0.0 | 1.9 | GO:0001650 | fibrillar center(GO:0001650) |
| 0.0 | 0.4 | GO:0070971 | endoplasmic reticulum exit site(GO:0070971) |
| 0.0 | 0.3 | GO:0030131 | clathrin adaptor complex(GO:0030131) |
| 0.0 | 0.9 | GO:0000786 | nucleosome(GO:0000786) |
| 0.0 | 0.4 | GO:0008023 | transcription elongation factor complex(GO:0008023) |
| 0.0 | 0.0 | GO:0097135 | cyclin E2-CDK2 complex(GO:0097135) |
| 0.0 | 0.0 | GO:0097227 | sperm annulus(GO:0097227) |
| 0.0 | 0.0 | GO:0044317 | rod spherule(GO:0044317) |
| 0.0 | 0.1 | GO:0098839 | postsynaptic density membrane(GO:0098839) |
| 0.0 | 1.9 | GO:0044798 | nuclear transcription factor complex(GO:0044798) |
| 0.0 | 0.2 | GO:0035097 | histone methyltransferase complex(GO:0035097) |
| 0.0 | 0.1 | GO:0043527 | tRNA methyltransferase complex(GO:0043527) |
| 0.0 | 0.2 | GO:0071011 | precatalytic spliceosome(GO:0071011) |
| 0.0 | 0.9 | GO:0005581 | collagen trimer(GO:0005581) |
| 0.0 | 0.5 | GO:0097610 | cleavage furrow(GO:0032154) cell surface furrow(GO:0097610) |
| 0.0 | 0.3 | GO:0090544 | BAF-type complex(GO:0090544) |
| 0.0 | 0.9 | GO:0000932 | cytoplasmic mRNA processing body(GO:0000932) |
Gene overrepresentation in molecular function category:
| Log-likelihood per target | Total log-likelihood | Term | Description |
|---|---|---|---|
| 1.0 | 3.0 | GO:0016964 | alpha-2 macroglobulin receptor activity(GO:0016964) |
| 0.3 | 1.0 | GO:0005119 | smoothened binding(GO:0005119) hedgehog receptor activity(GO:0008158) |
| 0.3 | 1.0 | GO:0097100 | supercoiled DNA binding(GO:0097100) |
| 0.2 | 2.4 | GO:0008046 | axon guidance receptor activity(GO:0008046) |
| 0.2 | 1.1 | GO:0043812 | phosphatidylinositol-4-phosphate phosphatase activity(GO:0043812) |
| 0.2 | 1.1 | GO:0043532 | angiostatin binding(GO:0043532) |
| 0.2 | 1.6 | GO:0070087 | chromo shadow domain binding(GO:0070087) |
| 0.2 | 1.2 | GO:0005173 | stem cell factor receptor binding(GO:0005173) |
| 0.2 | 1.3 | GO:0034056 | estrogen response element binding(GO:0034056) |
| 0.2 | 0.6 | GO:0034041 | sterol-transporting ATPase activity(GO:0034041) |
| 0.2 | 0.9 | GO:0003989 | acetyl-CoA carboxylase activity(GO:0003989) |
| 0.2 | 1.2 | GO:0044729 | hemi-methylated DNA-binding(GO:0044729) |
| 0.2 | 1.4 | GO:0030267 | hydroxypyruvate reductase activity(GO:0016618) glyoxylate reductase (NADP) activity(GO:0030267) |
| 0.2 | 1.6 | GO:0038062 | protein tyrosine kinase collagen receptor activity(GO:0038062) |
| 0.2 | 1.9 | GO:0030274 | LIM domain binding(GO:0030274) |
| 0.2 | 1.1 | GO:0004897 | ciliary neurotrophic factor receptor activity(GO:0004897) |
| 0.2 | 0.6 | GO:0005008 | hepatocyte growth factor-activated receptor activity(GO:0005008) |
| 0.1 | 0.4 | GO:0034189 | very-low-density lipoprotein particle binding(GO:0034189) glycoprotein transporter activity(GO:0034437) |
| 0.1 | 0.6 | GO:0004092 | carnitine O-acetyltransferase activity(GO:0004092) |
| 0.1 | 0.4 | GO:0070615 | nucleosome-dependent ATPase activity(GO:0070615) |
| 0.1 | 0.7 | GO:0050265 | RNA uridylyltransferase activity(GO:0050265) |
| 0.1 | 0.5 | GO:0032896 | palmitoyl-CoA 9-desaturase activity(GO:0032896) |
| 0.1 | 0.4 | GO:0031208 | POZ domain binding(GO:0031208) |
| 0.1 | 0.8 | GO:0061649 | ubiquitinated histone binding(GO:0061649) |
| 0.1 | 0.4 | GO:0051431 | corticotropin-releasing hormone receptor 2 binding(GO:0051431) |
| 0.1 | 0.6 | GO:0042030 | ATPase inhibitor activity(GO:0042030) |
| 0.1 | 1.8 | GO:0050693 | LBD domain binding(GO:0050693) |
| 0.1 | 3.6 | GO:0005242 | inward rectifier potassium channel activity(GO:0005242) |
| 0.1 | 0.3 | GO:0042954 | lipoprotein transporter activity(GO:0042954) |
| 0.1 | 0.3 | GO:0042936 | dipeptide transporter activity(GO:0042936) |
| 0.1 | 0.7 | GO:0097001 | ceramide binding(GO:0097001) |
| 0.1 | 0.3 | GO:0004698 | calcium-dependent protein kinase C activity(GO:0004698) |
| 0.1 | 0.5 | GO:0005250 | A-type (transient outward) potassium channel activity(GO:0005250) |
| 0.1 | 0.7 | GO:0046935 | 1-phosphatidylinositol-3-kinase regulator activity(GO:0046935) |
| 0.1 | 1.0 | GO:0031802 | type 5 metabotropic glutamate receptor binding(GO:0031802) |
| 0.1 | 0.4 | GO:0030549 | acetylcholine receptor activator activity(GO:0030549) |
| 0.1 | 0.4 | GO:0031699 | beta-3 adrenergic receptor binding(GO:0031699) |
| 0.1 | 0.4 | GO:0004692 | cGMP-dependent protein kinase activity(GO:0004692) |
| 0.1 | 0.7 | GO:0005519 | cytoskeletal regulatory protein binding(GO:0005519) |
| 0.1 | 0.5 | GO:0043559 | insulin binding(GO:0043559) |
| 0.1 | 0.4 | GO:0086056 | voltage-gated calcium channel activity involved in AV node cell action potential(GO:0086056) |
| 0.1 | 1.8 | GO:0070410 | co-SMAD binding(GO:0070410) |
| 0.1 | 0.2 | GO:0035827 | rubidium ion transmembrane transporter activity(GO:0035827) |
| 0.1 | 0.6 | GO:0031811 | G-protein coupled nucleotide receptor binding(GO:0031811) P2Y1 nucleotide receptor binding(GO:0031812) |
| 0.1 | 0.7 | GO:0003876 | AMP deaminase activity(GO:0003876) adenosine-phosphate deaminase activity(GO:0047623) |
| 0.1 | 0.6 | GO:0003886 | DNA (cytosine-5-)-methyltransferase activity(GO:0003886) |
| 0.1 | 0.3 | GO:0000822 | inositol hexakisphosphate binding(GO:0000822) |
| 0.1 | 0.2 | GO:0004373 | glycogen (starch) synthase activity(GO:0004373) |
| 0.1 | 0.1 | GO:0097108 | hedgehog family protein binding(GO:0097108) |
| 0.1 | 0.3 | GO:0017095 | heparan sulfate 6-O-sulfotransferase activity(GO:0017095) |
| 0.1 | 0.4 | GO:0004720 | protein-lysine 6-oxidase activity(GO:0004720) |
| 0.1 | 0.7 | GO:0016175 | superoxide-generating NADPH oxidase activity(GO:0016175) |
| 0.1 | 0.3 | GO:1990188 | euchromatin binding(GO:1990188) |
| 0.1 | 0.5 | GO:0004013 | adenosylhomocysteinase activity(GO:0004013) trialkylsulfonium hydrolase activity(GO:0016802) |
| 0.1 | 0.2 | GO:0035939 | microsatellite binding(GO:0035939) |
| 0.1 | 0.2 | GO:0042015 | interleukin-20 binding(GO:0042015) |
| 0.1 | 0.3 | GO:0017108 | 5'-flap endonuclease activity(GO:0017108) |
| 0.1 | 0.5 | GO:0008467 | [heparan sulfate]-glucosamine 3-sulfotransferase 1 activity(GO:0008467) |
| 0.1 | 0.5 | GO:0004726 | non-membrane spanning protein tyrosine phosphatase activity(GO:0004726) |
| 0.1 | 0.2 | GO:0017082 | mineralocorticoid receptor activity(GO:0017082) |
| 0.1 | 0.6 | GO:0003964 | telomerase activity(GO:0003720) RNA-directed DNA polymerase activity(GO:0003964) |
| 0.1 | 0.4 | GO:0001093 | TFIIB-class transcription factor binding(GO:0001093) |
| 0.1 | 0.3 | GO:0072542 | protein phosphatase activator activity(GO:0072542) |
| 0.1 | 0.2 | GO:0030350 | iron-responsive element binding(GO:0030350) |
| 0.1 | 0.5 | GO:0017034 | Rap guanyl-nucleotide exchange factor activity(GO:0017034) |
| 0.1 | 0.3 | GO:0080019 | fatty-acyl-CoA reductase (alcohol-forming) activity(GO:0080019) |
| 0.1 | 0.5 | GO:0046972 | histone acetyltransferase activity (H4-K5 specific)(GO:0043995) histone acetyltransferase activity (H4-K8 specific)(GO:0043996) histone acetyltransferase activity (H4-K16 specific)(GO:0046972) |
| 0.1 | 1.0 | GO:0005078 | MAP-kinase scaffold activity(GO:0005078) |
| 0.1 | 0.3 | GO:0015321 | sodium-dependent phosphate transmembrane transporter activity(GO:0015321) |
| 0.1 | 0.1 | GO:0070698 | type I activin receptor binding(GO:0070698) |
| 0.1 | 0.2 | GO:0004937 | alpha1-adrenergic receptor activity(GO:0004937) |
| 0.1 | 0.2 | GO:0002113 | interleukin-33 binding(GO:0002113) |
| 0.1 | 0.2 | GO:0050429 | calcium-dependent phospholipase C activity(GO:0050429) |
| 0.1 | 1.2 | GO:0070577 | lysine-acetylated histone binding(GO:0070577) |
| 0.1 | 0.4 | GO:0035727 | lysophosphatidic acid binding(GO:0035727) |
| 0.1 | 1.7 | GO:0046966 | thyroid hormone receptor binding(GO:0046966) |
| 0.1 | 0.2 | GO:0016167 | glial cell-derived neurotrophic factor receptor activity(GO:0016167) |
| 0.1 | 0.3 | GO:0046920 | alpha-(1->3)-fucosyltransferase activity(GO:0046920) |
| 0.1 | 0.5 | GO:0001055 | RNA polymerase II activity(GO:0001055) |
| 0.1 | 0.2 | GO:0042903 | tubulin deacetylase activity(GO:0042903) |
| 0.1 | 0.4 | GO:0008823 | cupric reductase activity(GO:0008823) ferric-chelate reductase (NADPH) activity(GO:0052851) |
| 0.1 | 0.4 | GO:0016934 | extracellular-glycine-gated ion channel activity(GO:0016933) extracellular-glycine-gated chloride channel activity(GO:0016934) |
| 0.0 | 1.1 | GO:0033612 | receptor serine/threonine kinase binding(GO:0033612) |
| 0.0 | 0.2 | GO:0038049 | glucocorticoid receptor activity(GO:0004883) transcription factor activity, ligand-activated RNA polymerase II transcription factor binding(GO:0038049) glucocorticoid-activated RNA polymerase II transcription factor binding transcription factor activity(GO:0038051) |
| 0.0 | 0.3 | GO:0015277 | kainate selective glutamate receptor activity(GO:0015277) |
| 0.0 | 0.4 | GO:1990380 | Lys48-specific deubiquitinase activity(GO:1990380) |
| 0.0 | 0.5 | GO:0015280 | ligand-gated sodium channel activity(GO:0015280) |
| 0.0 | 0.3 | GO:0047045 | testosterone 17-beta-dehydrogenase (NADP+) activity(GO:0047045) |
| 0.0 | 0.1 | GO:0015168 | glycerol transmembrane transporter activity(GO:0015168) |
| 0.0 | 1.0 | GO:0035497 | cAMP response element binding(GO:0035497) |
| 0.0 | 0.2 | GO:0050436 | microfibril binding(GO:0050436) |
| 0.0 | 1.1 | GO:0070006 | metalloaminopeptidase activity(GO:0070006) |
| 0.0 | 0.4 | GO:0017151 | DEAD/H-box RNA helicase binding(GO:0017151) |
| 0.0 | 0.5 | GO:0005049 | nuclear export signal receptor activity(GO:0005049) |
| 0.0 | 0.5 | GO:0004439 | phosphatidylinositol-4,5-bisphosphate 5-phosphatase activity(GO:0004439) |
| 0.0 | 0.1 | GO:0004830 | tryptophan-tRNA ligase activity(GO:0004830) |
| 0.0 | 1.5 | GO:0035259 | glucocorticoid receptor binding(GO:0035259) |
| 0.0 | 1.6 | GO:0004115 | 3',5'-cyclic-AMP phosphodiesterase activity(GO:0004115) |
| 0.0 | 0.7 | GO:0048407 | platelet-derived growth factor binding(GO:0048407) |
| 0.0 | 0.3 | GO:0046975 | histone methyltransferase activity (H3-K36 specific)(GO:0046975) |
| 0.0 | 0.1 | GO:0003987 | acetate-CoA ligase activity(GO:0003987) |
| 0.0 | 0.3 | GO:0001602 | pancreatic polypeptide receptor activity(GO:0001602) |
| 0.0 | 0.1 | GO:0086008 | voltage-gated potassium channel activity involved in cardiac muscle cell action potential repolarization(GO:0086008) |
| 0.0 | 2.3 | GO:0043027 | cysteine-type endopeptidase inhibitor activity involved in apoptotic process(GO:0043027) |
| 0.0 | 0.1 | GO:0048030 | disaccharide binding(GO:0048030) |
| 0.0 | 0.3 | GO:0097016 | L27 domain binding(GO:0097016) |
| 0.0 | 0.1 | GO:0070996 | type 1 melanocortin receptor binding(GO:0070996) |
| 0.0 | 0.1 | GO:0047787 | delta4-3-oxosteroid 5beta-reductase activity(GO:0047787) |
| 0.0 | 0.2 | GO:0039706 | co-receptor binding(GO:0039706) |
| 0.0 | 0.2 | GO:0004563 | beta-N-acetylhexosaminidase activity(GO:0004563) |
| 0.0 | 0.1 | GO:0071936 | coreceptor activity involved in Wnt signaling pathway(GO:0071936) |
| 0.0 | 0.2 | GO:0015186 | L-glutamine transmembrane transporter activity(GO:0015186) |
| 0.0 | 0.3 | GO:0005324 | long-chain fatty acid transporter activity(GO:0005324) |
| 0.0 | 0.2 | GO:0050816 | phosphothreonine binding(GO:0050816) |
| 0.0 | 1.1 | GO:0070412 | R-SMAD binding(GO:0070412) |
| 0.0 | 0.4 | GO:0035312 | 5'-3' exodeoxyribonuclease activity(GO:0035312) |
| 0.0 | 0.2 | GO:0005168 | neurotrophin TRKA receptor binding(GO:0005168) |
| 0.0 | 0.3 | GO:0015204 | urea transmembrane transporter activity(GO:0015204) |
| 0.0 | 1.3 | GO:0000993 | RNA polymerase II core binding(GO:0000993) |
| 0.0 | 0.8 | GO:0008353 | RNA polymerase II carboxy-terminal domain kinase activity(GO:0008353) |
| 0.0 | 0.3 | GO:0099609 | microtubule lateral binding(GO:0099609) |
| 0.0 | 0.3 | GO:0046790 | virion binding(GO:0046790) |
| 0.0 | 0.3 | GO:0043237 | laminin-1 binding(GO:0043237) |
| 0.0 | 0.4 | GO:0042834 | peptidoglycan binding(GO:0042834) |
| 0.0 | 0.2 | GO:0005332 | gamma-aminobutyric acid:sodium symporter activity(GO:0005332) |
| 0.0 | 1.3 | GO:0035035 | histone acetyltransferase binding(GO:0035035) |
| 0.0 | 0.3 | GO:0032051 | clathrin light chain binding(GO:0032051) |
| 0.0 | 0.0 | GO:0005237 | inhibitory extracellular ligand-gated ion channel activity(GO:0005237) |
| 0.0 | 1.6 | GO:0032452 | histone demethylase activity(GO:0032452) |
| 0.0 | 0.2 | GO:0004105 | choline-phosphate cytidylyltransferase activity(GO:0004105) |
| 0.0 | 0.1 | GO:0016422 | mRNA (2'-O-methyladenosine-N6-)-methyltransferase activity(GO:0016422) |
| 0.0 | 0.2 | GO:0004652 | polynucleotide adenylyltransferase activity(GO:0004652) |
| 0.0 | 1.7 | GO:0017112 | Rab guanyl-nucleotide exchange factor activity(GO:0017112) |
| 0.0 | 0.1 | GO:0003883 | CTP synthase activity(GO:0003883) |
| 0.0 | 0.1 | GO:0008260 | 3-oxoacid CoA-transferase activity(GO:0008260) |
| 0.0 | 0.2 | GO:0001515 | opioid peptide activity(GO:0001515) |
| 0.0 | 0.4 | GO:0008301 | DNA binding, bending(GO:0008301) |
| 0.0 | 0.6 | GO:0000983 | transcription factor activity, RNA polymerase II core promoter sequence-specific(GO:0000983) |
| 0.0 | 0.5 | GO:0030346 | protein phosphatase 2B binding(GO:0030346) |
| 0.0 | 0.2 | GO:0005030 | neurotrophin receptor activity(GO:0005030) |
| 0.0 | 0.3 | GO:0033691 | sialic acid binding(GO:0033691) |
| 0.0 | 0.2 | GO:0004430 | 1-phosphatidylinositol 4-kinase activity(GO:0004430) |
| 0.0 | 0.2 | GO:0042285 | UDP-xylosyltransferase activity(GO:0035252) xylosyltransferase activity(GO:0042285) |
| 0.0 | 0.3 | GO:0004887 | thyroid hormone receptor activity(GO:0004887) |
| 0.0 | 1.0 | GO:0008139 | nuclear localization sequence binding(GO:0008139) |
| 0.0 | 0.1 | GO:0008532 | N-acetyllactosaminide beta-1,3-N-acetylglucosaminyltransferase activity(GO:0008532) |
| 0.0 | 0.2 | GO:0008241 | peptidyl-dipeptidase activity(GO:0008241) |
| 0.0 | 0.1 | GO:0005127 | ciliary neurotrophic factor receptor binding(GO:0005127) |
| 0.0 | 0.9 | GO:0008157 | protein phosphatase 1 binding(GO:0008157) |
| 0.0 | 0.1 | GO:0034988 | Fc-gamma receptor I complex binding(GO:0034988) |
| 0.0 | 5.1 | GO:0017137 | Rab GTPase binding(GO:0017137) |
| 0.0 | 0.1 | GO:0071987 | WD40-repeat domain binding(GO:0071987) |
| 0.0 | 0.1 | GO:0050510 | N-acetylgalactosaminyl-proteoglycan 3-beta-glucuronosyltransferase activity(GO:0050510) |
| 0.0 | 0.2 | GO:0050815 | phosphoserine binding(GO:0050815) |
| 0.0 | 0.9 | GO:0030676 | Rac guanyl-nucleotide exchange factor activity(GO:0030676) |
| 0.0 | 0.5 | GO:0032041 | histone deacetylase activity (H3-K14 specific)(GO:0031078) NAD-dependent histone deacetylase activity (H3-K14 specific)(GO:0032041) |
| 0.0 | 0.2 | GO:0055131 | C3HC4-type RING finger domain binding(GO:0055131) |
| 0.0 | 0.1 | GO:0042328 | heparan sulfate N-acetylglucosaminyltransferase activity(GO:0042328) |
| 0.0 | 0.1 | GO:0004066 | asparagine synthase (glutamine-hydrolyzing) activity(GO:0004066) |
| 0.0 | 0.9 | GO:0005385 | zinc ion transmembrane transporter activity(GO:0005385) |
| 0.0 | 0.4 | GO:1901702 | urate transmembrane transporter activity(GO:0015143) salt transmembrane transporter activity(GO:1901702) |
| 0.0 | 0.1 | GO:0005118 | sevenless binding(GO:0005118) |
| 0.0 | 0.3 | GO:0005432 | calcium:sodium antiporter activity(GO:0005432) |
| 0.0 | 0.1 | GO:0001875 | lipopolysaccharide receptor activity(GO:0001875) |
| 0.0 | 0.5 | GO:0017075 | syntaxin-1 binding(GO:0017075) |
| 0.0 | 0.6 | GO:0031489 | myosin V binding(GO:0031489) |
| 0.0 | 4.7 | GO:0017124 | SH3 domain binding(GO:0017124) |
| 0.0 | 0.1 | GO:0016748 | succinyltransferase activity(GO:0016748) |
| 0.0 | 0.4 | GO:0097153 | cysteine-type endopeptidase activity involved in apoptotic process(GO:0097153) |
| 0.0 | 0.5 | GO:0008510 | sodium:bicarbonate symporter activity(GO:0008510) |
| 0.0 | 0.4 | GO:0030215 | semaphorin receptor binding(GO:0030215) |
| 0.0 | 0.2 | GO:0051733 | ATP-dependent polydeoxyribonucleotide 5'-hydroxyl-kinase activity(GO:0046404) polydeoxyribonucleotide kinase activity(GO:0051733) ATP-dependent polynucleotide kinase activity(GO:0051734) |
| 0.0 | 0.1 | GO:1990450 | linear polyubiquitin binding(GO:1990450) |
| 0.0 | 0.5 | GO:0008553 | hydrogen-exporting ATPase activity, phosphorylative mechanism(GO:0008553) |
| 0.0 | 0.2 | GO:0016274 | arginine N-methyltransferase activity(GO:0016273) protein-arginine N-methyltransferase activity(GO:0016274) |
| 0.0 | 0.1 | GO:0003918 | DNA topoisomerase type II (ATP-hydrolyzing) activity(GO:0003918) DNA topoisomerase II activity(GO:0061505) |
| 0.0 | 0.1 | GO:0003979 | UDP-glucose 6-dehydrogenase activity(GO:0003979) |
| 0.0 | 0.1 | GO:0030229 | very-low-density lipoprotein particle receptor activity(GO:0030229) |
| 0.0 | 0.1 | GO:0017098 | CTP binding(GO:0002135) sulfonylurea receptor binding(GO:0017098) |
| 0.0 | 0.7 | GO:0030371 | translation repressor activity(GO:0030371) |
| 0.0 | 0.3 | GO:0042043 | neurexin family protein binding(GO:0042043) |
| 0.0 | 0.1 | GO:0004144 | diacylglycerol O-acyltransferase activity(GO:0004144) |
| 0.0 | 0.1 | GO:0019960 | C-X3-C chemokine binding(GO:0019960) |
| 0.0 | 0.1 | GO:0015018 | galactosylgalactosylxylosylprotein 3-beta-glucuronosyltransferase activity(GO:0015018) |
| 0.0 | 0.2 | GO:0048531 | beta-1,3-galactosyltransferase activity(GO:0048531) |
| 0.0 | 0.1 | GO:0071207 | histone pre-mRNA stem-loop binding(GO:0071207) |
| 0.0 | 0.2 | GO:0004046 | aminoacylase activity(GO:0004046) |
| 0.0 | 0.1 | GO:1990460 | leptin receptor binding(GO:1990460) |
| 0.0 | 0.5 | GO:0043236 | laminin binding(GO:0043236) |
| 0.0 | 0.0 | GO:0098770 | FBXO family protein binding(GO:0098770) |
| 0.0 | 0.1 | GO:0097322 | 7SK snRNA binding(GO:0097322) |
| 0.0 | 0.6 | GO:0008536 | Ran GTPase binding(GO:0008536) |
| 0.0 | 0.4 | GO:0008327 | methyl-CpG binding(GO:0008327) |
| 0.0 | 0.1 | GO:0044547 | DNA topoisomerase binding(GO:0044547) |
| 0.0 | 0.1 | GO:0030292 | protein tyrosine kinase inhibitor activity(GO:0030292) |
| 0.0 | 0.1 | GO:0043175 | RNA polymerase core enzyme binding(GO:0043175) |
| 0.0 | 0.1 | GO:0045159 | myosin II binding(GO:0045159) |
| 0.0 | 1.1 | GO:0035064 | methylated histone binding(GO:0035064) |
| 0.0 | 0.1 | GO:0051033 | nucleic acid transmembrane transporter activity(GO:0051032) RNA transmembrane transporter activity(GO:0051033) |
| 0.0 | 0.1 | GO:0000405 | bubble DNA binding(GO:0000405) |
| 0.0 | 0.1 | GO:0033592 | RNA strand annealing activity(GO:0033592) |
| 0.0 | 0.3 | GO:0019841 | retinal binding(GO:0016918) retinol binding(GO:0019841) |
| 0.0 | 0.3 | GO:0008484 | sulfuric ester hydrolase activity(GO:0008484) |
| 0.0 | 0.3 | GO:0004861 | cyclin-dependent protein serine/threonine kinase inhibitor activity(GO:0004861) |
| 0.0 | 0.1 | GO:0004668 | protein-arginine deiminase activity(GO:0004668) |
| 0.0 | 0.0 | GO:0017116 | single-stranded DNA-dependent ATP-dependent DNA helicase activity(GO:0017116) |
| 0.0 | 0.1 | GO:0019778 | Atg12 activating enzyme activity(GO:0019778) Atg8 activating enzyme activity(GO:0019779) |
| 0.0 | 0.1 | GO:0008321 | Ral guanyl-nucleotide exchange factor activity(GO:0008321) |
| 0.0 | 0.1 | GO:0019002 | GMP binding(GO:0019002) |
| 0.0 | 0.2 | GO:0003906 | DNA-(apurinic or apyrimidinic site) lyase activity(GO:0003906) |
| 0.0 | 0.1 | GO:0004699 | calcium-independent protein kinase C activity(GO:0004699) |
| 0.0 | 0.3 | GO:0038191 | neuropilin binding(GO:0038191) |
| 0.0 | 0.5 | GO:0017081 | chloride channel regulator activity(GO:0017081) |
| 0.0 | 0.1 | GO:0015129 | lactate transmembrane transporter activity(GO:0015129) |
| 0.0 | 0.1 | GO:0019534 | toxin transporter activity(GO:0019534) |
| 0.0 | 0.0 | GO:0015185 | gamma-aminobutyric acid transmembrane transporter activity(GO:0015185) |
| 0.0 | 0.1 | GO:0004985 | opioid receptor activity(GO:0004985) |
| 0.0 | 0.2 | GO:0051870 | methotrexate binding(GO:0051870) |
| 0.0 | 0.3 | GO:0015037 | peptide disulfide oxidoreductase activity(GO:0015037) |
| 0.0 | 0.3 | GO:0030628 | pre-mRNA 3'-splice site binding(GO:0030628) |
| 0.0 | 0.1 | GO:0008176 | tRNA (guanine-N7-)-methyltransferase activity(GO:0008176) |
| 0.0 | 0.1 | GO:0005042 | netrin receptor activity(GO:0005042) |
| 0.0 | 0.5 | GO:0030331 | estrogen receptor binding(GO:0030331) |
| 0.0 | 0.3 | GO:0070530 | K63-linked polyubiquitin binding(GO:0070530) |
| 0.0 | 0.0 | GO:0005128 | erythropoietin receptor binding(GO:0005128) |
| 0.0 | 0.5 | GO:0004190 | aspartic-type endopeptidase activity(GO:0004190) |
| 0.0 | 0.1 | GO:0003998 | acylphosphatase activity(GO:0003998) |
| 0.0 | 2.3 | GO:0042393 | histone binding(GO:0042393) |
| 0.0 | 0.6 | GO:0008376 | acetylgalactosaminyltransferase activity(GO:0008376) |
| 0.0 | 0.1 | GO:0008504 | monoamine transmembrane transporter activity(GO:0008504) |
| 0.0 | 0.1 | GO:0035197 | siRNA binding(GO:0035197) |
| 0.0 | 0.2 | GO:0044213 | intronic transcription regulatory region DNA binding(GO:0044213) |
| 0.0 | 0.2 | GO:0015187 | glycine transmembrane transporter activity(GO:0015187) |
| 0.0 | 0.1 | GO:0046899 | nucleoside triphosphate adenylate kinase activity(GO:0046899) |
| 0.0 | 0.1 | GO:0004052 | arachidonate 12-lipoxygenase activity(GO:0004052) |
| 0.0 | 0.1 | GO:0030911 | TPR domain binding(GO:0030911) |
| 0.0 | 0.1 | GO:0005105 | type 1 fibroblast growth factor receptor binding(GO:0005105) |
| 0.0 | 0.1 | GO:0071074 | eukaryotic initiation factor eIF2 binding(GO:0071074) |
| 0.0 | 0.1 | GO:0003831 | beta-N-acetylglucosaminylglycopeptide beta-1,4-galactosyltransferase activity(GO:0003831) |
| 0.0 | 0.3 | GO:0004089 | carbonate dehydratase activity(GO:0004089) |
| 0.0 | 0.1 | GO:0030306 | ADP-ribosylation factor binding(GO:0030306) |
| 0.0 | 0.1 | GO:0005000 | vasopressin receptor activity(GO:0005000) |
| 0.0 | 0.3 | GO:0004535 | poly(A)-specific ribonuclease activity(GO:0004535) |
| 0.0 | 0.0 | GO:0052871 | tocopherol omega-hydroxylase activity(GO:0052870) alpha-tocopherol omega-hydroxylase activity(GO:0052871) |
| 0.0 | 0.1 | GO:0005499 | vitamin D binding(GO:0005499) |
| 0.0 | 0.1 | GO:0004974 | leukotriene receptor activity(GO:0004974) |
| 0.0 | 0.1 | GO:0016308 | 1-phosphatidylinositol-4-phosphate 5-kinase activity(GO:0016308) |
| 0.0 | 0.1 | GO:0032184 | SUMO polymer binding(GO:0032184) |
| 0.0 | 0.7 | GO:0003684 | damaged DNA binding(GO:0003684) |
| 0.0 | 0.1 | GO:0008020 | G-protein coupled photoreceptor activity(GO:0008020) |
| 0.0 | 1.0 | GO:0030507 | spectrin binding(GO:0030507) |
| 0.0 | 0.1 | GO:0034584 | piRNA binding(GO:0034584) |
| 0.0 | 0.1 | GO:0019767 | IgE receptor activity(GO:0019767) |
| 0.0 | 0.0 | GO:0001225 | RNA polymerase II transcription coactivator binding(GO:0001225) |
| 0.0 | 0.1 | GO:0030369 | ICAM-3 receptor activity(GO:0030369) |
| 0.0 | 0.1 | GO:0008294 | calcium- and calmodulin-responsive adenylate cyclase activity(GO:0008294) |
| 0.0 | 0.1 | GO:0004614 | phosphoglucomutase activity(GO:0004614) |
| 0.0 | 0.3 | GO:0042171 | lysophosphatidic acid acyltransferase activity(GO:0042171) |
| 0.0 | 0.1 | GO:0051381 | histamine binding(GO:0051381) |
| 0.0 | 0.3 | GO:0004407 | histone deacetylase activity(GO:0004407) |
| 0.0 | 0.3 | GO:0042162 | telomeric DNA binding(GO:0042162) |
| 0.0 | 0.1 | GO:0008545 | JUN kinase kinase activity(GO:0008545) |
| 0.0 | 1.0 | GO:0004843 | thiol-dependent ubiquitin-specific protease activity(GO:0004843) |
| 0.0 | 0.2 | GO:0034237 | protein kinase A regulatory subunit binding(GO:0034237) |
| 0.0 | 3.6 | GO:0061630 | ubiquitin protein ligase activity(GO:0061630) |
| 0.0 | 0.2 | GO:0031957 | very long-chain fatty acid-CoA ligase activity(GO:0031957) |
| 0.0 | 0.0 | GO:0070737 | protein-glycine ligase activity, elongating(GO:0070737) |
| 0.0 | 0.2 | GO:0001618 | virus receptor activity(GO:0001618) |
| 0.0 | 0.1 | GO:0070739 | protein-glutamic acid ligase activity(GO:0070739) |
| 0.0 | 0.1 | GO:0008865 | fructokinase activity(GO:0008865) mannokinase activity(GO:0019158) |
| 0.0 | 0.1 | GO:0098821 | BMP receptor activity(GO:0098821) |
| 0.0 | 0.1 | GO:0030250 | cyclase activator activity(GO:0010853) guanylate cyclase activator activity(GO:0030250) |
| 0.0 | 1.1 | GO:0005089 | Rho guanyl-nucleotide exchange factor activity(GO:0005089) |
| 0.0 | 0.1 | GO:0016724 | ferroxidase activity(GO:0004322) oxidoreductase activity, oxidizing metal ions, oxygen as acceptor(GO:0016724) |
| 0.0 | 0.3 | GO:0032794 | GTPase activating protein binding(GO:0032794) |
| 0.0 | 0.1 | GO:0070579 | methylcytosine dioxygenase activity(GO:0070579) |
| 0.0 | 0.1 | GO:0005134 | interleukin-2 receptor binding(GO:0005134) |
| 0.0 | 0.1 | GO:0008310 | single-stranded DNA 3'-5' exodeoxyribonuclease activity(GO:0008310) |
| 0.0 | 0.0 | GO:0016286 | small conductance calcium-activated potassium channel activity(GO:0016286) |
| 0.0 | 0.8 | GO:0000979 | RNA polymerase II core promoter sequence-specific DNA binding(GO:0000979) |
| 0.0 | 0.1 | GO:0017162 | aryl hydrocarbon receptor binding(GO:0017162) |
| 0.0 | 0.2 | GO:0003796 | lysozyme activity(GO:0003796) |
| 0.0 | 0.4 | GO:0001102 | RNA polymerase II activating transcription factor binding(GO:0001102) |
| 0.0 | 0.3 | GO:0098632 | protein binding involved in cell-cell adhesion(GO:0098632) |
| 0.0 | 0.1 | GO:0004839 | ubiquitin activating enzyme activity(GO:0004839) |
| 0.0 | 0.1 | GO:0042975 | peroxisome proliferator activated receptor binding(GO:0042975) |
| 0.0 | 0.4 | GO:0004402 | histone acetyltransferase activity(GO:0004402) |
| 0.0 | 0.1 | GO:0030280 | structural constituent of epidermis(GO:0030280) |
| 0.0 | 0.1 | GO:1990226 | histone methyltransferase binding(GO:1990226) |
Gene overrepresentation in curated gene sets: canonical pathways category:
| Log-likelihood per target | Total log-likelihood | Term | Description |
|---|---|---|---|
| 0.1 | 3.9 | ST WNT BETA CATENIN PATHWAY | Wnt/beta-catenin Pathway |
| 0.1 | 2.0 | ST WNT CA2 CYCLIC GMP PATHWAY | Wnt/Ca2+/cyclic GMP signaling. |
| 0.1 | 2.3 | PID INTEGRIN A9B1 PATHWAY | Alpha9 beta1 integrin signaling events |
| 0.1 | 1.3 | PID NECTIN PATHWAY | Nectin adhesion pathway |
| 0.1 | 0.7 | PID TCR RAS PATHWAY | Ras signaling in the CD4+ TCR pathway |
| 0.1 | 2.1 | PID EPHB FWD PATHWAY | EPHB forward signaling |
| 0.0 | 1.5 | PID HEDGEHOG 2PATHWAY | Signaling events mediated by the Hedgehog family |
| 0.0 | 1.3 | PID AR NONGENOMIC PATHWAY | Nongenotropic Androgen signaling |
| 0.0 | 1.2 | PID NETRIN PATHWAY | Netrin-mediated signaling events |
| 0.0 | 3.0 | PID PLK1 PATHWAY | PLK1 signaling events |
| 0.0 | 1.6 | PID NEPHRIN NEPH1 PATHWAY | Nephrin/Neph1 signaling in the kidney podocyte |
| 0.0 | 1.3 | ST MYOCYTE AD PATHWAY | Myocyte Adrenergic Pathway is a specific case of the generalized Adrenergic Pathway. |
| 0.0 | 0.1 | PID ANTHRAX PATHWAY | Cellular roles of Anthrax toxin |
| 0.0 | 1.4 | PID RAS PATHWAY | Regulation of Ras family activation |
| 0.0 | 3.7 | PID MYC REPRESS PATHWAY | Validated targets of C-MYC transcriptional repression |
| 0.0 | 1.6 | PID PS1 PATHWAY | Presenilin action in Notch and Wnt signaling |
| 0.0 | 2.6 | PID HDAC CLASSII PATHWAY | Signaling events mediated by HDAC Class II |
| 0.0 | 0.4 | ST TYPE I INTERFERON PATHWAY | Type I Interferon (alpha/beta IFN) Pathway |
| 0.0 | 3.3 | PID AR PATHWAY | Coregulation of Androgen receptor activity |
| 0.0 | 0.2 | PID BETA CATENIN DEG PATHWAY | Degradation of beta catenin |
| 0.0 | 1.1 | PID TCPTP PATHWAY | Signaling events mediated by TCPTP |
| 0.0 | 0.6 | PID WNT NONCANONICAL PATHWAY | Noncanonical Wnt signaling pathway |
| 0.0 | 1.1 | PID REELIN PATHWAY | Reelin signaling pathway |
| 0.0 | 0.5 | PID WNT CANONICAL PATHWAY | Canonical Wnt signaling pathway |
| 0.0 | 1.3 | NABA BASEMENT MEMBRANES | Genes encoding structural components of basement membranes |
| 0.0 | 0.1 | PID IL8 CXCR2 PATHWAY | IL8- and CXCR2-mediated signaling events |
| 0.0 | 0.7 | SA CASPASE CASCADE | Apoptosis is mediated by caspases, cysteine proteases arranged in a proteolytic cascade. |
| 0.0 | 0.2 | SA PTEN PATHWAY | PTEN is a tumor suppressor that dephosphorylates the lipid messenger phosphatidylinositol triphosphate. |
| 0.0 | 0.1 | PID ER NONGENOMIC PATHWAY | Plasma membrane estrogen receptor signaling |
| 0.0 | 0.2 | PID INSULIN GLUCOSE PATHWAY | Insulin-mediated glucose transport |
| 0.0 | 0.1 | SA G1 AND S PHASES | Cdk2, 4, and 6 bind cyclin D in G1, while cdk2/cyclin E promotes the G1/S transition. |
| 0.0 | 0.6 | PID ECADHERIN NASCENT AJ PATHWAY | E-cadherin signaling in the nascent adherens junction |
| 0.0 | 1.4 | WNT SIGNALING | Genes related to Wnt-mediated signal transduction |
| 0.0 | 0.2 | SA MMP CYTOKINE CONNECTION | Cytokines can induce activation of matrix metalloproteinases, which degrade extracellular matrix. |
| 0.0 | 0.2 | PID IL5 PATHWAY | IL5-mediated signaling events |
| 0.0 | 0.5 | ST TUMOR NECROSIS FACTOR PATHWAY | Tumor Necrosis Factor Pathway. |
| 0.0 | 0.1 | ST G ALPHA I PATHWAY | G alpha i Pathway |
| 0.0 | 0.4 | PID CERAMIDE PATHWAY | Ceramide signaling pathway |
| 0.0 | 0.7 | PID AJDISS 2PATHWAY | Posttranslational regulation of adherens junction stability and dissassembly |
| 0.0 | 0.1 | PID IL6 7 PATHWAY | IL6-mediated signaling events |
| 0.0 | 0.2 | PID ALK2 PATHWAY | ALK2 signaling events |
| 0.0 | 0.6 | PID KIT PATHWAY | Signaling events mediated by Stem cell factor receptor (c-Kit) |
| 0.0 | 1.1 | PID TELOMERASE PATHWAY | Regulation of Telomerase |
| 0.0 | 0.3 | ST ERK1 ERK2 MAPK PATHWAY | ERK1/ERK2 MAPK Pathway |
| 0.0 | 0.4 | PID PI3KCI AKT PATHWAY | Class I PI3K signaling events mediated by Akt |
| 0.0 | 0.5 | PID CDC42 REG PATHWAY | Regulation of CDC42 activity |
| 0.0 | 0.6 | PID LYSOPHOSPHOLIPID PATHWAY | LPA receptor mediated events |
| 0.0 | 0.1 | PID RET PATHWAY | Signaling events regulated by Ret tyrosine kinase |
| 0.0 | 0.3 | PID NOTCH PATHWAY | Notch signaling pathway |
| 0.0 | 0.8 | PID RHOA REG PATHWAY | Regulation of RhoA activity |
| 0.0 | 0.3 | PID TOLL ENDOGENOUS PATHWAY | Endogenous TLR signaling |
| 0.0 | 0.4 | PID TXA2PATHWAY | Thromboxane A2 receptor signaling |
| 0.0 | 0.2 | PID P38 GAMMA DELTA PATHWAY | Signaling mediated by p38-gamma and p38-delta |
| 0.0 | 0.3 | PID ARF6 PATHWAY | Arf6 signaling events |
| 0.0 | 0.0 | SA REG CASCADE OF CYCLIN EXPR | Expression of cyclins regulates progression through the cell cycle by activating cyclin-dependent kinases. |
| 0.0 | 0.1 | PID IL2 PI3K PATHWAY | IL2 signaling events mediated by PI3K |
| 0.0 | 0.1 | PID HIV NEF PATHWAY | HIV-1 Nef: Negative effector of Fas and TNF-alpha |
| 0.0 | 0.1 | ST GAQ PATHWAY | G alpha q Pathway |
| 0.0 | 0.2 | PID P75 NTR PATHWAY | p75(NTR)-mediated signaling |
| 0.0 | 0.3 | PID ENDOTHELIN PATHWAY | Endothelins |
| 0.0 | 0.1 | PID FOXO PATHWAY | FoxO family signaling |
| 0.0 | 0.1 | PID IL2 STAT5 PATHWAY | IL2 signaling events mediated by STAT5 |
| 0.0 | 0.1 | PID FAS PATHWAY | FAS (CD95) signaling pathway |
| 0.0 | 0.5 | PID P53 REGULATION PATHWAY | p53 pathway |
| 0.0 | 0.6 | PID REG GR PATHWAY | Glucocorticoid receptor regulatory network |
| 0.0 | 0.2 | PID TNF PATHWAY | TNF receptor signaling pathway |
Gene overrepresentation in curated gene sets: REACTOME pathways category:
| Log-likelihood per target | Total log-likelihood | Term | Description |
|---|---|---|---|
| 0.2 | 2.3 | REACTOME RECEPTOR LIGAND BINDING INITIATES THE SECOND PROTEOLYTIC CLEAVAGE OF NOTCH RECEPTOR | Genes involved in Receptor-ligand binding initiates the second proteolytic cleavage of Notch receptor |
| 0.1 | 0.7 | REACTOME IRAK2 MEDIATED ACTIVATION OF TAK1 COMPLEX UPON TLR7 8 OR 9 STIMULATION | Genes involved in IRAK2 mediated activation of TAK1 complex upon TLR7/8 or 9 stimulation |
| 0.1 | 0.8 | REACTOME APOBEC3G MEDIATED RESISTANCE TO HIV1 INFECTION | Genes involved in APOBEC3G mediated resistance to HIV-1 infection |
| 0.1 | 1.1 | REACTOME SEMA3A PLEXIN REPULSION SIGNALING BY INHIBITING INTEGRIN ADHESION | Genes involved in SEMA3A-Plexin repulsion signaling by inhibiting Integrin adhesion |
| 0.1 | 2.4 | REACTOME SIGNALING BY ROBO RECEPTOR | Genes involved in Signaling by Robo receptor |
| 0.1 | 1.8 | REACTOME DOWNREGULATION OF SMAD2 3 SMAD4 TRANSCRIPTIONAL ACTIVITY | Genes involved in Downregulation of SMAD2/3:SMAD4 transcriptional activity |
| 0.1 | 0.8 | REACTOME CS DS DEGRADATION | Genes involved in CS/DS degradation |
| 0.0 | 0.9 | REACTOME IL 7 SIGNALING | Genes involved in Interleukin-7 signaling |
| 0.0 | 0.1 | REACTOME PECAM1 INTERACTIONS | Genes involved in PECAM1 interactions |
| 0.0 | 0.2 | REACTOME PEPTIDE CHAIN ELONGATION | Genes involved in Peptide chain elongation |
| 0.0 | 1.4 | REACTOME SIGNALING BY HIPPO | Genes involved in Signaling by Hippo |
| 0.0 | 0.1 | REACTOME XENOBIOTICS | Genes involved in Xenobiotics |
| 0.0 | 2.1 | REACTOME INHIBITION OF VOLTAGE GATED CA2 CHANNELS VIA GBETA GAMMA SUBUNITS | Genes involved in Inhibition of voltage gated Ca2+ channels via Gbeta/gamma subunits |
| 0.0 | 0.6 | REACTOME IONOTROPIC ACTIVITY OF KAINATE RECEPTORS | Genes involved in Ionotropic activity of Kainate Receptors |
| 0.0 | 0.4 | REACTOME CRMPS IN SEMA3A SIGNALING | Genes involved in CRMPs in Sema3A signaling |
| 0.0 | 0.3 | REACTOME G BETA GAMMA SIGNALLING THROUGH PLC BETA | Genes involved in G beta:gamma signalling through PLC beta |
| 0.0 | 0.7 | REACTOME PURINE SALVAGE | Genes involved in Purine salvage |
| 0.0 | 1.5 | REACTOME SMOOTH MUSCLE CONTRACTION | Genes involved in Smooth Muscle Contraction |
| 0.0 | 1.6 | REACTOME SYNTHESIS OF PIPS AT THE PLASMA MEMBRANE | Genes involved in Synthesis of PIPs at the plasma membrane |
| 0.0 | 0.4 | REACTOME ROLE OF SECOND MESSENGERS IN NETRIN1 SIGNALING | Genes involved in Role of second messengers in netrin-1 signaling |
| 0.0 | 1.1 | REACTOME ERK MAPK TARGETS | Genes involved in ERK/MAPK targets |
| 0.0 | 1.0 | REACTOME PRE NOTCH TRANSCRIPTION AND TRANSLATION | Genes involved in Pre-NOTCH Transcription and Translation |
| 0.0 | 2.6 | REACTOME MEIOTIC SYNAPSIS | Genes involved in Meiotic Synapsis |
| 0.0 | 0.4 | REACTOME PLATELET ADHESION TO EXPOSED COLLAGEN | Genes involved in Platelet Adhesion to exposed collagen |
| 0.0 | 0.8 | REACTOME ZINC TRANSPORTERS | Genes involved in Zinc transporters |
| 0.0 | 0.5 | REACTOME SYNTHESIS OF PIPS AT THE GOLGI MEMBRANE | Genes involved in Synthesis of PIPs at the Golgi membrane |
| 0.0 | 0.7 | REACTOME OTHER SEMAPHORIN INTERACTIONS | Genes involved in Other semaphorin interactions |
| 0.0 | 2.6 | REACTOME NRAGE SIGNALS DEATH THROUGH JNK | Genes involved in NRAGE signals death through JNK |
| 0.0 | 1.0 | REACTOME PEROXISOMAL LIPID METABOLISM | Genes involved in Peroxisomal lipid metabolism |
| 0.0 | 0.5 | REACTOME VIRAL MESSENGER RNA SYNTHESIS | Genes involved in Viral Messenger RNA Synthesis |
| 0.0 | 0.5 | REACTOME PLATELET SENSITIZATION BY LDL | Genes involved in Platelet sensitization by LDL |
| 0.0 | 0.6 | REACTOME NEPHRIN INTERACTIONS | Genes involved in Nephrin interactions |
| 0.0 | 0.7 | REACTOME RNA POL III TRANSCRIPTION INITIATION FROM TYPE 3 PROMOTER | Genes involved in RNA Polymerase III Transcription Initiation From Type 3 Promoter |
| 0.0 | 0.2 | REACTOME REGULATION OF SIGNALING BY CBL | Genes involved in Regulation of signaling by CBL |
| 0.0 | 0.4 | REACTOME G BETA GAMMA SIGNALLING THROUGH PI3KGAMMA | Genes involved in G beta:gamma signalling through PI3Kgamma |
| 0.0 | 0.7 | REACTOME ANTIGEN ACTIVATES B CELL RECEPTOR LEADING TO GENERATION OF SECOND MESSENGERS | Genes involved in Antigen Activates B Cell Receptor Leading to Generation of Second Messengers |
| 0.0 | 0.1 | REACTOME THE ROLE OF NEF IN HIV1 REPLICATION AND DISEASE PATHOGENESIS | Genes involved in The role of Nef in HIV-1 replication and disease pathogenesis |
| 0.0 | 0.4 | REACTOME APOPTOSIS INDUCED DNA FRAGMENTATION | Genes involved in Apoptosis induced DNA fragmentation |
| 0.0 | 0.9 | REACTOME HS GAG BIOSYNTHESIS | Genes involved in HS-GAG biosynthesis |
| 0.0 | 0.7 | REACTOME MYOGENESIS | Genes involved in Myogenesis |
| 0.0 | 0.3 | REACTOME CIRCADIAN CLOCK | Genes involved in Circadian Clock |
| 0.0 | 0.1 | REACTOME SYNTHESIS OF PIPS AT THE EARLY ENDOSOME MEMBRANE | Genes involved in Synthesis of PIPs at the early endosome membrane |
| 0.0 | 0.6 | REACTOME PIP3 ACTIVATES AKT SIGNALING | Genes involved in PIP3 activates AKT signaling |
| 0.0 | 0.6 | REACTOME INSULIN RECEPTOR RECYCLING | Genes involved in Insulin receptor recycling |
| 0.0 | 0.7 | REACTOME AMINE COMPOUND SLC TRANSPORTERS | Genes involved in Amine compound SLC transporters |
| 0.0 | 0.2 | REACTOME NOREPINEPHRINE NEUROTRANSMITTER RELEASE CYCLE | Genes involved in Norepinephrine Neurotransmitter Release Cycle |
| 0.0 | 0.4 | REACTOME SIGNALING BY FGFR1 FUSION MUTANTS | Genes involved in Signaling by FGFR1 fusion mutants |
| 0.0 | 0.2 | REACTOME ORGANIC CATION ANION ZWITTERION TRANSPORT | Genes involved in Organic cation/anion/zwitterion transport |
| 0.0 | 0.3 | REACTOME MRNA DECAY BY 5 TO 3 EXORIBONUCLEASE | Genes involved in mRNA Decay by 5' to 3' Exoribonuclease |
| 0.0 | 0.5 | REACTOME CASPASE MEDIATED CLEAVAGE OF CYTOSKELETAL PROTEINS | Genes involved in Caspase-mediated cleavage of cytoskeletal proteins |
| 0.0 | 0.6 | REACTOME RAP1 SIGNALLING | Genes involved in Rap1 signalling |
| 0.0 | 0.2 | REACTOME PURINE CATABOLISM | Genes involved in Purine catabolism |
| 0.0 | 0.9 | REACTOME NOTCH1 INTRACELLULAR DOMAIN REGULATES TRANSCRIPTION | Genes involved in NOTCH1 Intracellular Domain Regulates Transcription |
| 0.0 | 0.5 | REACTOME BASIGIN INTERACTIONS | Genes involved in Basigin interactions |
| 0.0 | 0.6 | REACTOME NEP NS2 INTERACTS WITH THE CELLULAR EXPORT MACHINERY | Genes involved in NEP/NS2 Interacts with the Cellular Export Machinery |
| 0.0 | 0.1 | REACTOME SPRY REGULATION OF FGF SIGNALING | Genes involved in Spry regulation of FGF signaling |
| 0.0 | 0.4 | REACTOME PRE NOTCH PROCESSING IN GOLGI | Genes involved in Pre-NOTCH Processing in Golgi |
| 0.0 | 0.3 | REACTOME REGULATION OF HYPOXIA INDUCIBLE FACTOR HIF BY OXYGEN | Genes involved in Regulation of Hypoxia-inducible Factor (HIF) by Oxygen |
| 0.0 | 0.2 | REACTOME G PROTEIN ACTIVATION | Genes involved in G-protein activation |
| 0.0 | 0.2 | REACTOME TETRAHYDROBIOPTERIN BH4 SYNTHESIS RECYCLING SALVAGE AND REGULATION | Genes involved in Tetrahydrobiopterin (BH4) synthesis, recycling, salvage and regulation |
| 0.0 | 0.1 | REACTOME TRANSFERRIN ENDOCYTOSIS AND RECYCLING | Genes involved in Transferrin endocytosis and recycling |
| 0.0 | 1.7 | REACTOME TRANSPORT OF INORGANIC CATIONS ANIONS AND AMINO ACIDS OLIGOPEPTIDES | Genes involved in Transport of inorganic cations/anions and amino acids/oligopeptides |
| 0.0 | 0.4 | REACTOME INTRINSIC PATHWAY FOR APOPTOSIS | Genes involved in Intrinsic Pathway for Apoptosis |
| 0.0 | 0.1 | REACTOME JNK C JUN KINASES PHOSPHORYLATION AND ACTIVATION MEDIATED BY ACTIVATED HUMAN TAK1 | Genes involved in JNK (c-Jun kinases) phosphorylation and activation mediated by activated human TAK1 |
| 0.0 | 0.3 | REACTOME G ALPHA S SIGNALLING EVENTS | Genes involved in G alpha (s) signalling events |
| 0.0 | 0.3 | REACTOME ABCA TRANSPORTERS IN LIPID HOMEOSTASIS | Genes involved in ABCA transporters in lipid homeostasis |
| 0.0 | 0.2 | REACTOME GAP JUNCTION DEGRADATION | Genes involved in Gap junction degradation |
| 0.0 | 0.1 | REACTOME RNA POL III TRANSCRIPTION INITIATION FROM TYPE 2 PROMOTER | Genes involved in RNA Polymerase III Transcription Initiation From Type 2 Promoter |
| 0.0 | 0.5 | REACTOME SPHINGOLIPID DE NOVO BIOSYNTHESIS | Genes involved in Sphingolipid de novo biosynthesis |
| 0.0 | 0.7 | REACTOME O LINKED GLYCOSYLATION OF MUCINS | Genes involved in O-linked glycosylation of mucins |
| 0.0 | 0.5 | REACTOME SYNTHESIS OF PA | Genes involved in Synthesis of PA |
| 0.0 | 0.3 | REACTOME SIGNALING BY BMP | Genes involved in Signaling by BMP |
| 0.0 | 0.3 | REACTOME CHONDROITIN SULFATE DERMATAN SULFATE METABOLISM | Genes involved in Chondroitin sulfate/dermatan sulfate metabolism |
| 0.0 | 0.1 | REACTOME ACTIVATION OF CHAPERONE GENES BY ATF6 ALPHA | Genes involved in Activation of Chaperone Genes by ATF6-alpha |
| 0.0 | 0.1 | REACTOME THE NLRP3 INFLAMMASOME | Genes involved in The NLRP3 inflammasome |
| 0.0 | 0.4 | REACTOME YAP1 AND WWTR1 TAZ STIMULATED GENE EXPRESSION | Genes involved in YAP1- and WWTR1 (TAZ)-stimulated gene expression |
| 0.0 | 0.1 | REACTOME OPSINS | Genes involved in Opsins |
| 0.0 | 0.2 | REACTOME SMAD2 SMAD3 SMAD4 HETEROTRIMER REGULATES TRANSCRIPTION | Genes involved in SMAD2/SMAD3:SMAD4 heterotrimer regulates transcription |
| 0.0 | 0.3 | REACTOME DARPP 32 EVENTS | Genes involved in DARPP-32 events |
| 0.0 | 0.5 | REACTOME TIGHT JUNCTION INTERACTIONS | Genes involved in Tight junction interactions |
| 0.0 | 0.1 | REACTOME TRAFFICKING AND PROCESSING OF ENDOSOMAL TLR | Genes involved in Trafficking and processing of endosomal TLR |
| 0.0 | 0.3 | REACTOME SEMA4D IN SEMAPHORIN SIGNALING | Genes involved in Sema4D in semaphorin signaling |
| 0.0 | 0.1 | REACTOME HORMONE LIGAND BINDING RECEPTORS | Genes involved in Hormone ligand-binding receptors |
| 0.0 | 1.3 | REACTOME FACTORS INVOLVED IN MEGAKARYOCYTE DEVELOPMENT AND PLATELET PRODUCTION | Genes involved in Factors involved in megakaryocyte development and platelet production |