Project
avrg: GSE58827: Dynamics of the Mouse Liver
Navigation
Downloads
Results for Onecut2_Onecut3
Z-value: 1.15
Motif logo


Transcription factors associated with Onecut2_Onecut3
| Gene Symbol | Gene ID | Gene Info |
|---|---|---|
|
Onecut2
|
ENSMUSG00000045991.12 | one cut domain, family member 2 |
|
Onecut3
|
ENSMUSG00000045518.8 | one cut domain, family member 3 |
Activity-expression correlation:
| Gene | Promoter | Pearson corr. coef. | P-value | Plot |
|---|---|---|---|---|
| Onecut2 | mm10_v2_chr18_+_64340225_64340364 | 0.20 | 2.4e-01 | Click! |
| Onecut3 | mm10_v2_chr10_+_80494835_80494873 | -0.19 | 2.7e-01 | Click! |
Activity profile of Onecut2_Onecut3 motif
Sorted Z-values of Onecut2_Onecut3 motif
| Promoter | Log-likelihood | Transcript | Gene | Gene Info |
|---|---|---|---|---|
| chr4_-_62054112 | 3.76 |
ENSMUST00000074018.3
|
Mup20
|
major urinary protein 20 |
| chr4_-_61674094 | 3.73 |
ENSMUST00000098040.3
|
Mup18
|
major urinary protein 18 |
| chr4_-_61303802 | 2.98 |
ENSMUST00000125461.1
|
Mup14
|
major urinary protein 14 |
| chr4_-_61303998 | 2.53 |
ENSMUST00000071005.8
ENSMUST00000075206.5 |
Mup14
|
major urinary protein 14 |
| chr9_-_86695897 | 2.04 |
ENSMUST00000034989.8
|
Me1
|
malic enzyme 1, NADP(+)-dependent, cytosolic |
| chr7_-_34655500 | 1.81 |
ENSMUST00000032709.1
|
Kctd15
|
potassium channel tetramerisation domain containing 15 |
| chr4_+_147553277 | 1.76 |
ENSMUST00000139784.1
ENSMUST00000143885.1 ENSMUST00000081742.6 |
Gm13154
|
predicted gene 13154 |
| chr4_-_147642496 | 1.70 |
ENSMUST00000133006.1
ENSMUST00000037565.7 ENSMUST00000105720.1 |
2610305D13Rik
|
RIKEN cDNA 2610305D13 gene |
| chr4_+_147361303 | 1.57 |
ENSMUST00000133078.1
ENSMUST00000154154.1 |
Gm13145
|
predicted gene 13145 |
| chr17_-_34804546 | 1.38 |
ENSMUST00000025223.8
|
Cyp21a1
|
cytochrome P450, family 21, subfamily a, polypeptide 1 |
| chr15_-_89477400 | 1.26 |
ENSMUST00000165199.1
|
Arsa
|
arylsulfatase A |
| chr4_+_146097312 | 1.16 |
ENSMUST00000105730.1
ENSMUST00000091878.5 |
Gm13051
|
predicted gene 13051 |
| chr15_+_62039216 | 1.12 |
ENSMUST00000183297.1
|
Pvt1
|
plasmacytoma variant translocation 1 |
| chr3_-_98588807 | 1.00 |
ENSMUST00000178221.1
|
Gm10681
|
predicted gene 10681 |
| chr7_+_131032061 | 0.99 |
ENSMUST00000084509.3
|
Dmbt1
|
deleted in malignant brain tumors 1 |
| chr5_-_87254804 | 0.91 |
ENSMUST00000075858.3
|
Ugt2b37
|
UDP glucuronosyltransferase 2 family, polypeptide B37 |
| chr5_+_109940426 | 0.88 |
ENSMUST00000170826.1
|
Gm15446
|
predicted gene 15446 |
| chr10_-_63203930 | 0.77 |
ENSMUST00000095580.2
|
Mypn
|
myopalladin |
| chr4_+_109343029 | 0.77 |
ENSMUST00000030281.5
|
Eps15
|
epidermal growth factor receptor pathway substrate 15 |
| chr18_-_9282754 | 0.69 |
ENSMUST00000041007.3
|
Gjd4
|
gap junction protein, delta 4 |
| chr2_+_55411790 | 0.67 |
ENSMUST00000155997.1
ENSMUST00000128307.1 |
Gm14033
|
predicted gene 14033 |
| chr17_-_33033367 | 0.66 |
ENSMUST00000087654.4
|
Zfp763
|
zinc finger protein 763 |
| chr17_-_28560704 | 0.62 |
ENSMUST00000114785.1
ENSMUST00000025062.3 |
Clps
|
colipase, pancreatic |
| chr4_+_147492417 | 0.61 |
ENSMUST00000105721.2
|
Gm13152
|
predicted gene 13152 |
| chr7_+_123462274 | 0.61 |
ENSMUST00000033023.3
|
Aqp8
|
aquaporin 8 |
| chr14_+_17981633 | 0.59 |
ENSMUST00000022304.8
|
Thrb
|
thyroid hormone receptor beta |
| chr6_+_78405148 | 0.58 |
ENSMUST00000023906.2
|
Reg2
|
regenerating islet-derived 2 |
| chr2_-_175131864 | 0.56 |
ENSMUST00000108929.2
|
Gm14399
|
predicted gene 14399 |
| chr6_+_29853746 | 0.56 |
ENSMUST00000064872.6
ENSMUST00000152581.1 ENSMUST00000176265.1 ENSMUST00000154079.1 |
Ahcyl2
|
S-adenosylhomocysteine hydrolase-like 2 |
| chr18_+_3471630 | 0.55 |
ENSMUST00000179907.1
|
G430049J08Rik
|
RIKEN cDNA G430049J08 gene |
| chr11_+_96282529 | 0.54 |
ENSMUST00000125410.1
|
Hoxb8
|
homeobox B8 |
| chr19_-_9559204 | 0.54 |
ENSMUST00000090527.3
|
Stxbp3b
|
syntaxin-binding protein 3B |
| chr12_+_88083697 | 0.53 |
ENSMUST00000177720.1
|
Gm16368
|
predicted pseudogene 16368 |
| chr6_-_78468863 | 0.52 |
ENSMUST00000032089.2
|
Reg3g
|
regenerating islet-derived 3 gamma |
| chr4_+_147021850 | 0.51 |
ENSMUST00000075775.5
|
Rex2
|
reduced expression 2 |
| chr6_-_129876659 | 0.50 |
ENSMUST00000014687.4
ENSMUST00000122219.1 |
Klra17
|
killer cell lectin-like receptor, subfamily A, member 17 |
| chr13_-_95478655 | 0.49 |
ENSMUST00000022186.3
|
S100z
|
S100 calcium binding protein, zeta |
| chr2_-_169962987 | 0.49 |
ENSMUST00000087964.2
|
AY702102
|
cDNA sequence AY702102 |
| chr5_+_8422908 | 0.48 |
ENSMUST00000170496.1
|
Slc25a40
|
solute carrier family 25, member 40 |
| chr1_-_5070281 | 0.48 |
ENSMUST00000147158.1
ENSMUST00000118000.1 |
Rgs20
|
regulator of G-protein signaling 20 |
| chrX_+_42151002 | 0.47 |
ENSMUST00000123245.1
|
Stag2
|
stromal antigen 2 |
| chr8_+_4625840 | 0.47 |
ENSMUST00000073201.5
|
Zfp958
|
zinc finger protein 958 |
| chr2_-_17390953 | 0.47 |
ENSMUST00000177966.1
|
Nebl
|
nebulette |
| chr15_-_103215285 | 0.46 |
ENSMUST00000122182.1
ENSMUST00000108813.3 ENSMUST00000127191.1 |
Cbx5
|
chromobox 5 |
| chr4_+_146156824 | 0.46 |
ENSMUST00000168483.2
|
Zfp600
|
zinc finger protein 600 |
| chr14_-_56211407 | 0.46 |
ENSMUST00000022757.3
|
Gzmf
|
granzyme F |
| chr1_+_138273722 | 0.46 |
ENSMUST00000027643.4
|
Atp6v1g3
|
ATPase, H+ transporting, lysosomal V1 subunit G3 |
| chr6_+_141524379 | 0.45 |
ENSMUST00000032362.9
|
Slco1c1
|
solute carrier organic anion transporter family, member 1c1 |
| chr3_+_138143846 | 0.44 |
ENSMUST00000159481.1
|
Trmt10a
|
tRNA methyltransferase 10A |
| chr1_-_170215380 | 0.43 |
ENSMUST00000027979.7
ENSMUST00000123399.1 |
Uhmk1
|
U2AF homology motif (UHM) kinase 1 |
| chr11_+_96282648 | 0.42 |
ENSMUST00000168043.1
|
Hoxb8
|
homeobox B8 |
| chr12_+_59131473 | 0.41 |
ENSMUST00000177162.1
|
Ctage5
|
CTAGE family, member 5 |
| chr12_+_59131286 | 0.41 |
ENSMUST00000176464.1
ENSMUST00000170992.2 ENSMUST00000176322.1 |
Ctage5
|
CTAGE family, member 5 |
| chr3_+_153844209 | 0.41 |
ENSMUST00000044089.3
|
Asb17
|
ankyrin repeat and SOCS box-containing 17 |
| chr3_+_53845086 | 0.41 |
ENSMUST00000108014.1
|
Gm10985
|
predicted gene 10985 |
| chr9_-_109162021 | 0.40 |
ENSMUST00000120329.1
ENSMUST00000054925.6 |
Fbxw21
|
F-box and WD-40 domain protein 21 |
| chr1_-_131200089 | 0.40 |
ENSMUST00000068564.8
|
Rassf5
|
Ras association (RalGDS/AF-6) domain family member 5 |
| chr1_-_64121389 | 0.39 |
ENSMUST00000055001.3
|
Klf7
|
Kruppel-like factor 7 (ubiquitous) |
| chr6_+_139843648 | 0.39 |
ENSMUST00000087657.6
|
Pik3c2g
|
phosphatidylinositol 3-kinase, C2 domain containing, gamma polypeptide |
| chrX_-_113185485 | 0.37 |
ENSMUST00000026607.8
ENSMUST00000113388.2 |
Chm
|
choroidermia |
| chr18_-_24530203 | 0.37 |
ENSMUST00000046206.3
|
Rprd1a
|
regulation of nuclear pre-mRNA domain containing 1A |
| chr17_+_17316078 | 0.37 |
ENSMUST00000105311.3
|
Gm6712
|
predicted gene 6712 |
| chr1_-_180256294 | 0.37 |
ENSMUST00000111108.3
|
Psen2
|
presenilin 2 |
| chr15_+_102459028 | 0.37 |
ENSMUST00000164938.1
ENSMUST00000023810.5 |
Prr13
|
proline rich 13 |
| chr11_-_17953861 | 0.36 |
ENSMUST00000076661.6
|
Etaa1
|
Ewing's tumor-associated antigen 1 |
| chr16_+_25286810 | 0.36 |
ENSMUST00000056087.3
|
Tprg
|
transformation related protein 63 regulated |
| chr4_+_140701466 | 0.35 |
ENSMUST00000038893.5
ENSMUST00000138808.1 |
Rcc2
|
regulator of chromosome condensation 2 |
| chrX_-_75161620 | 0.34 |
ENSMUST00000165080.1
|
Smim9
|
small integral membrane protein 9 |
| chr5_-_108795352 | 0.34 |
ENSMUST00000004943.1
|
Tmed11
|
transmembrane emp24 protein transport domain containing |
| chr17_+_24720063 | 0.34 |
ENSMUST00000170715.1
ENSMUST00000054289.6 ENSMUST00000146867.1 |
Rps2
|
ribosomal protein S2 |
| chr5_-_17849783 | 0.33 |
ENSMUST00000170051.1
ENSMUST00000165232.1 |
Cd36
|
CD36 antigen |
| chr6_+_29694204 | 0.33 |
ENSMUST00000046750.7
ENSMUST00000115250.3 |
Tspan33
|
tetraspanin 33 |
| chr15_-_79328154 | 0.33 |
ENSMUST00000166977.2
|
Pla2g6
|
phospholipase A2, group VI |
| chr9_+_53771499 | 0.33 |
ENSMUST00000048670.8
|
Slc35f2
|
solute carrier family 35, member F2 |
| chr11_+_74830920 | 0.33 |
ENSMUST00000000291.2
|
Mnt
|
max binding protein |
| chr2_+_104069819 | 0.32 |
ENSMUST00000111131.2
ENSMUST00000111132.1 ENSMUST00000129749.1 |
Cd59b
|
CD59b antigen |
| chr8_+_47824459 | 0.32 |
ENSMUST00000038693.6
|
Cldn22
|
claudin 22 |
| chr8_+_3515378 | 0.32 |
ENSMUST00000004681.7
ENSMUST00000111070.2 |
Pnpla6
|
patatin-like phospholipase domain containing 6 |
| chr11_-_24075054 | 0.31 |
ENSMUST00000068360.1
|
A830031A19Rik
|
RIKEN cDNA A830031A19 gene |
| chr15_+_102459193 | 0.31 |
ENSMUST00000164957.1
ENSMUST00000171245.1 |
Prr13
|
proline rich 13 |
| chr15_-_79328201 | 0.30 |
ENSMUST00000173163.1
ENSMUST00000047816.8 ENSMUST00000172403.2 ENSMUST00000173632.1 |
Pla2g6
|
phospholipase A2, group VI |
| chr5_-_147894804 | 0.29 |
ENSMUST00000118527.1
ENSMUST00000031655.3 ENSMUST00000138244.1 |
Slc46a3
|
solute carrier family 46, member 3 |
| chr5_-_138207302 | 0.29 |
ENSMUST00000160126.1
|
Gm454
|
predicted gene 454 |
| chr4_+_145510759 | 0.29 |
ENSMUST00000105742.1
ENSMUST00000136309.1 |
Gm13225
|
predicted gene 13225 |
| chr4_+_43383449 | 0.28 |
ENSMUST00000135216.1
ENSMUST00000152322.1 |
Rusc2
|
RUN and SH3 domain containing 2 |
| chr17_+_21657582 | 0.28 |
ENSMUST00000039726.7
|
3110052M02Rik
|
RIKEN cDNA 3110052M02 gene |
| chr15_-_42676967 | 0.28 |
ENSMUST00000022921.5
|
Angpt1
|
angiopoietin 1 |
| chr10_-_45470201 | 0.27 |
ENSMUST00000079390.6
|
Lin28b
|
lin-28 homolog B (C. elegans) |
| chr18_-_10030017 | 0.27 |
ENSMUST00000116669.1
ENSMUST00000092096.6 |
Usp14
|
ubiquitin specific peptidase 14 |
| chr4_+_145670685 | 0.27 |
ENSMUST00000105738.2
|
Gm13242
|
predicted gene 13242 |
| chr16_-_22657182 | 0.26 |
ENSMUST00000023578.7
|
Dgkg
|
diacylglycerol kinase, gamma |
| chrX_-_111536325 | 0.26 |
ENSMUST00000156639.1
|
Rps6ka6
|
ribosomal protein S6 kinase polypeptide 6 |
| chr4_-_99654983 | 0.25 |
ENSMUST00000136525.1
|
Gm12688
|
predicted gene 12688 |
| chr7_-_73541738 | 0.25 |
ENSMUST00000169922.2
|
Chd2
|
chromodomain helicase DNA binding protein 2 |
| chrY_+_51126655 | 0.25 |
ENSMUST00000180133.1
|
Gm21117
|
predicted gene, 21117 |
| chr5_-_129623655 | 0.25 |
ENSMUST00000076842.5
|
Gm6139
|
predicted gene 6139 |
| chr16_+_48310427 | 0.25 |
ENSMUST00000097175.4
|
Dppa2
|
developmental pluripotency associated 2 |
| chr6_+_127149389 | 0.25 |
ENSMUST00000180811.1
|
9330179D12Rik
|
RIKEN cDNA 9330179D12 gene |
| chr12_+_59080988 | 0.25 |
ENSMUST00000085368.3
|
Gm5786
|
predicted pseudogene 5786 |
| chr11_+_115334731 | 0.25 |
ENSMUST00000106543.1
ENSMUST00000019006.4 |
Otop3
|
otopetrin 3 |
| chr3_+_102010138 | 0.24 |
ENSMUST00000066187.4
|
Nhlh2
|
nescient helix loop helix 2 |
| chr7_-_140507318 | 0.24 |
ENSMUST00000064392.6
|
Olfr536
|
olfactory receptor 536 |
| chr9_-_20728219 | 0.24 |
ENSMUST00000034692.7
|
Olfm2
|
olfactomedin 2 |
| chr8_+_93810832 | 0.24 |
ENSMUST00000034198.8
ENSMUST00000125716.1 |
Gnao1
|
guanine nucleotide binding protein, alpha O |
| chr15_+_55112317 | 0.24 |
ENSMUST00000096433.3
|
Deptor
|
DEP domain containing MTOR-interacting protein |
| chr10_-_53647080 | 0.23 |
ENSMUST00000169866.1
|
Fam184a
|
family with sequence similarity 184, member A |
| chr4_+_146502027 | 0.22 |
ENSMUST00000105735.2
|
Gm13247
|
predicted gene 13247 |
| chr16_-_22657165 | 0.22 |
ENSMUST00000089925.3
|
Dgkg
|
diacylglycerol kinase, gamma |
| chr13_-_55415166 | 0.21 |
ENSMUST00000054146.3
|
Pfn3
|
profilin 3 |
| chr7_+_35802593 | 0.21 |
ENSMUST00000052454.2
|
E130304I02Rik
|
RIKEN cDNA E130304I02 gene |
| chrY_-_35130404 | 0.21 |
ENSMUST00000180170.1
|
Gm20855
|
predicted gene, 20855 |
| chr15_+_27025386 | 0.21 |
ENSMUST00000169678.2
|
Gm6576
|
predicted gene 6576 |
| chr14_+_61138445 | 0.20 |
ENSMUST00000089394.3
ENSMUST00000119509.1 |
Sacs
|
sacsin |
| chr2_-_181581996 | 0.20 |
ENSMUST00000057816.8
|
Uckl1
|
uridine-cytidine kinase 1-like 1 |
| chr13_-_22041352 | 0.20 |
ENSMUST00000102977.2
|
Hist1h4i
|
histone cluster 1, H4i |
| chr4_+_146971976 | 0.20 |
ENSMUST00000146688.2
|
Gm13150
|
predicted gene 13150 |
| chr16_-_10543028 | 0.20 |
ENSMUST00000184863.1
ENSMUST00000038281.5 |
Dexi
|
dexamethasone-induced transcript |
| chr16_-_36131156 | 0.20 |
ENSMUST00000161638.1
ENSMUST00000096090.2 |
Csta
|
cystatin A |
| chr14_-_122451109 | 0.20 |
ENSMUST00000081580.2
|
Gm5089
|
predicted gene 5089 |
| chr7_+_44207307 | 0.19 |
ENSMUST00000077354.4
|
Klk1b4
|
kallikrein 1-related pepidase b4 |
| chr5_+_32458974 | 0.19 |
ENSMUST00000015100.8
|
Ppp1cb
|
protein phosphatase 1, catalytic subunit, beta isoform |
| chr13_-_106936907 | 0.19 |
ENSMUST00000080856.7
|
Ipo11
|
importin 11 |
| chr18_-_61259987 | 0.19 |
ENSMUST00000170335.2
|
Rps2-ps10
|
ribosomal protein S2, pseudogene 10 |
| chr18_+_57468478 | 0.19 |
ENSMUST00000091892.2
|
Ctxn3
|
cortexin 3 |
| chr6_-_38109548 | 0.19 |
ENSMUST00000114908.1
|
Atp6v0a4
|
ATPase, H+ transporting, lysosomal V0 subunit A4 |
| chr1_+_172698046 | 0.19 |
ENSMUST00000038495.3
|
Crp
|
C-reactive protein, pentraxin-related |
| chr6_-_51469836 | 0.19 |
ENSMUST00000090002.7
|
Hnrnpa2b1
|
heterogeneous nuclear ribonucleoprotein A2/B1 |
| chr11_+_108587077 | 0.18 |
ENSMUST00000146912.2
|
Cep112
|
centrosomal protein 112 |
| chr8_-_106573461 | 0.18 |
ENSMUST00000073722.5
|
Gm10073
|
predicted pseudogene 10073 |
| chr11_-_99556846 | 0.18 |
ENSMUST00000092699.2
|
Krtap3-2
|
keratin associated protein 3-2 |
| chr6_+_127233756 | 0.18 |
ENSMUST00000071458.3
|
Gm4968
|
predicted gene 4968 |
| chr17_+_12119274 | 0.18 |
ENSMUST00000024594.2
|
Agpat4
|
1-acylglycerol-3-phosphate O-acyltransferase 4 (lysophosphatidic acid acyltransferase, delta) |
| chr5_+_29735688 | 0.17 |
ENSMUST00000008733.8
|
Dnajb6
|
DnaJ (Hsp40) homolog, subfamily B, member 6 |
| chr12_-_34291092 | 0.17 |
ENSMUST00000166546.2
|
Gm18025
|
predicted gene, 18025 |
| chr15_+_55112420 | 0.17 |
ENSMUST00000100660.4
|
Deptor
|
DEP domain containing MTOR-interacting protein |
| chr3_+_94837702 | 0.17 |
ENSMUST00000107266.1
ENSMUST00000042402.5 ENSMUST00000107269.1 |
Pogz
|
pogo transposable element with ZNF domain |
| chr1_-_63114516 | 0.17 |
ENSMUST00000097718.2
|
Ino80d
|
INO80 complex subunit D |
| chr2_-_63184253 | 0.17 |
ENSMUST00000075052.3
ENSMUST00000112454.1 |
Kcnh7
|
potassium voltage-gated channel, subfamily H (eag-related), member 7 |
| chrY_+_80135210 | 0.16 |
ENSMUST00000179811.1
|
Gm21760
|
predicted gene, 21760 |
| chr7_-_110844350 | 0.16 |
ENSMUST00000177462.1
ENSMUST00000176746.1 ENSMUST00000177236.1 |
Rnf141
|
ring finger protein 141 |
| chr6_-_135118240 | 0.16 |
ENSMUST00000032327.7
ENSMUST00000111922.1 |
Gprc5d
|
G protein-coupled receptor, family C, group 5, member D |
| chrX_+_102802963 | 0.16 |
ENSMUST00000118218.1
|
Dmrtc1c1
|
DMRT-like family C1c1 |
| chr3_+_94837533 | 0.16 |
ENSMUST00000107270.2
|
Pogz
|
pogo transposable element with ZNF domain |
| chr9_-_14782964 | 0.15 |
ENSMUST00000034406.3
|
Ankrd49
|
ankyrin repeat domain 49 |
| chr17_+_32468462 | 0.15 |
ENSMUST00000003413.6
|
Cyp4f39
|
cytochrome P450, family 4, subfamily f, polypeptide 39 |
| chr2_-_25224653 | 0.15 |
ENSMUST00000043584.4
|
Tubb4b
|
tubulin, beta 4B class IVB |
| chr14_-_68655804 | 0.15 |
ENSMUST00000111072.1
ENSMUST00000022642.5 |
Adam28
|
a disintegrin and metallopeptidase domain 28 |
| chr6_+_48929891 | 0.15 |
ENSMUST00000031837.7
|
1600015I10Rik
|
RIKEN cDNA 1600015I10 gene |
| chr12_+_74288735 | 0.15 |
ENSMUST00000095617.1
|
1700086L19Rik
|
RIKEN cDNA 1700086L19 gene |
| chr3_+_106034661 | 0.15 |
ENSMUST00000170669.2
|
Gm4540
|
predicted gene 4540 |
| chr18_-_62756275 | 0.15 |
ENSMUST00000067450.1
ENSMUST00000048109.5 |
2700046A07Rik
|
RIKEN cDNA 2700046A07 gene |
| chr5_-_130255525 | 0.14 |
ENSMUST00000026387.4
|
Sbds
|
Shwachman-Bodian-Diamond syndrome homolog (human) |
| chr7_-_57386871 | 0.14 |
ENSMUST00000068394.6
|
Gabrg3
|
gamma-aminobutyric acid (GABA) A receptor, subunit gamma 3 |
| chr14_-_120042429 | 0.14 |
ENSMUST00000058213.5
|
Oxgr1
|
oxoglutarate (alpha-ketoglutarate) receptor 1 |
| chr1_-_64121456 | 0.14 |
ENSMUST00000142009.1
ENSMUST00000114086.1 |
Klf7
|
Kruppel-like factor 7 (ubiquitous) |
| chr3_-_30140407 | 0.14 |
ENSMUST00000108271.3
|
Mecom
|
MDS1 and EVI1 complex locus |
| chr6_-_82939676 | 0.14 |
ENSMUST00000000641.9
ENSMUST00000113982.1 |
Sema4f
|
sema domain, immunoglobulin domain (Ig), TM domain, and short cytoplasmic domain |
| chr5_-_65335564 | 0.14 |
ENSMUST00000172780.1
|
Rfc1
|
replication factor C (activator 1) 1 |
| chr3_+_136670076 | 0.14 |
ENSMUST00000070198.7
|
Ppp3ca
|
protein phosphatase 3, catalytic subunit, alpha isoform |
| chr11_-_70669283 | 0.14 |
ENSMUST00000129434.1
ENSMUST00000018431.6 |
Spag7
|
sperm associated antigen 7 |
| chr3_-_10183885 | 0.14 |
ENSMUST00000029034.7
|
Pmp2
|
peripheral myelin protein 2 |
| chr13_+_90923122 | 0.13 |
ENSMUST00000051955.7
|
Rps23
|
ribosomal protein S23 |
| chr6_-_127769427 | 0.13 |
ENSMUST00000032500.8
|
Prmt8
|
protein arginine N-methyltransferase 8 |
| chr5_+_122100951 | 0.13 |
ENSMUST00000014080.6
ENSMUST00000111750.1 ENSMUST00000139213.1 ENSMUST00000111751.1 ENSMUST00000155612.1 |
Myl2
|
myosin, light polypeptide 2, regulatory, cardiac, slow |
| chr6_+_116208030 | 0.13 |
ENSMUST00000036759.8
|
Fam21
|
family with sequence similarity 21 |
| chr1_+_153749414 | 0.13 |
ENSMUST00000086209.3
|
Rnasel
|
ribonuclease L (2', 5'-oligoisoadenylate synthetase-dependent) |
| chr6_+_134640940 | 0.13 |
ENSMUST00000062755.8
|
Loh12cr1
|
loss of heterozygosity, 12, chromosomal region 1 homolog (human) |
| chr17_+_21566988 | 0.12 |
ENSMUST00000088787.5
|
Zfp948
|
zinc finger protein 948 |
| chr16_-_43664145 | 0.12 |
ENSMUST00000096065.4
|
Tigit
|
T cell immunoreceptor with Ig and ITIM domains |
| chr18_+_35771574 | 0.12 |
ENSMUST00000167406.1
|
Ube2d2a
|
ubiquitin-conjugating enzyme E2D 2A |
| chr3_-_10351313 | 0.11 |
ENSMUST00000108377.1
ENSMUST00000037839.5 |
Zfand1
|
zinc finger, AN1-type domain 1 |
| chr2_+_144594054 | 0.11 |
ENSMUST00000136628.1
|
Gm561
|
predicted gene 561 |
| chr12_-_84698769 | 0.11 |
ENSMUST00000095550.2
|
Syndig1l
|
synapse differentiation inducing 1 like |
| chr9_-_64253617 | 0.11 |
ENSMUST00000005066.8
|
Map2k1
|
mitogen-activated protein kinase kinase 1 |
| chr9_-_50739365 | 0.11 |
ENSMUST00000117093.1
ENSMUST00000121634.1 |
Dixdc1
|
DIX domain containing 1 |
| chr2_+_86297817 | 0.11 |
ENSMUST00000054746.2
|
Olfr1052
|
olfactory receptor 1052 |
| chr18_-_53744509 | 0.11 |
ENSMUST00000049811.6
|
Cep120
|
centrosomal protein 120 |
| chr5_+_122101146 | 0.11 |
ENSMUST00000147178.1
|
Myl2
|
myosin, light polypeptide 2, regulatory, cardiac, slow |
| chr6_-_51469869 | 0.11 |
ENSMUST00000114459.1
ENSMUST00000069949.6 |
Hnrnpa2b1
|
heterogeneous nuclear ribonucleoprotein A2/B1 |
| chr11_+_29373618 | 0.11 |
ENSMUST00000040182.6
ENSMUST00000109477.1 |
Ccdc88a
|
coiled coil domain containing 88A |
| chr4_-_109156610 | 0.11 |
ENSMUST00000161363.1
|
Osbpl9
|
oxysterol binding protein-like 9 |
| chr10_+_112083345 | 0.10 |
ENSMUST00000148897.1
ENSMUST00000020434.3 |
Glipr1l2
|
GLI pathogenesis-related 1 like 2 |
| chr4_+_43384332 | 0.10 |
ENSMUST00000136360.1
|
Rusc2
|
RUN and SH3 domain containing 2 |
| chr1_+_49244616 | 0.10 |
ENSMUST00000056879.8
|
C230029F24Rik
|
RIKEN cDNA C230029F24 gene |
| chr16_+_17619341 | 0.10 |
ENSMUST00000006053.6
ENSMUST00000171435.1 ENSMUST00000163476.1 ENSMUST00000168101.1 ENSMUST00000165363.1 ENSMUST00000169662.1 ENSMUST00000090159.4 ENSMUST00000172182.1 ENSMUST00000163592.1 |
Smpd4
|
sphingomyelin phosphodiesterase 4 |
| chr18_+_62657285 | 0.10 |
ENSMUST00000162511.1
|
Spink10
|
serine peptidase inhibitor, Kazal type 10 |
| chrX_+_119927196 | 0.10 |
ENSMUST00000040961.2
ENSMUST00000113366.1 |
Pabpc5
|
poly(A) binding protein, cytoplasmic 5 |
| chr10_-_64090241 | 0.10 |
ENSMUST00000133588.1
|
Lrrtm3
|
leucine rich repeat transmembrane neuronal 3 |
| chr8_-_109251698 | 0.10 |
ENSMUST00000079189.3
|
4922502B01Rik
|
RIKEN cDNA 4922502B01 gene |
| chr12_-_31950535 | 0.10 |
ENSMUST00000172314.2
|
Hbp1
|
high mobility group box transcription factor 1 |
| chr17_+_29660595 | 0.10 |
ENSMUST00000024816.6
|
Cmtr1
|
cap methyltransferase 1 |
| chr6_+_127072902 | 0.10 |
ENSMUST00000000186.6
|
Fgf23
|
fibroblast growth factor 23 |
| chr11_-_98329641 | 0.10 |
ENSMUST00000041685.6
|
Neurod2
|
neurogenic differentiation 2 |
| chr12_+_109545390 | 0.10 |
ENSMUST00000146701.1
|
Meg3
|
maternally expressed 3 |
| chrX_-_95658416 | 0.10 |
ENSMUST00000044382.6
|
Zc4h2
|
zinc finger, C4H2 domain containing |
| chr9_-_69451035 | 0.10 |
ENSMUST00000071565.5
|
Gm4978
|
predicted gene 4978 |
| chr17_-_71459300 | 0.09 |
ENSMUST00000183937.1
|
Gm4707
|
predicted gene 4707 |
| chr3_+_107090874 | 0.09 |
ENSMUST00000060946.3
ENSMUST00000182132.1 |
A930002I21Rik
|
RIKEN cDNA A930002I21 gene |
| chrX_-_95658379 | 0.09 |
ENSMUST00000119640.1
|
Zc4h2
|
zinc finger, C4H2 domain containing |
| chr1_-_144177259 | 0.09 |
ENSMUST00000111941.1
ENSMUST00000052375.1 |
Rgs13
|
regulator of G-protein signaling 13 |
Network of associatons between targets according to the STRING database.

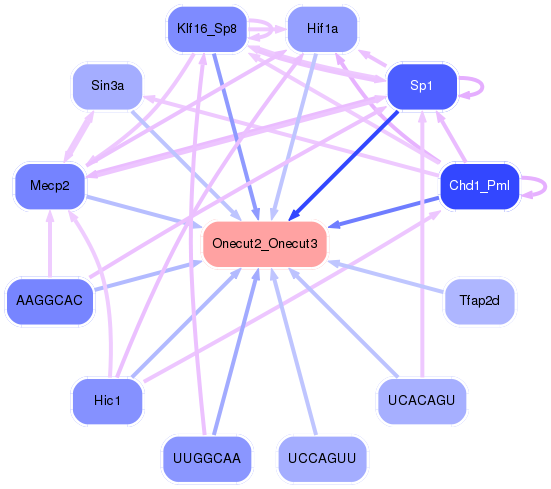
First level regulatory network of Onecut2_Onecut3
Gene Ontology Analysis
Gene overrepresentation in biological process category:
| Log-likelihood per target | Total log-likelihood | Term | Description |
|---|---|---|---|
| 0.6 | 3.8 | GO:0008355 | olfactory learning(GO:0008355) |
| 0.3 | 2.0 | GO:0006108 | malate metabolic process(GO:0006108) regulation of NADP metabolic process(GO:1902031) |
| 0.2 | 0.7 | GO:0014901 | regulation of satellite cell activation involved in skeletal muscle regeneration(GO:0014717) satellite cell activation involved in skeletal muscle regeneration(GO:0014901) |
| 0.1 | 0.6 | GO:0007621 | negative regulation of female receptivity(GO:0007621) |
| 0.1 | 0.3 | GO:0070543 | response to linoleic acid(GO:0070543) |
| 0.1 | 0.6 | GO:2000304 | positive regulation of sphingolipid biosynthetic process(GO:0090154) positive regulation of ceramide biosynthetic process(GO:2000304) |
| 0.1 | 0.3 | GO:0030210 | heparin biosynthetic process(GO:0030210) |
| 0.1 | 0.3 | GO:1903070 | negative regulation of ER-associated ubiquitin-dependent protein catabolic process(GO:1903070) |
| 0.1 | 0.6 | GO:0015722 | canalicular bile acid transport(GO:0015722) |
| 0.1 | 1.4 | GO:0006705 | mineralocorticoid biosynthetic process(GO:0006705) |
| 0.1 | 0.8 | GO:0019065 | receptor-mediated endocytosis of virus by host cell(GO:0019065) endocytosis involved in viral entry into host cell(GO:0075509) |
| 0.1 | 0.6 | GO:0033353 | S-adenosylmethionine cycle(GO:0033353) |
| 0.1 | 0.6 | GO:0051715 | cytolysis in other organism(GO:0051715) |
| 0.1 | 1.1 | GO:0001833 | inner cell mass cell proliferation(GO:0001833) |
| 0.1 | 0.2 | GO:1903244 | positive regulation of cardiac muscle adaptation(GO:0010615) positive regulation of cardiac muscle hypertrophy in response to stress(GO:1903244) |
| 0.0 | 0.5 | GO:0032876 | negative regulation of DNA endoreduplication(GO:0032876) |
| 0.0 | 0.3 | GO:0001905 | activation of membrane attack complex(GO:0001905) regulation of activation of membrane attack complex(GO:0001969) |
| 0.0 | 0.8 | GO:0048739 | cardiac muscle fiber development(GO:0048739) |
| 0.0 | 0.2 | GO:0060715 | syncytiotrophoblast cell differentiation involved in labyrinthine layer development(GO:0060715) |
| 0.0 | 0.3 | GO:0044806 | G-quadruplex DNA unwinding(GO:0044806) |
| 0.0 | 0.4 | GO:0018344 | protein geranylgeranylation(GO:0018344) |
| 0.0 | 0.2 | GO:0008655 | pyrimidine-containing compound salvage(GO:0008655) pyrimidine nucleoside salvage(GO:0043097) |
| 0.0 | 1.0 | GO:0021516 | dorsal spinal cord development(GO:0021516) |
| 0.0 | 0.4 | GO:0070940 | dephosphorylation of RNA polymerase II C-terminal domain(GO:0070940) |
| 0.0 | 0.2 | GO:0098735 | positive regulation of the force of heart contraction(GO:0098735) |
| 0.0 | 0.1 | GO:0019919 | peptidyl-arginine methylation, to asymmetrical-dimethyl arginine(GO:0019919) |
| 0.0 | 0.1 | GO:2000297 | negative regulation of synapse maturation(GO:2000297) |
| 0.0 | 0.2 | GO:0032929 | negative regulation of superoxide anion generation(GO:0032929) |
| 0.0 | 0.3 | GO:0010587 | miRNA catabolic process(GO:0010587) |
| 0.0 | 0.3 | GO:0001731 | formation of translation preinitiation complex(GO:0001731) |
| 0.0 | 1.2 | GO:0007339 | binding of sperm to zona pellucida(GO:0007339) |
| 0.0 | 0.6 | GO:0001967 | suckling behavior(GO:0001967) |
| 0.0 | 0.3 | GO:0051382 | kinetochore assembly(GO:0051382) |
| 0.0 | 0.4 | GO:0034501 | protein localization to kinetochore(GO:0034501) |
| 0.0 | 0.1 | GO:0010979 | regulation of vitamin D 24-hydroxylase activity(GO:0010979) positive regulation of vitamin D 24-hydroxylase activity(GO:0010980) |
| 0.0 | 0.4 | GO:0007220 | Notch receptor processing(GO:0007220) |
| 0.0 | 0.5 | GO:0015721 | bile acid and bile salt transport(GO:0015721) |
| 0.0 | 0.1 | GO:1903566 | positive regulation of protein localization to cilium(GO:1903566) |
| 0.0 | 0.0 | GO:0009804 | coumarin metabolic process(GO:0009804) |
| 0.0 | 0.6 | GO:0015991 | ATP hydrolysis coupled proton transport(GO:0015991) |
| 0.0 | 0.4 | GO:0045792 | negative regulation of cell size(GO:0045792) |
| 0.0 | 0.9 | GO:0046834 | lipid phosphorylation(GO:0046834) |
| 0.0 | 0.2 | GO:0006610 | ribosomal protein import into nucleus(GO:0006610) |
| 0.0 | 0.1 | GO:0006685 | sphingomyelin catabolic process(GO:0006685) |
| 0.0 | 0.2 | GO:0051152 | positive regulation of smooth muscle cell differentiation(GO:0051152) |
| 0.0 | 0.3 | GO:2000381 | negative regulation of mesoderm development(GO:2000381) |
| 0.0 | 0.1 | GO:0010909 | regulation of heparan sulfate proteoglycan biosynthetic process(GO:0010908) positive regulation of heparan sulfate proteoglycan biosynthetic process(GO:0010909) canonical Wnt signaling pathway involved in positive regulation of epithelial to mesenchymal transition(GO:0044334) |
| 0.0 | 0.4 | GO:2000001 | regulation of DNA damage checkpoint(GO:2000001) |
| 0.0 | 0.4 | GO:0045948 | positive regulation of translational initiation(GO:0045948) |
| 0.0 | 0.1 | GO:0046684 | response to pyrethroid(GO:0046684) |
| 0.0 | 0.2 | GO:0005981 | regulation of glycogen catabolic process(GO:0005981) |
| 0.0 | 0.1 | GO:0090170 | regulation of Golgi inheritance(GO:0090170) positive regulation of production of miRNAs involved in gene silencing by miRNA(GO:1903800) |
| 0.0 | 0.1 | GO:0021869 | forebrain ventricular zone progenitor cell division(GO:0021869) |
| 0.0 | 0.5 | GO:0030488 | tRNA methylation(GO:0030488) |
| 0.0 | 0.2 | GO:0060484 | lung-associated mesenchyme development(GO:0060484) |
| 0.0 | 0.3 | GO:0060218 | hematopoietic stem cell differentiation(GO:0060218) |
| 0.0 | 0.0 | GO:0070836 | caveola assembly(GO:0070836) |
| 0.0 | 0.2 | GO:0045653 | negative regulation of megakaryocyte differentiation(GO:0045653) |
| 0.0 | 0.1 | GO:1901727 | positive regulation of histone deacetylase activity(GO:1901727) |
| 0.0 | 0.5 | GO:0019835 | cytolysis(GO:0019835) |
| 0.0 | 0.1 | GO:0060718 | chorionic trophoblast cell differentiation(GO:0060718) |
| 0.0 | 0.1 | GO:0072675 | osteoclast fusion(GO:0072675) |
| 0.0 | 0.2 | GO:1902004 | positive regulation of beta-amyloid formation(GO:1902004) |
Gene overrepresentation in cellular component category:
| Log-likelihood per target | Total log-likelihood | Term | Description |
|---|---|---|---|
| 0.2 | 0.6 | GO:0046691 | intracellular canaliculus(GO:0046691) |
| 0.1 | 1.0 | GO:0030670 | phagocytic vesicle membrane(GO:0030670) |
| 0.1 | 1.3 | GO:0031232 | extrinsic component of external side of plasma membrane(GO:0031232) |
| 0.1 | 0.4 | GO:0005968 | Rab-protein geranylgeranyltransferase complex(GO:0005968) |
| 0.1 | 0.7 | GO:0071598 | neuronal ribonucleoprotein granule(GO:0071598) |
| 0.1 | 0.8 | GO:0030122 | AP-2 adaptor complex(GO:0030122) |
| 0.0 | 0.2 | GO:0005955 | calcineurin complex(GO:0005955) |
| 0.0 | 0.7 | GO:0005922 | connexon complex(GO:0005922) |
| 0.0 | 0.1 | GO:0030905 | retromer, tubulation complex(GO:0030905) |
| 0.0 | 0.2 | GO:0072357 | PTW/PP1 phosphatase complex(GO:0072357) |
| 0.0 | 0.6 | GO:0016471 | vacuolar proton-transporting V-type ATPase complex(GO:0016471) |
| 0.0 | 0.1 | GO:0005663 | DNA replication factor C complex(GO:0005663) |
| 0.0 | 0.5 | GO:0010369 | chromocenter(GO:0010369) |
| 0.0 | 0.5 | GO:0044215 | other organism(GO:0044215) other organism cell(GO:0044216) other organism part(GO:0044217) |
| 0.0 | 0.4 | GO:0035253 | ciliary rootlet(GO:0035253) |
| 0.0 | 0.2 | GO:0097512 | cardiac myofibril(GO:0097512) |
| 0.0 | 0.2 | GO:0045298 | tubulin complex(GO:0045298) |
| 0.0 | 0.3 | GO:0031362 | anchored component of external side of plasma membrane(GO:0031362) |
| 0.0 | 0.4 | GO:0005942 | phosphatidylinositol 3-kinase complex(GO:0005942) |
| 0.0 | 0.1 | GO:0070369 | beta-catenin-TCF7L2 complex(GO:0070369) |
| 0.0 | 0.6 | GO:0000800 | lateral element(GO:0000800) |
Gene overrepresentation in molecular function category:
| Log-likelihood per target | Total log-likelihood | Term | Description |
|---|---|---|---|
| 1.3 | 3.8 | GO:0005186 | pheromone activity(GO:0005186) |
| 0.7 | 2.0 | GO:0004473 | malic enzyme activity(GO:0004470) malate dehydrogenase (decarboxylating) (NAD+) activity(GO:0004471) malate dehydrogenase (decarboxylating) (NADP+) activity(GO:0004473) |
| 0.2 | 1.3 | GO:0004065 | arylsulfatase activity(GO:0004065) |
| 0.1 | 0.3 | GO:0070892 | lipoteichoic acid receptor activity(GO:0070892) |
| 0.1 | 0.6 | GO:0004013 | adenosylhomocysteinase activity(GO:0004013) trialkylsulfonium hydrolase activity(GO:0016802) |
| 0.1 | 0.6 | GO:0047499 | calcium-independent phospholipase A2 activity(GO:0047499) |
| 0.1 | 0.5 | GO:0009019 | tRNA (guanine-N1-)-methyltransferase activity(GO:0009019) |
| 0.1 | 0.6 | GO:0070324 | thyroid hormone binding(GO:0070324) |
| 0.1 | 0.5 | GO:0015349 | thyroid hormone transmembrane transporter activity(GO:0015349) |
| 0.0 | 0.3 | GO:0001069 | regulatory region RNA binding(GO:0001069) |
| 0.0 | 0.6 | GO:0042834 | peptidoglycan binding(GO:0042834) |
| 0.0 | 0.4 | GO:0042500 | aspartic endopeptidase activity, intramembrane cleaving(GO:0042500) |
| 0.0 | 0.2 | GO:0004849 | uridine kinase activity(GO:0004849) |
| 0.0 | 0.6 | GO:0015250 | water channel activity(GO:0015250) |
| 0.0 | 0.6 | GO:0008553 | hydrogen-exporting ATPase activity, phosphorylative mechanism(GO:0008553) |
| 0.0 | 0.2 | GO:0051430 | G-protein coupled serotonin receptor binding(GO:0031821) corticotropin-releasing hormone receptor 1 binding(GO:0051430) |
| 0.0 | 0.5 | GO:0004143 | diacylglycerol kinase activity(GO:0004143) |
| 0.0 | 0.4 | GO:0030628 | pre-mRNA 3'-splice site binding(GO:0030628) |
| 0.0 | 0.8 | GO:0051371 | muscle alpha-actinin binding(GO:0051371) |
| 0.0 | 0.2 | GO:0033192 | calmodulin-dependent protein phosphatase activity(GO:0033192) |
| 0.0 | 0.1 | GO:0035241 | protein-arginine omega-N monomethyltransferase activity(GO:0035241) |
| 0.0 | 0.4 | GO:0035005 | 1-phosphatidylinositol-4-phosphate 3-kinase activity(GO:0035005) |
| 0.0 | 0.5 | GO:0042288 | MHC class I protein binding(GO:0042288) |
| 0.0 | 0.2 | GO:0001849 | complement component C1q binding(GO:0001849) |
| 0.0 | 0.8 | GO:0015020 | glucuronosyltransferase activity(GO:0015020) |
| 0.0 | 0.1 | GO:1990460 | leptin receptor binding(GO:1990460) |
| 0.0 | 0.1 | GO:0005105 | type 1 fibroblast growth factor receptor binding(GO:0005105) |
| 0.0 | 0.3 | GO:0005172 | vascular endothelial growth factor receptor binding(GO:0005172) |
| 0.0 | 0.4 | GO:0005092 | GDP-dissociation inhibitor activity(GO:0005092) |
| 0.0 | 0.8 | GO:0005044 | scavenger receptor activity(GO:0005044) |
| 0.0 | 1.0 | GO:0008395 | steroid hydroxylase activity(GO:0008395) |
| 0.0 | 0.7 | GO:0031593 | polyubiquitin binding(GO:0031593) |
| 0.0 | 0.1 | GO:0001609 | G-protein coupled adenosine receptor activity(GO:0001609) |
| 0.0 | 0.3 | GO:0070628 | proteasome binding(GO:0070628) |
| 0.0 | 0.1 | GO:0033170 | DNA clamp loader activity(GO:0003689) protein-DNA loading ATPase activity(GO:0033170) |
| 0.0 | 0.1 | GO:0004767 | sphingomyelin phosphodiesterase activity(GO:0004767) |
Gene overrepresentation in curated gene sets: canonical pathways category:
| Log-likelihood per target | Total log-likelihood | Term | Description |
|---|---|---|---|
| 0.0 | 0.1 | PID TCR RAS PATHWAY | Ras signaling in the CD4+ TCR pathway |
| 0.0 | 0.2 | PID THROMBIN PAR4 PATHWAY | PAR4-mediated thrombin signaling events |
| 0.0 | 0.2 | PID S1P S1P4 PATHWAY | S1P4 pathway |
| 0.0 | 0.5 | ST G ALPHA I PATHWAY | G alpha i Pathway |
| 0.0 | 0.8 | PID ERBB1 INTERNALIZATION PATHWAY | Internalization of ErbB1 |
Gene overrepresentation in curated gene sets: REACTOME pathways category:
| Log-likelihood per target | Total log-likelihood | Term | Description |
|---|---|---|---|
| 0.1 | 1.3 | REACTOME THE ACTIVATION OF ARYLSULFATASES | Genes involved in The activation of arylsulfatases |
| 0.1 | 0.6 | REACTOME PASSIVE TRANSPORT BY AQUAPORINS | Genes involved in Passive Transport by Aquaporins |
| 0.0 | 0.2 | REACTOME INHIBITION OF INSULIN SECRETION BY ADRENALINE NORADRENALINE | Genes involved in Inhibition of Insulin Secretion by Adrenaline/Noradrenaline |
| 0.0 | 0.5 | REACTOME TRANSPORT OF ORGANIC ANIONS | Genes involved in Transport of organic anions |
| 0.0 | 0.7 | REACTOME GAP JUNCTION ASSEMBLY | Genes involved in Gap junction assembly |
| 0.0 | 0.4 | REACTOME REGULATED PROTEOLYSIS OF P75NTR | Genes involved in Regulated proteolysis of p75NTR |
| 0.0 | 0.2 | REACTOME CREATION OF C4 AND C2 ACTIVATORS | Genes involved in Creation of C4 and C2 activators |
| 0.0 | 0.6 | REACTOME INSULIN RECEPTOR RECYCLING | Genes involved in Insulin receptor recycling |
| 0.0 | 0.4 | REACTOME SYNTHESIS OF PIPS AT THE GOLGI MEMBRANE | Genes involved in Synthesis of PIPs at the Golgi membrane |
| 0.0 | 0.8 | REACTOME EGFR DOWNREGULATION | Genes involved in EGFR downregulation |
| 0.0 | 2.2 | REACTOME PPARA ACTIVATES GENE EXPRESSION | Genes involved in PPARA Activates Gene Expression |
| 0.0 | 0.4 | REACTOME ACYL CHAIN REMODELLING OF PE | Genes involved in Acyl chain remodelling of PE |
| 0.0 | 0.6 | REACTOME METABOLISM OF STEROID HORMONES AND VITAMINS A AND D | Genes involved in Metabolism of steroid hormones and vitamins A and D |
| 0.0 | 0.3 | REACTOME TIE2 SIGNALING | Genes involved in Tie2 Signaling |
| 0.0 | 0.4 | REACTOME EFFECTS OF PIP2 HYDROLYSIS | Genes involved in Effects of PIP2 hydrolysis |
| 0.0 | 0.2 | REACTOME HORMONE SENSITIVE LIPASE HSL MEDIATED TRIACYLGLYCEROL HYDROLYSIS | Genes involved in Hormone-sensitive lipase (HSL)-mediated triacylglycerol hydrolysis |